Zinc shapes the folding landscape of p53 and establishes a pathway for reactivating structurally diverse cancer mutants
- Department of Neurology, SUNY Upstate Medical University, Syracuse, United States
- Rutgers Cancer Institute of New Jersey, Department of Surgery, Rutgers Robert Wood Johnson Medical School, United States
- Department of Biochemistry and Molecular Biology, SUNY Upstate Medical University, United States
- Department of Surgery, University of Rochester School of Medicine and Dentistry and Wilmot Cancer Center, United States
Figures
Figure 1
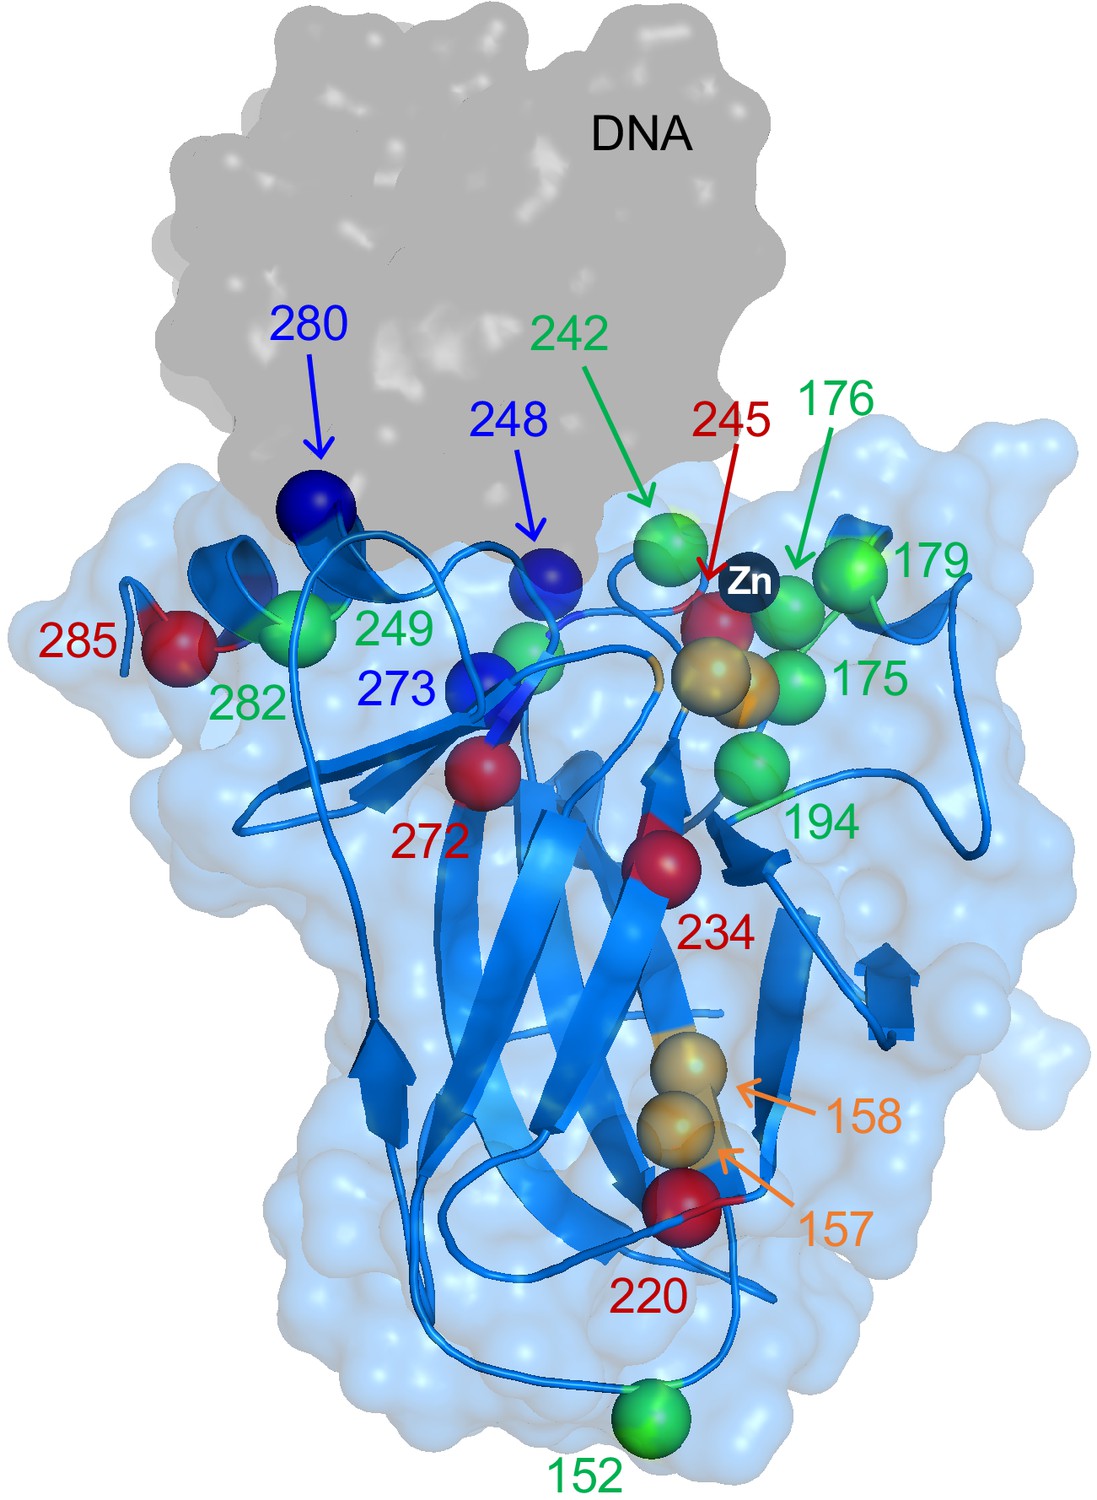
X-ray structure of WT DBD showing locations of mutations characterized in this study.
Alpha carbons of mutated residues are colored according to their classifications described in Results: zinc-binding class (green), stability class (red), DNA-binding class (blue), and mixed zinc-binding/stability class (orange). DNA and Zn2+ are the gray surface and black sphere, respectively. PDB 1TSR.
Figure 2 with 1 supplement
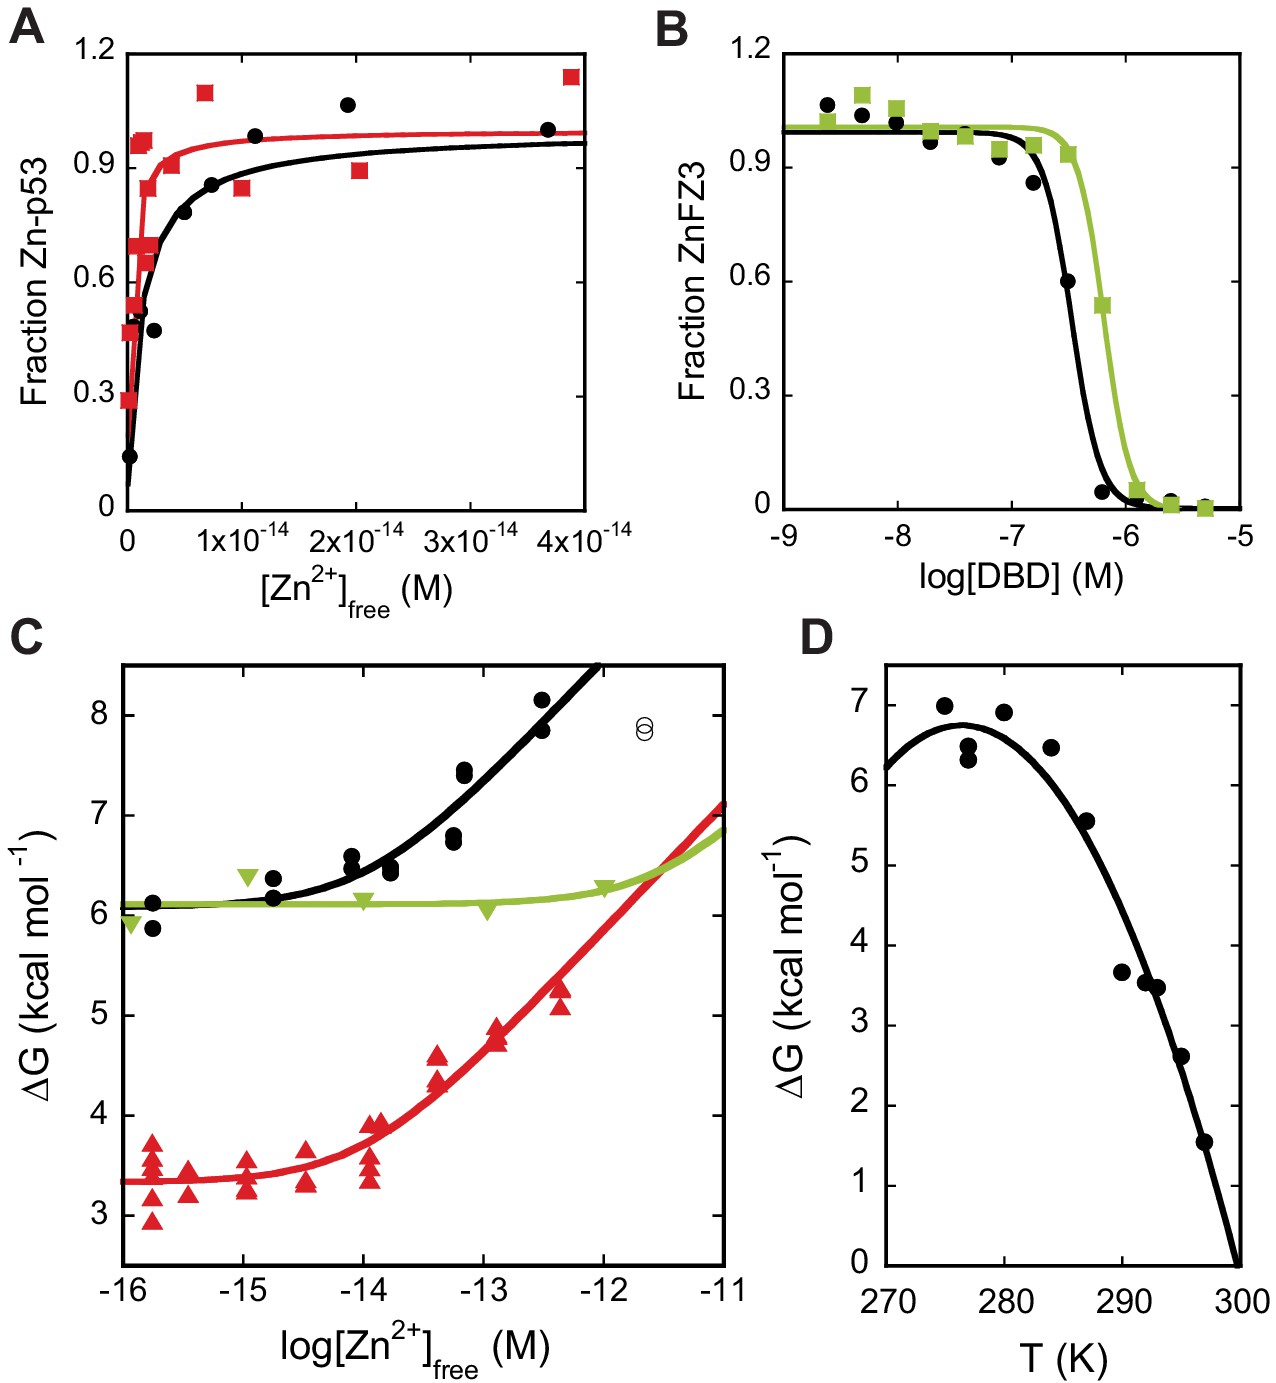
Zinc-binding affinity and stability of DBD.
(A) WT DBD (black) and full-length WT p53 (red) bind Zn2+ with KZn values of (1.6 ± 0.3) x 10−15 M and (0.4 ± 0.1) x 10−15 M, respectively, as determined by change in Tyr fluorescence (10°C, n = 3, SD). (B) Unfolded WT DBD (black) and unfolded C176S DBD (green), bind Zn2+ with KZn,U values of (42 ± 7) x 10−9 M and (50 ± 23) x 10−9 M, respectively, as determined by FluoZin-3 competition in 6 M urea (10°C, n = 3, SD). (C) Plotting folding free energy of DBD vs. [Zn2+]free (10°C) reveals that R175H (green) is a pure zinc-binding-class mutant whereas A138V (red) is a pure stability-class mutant. The point at which the lines deflect upwards are the approximate KZn values. WT DBD is in black. Open points denote outliers excluded from analysis. Outliers were identified on inspection and rejected if their exclusion (1) improved goodness of fit, and (2) produced a model for which they lay outside the 95% prediction interval. (D) Temperature dependence of apoDBD folding free energy fit to the Gibbs-Helmholtz equation (Figure 2—figure supplement 1C) yields ΔHm = 171 ± 20 kcal mol−1, Tm = 300 ± 1 K, and ΔCp = 7.0 ± 1.7 kcal mol−1 K−1 (fit value ± SE of fit). In (C and D), independent experimental data were pooled and fit once, and results are reported as the fit parameters and standard effort of the fit. Otherwise (A, B), replicates consisted of independent experiments performed with the same preparations of purified proteins, which were fit separately and the results pooled. Single curves are shown in the figure for illustration.
Figure 2—figure supplement 1
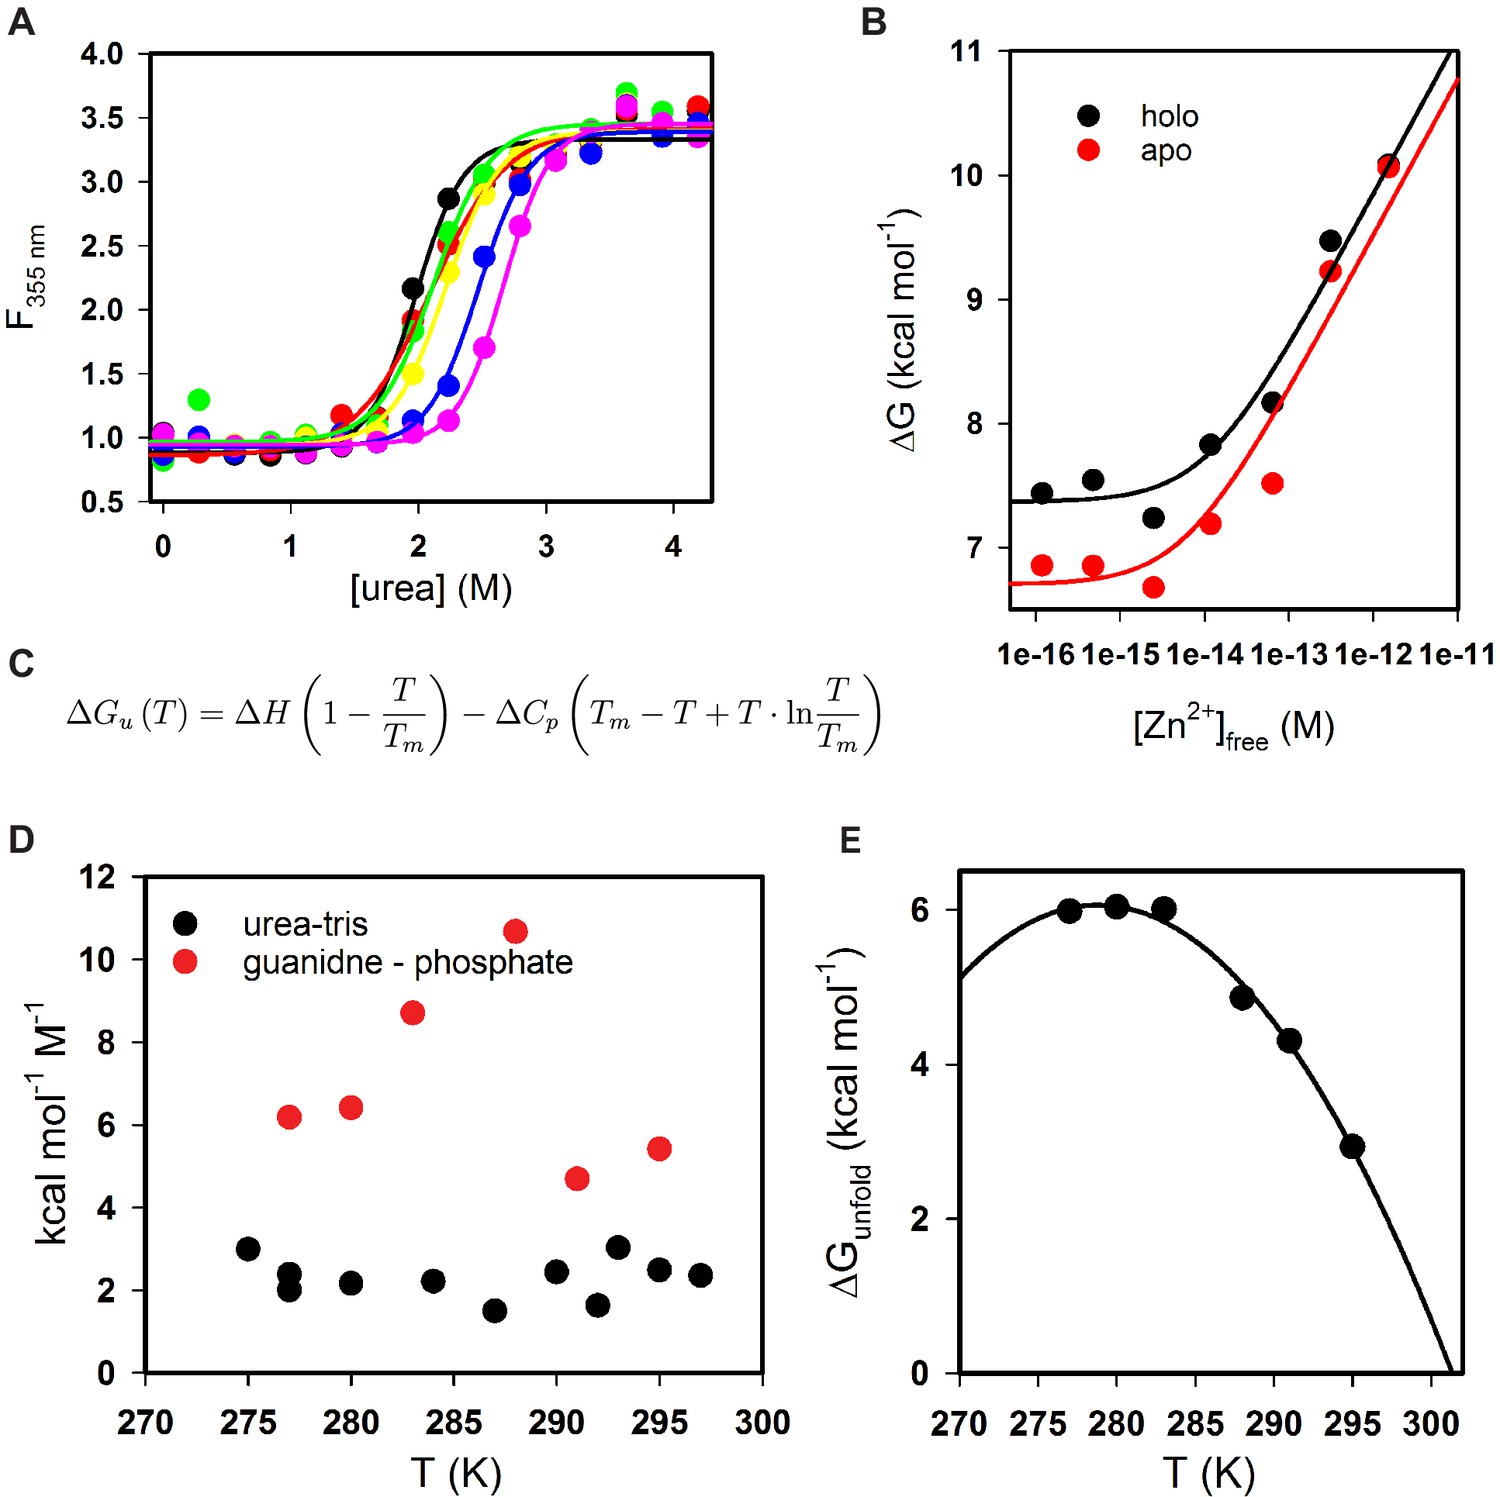
Physical analysis validation data.
(A) Urea melts of WT DBD as a function of buffered [Zn2+]free: 10−12 M (purple), 10−13 M (blue), 10−14M (yellow), 10−15 M (green), 10−16 M (red), 0 M (black). The m-values in kcal mol−1 M−1 of these fits are, in the same order: 3.1, 2.8, 2.6, 2.6, 1.9, and 3.0. (B) The relationship between ΔG and [Zn2+]free is similar whether or not DBD is holo or apo. (C) The Gibbs-Helmholtz equation relates the Gibbs free energy change of a process to the enthalpy change (ΔH), the temperature (T), and the change in heat capacity (ΔCp). (D) m-values for individual urea and guanidine melts as a function of temperature do not indicate two-state behavior. (E) Temperature dependence of apoDBD folding free energy, measured using guanidine denaturation and fit to the Gibbs-Helmholtz equation yields ΔHm = 160 ± 12 kcal mol−1, Tm = 301 ± 1 K, and ΔCp = 6.8 ± 1.1 kcal mol−1 K−1. For Gibbs-Helmholtz analysis, independent experimental data were pooled and fit once, and results are reported as the fit parameters and standard effort of the fit. Replicates otherwise consisted of independent experiments performed with the same preparations of purified proteins.
Figure 3 with 2 supplements
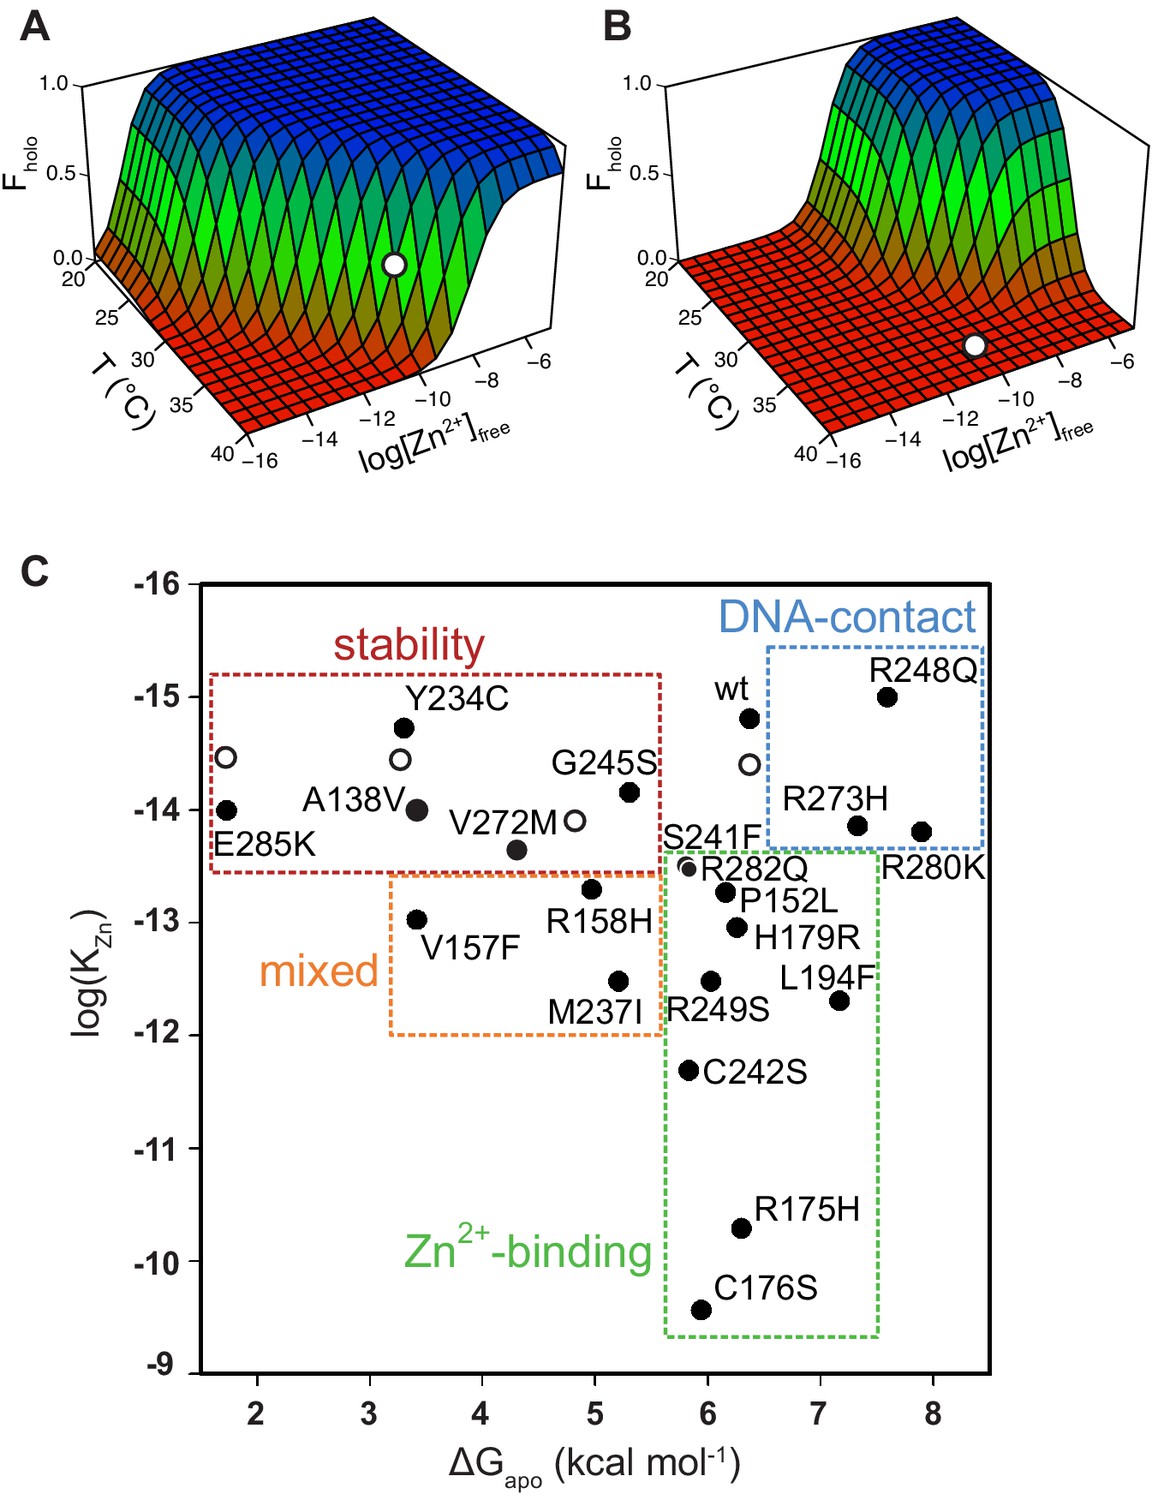
Energy landscape of DBD folding and classification of p53 mutants.
The populations of folded, active WT DBD (A) and R175H DBD (B) depend strongly on free zinc concentration and temperature. White circles indicate physiological T and [Zn2+]free. (C) 17 of the top 20 most common tumorigenic p53 mutations impair DBD thermodynamic stability (red box), zinc-binding affinity (green box), or both (orange box) (10°C). The remaining three are DNA-contact mutations (blue box). Open circles indicate WT DBD destabilized by urea.
-
Figure 3—source data 1
Stabilities and zinc-binding affinities of apoDBD variants (10°C).
ΔGapo and KZn were obtained from fits of the data in Figure 3—figure supplement 1 and Figure 3—figure supplement 2 to Equation 3 (errors are SE of the fits). KZn (direct) values were obtained from Tyr fluorescence spectra as in Figure 2A (errors are SD, n = 3). Asterisks denote that KZn could not be determined due to the presence of the extra Cys in the indicated Tyr-to-Cys mutants. Consequently, Y163C, Y205C, and Y220C are listed as stability-class mutants, but we cannot exclude the possibility that they belong to the mixed zinc-binding/stability class.
- https://cdn.elifesciences.org/articles/61487/elife-61487-fig3-data1-v2.docx
Figure 3—figure supplement 1
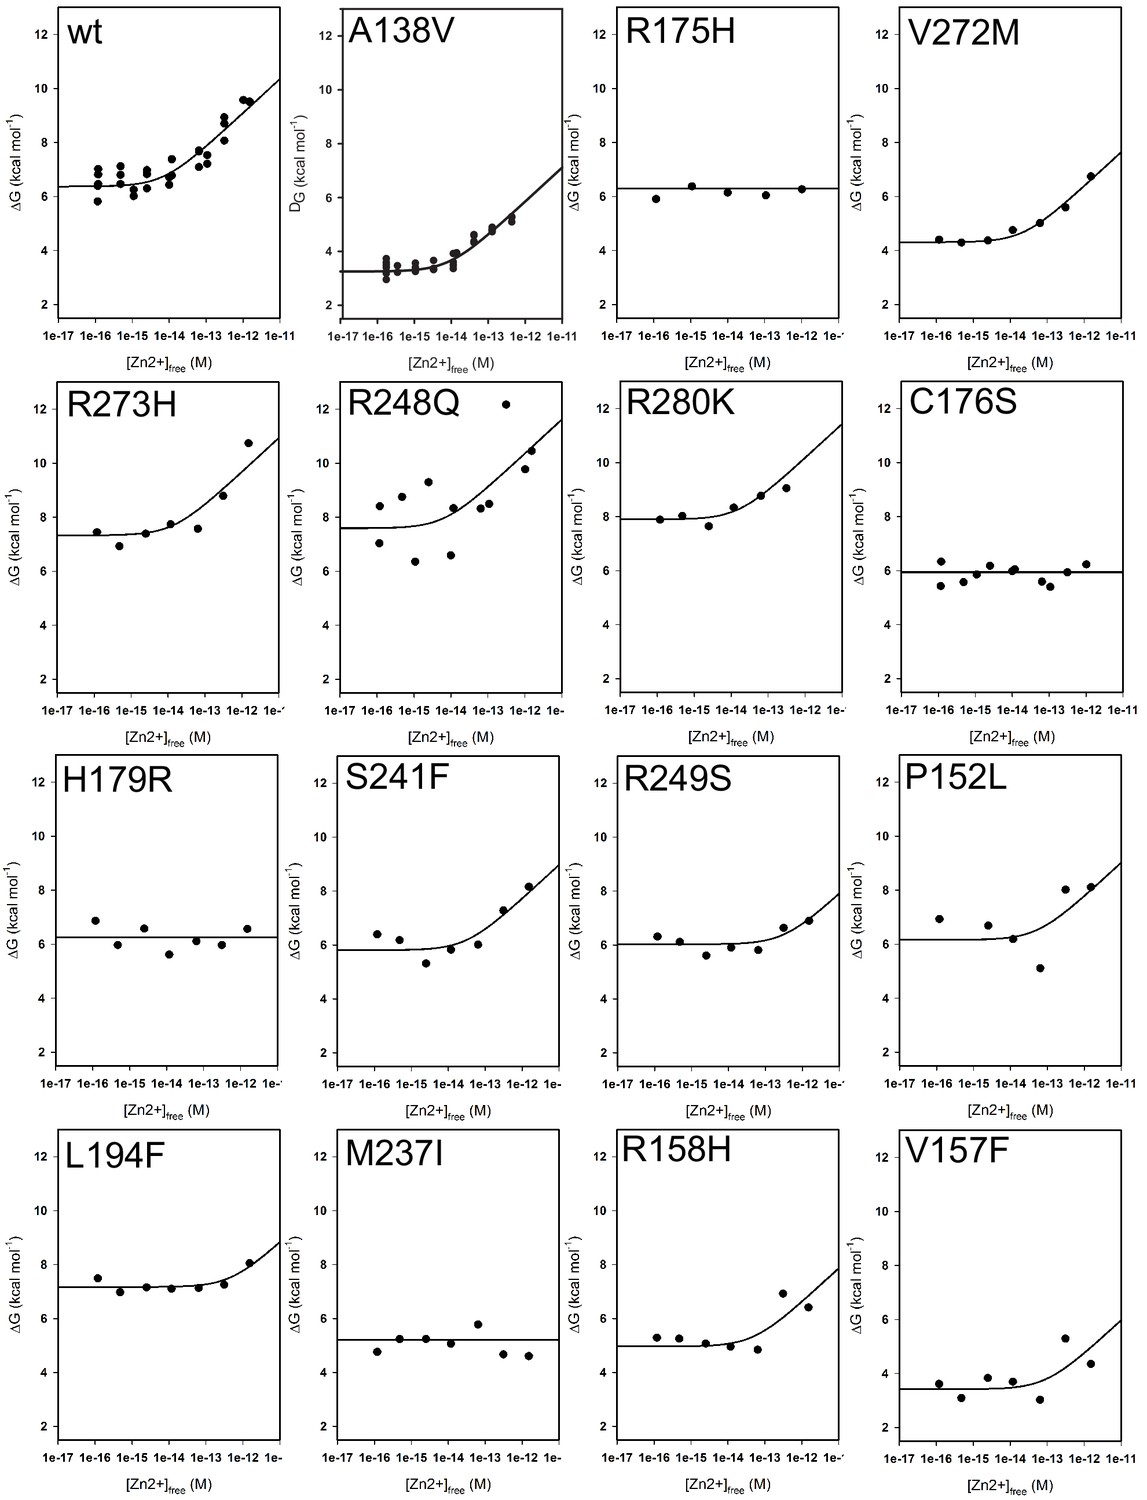
Free energy of folding versus buffered [Zn2+]free for p53 DBD mutants.
Folding energies were determined from guanidine melts of DBD mutants in EDTA-buffered [Zn2+]free, and were used to determine the zinc-free folding energies and zinc affinities presented in Figures 3C and 4. Independent experimental results were pooled and fit to Equation 3 to obtain ΔGapo and KZn, which are reported in Figure 3—source data 1 with the standard errors of the fit. No data points were rejected in any of the plots.
Figure 3—figure supplement 2
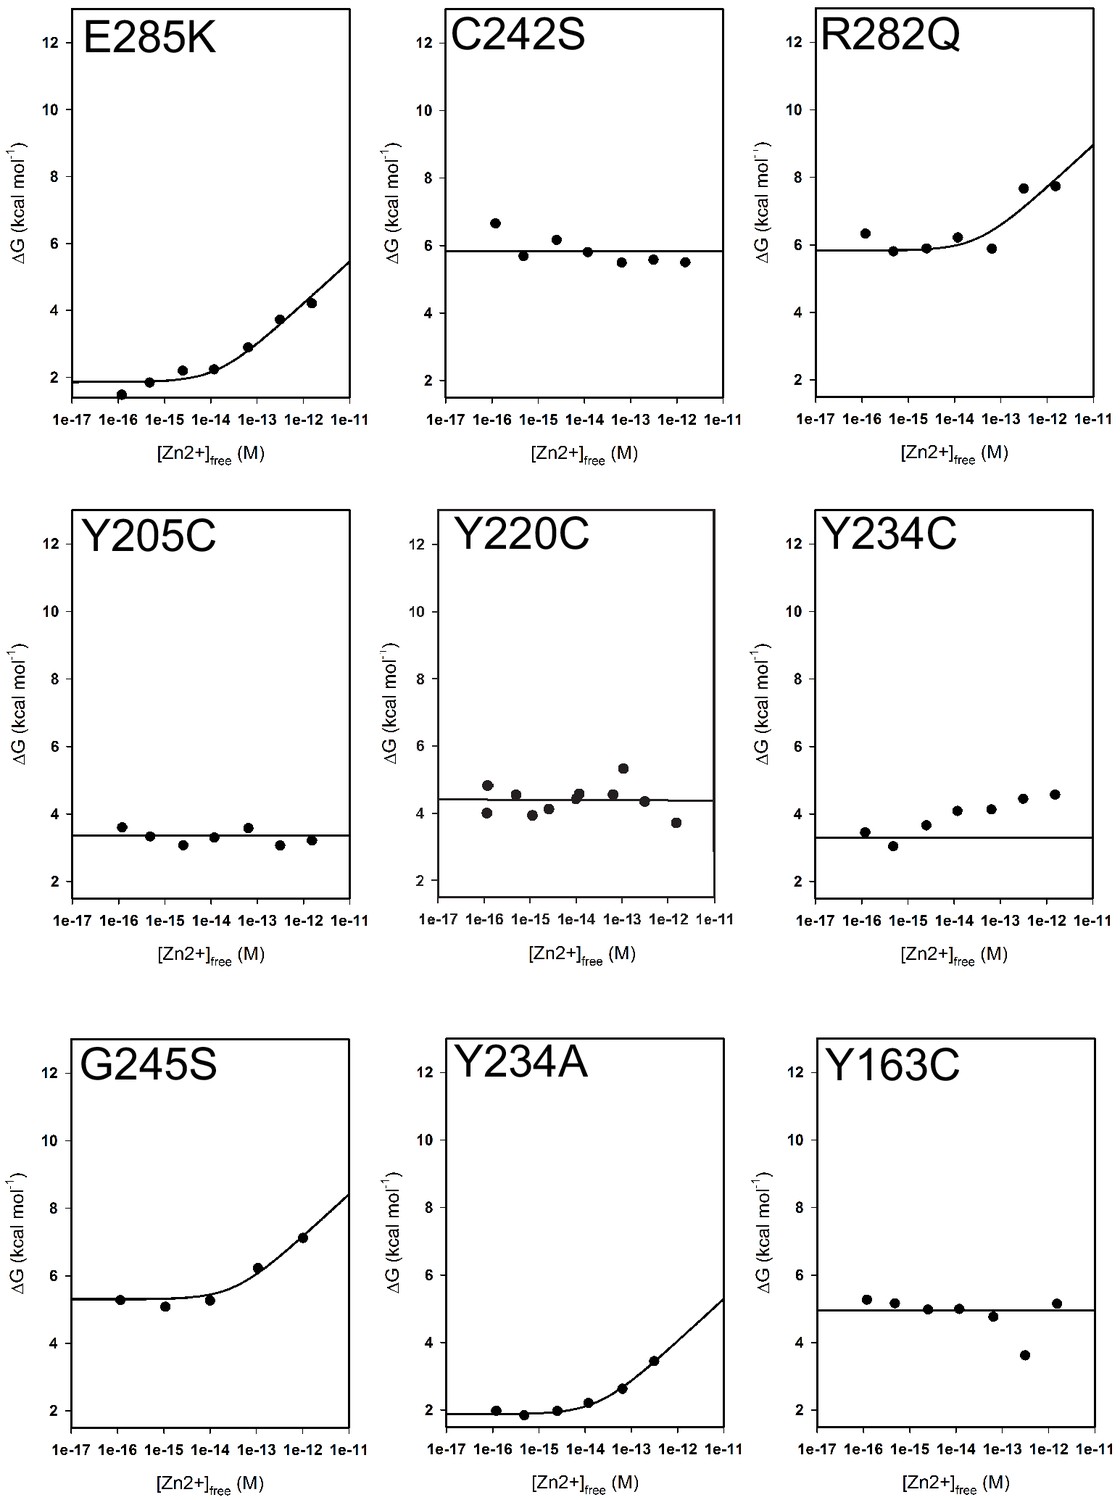
Free energy of folding versus buffered [Zn2+]free for p53 DBD mutants.
See legend to Figure 3—figure supplement 1 for details. No data points were rejected in any of the plots.
Figure 4 with 1 supplement
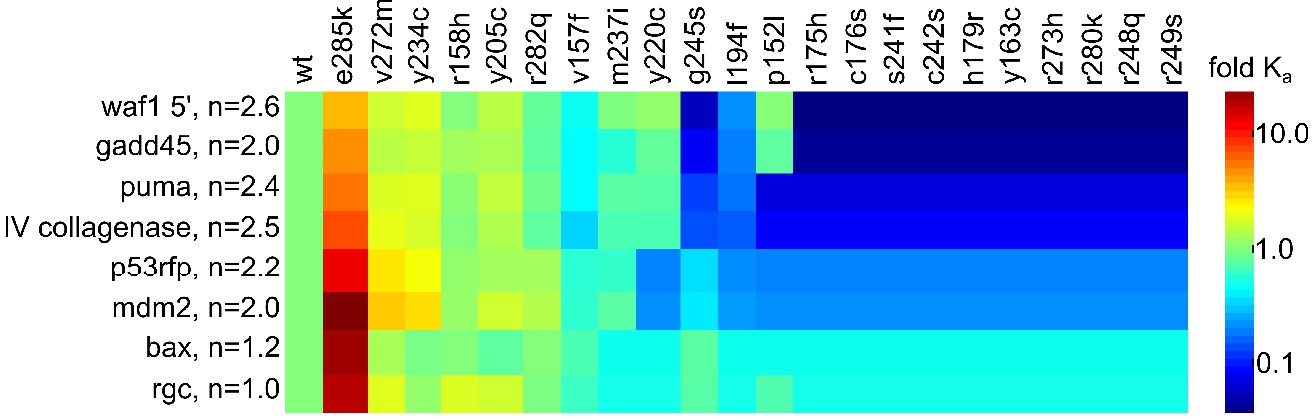
Heatmap of DNA-binding of p53 DBD mutants.
Affinity of mutant DBD for DNA oligonucleotides, expressed relative to WT DBD (4°C). Oligonucleotide names and Hill coefficients (n) are on the left. DNA sequences are in Supplementary file 1A.
-
Figure 4—source data 1
KDNA values used to generate the heatmap in Figure 4.
KDNA values are reported as mean ± SE in units of μM. Values are derived Hill fitting of fluorescence anisotropy binding curves. Each oligonucleotide was separately analyzed by global fitting across all mutants with floating KDNA and a linked Hill parameter, the value of which is indicated by the bracketed numbers in the top row. Replicates (indicated in the first column) consisted of independent experiments performed with the same preparations of purified proteins and oligonucleotides. Each replicate was fitted with its own KDNA, and the results were pooled.
- https://cdn.elifesciences.org/articles/61487/elife-61487-fig4-data1-v2.docx
Figure 4—figure supplement 1
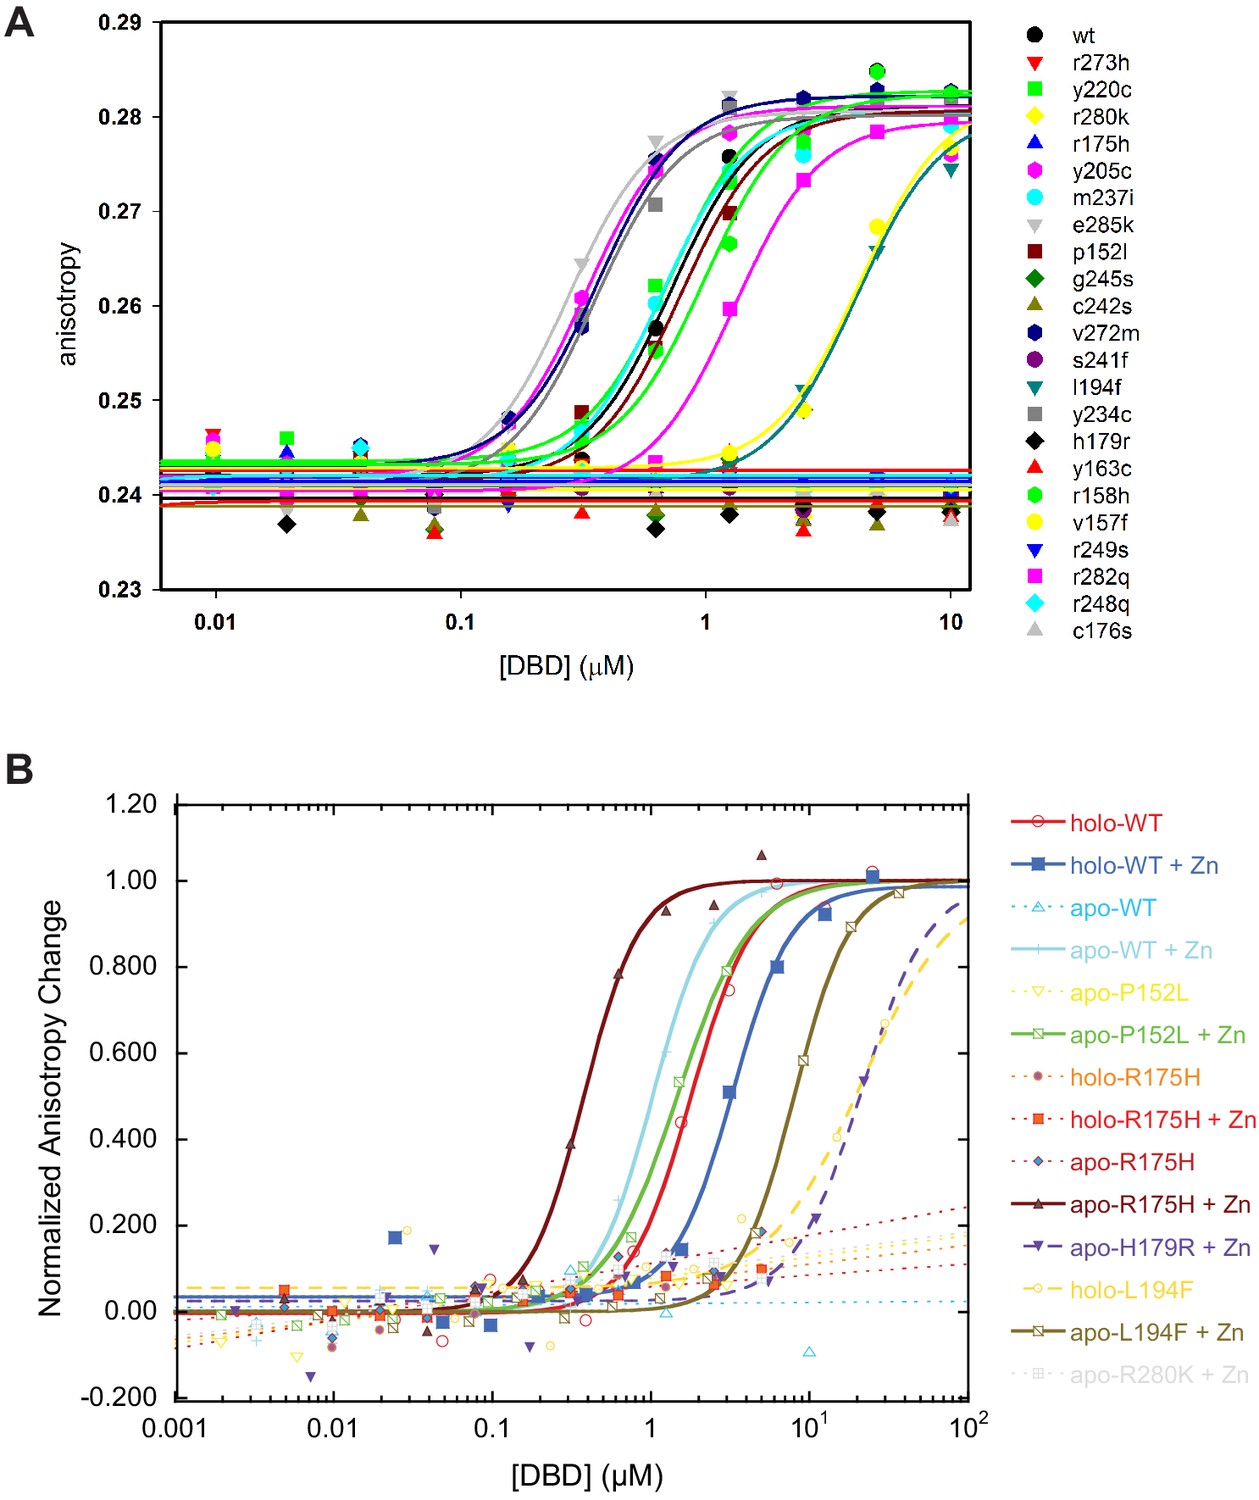
DNA-binding of p53 DBD mutants.
(A) Representative fits for DBD mutants binding Cy3-labeled p53RE oligonucleotides. (B) Representative curves illustrating restoration of DNA-binding (waf1) for DBD mutants by EGTA-buffered [Zn2+]free.
Figure 5
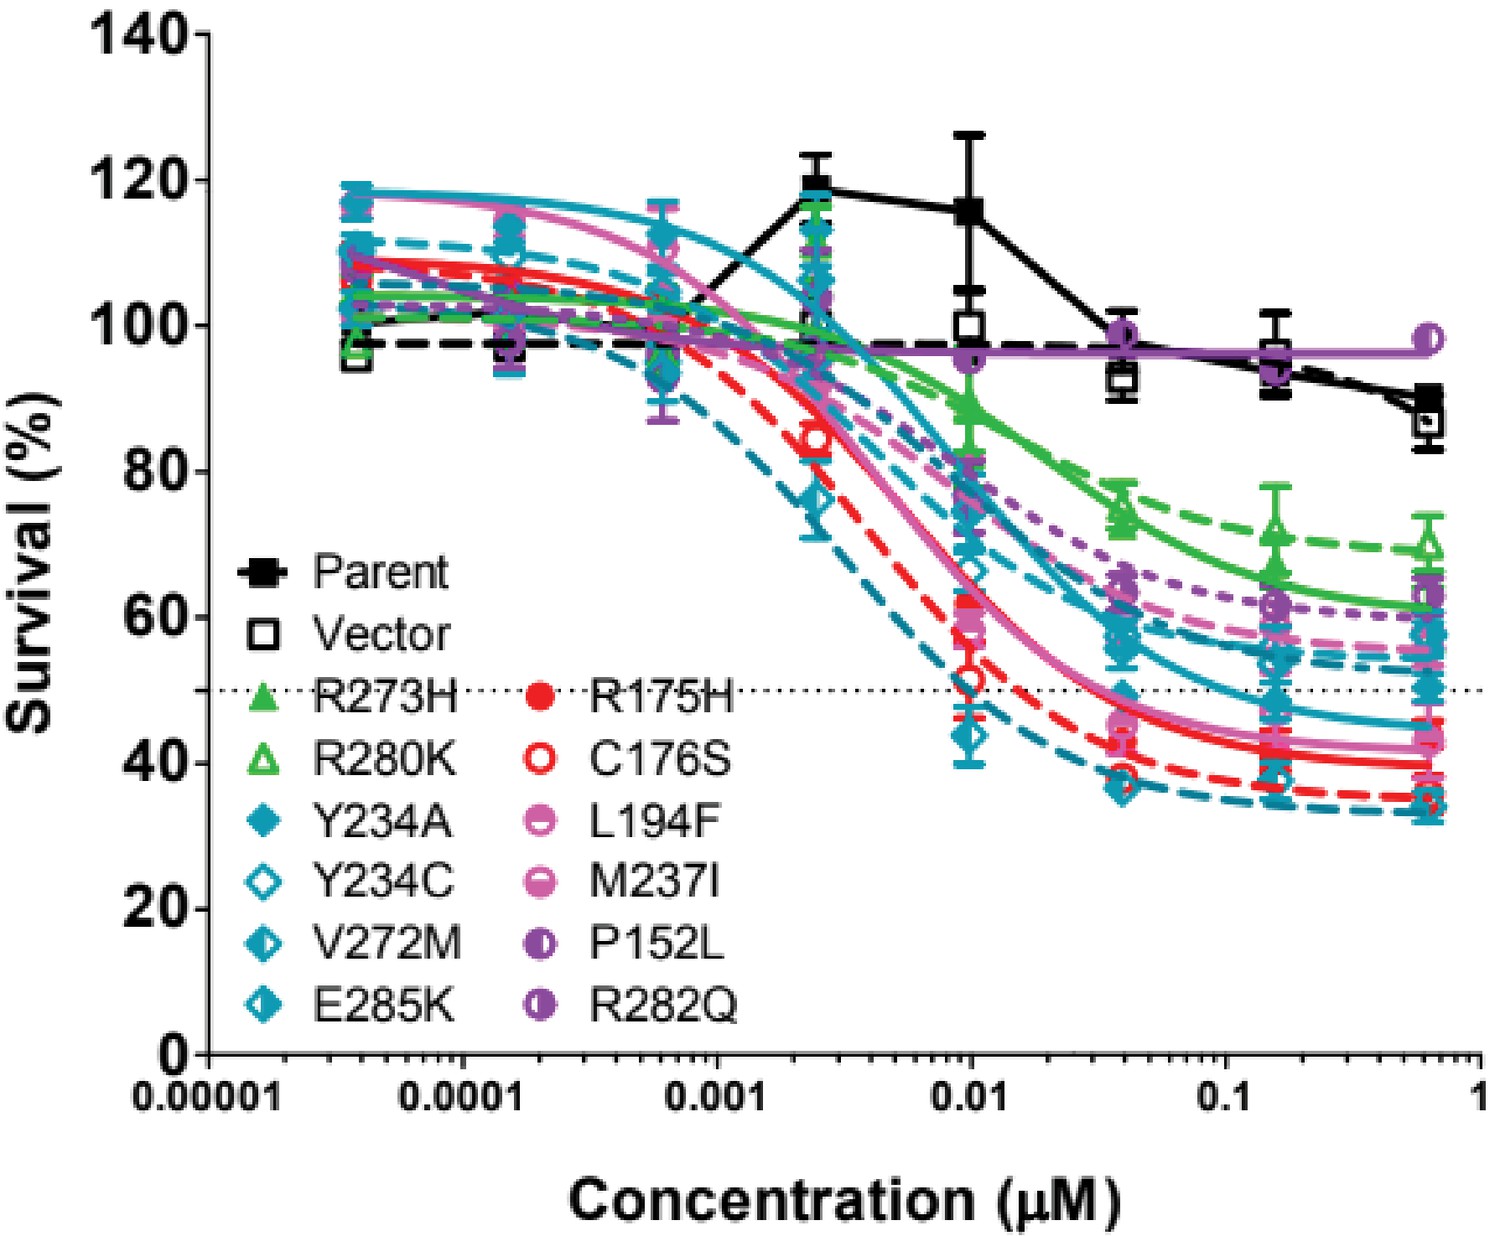
Cell growth inhibition of p53 mutants by ZMC1.
12 common p53 mutants were generated by site-directed mutagenesis and expressed in p53-null H1299 cells. Cells were treated with ZMC1 and the cell growth inhibition was measured by Calcein AM assay. EC50 values were calculated using nonlinear-fit curves by GraphPad Prism software.
Figure 6 with 2 supplements
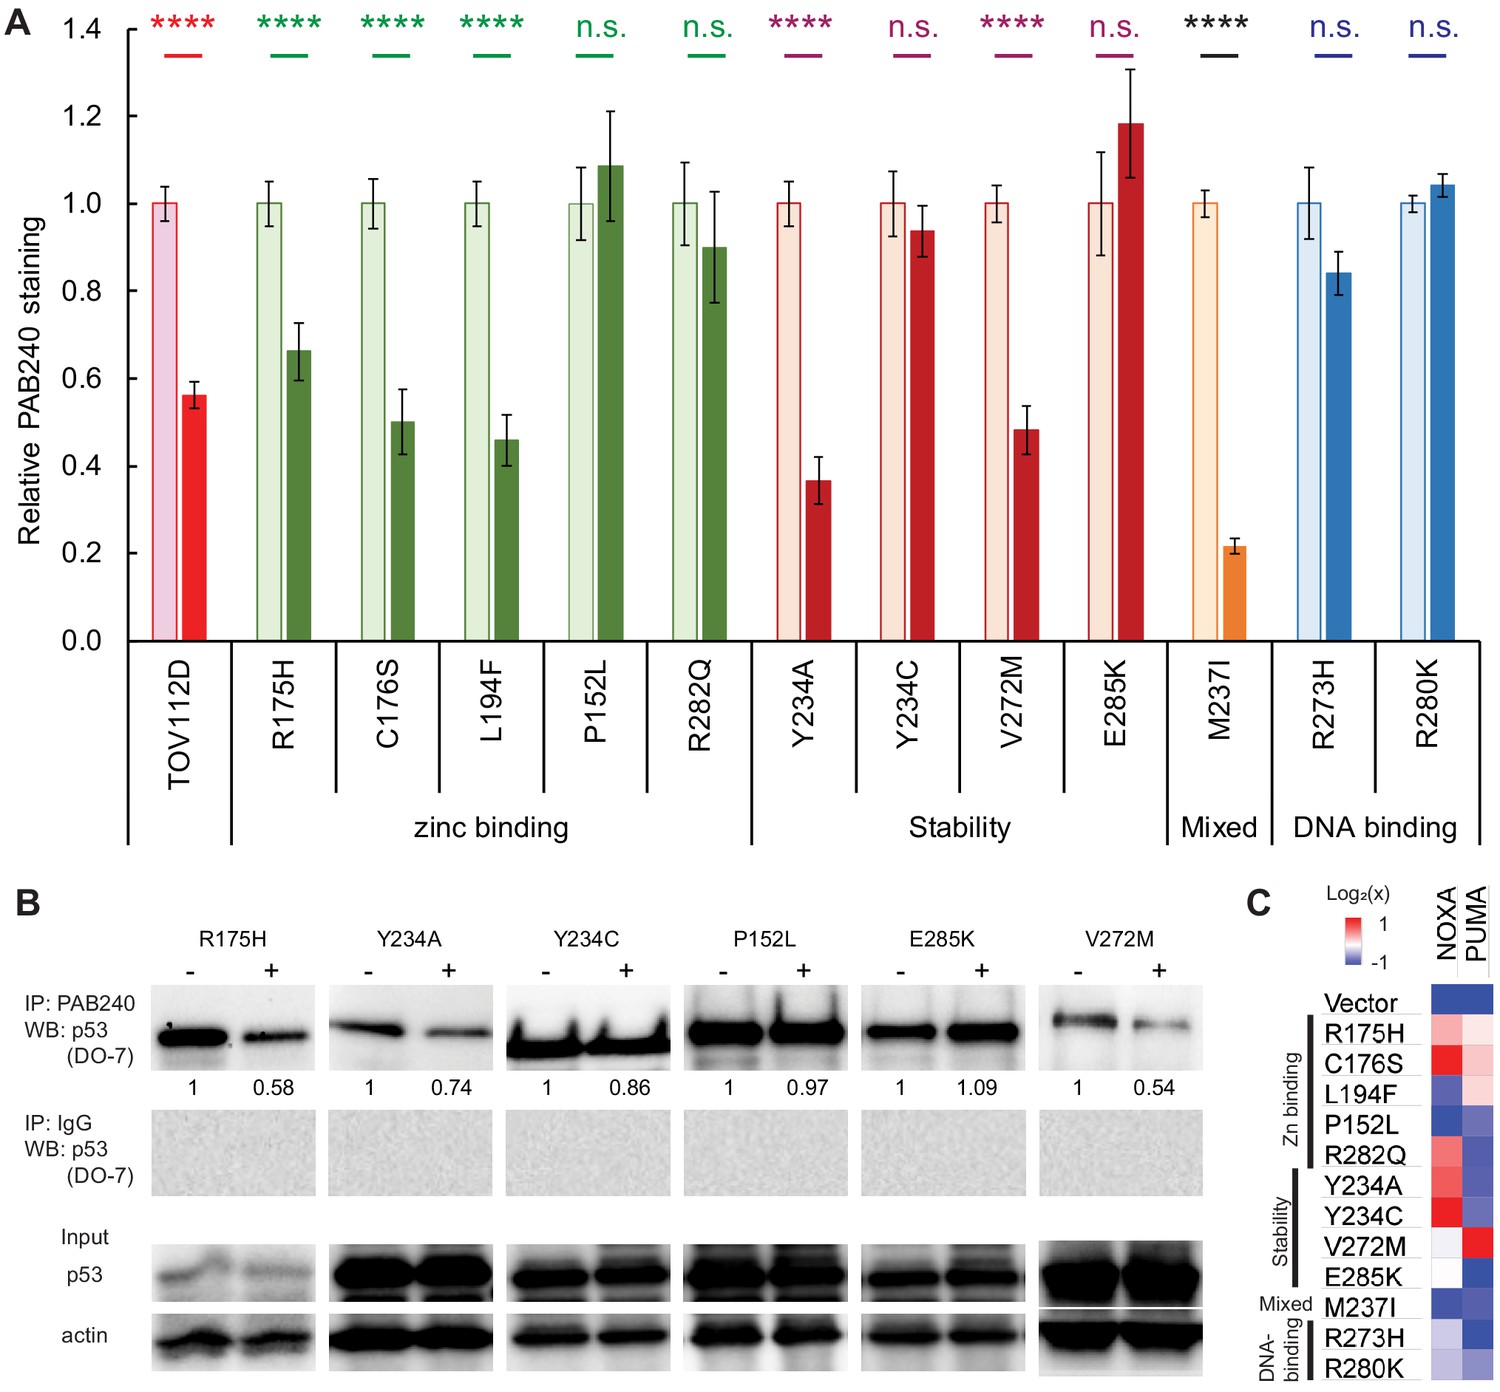
Response of p53 mutants to ZMC1 treatment in cells.
(A) ZMC1-induced folding of p53 mutants quantified by PAB240 immunofluorescence. H1299 cells were stably transfected with p53 mutants and treated with 1 μM ZMC1 (dark bars) or DMSO vehicle (light bars) for 4 hr. TOV112D (p53R175H) cancer cell line and parental cell line are positive and negative controls, respectively. ****, p<0.0001; n.s., not significant. Exact p-values are in Supplementary file 1C. Sample size: 2; replicates: two independent experiments; outliers/exclusions: no. (B) ZMC1-induced folding of p53 mutants quantified by PAB240 IP. Protein lysates were extracted from cells, immunoprecipitated with PAB240, and blotted with the pan-p53 antibody DO-7. Sample size: 1; replicates: two independent experiments; outliers/exclusions: no. (C) Activation of PUMA and NOXA expression by ZMC1 (1 μM, 24 hr) in stably transfected H1299 cells quantified by RT-PCR. Color shades indicate 2-fold differences relative to the vehicle-only controls. Sample size: 3; replicates: two independent experiments; outliers/exclusions: no.
Figure 6—figure supplement 1

Binding of p53M237I to CDKN1A promoter DNA.
Calu3 (p53M237I) cells were transfected with the p53RE from the CDKN1A promoter sequence (p21short) or a negative control (Basic). The cells were treated with ZMC1 for 48 hr, then assayed for luciferase activity. TOV112D (p53R175H) is used as a positive control. Sample size: 3; replicates: two independent experiments; outliers/exclusions: no.
Figure 6—figure supplement 2
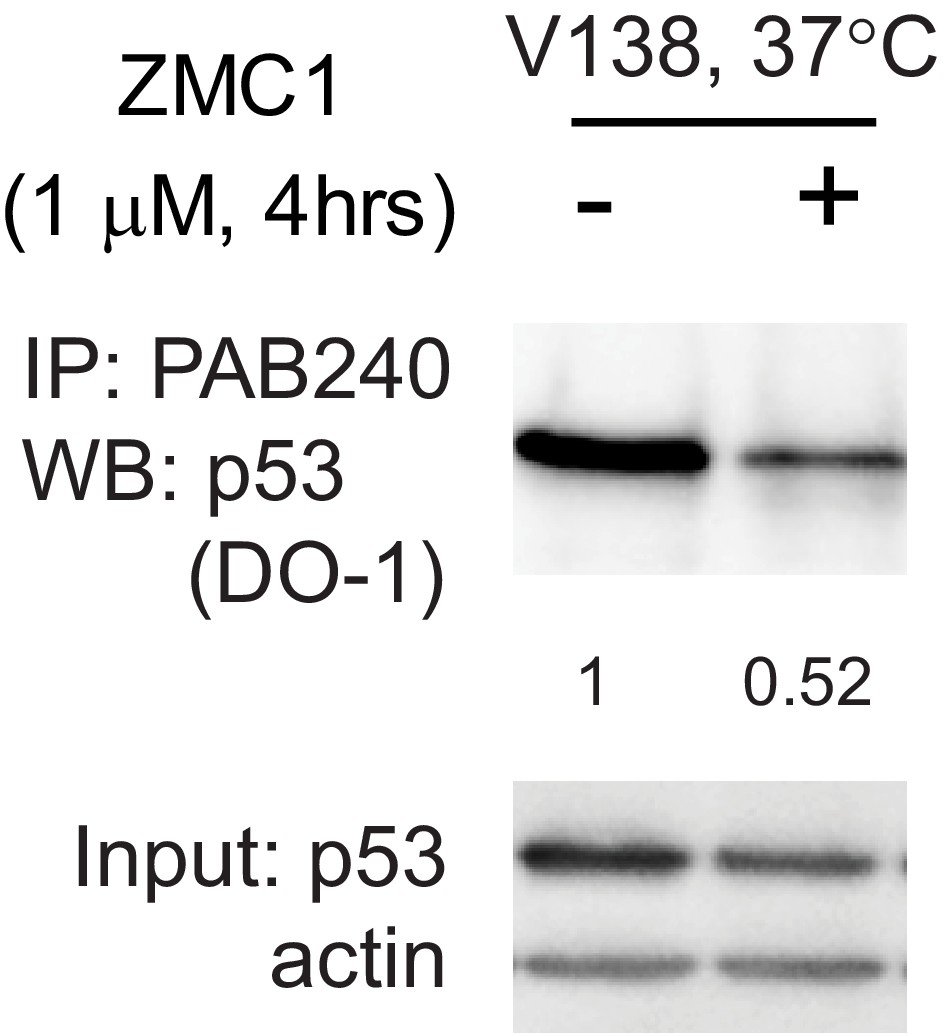
Folding of p53 protein in V138 cells at 37°C with ZMC1.
Cells were treated with 1 μM for 4 hr, and protein conformation was determined by IP of the unfolded protein. Sample size: 1; replicates: two independent experiments; outliers/exclusions: no.
Figure 7 with 1 supplement
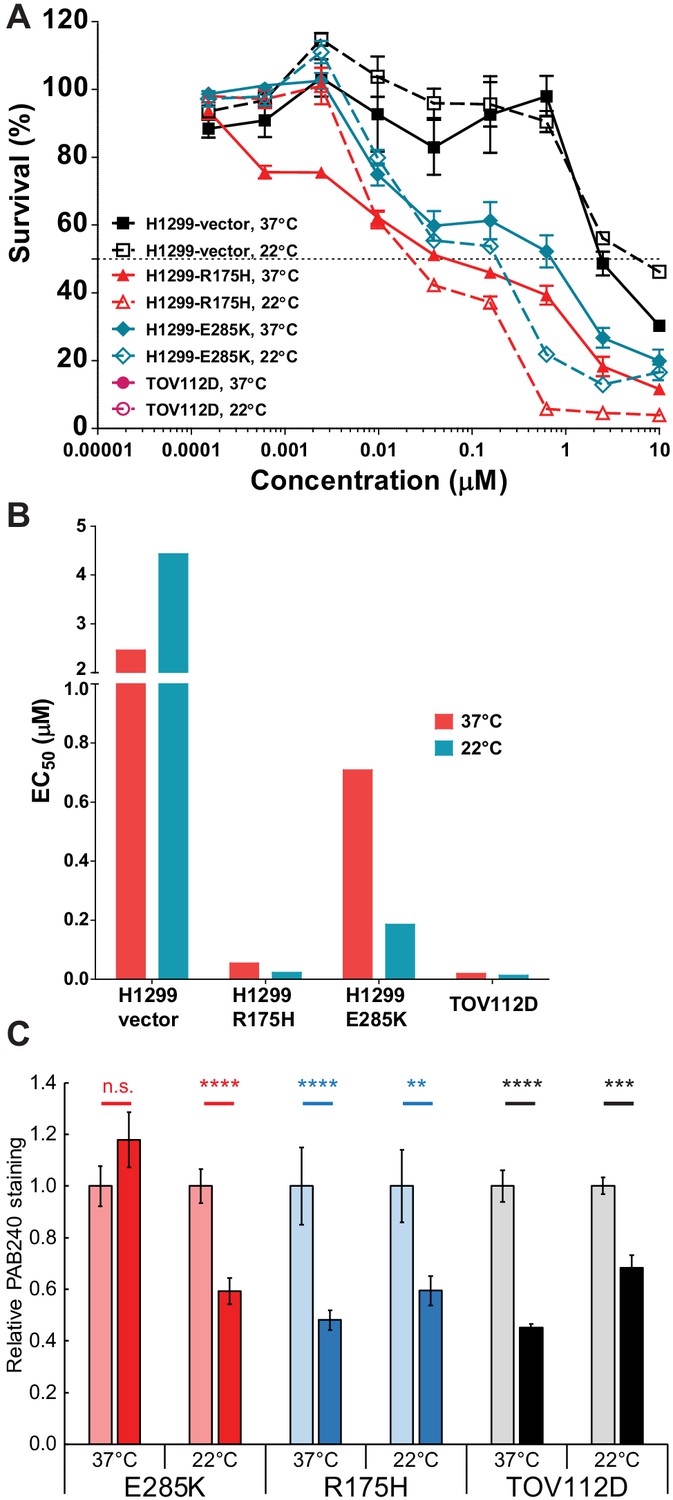
p53 folding landscape at lower temperature in cells.
(A) Decreasing T synergizes with ZMC1 to kill cells expressing mutant p53. Cells were treated with 1 μM ZMC1, incubated at 37°C or 22°C for 4 hr, incubated at 37°C for 72 hr, then assayed for viability by Calcein AM. Values are mean ± SE. Sample size: 3; replicates: 2–3 independent experiments; outliers/exclusions: no. (B) EC50 values from the curves in panel A. (C) Decreasing T synergizes with ZMC1 to refold mutant p53 in cancer cell lines. Experimental protocol is the same as in Figure 6A. **, p<0.01; ***, p<0.001; ****, p<0.0001; n.s., not significant. Exact p-values are in Supplementary file 1D. Sample size: 2; replicates: two independent experiments; outliers/exclusions: no.
Figure 7—figure supplement 1
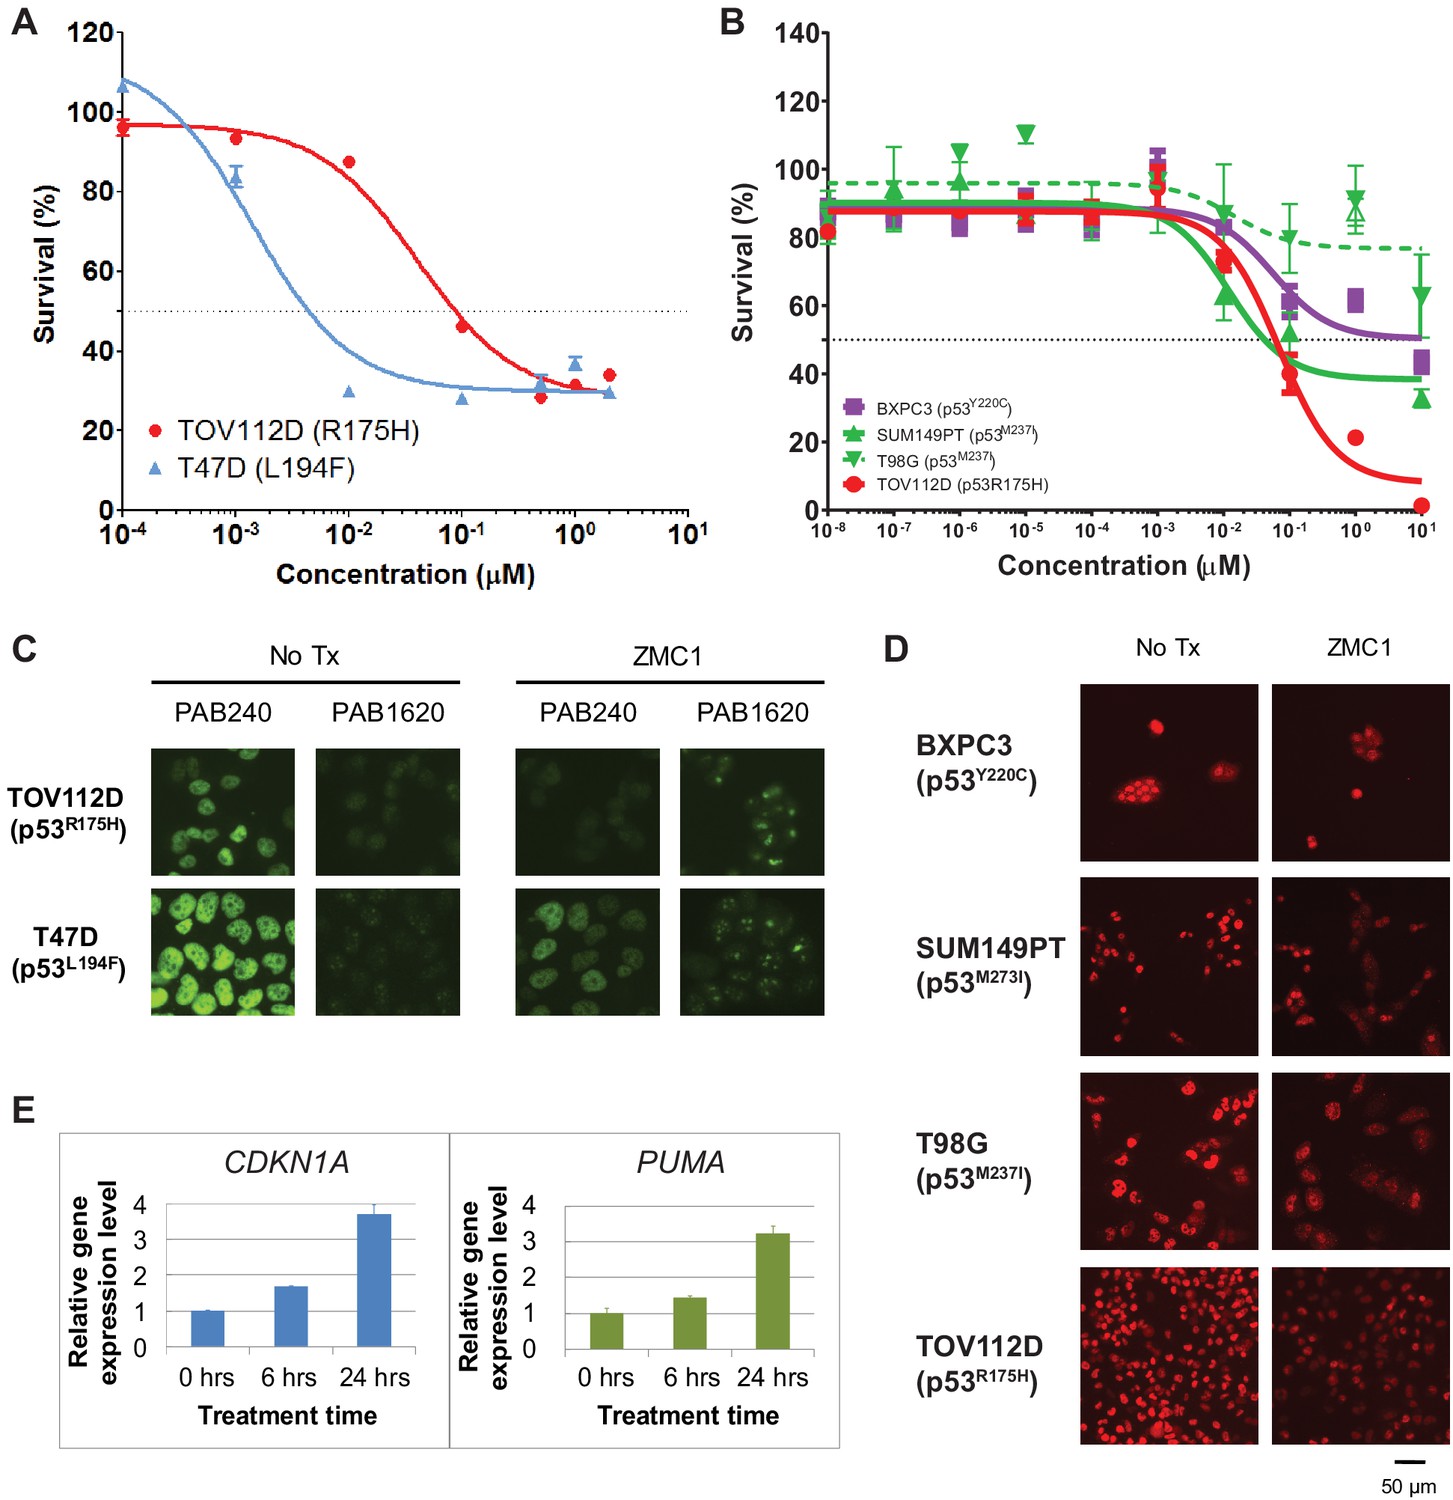
Response of p53 mutant cells to ZMC1.
(A) T47D (p53L194F) cells are sensitive to ZMC1 treatment in a cell viability assay. (B) BXPC3 (p53Y220C) and T98G (p53M237I) cells are not sensitive to ZMC1 in a cell viability assay, and SUM149PT (p53M237I) cells show a partial response in which viability remains at ~ 40% at 10 μM ZMC1. Sample size: 3; replicates: 2–3 independent experiments; outliers/exclusions: the open triangles in the SUM149PT data were excluded from the fit, as they were outside the 95% prediction interval and remained so when applying the Bonferroni correction for multiple tests. (C) The p53 mutant L194F was refolded after ZMC1 treatment. The cells were treated with 1 μM ZMC1 for 6 hr, followed by IF using p53 antibodies PAB240, which binds the unfolded conformation, and PAB1620, which binds the native conformation. Sample size: 2; replicates: two independent experiments; outliers/exclusions: no. (D) p53 mutant Y220C was not refolded by ZMC1, but M237I was (IF with PAB240). Sample size: 2; replicates: two independent experiments; outliers/exclusions: no. (E) The gene expression of the p53 target genes CDKN1A and PUMA was increased after ZMC1 treatment in cells expressing p53 L194F. Values are mean ± SE. Sample size: 3; replicates: two independent experiments; outliers/exclusions: no.
Figure 8
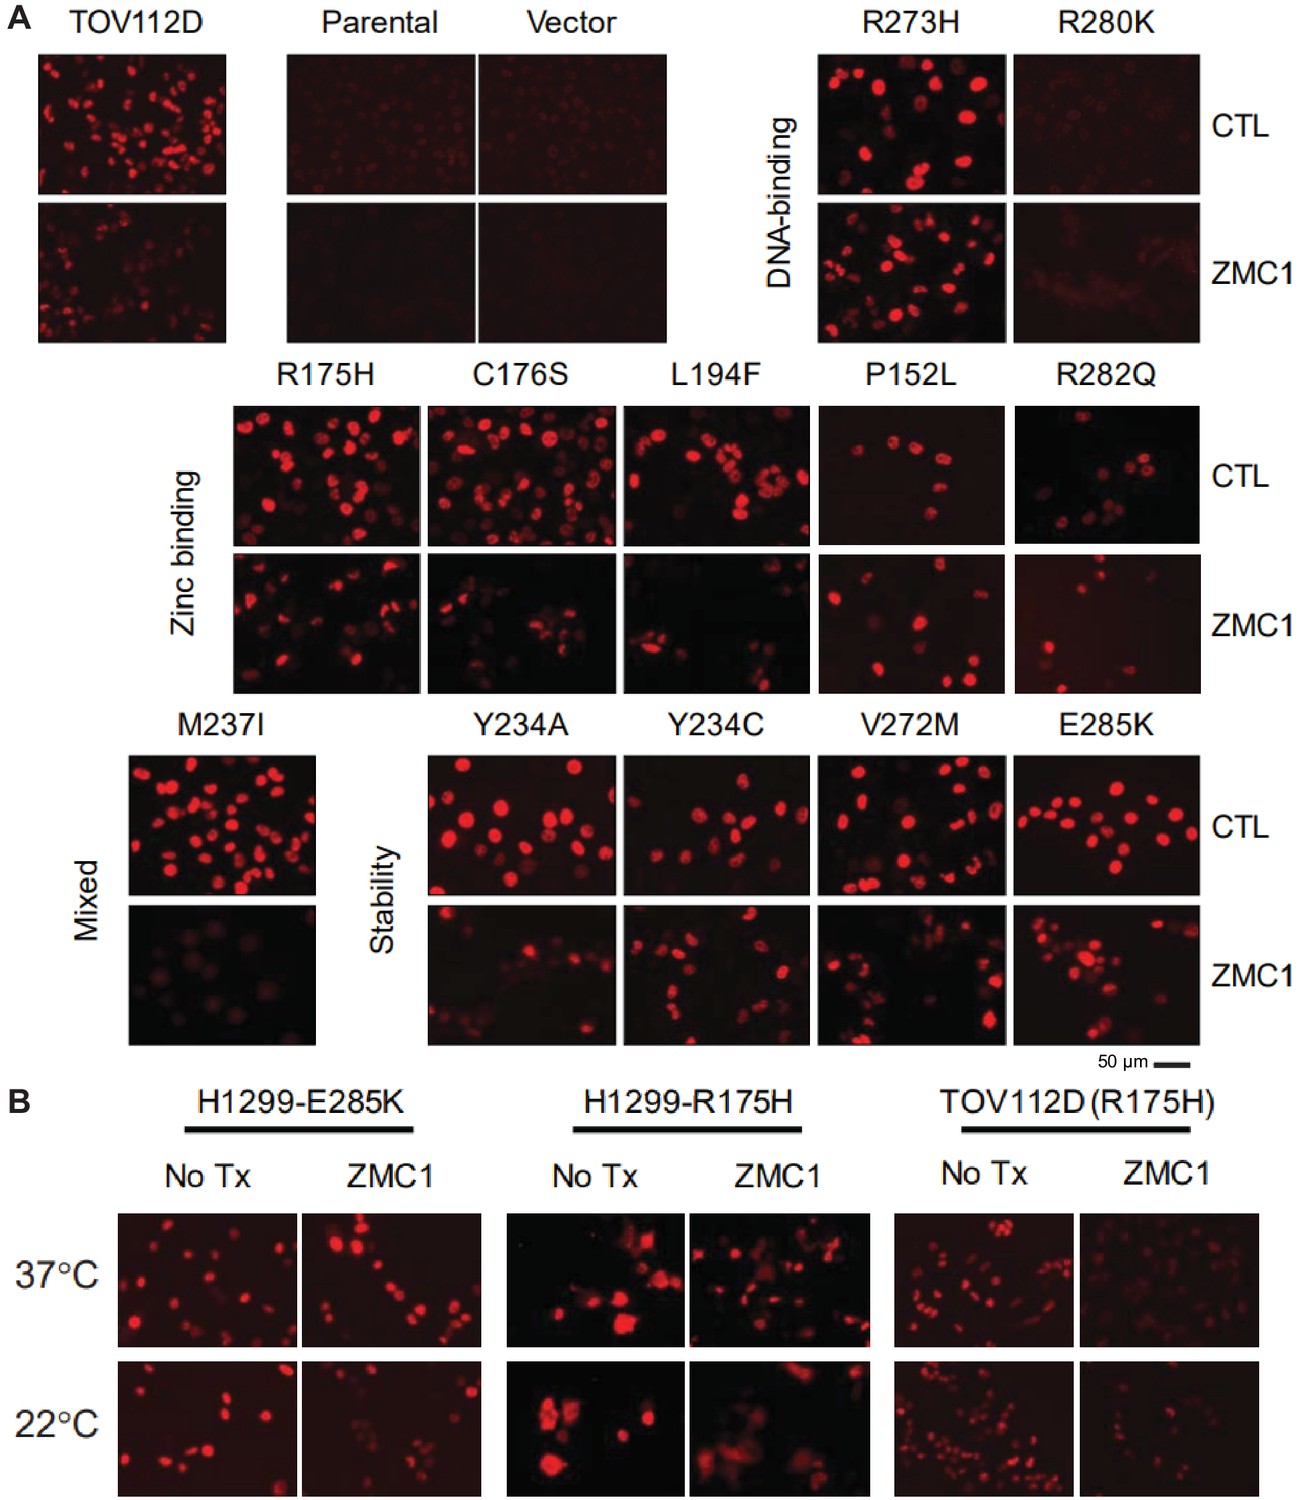
Refolding of p53 mutants after ZMC1 treatment.
(A) H1299 cells were stably transfected with 1 of 12 p53 mutants or an empty vector and treated with ZMC1 for 4 hr. p53 conformation was probed by IF using PAB240, which binds selectively to unfolded p53. TOV112D (p53 R175H) and the parental cell line were used as unfolded and native conformation controls respectively. (B) p53 refolding of R175H and E285K with ZMC1 and different incubation temperatures. Sample size: 2; replicates: two independent experiments; outliers/exclusions: no.
Figure 9 with 1 supplement

In vivo efficacy of ZMC1 in stability-class mutants V272M (A) and E285K (B).
Mice bearing human xenograft tumors were treated with ZMC1 (5 mg/pk daily, IP) or DMSO vehicle. See Methods for treatment and allocation details. Treatment and control groups were n = 14 and n = 12, respectively, for both V272M and E285K xenografts. All sites exhibited tumor growth and none were excluded from analysis.
Figure 9—figure supplement 1
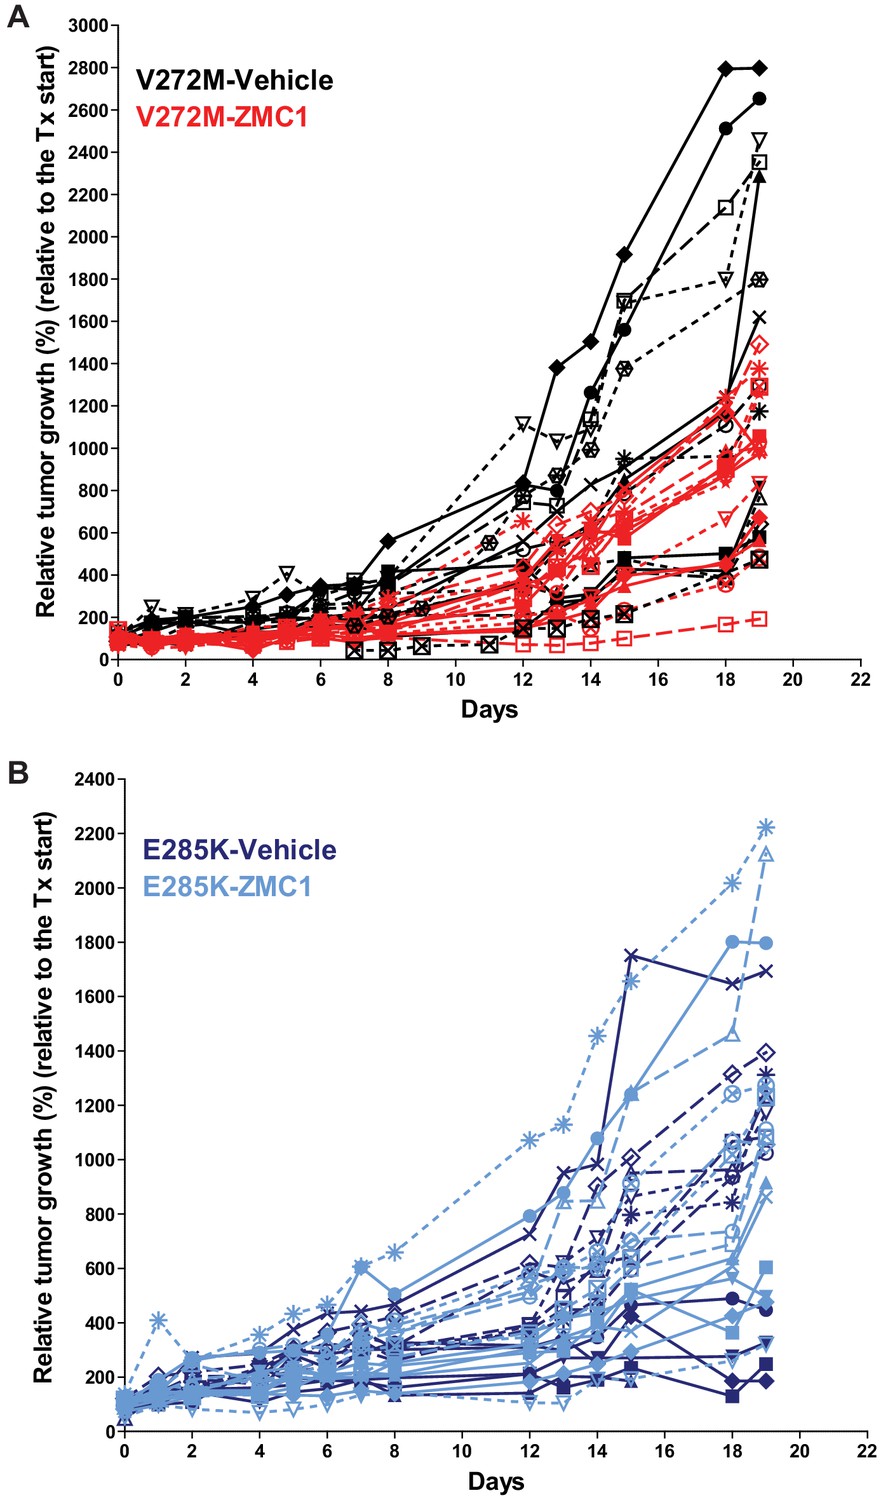
Individual tumor growth curves for the processed data presented in Figure 5.
Tumor growth shows the in vivo efficacy of ZMC1 in stability-class mutant V272M (A) but not in E285K (B).
Figure 10
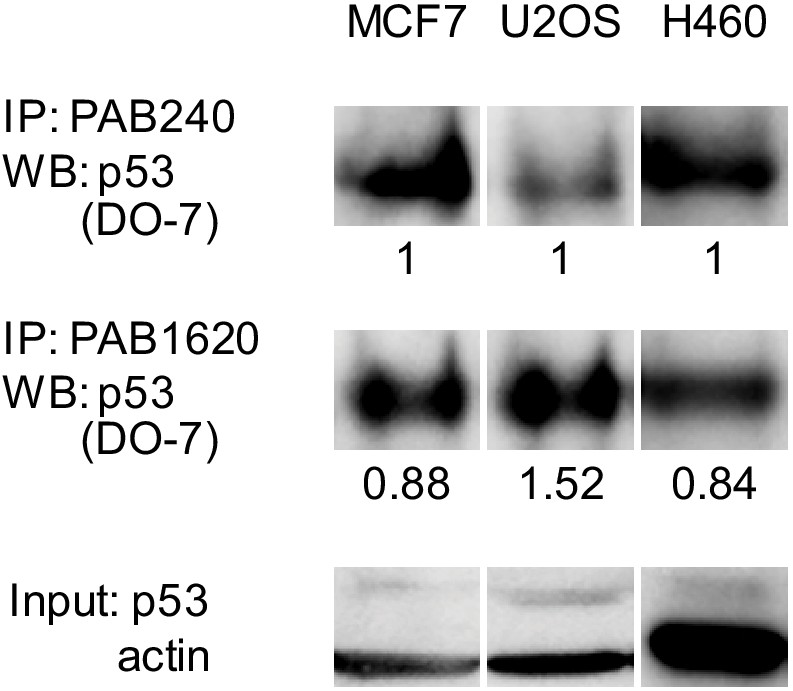
A significant fraction of WT p53 is unfolded in cells.
WT p53 cell lines MCF7, U2OS, and H460 were lysed and immunoprecipitated using PAB240 or PAB1620 antibodies. Sample size: 1; replicates: two independent experiments; outliers/exclusions: no.
Tables
Table 1
ZMC1-mediated toxicity and p53 refolding in H1299 cells expressing p53 mutants.
EC50 data and fits are shown in Figure 5 and antibody-monitored refolding data are shown in Figure 6A and Figure 7. aYes, PAB240 staining level was reduced significantly (Fig. after ZMC1 treatment; No, PAB240) staining level was not significantly changed after ZMC1 treatment. Sample size: 3; replicates: 2–3 independent experiments; outliers/exclusions: no.
| Mutant | EC50 (nM) | p53 refoldinga |
|---|---|---|
| Untransfected cells | >1000 | Not applicable |
| Empty vector | >1000 | Not applicable |
| Zinc-binding class | ||
| R175H | 5 | Yes |
| C176S | 2 | Yes |
| L194F | 5 | Yes |
| P152L | >1000 | No |
| R282Q | >1000 | No |
| Stability class | ||
| Y234A | 10 | Yes |
| Y234C | >1000 | No |
| V272M | 2 | Yes |
| E285K | >1000 | No |
| Mixed zinc-binding/stability class | ||
| M237I | >1000 | Yes |
| DNA-binding class | ||
| R273H | >1000 | Yes |
| R280K | >1000 | No |
Key resources table
| Reagent type (species) or resource | Designation | Source or reference | Identifiers | Additional information |
|---|---|---|---|---|
| Antibody | Anti-p53 PAB240 (mouse monoclonal) | EMD Chemicals | OP29 | 1:400 for IF, 2 μg for IP |
| Antibody | Anti-p53 PAB1620 (mouse monoclonal) | EMD Chemicals | OP33 | 1:50 for IF, 2 μg for IP |
| Antibody | Goat anti-mouse (goat polyclonal, HRP conjugate) | Santa Cruz Biotechnology | sc-2005 | 1:3000 for western blot |
| Antibody | Anti-p53 (DO-1) (mouse monoclonal) | Santa Cruz Biotechnology | sc-126 | 1:1000 for western blot |
| Antibody | Anti-p53 (DO-7) (mouse monoclonal) | Santa Cruz Biotechnology | sc-47698 | 1:1000 for western blot |
| Antibody | Anti-beta-actin (AC-15) (mouse monoclonal) | Santa Cruz Biotechnology | sc-69879 | 1:2000 for western blot |
| Commercial assay or kit | Q5 Site-Directed Mutagenesis Kit | NEB | E0554S | Site-directed mutagenesis |
| Sequence-based reagent | TaqMan assay human p21 | ThermoFisher | Hs00355782_m1 | |
| Sequence-based reagent | TaqMan assay human PUMA | ThermoFisher | Hs00248075_m1 | |
| Sequence-based reagent | TaqMan assay human NOXA | ThermoFisher | Hs00560402_m1 | |
| Sequence-based reagent | TaqMan assay human beta-actin | ThermoFisher | Hs99999903_m1 | |
| Chemical compound, drug | ZMC1 | Synthesized in this work | ||
| Genetic reagent (M. musculus) | Female CR ATH HO (order when 6–8 weeks old) | Charles River Laboratories |
Additional files
-
Supplementary file 1
Tables of DNA oligonucleotide sequences and exact p-values for p53 refolding in cells.
(A) Table of DNA sequences used in p53-p53RE binding experiments. (B) Table of oligonucleotides used to generate p53 mutants by site-directed mutagenesis. (C) Table of exact Student’s t-test p-values for p53 refolding in cells, measured by immunofluorescence (Figure 6A). (D) Table of exact Student’s t-test p-values for p53 refolding in cells, measured by immunofluorescence (Figure 7C)
- https://cdn.elifesciences.org/articles/61487/elife-61487-supp1-v2.docx
-
Supplementary file 2
Mycoplasma testing and results.
- https://cdn.elifesciences.org/articles/61487/elife-61487-supp2-v2.docx
-
Transparent reporting form
- https://cdn.elifesciences.org/articles/61487/elife-61487-transrepform-v2.pdf
Download links
A two-part list of links to download the article, or parts of the article, in various formats.
Downloads (link to download the article as PDF)
Open citations (links to open the citations from this article in various online reference manager services)
Cite this article (links to download the citations from this article in formats compatible with various reference manager tools)
Zinc shapes the folding landscape of p53 and establishes a pathway for reactivating structurally diverse cancer mutants
eLife 9:e61487.
https://doi.org/10.7554/eLife.61487


