Kinetic sculpting of the seven stripes of the Drosophila even-skipped gene
- Department of Molecular & Cell Biology, University of California at Berkeley, United States
- Biophysics Graduate Group, University of California at Berkeley, United States
- Department of Physics, University of California at Berkeley, United States
- Institute for Quantitative Biosciences-QB3, University of California at Berkeley, United States
- Department of Integrative Biology, University of California at Berkeley, United States
- Howard Hughes Medical Institute, University of California at Berkeley, United States
Figures
Figure 1
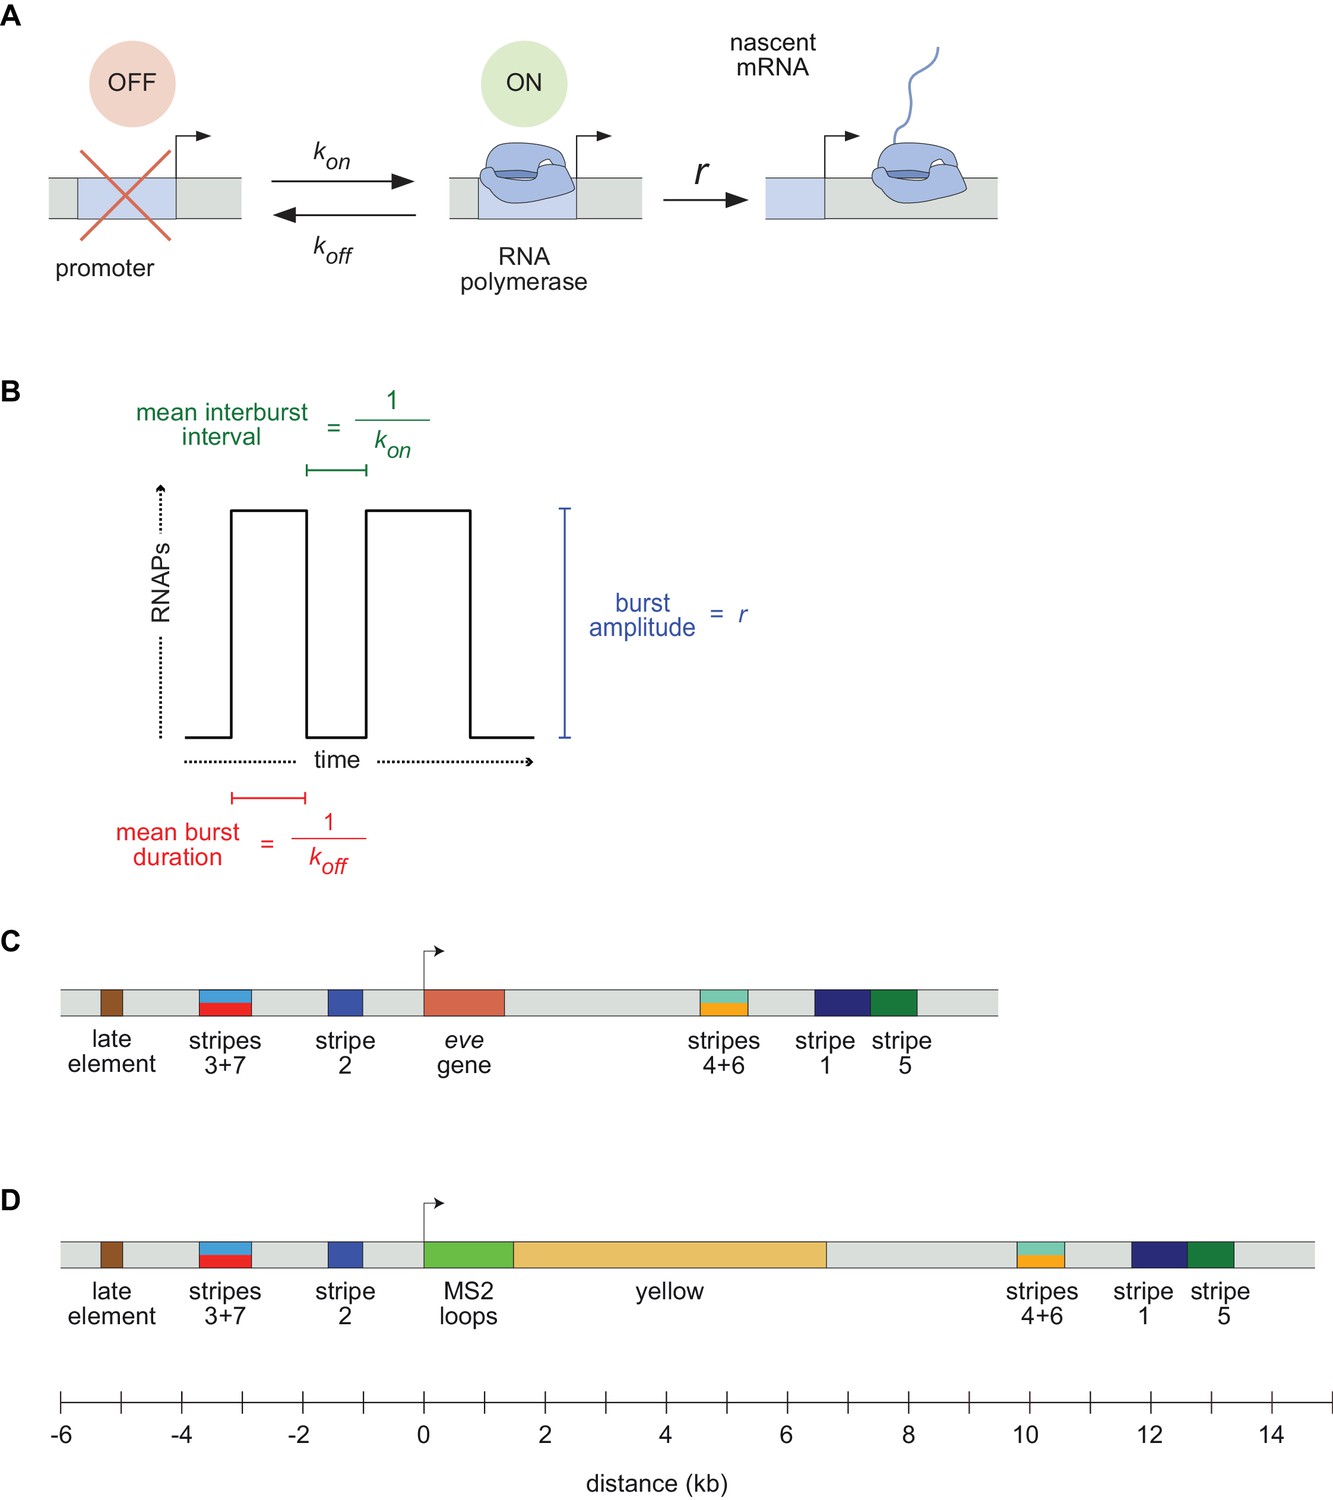
Visualizing live transcription from the seven stripes of D. melanogaster even-skipped.
(A) Simple model of transcriptional bursting by promoter switching between ON and OFF states. (B) The promoter switching parameters define the burst duration, the duration between bursts, and amplitude. (C) Wild-type eve locus showing the five stripe enhancers (1, 2, 3+7, 4+6, 5) and the late enhancer element. Colors for individual stripes are used throughout figures. (D) Layout of the engineered eve BAC showing the locations of the MS2 stem loop array and yellow gene.
Figure 2
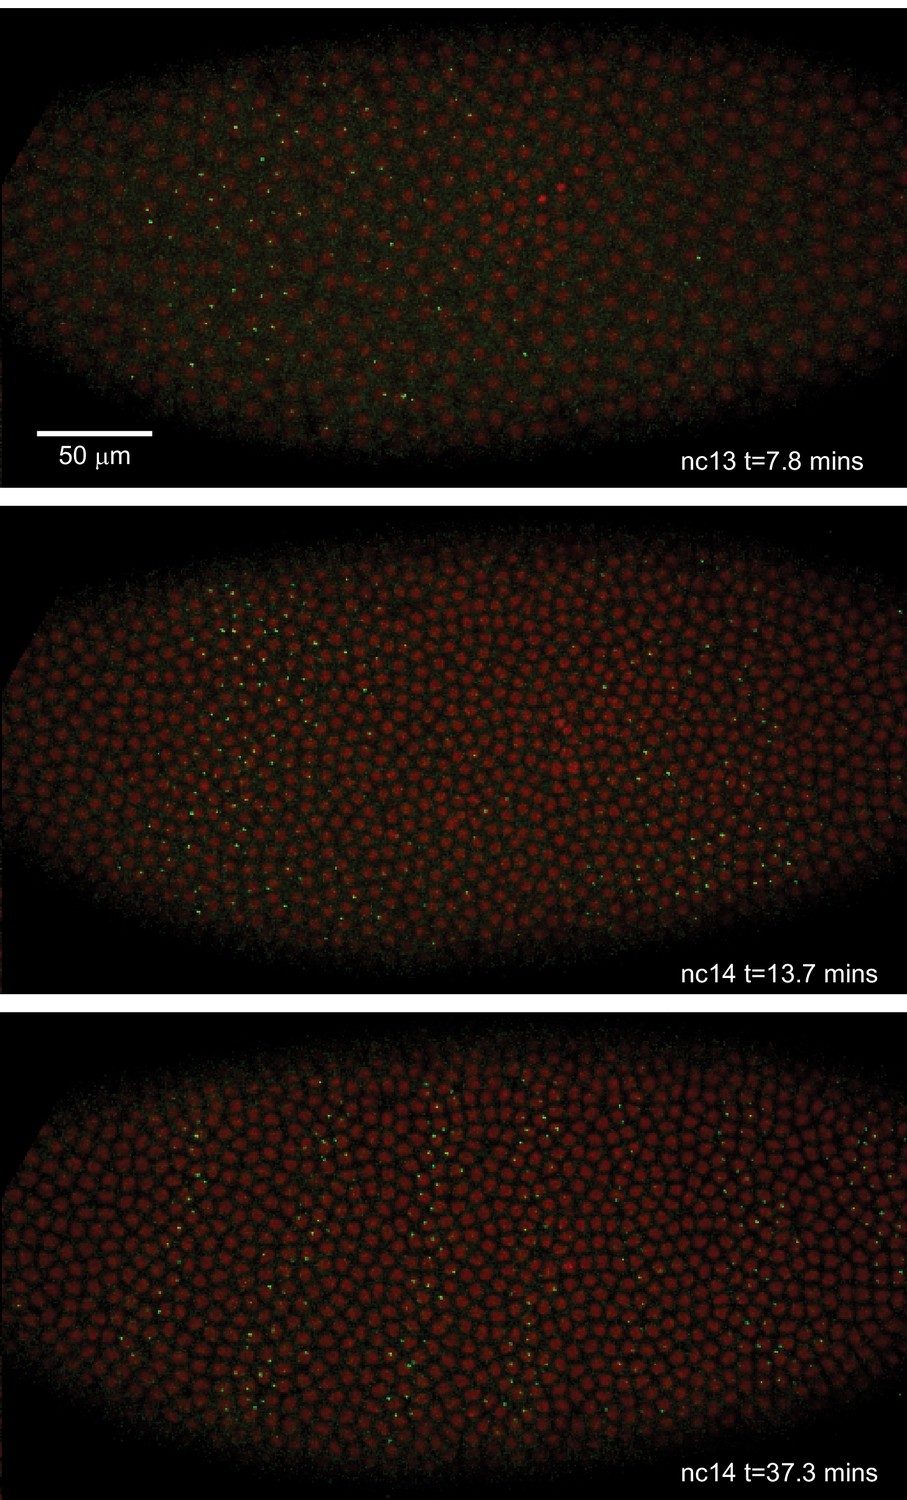
Live expression of even-skipped.
Stills from maximum projection renderings of image stacks of an embryo spanning all seven stripes. This movie was collected with a 40x objective for illustration purposes only. Movies used for data analysis were collected at higher resolution as described in the text.
Figure 3
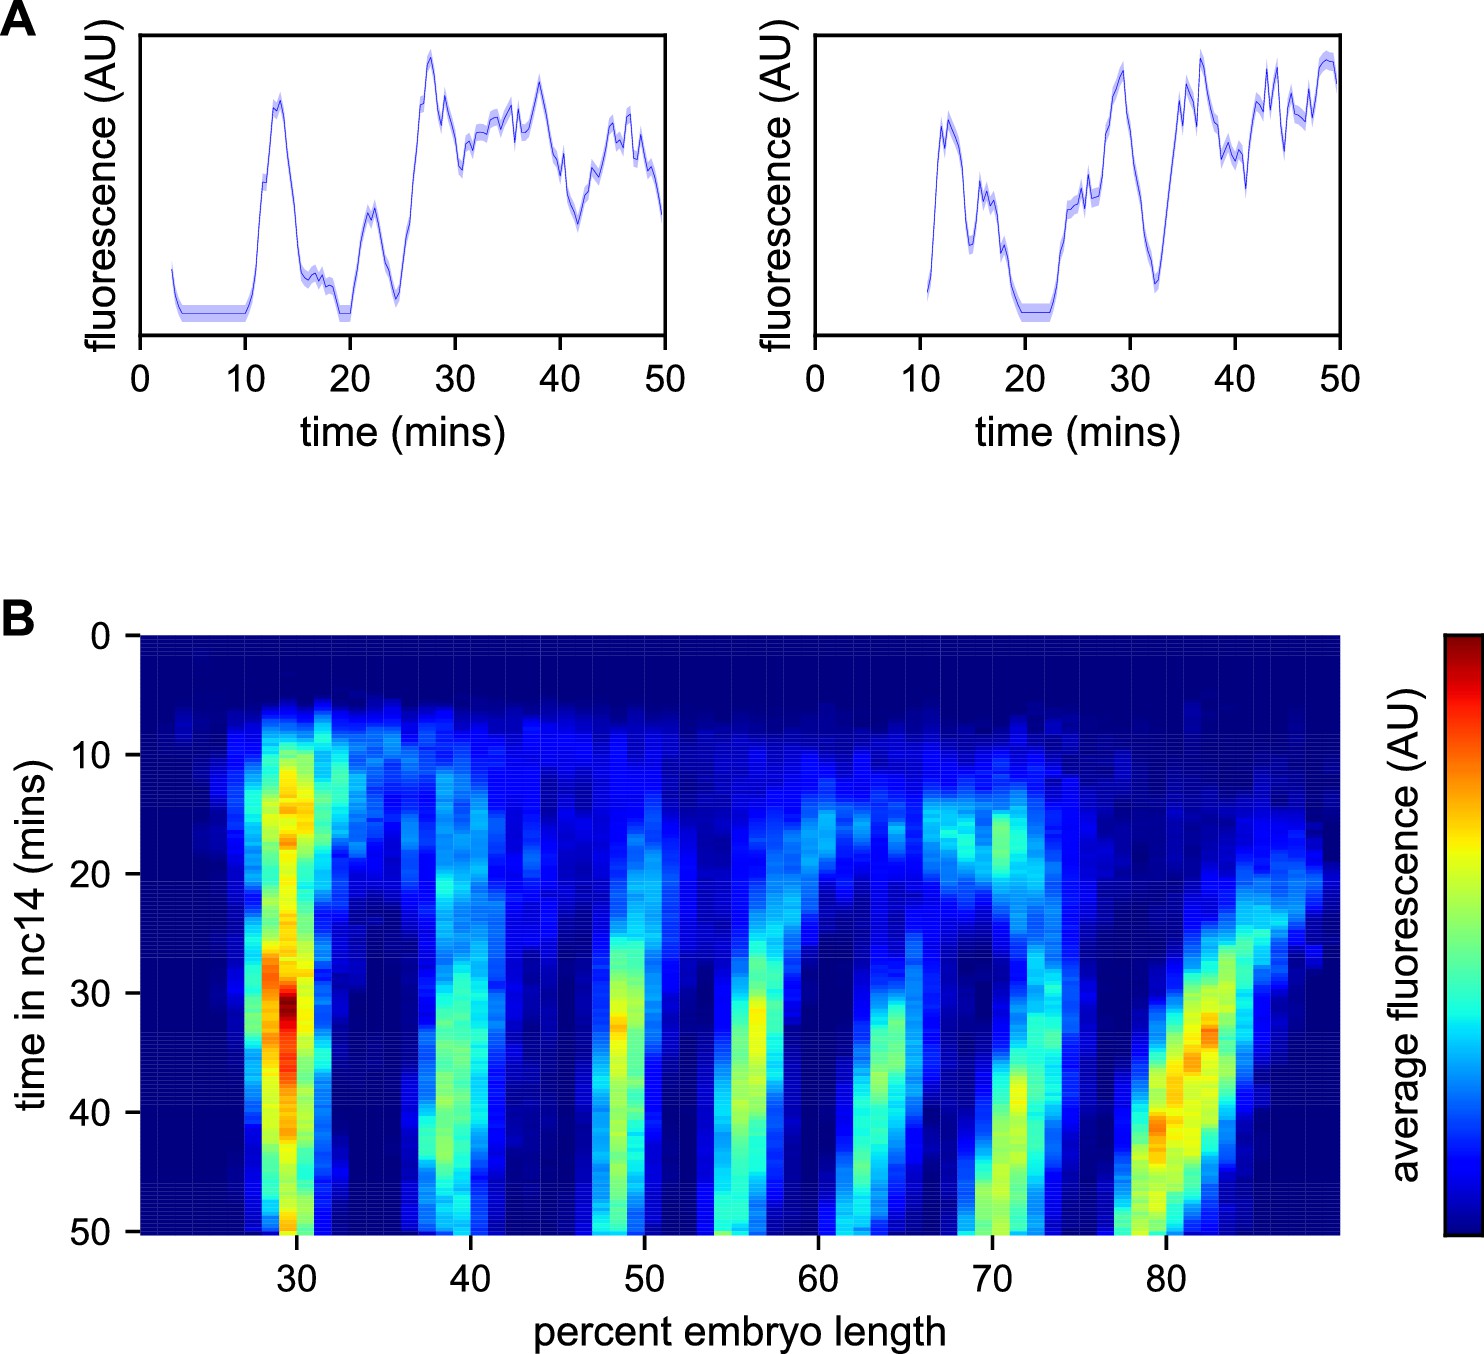
Spatiotemporal dynamics of even-skipped expression.
(A) Fluorescence traces from two representative nuclei (particle ID = 1.0163 and 11.0448). (B) Average fluorescence over space and time showing stripe formation, modulation and movement. The time resolution along the y-axis is 20 s. The positions of nuclei along the x-axis were registered across movies based on the inferred position of stripe centers, and placed into bins of 1% embryo length, with the average fluorescence of all nuclei in each bin plotted. (A, shading corresponds to the error estimated based on the background fluorescence fluctuations as described in Garcia et al., 2013).
Figure 4

Modeling bursting in individual nuclei.
(A) A key parameter in relating fluorescence output to the bursting state of a promoter is the time it takes for a polymerase to transit the gene, which we determined as approximately 140 s by examining the autocorrelation (red line) of the change in fluorescence. Gray lines show 100 bootstraps over randomly selected sets of 80% of nuclei; note they almost perfectly overlap the red line. (B) Three state model accounting for post-replication presence of sister chromatids. When either promoter is ON for a short time period ∆t, it loads polymerases at a constant rate contributing a pulse of polymerase that persists for 140 s. For the inference results presented in subsequent sections, states 1 and 2 are subsumed into a single effective ON state to give rise to an effective two-state model. The hypothetical rates depicted here assume that each promoter bursts independently, an assumption that we relax for the burst parameter inference. (C) Simplified example of the expected observed fluorescence (red line) produced from a hypothetical promoter state sequence. The fluorescence is the sum of the fluorescence pulses produced when one or both promoters are ON (given by the height of the green bars). (D–F) Representative fluorescence traces from individual nuclei (blue lines), inferred bursting pattern (green bars) and fluorescence imputed by cpHMM (red line) for particles 1.0163 (D), 11.0448 (E) and 5.0231 (F).
Figure 5
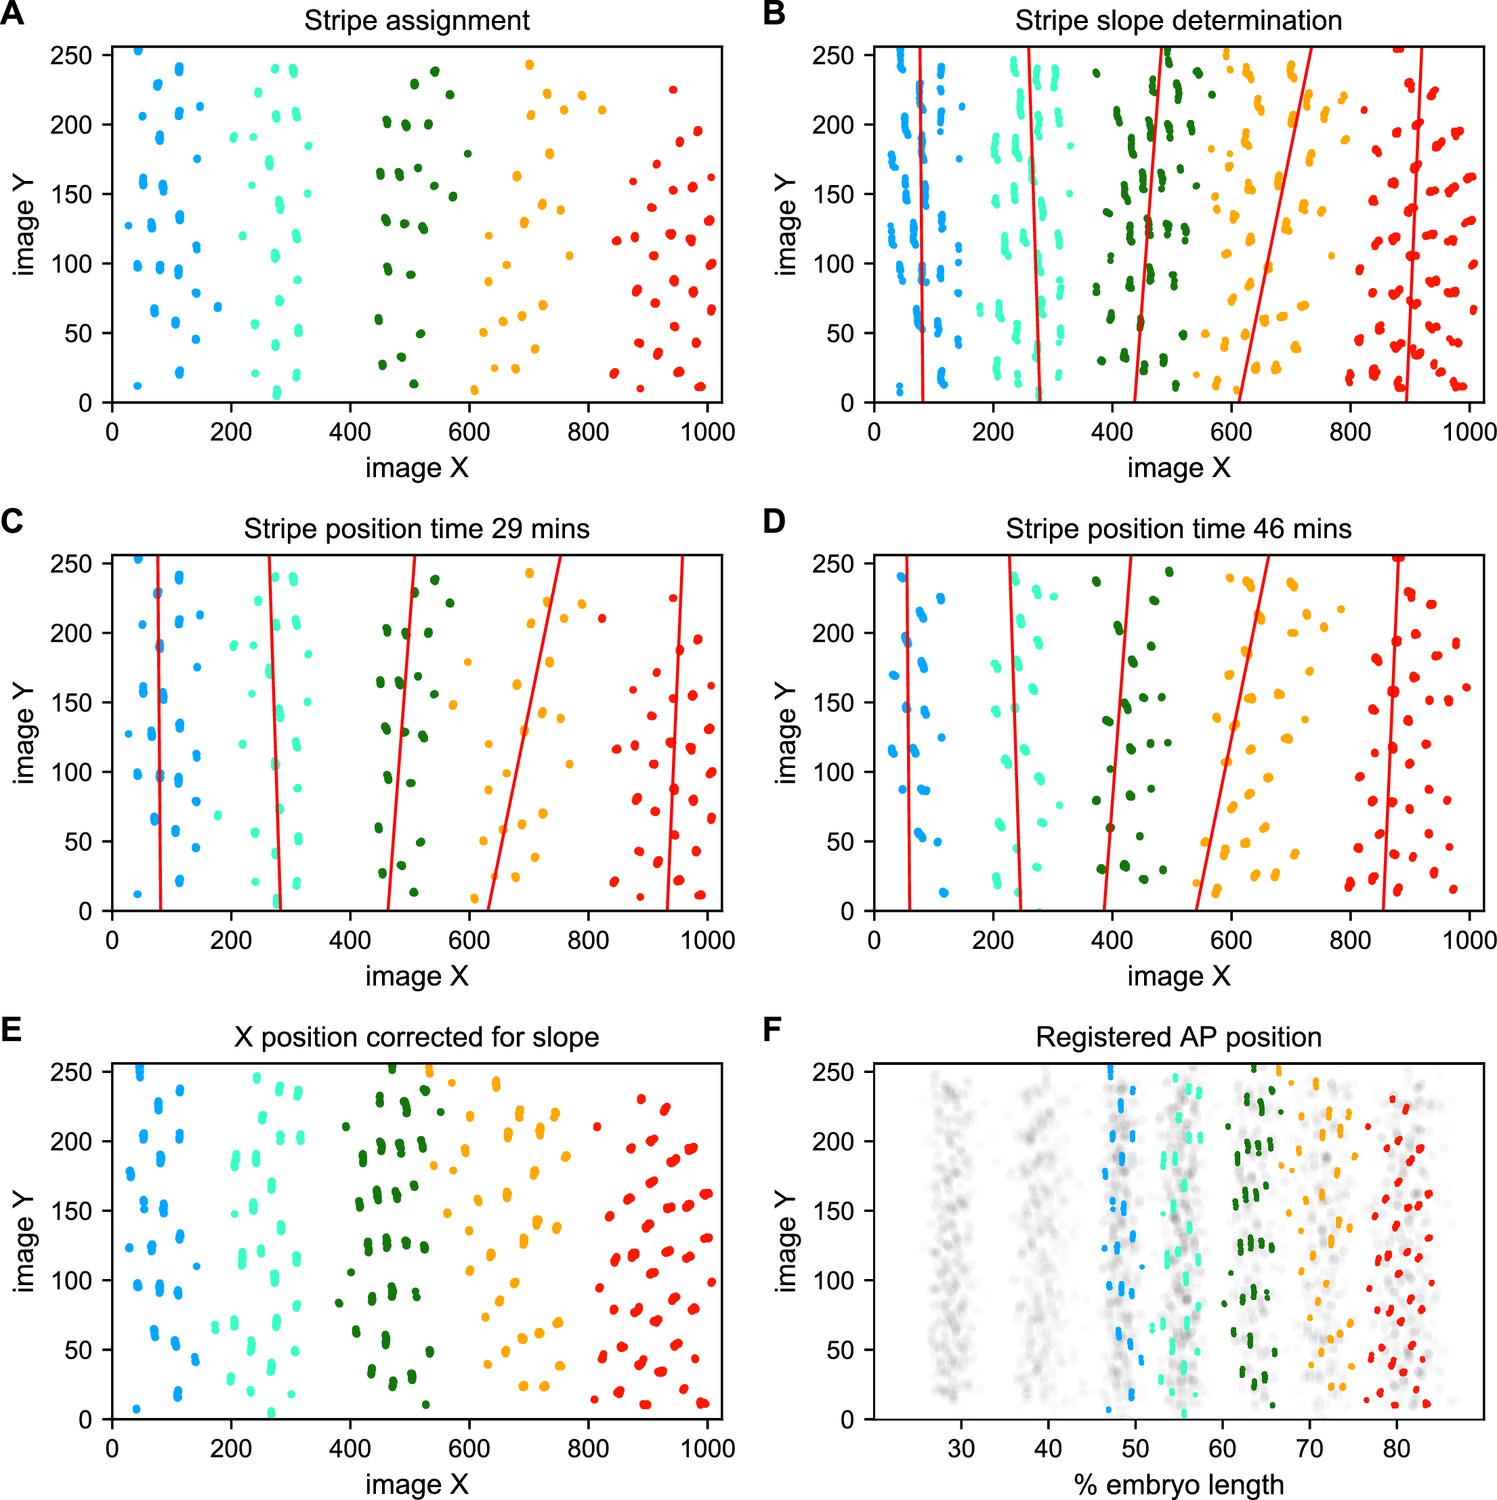
Stripe assignment and alignment.
(A) We preliminarily assign bursting nuclei to stripes by applying a Gaussian mixture model to each movie independently in overlapping six-minute time windows with the number of Gaussians equal to the number of stripes captured in that movie. An example is shown here from Video 2. (B,C,D) We next determine the orientation of each stripe to the imaging axes by fitting a line to coordinates of all nuclei from t > 25 min assigned to that stripe in each movie and time window. (E) We use these fits to generate a linear model of the position of each stripe in each image over time, which makes it possible to reorient the stripe so that it is perpendicular to the image x-axis. (F) The known coordinates of the anterior and posterior poles of the embryo are used to convert the image x-axis to AP position and register the stripes from different movies to each other, as shown here for nuclei from Video 2 colored by stripe and nuclei corresponding to all other movies drawn in gray.
Figure 6

The kinetic fingerprint of even-skipped stripe formation.
(A) Inferred location of every transcriptional burst in all 11 movies as a function of time and where along the anterior-posterior axis (plotted as fraction of embryo length) each burst occurred. The size of the dot represents the duration of the burst. Collectively the data create a kinetic fingerprint of eve stripe formation. (B) Instantaneous fraction of nuclei in the transcriptionally active ON state as a function of time and position along the embryo.
Figure 7 with 1 supplement
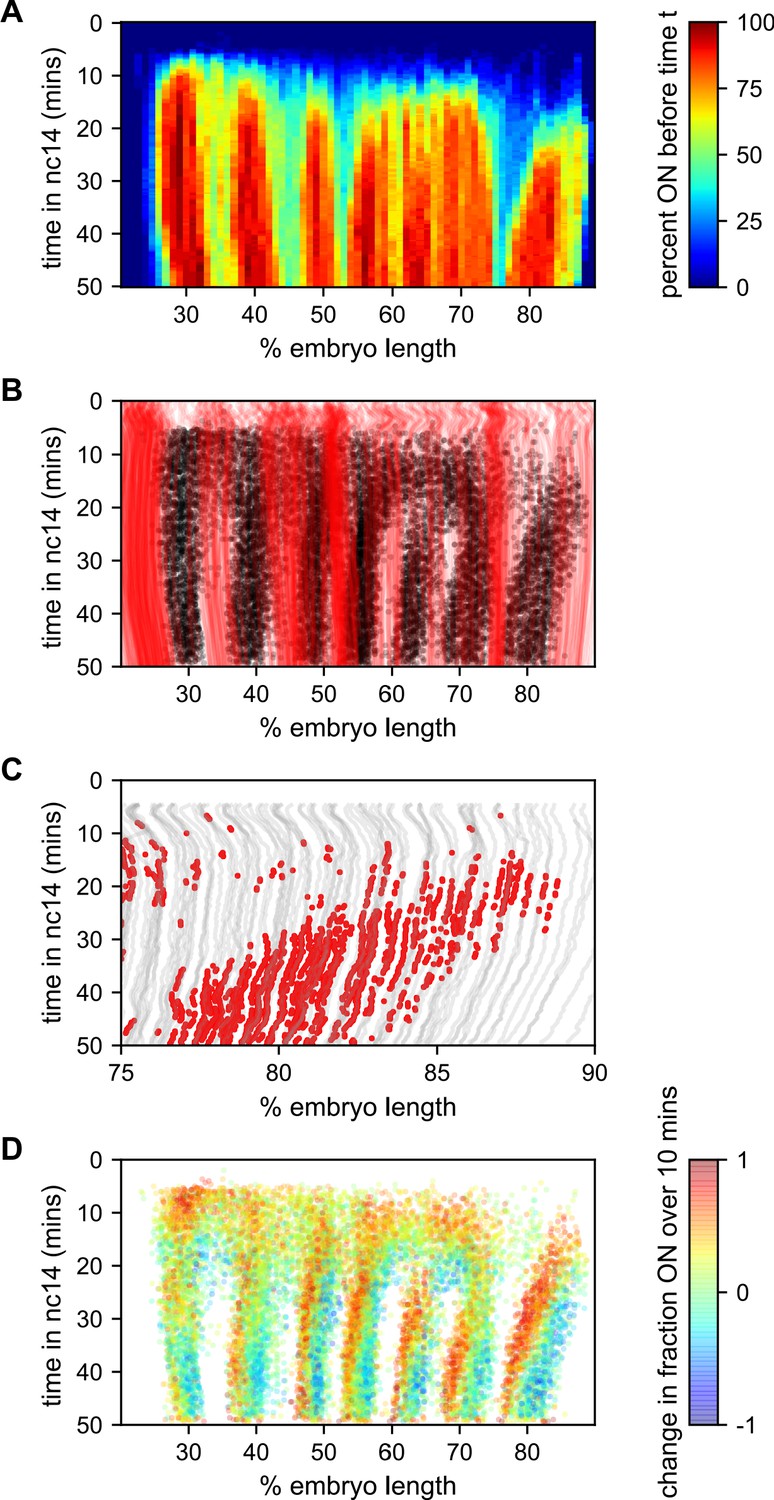
Stripe formation and movement.
(A) Fraction of nuclei bursting before time t as a function of position along the embryo. (B) Locations of new bursts (black dots) in space and time along with spatiotemporal traces of nuclei that are in the OFF state throughout nc14 (red lines). (C) Traces of nuclei positions over time (gray lines) from stripe 7 region of movie EVE_D6 with timepoints where new bursts initiated colored red to illustrate stripe movement relative to nuclei. (D) Difference in transcriptional activity as defined as the difference between the fraction of the time each nucleus is in the ON state in the subsequent 10 min minus the fraction of time the nucleus is in the ON state in the preceding 10 min. Positive values represent a nucleus turning on or increasing activity, while blue values indicate a nucleus turning off or decreasing activity.
Figure 7—figure supplement 1
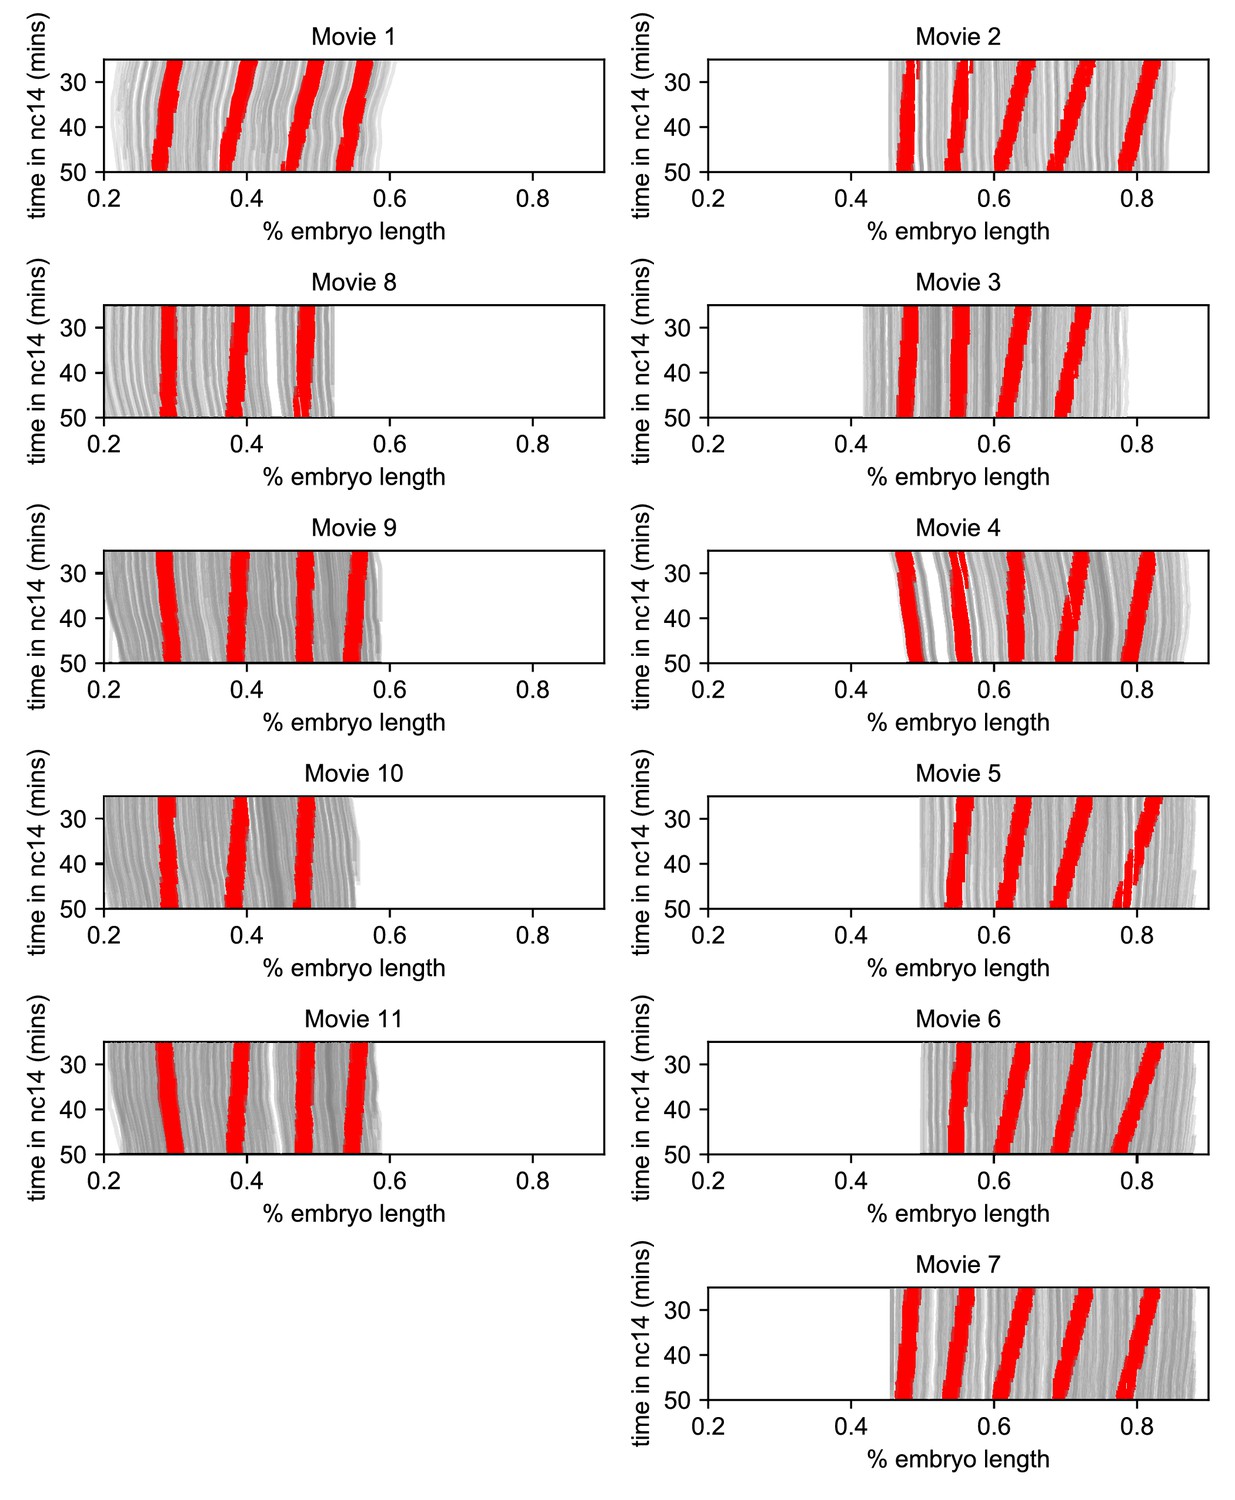
Stripe movement is dominated by the movement of transcriptional activity.
Traces of nuclei positions over time (gray lines) from all eleven movies with time points corresponding to transcriptional bursts annotated as in stripes colored red.
Figure 8

A common bursting control mechanism across all even-skipped stripes.
(A–C) cpHMM inference was carried over nuclei binned according to their average fluorescence value indicating that while (A) kon and (C) r are subject to the same regulation along all stripes, (B) koff remains unchanged. Error bars are calculated by taking the standard deviation across cpHMM inference results for multiple bootstrapped samples of experimental data. (D) Distribution of average nuclear fluorescence values along the AP axis. (E) Mean nuclear fluorescence values for each AP position together with the corresponding averaged and weighted bursting parameters.
Videos
Video 1
Full expression pattern of eve-MS2 BAC.
Maximum value projection of Z-stacks of an entire embryo carrying eve-MS2 BAC, MCP-GFP, and histone-RFP imaged with a 40x objective.
Video 2
Individual dataset EVE_D1.
Maximum value projection of Z-stacks of sections of embryos carrying eve-MS2 BAC, MCP-GFP, and histone-RFP imaged with a 63x objective, each capturing 3–5 stripes as described in Table 1.
Video 3
Individual dataset EVE_D2.
Maximum value projection of Z-stacks of sections of embryos carrying eve-MS2 BAC, MCP-GFP, and histone-RFP imaged with a 63x objective, each capturing 3–5 stripes as described in Table 1.
Video 4
Individual dataset EVE_D3.
Maximum value projection of Z-stacks of sections of embryos carrying eve-MS2 BAC, MCP-GFP, and histone-RFP imaged with a 63x objective, each capturing 3–5 stripes as described in Table 1.
Video 5
Individual dataset EVE_D3.
Maximum value projection of Z-stacks of sections of embryos carrying eve-MS2 BAC, MCP-GFP, and histone-RFP imaged with a 63x objective, each capturing 3–5 stripes as described in Table 1.
Video 6
Individual dataset EVE_D5.
Maximum value projection of Z-stacks of sections of embryos carrying eve-MS2 BAC, MCP-GFP, and histone-RFP imaged with a 63x objective, each capturing 3–5 stripes as described in Table 1.
Video 7
Individual dataset EVE_D6.
Maximum value projection of Z-stacks of sections of embryos carrying eve-MS2 BAC, MCP-GFP, and histone-RFP imaged with a 63x objective, each capturing 3–5 stripes as described in Table 1.
Video 8
Individual dataset EVE_D7.
Maximum value projection of Z-stacks of sections of embryos carrying eve-MS2 BAC, MCP-GFP, and histone-RFP imaged with a 63x objective, each capturing 3–5 stripes as described in Table 1.
Video 9
Individual dataset EVE_D8.
Maximum value projection of Z-stacks of sections of embryos carrying eve-MS2 BAC, MCP-GFP, and histone-RFP imaged with a 63x objective, each capturing 3–5 stripes as described in Table 1.
Video 10
Individual dataset EVE_D9.
Maximum value projection of Z-stacks of sections of embryos carrying eve-MS2 BAC, MCP-GFP, and histone-RFP imaged with a 63x objective, each capturing 3–5 stripes as described in Table 1.
Video 11
Individual dataset EVE_D10.
Maximum value projection of Z-stacks of sections of embryos carrying eve-MS2 BAC, MCP-GFP, and histone-RFP imaged with a 63x objective, each capturing 3–5 stripes as described in Table 1.
Video 12
Individual dataset EVE_D11.
Maximum value projection of Z-stacks of sections of embryos carrying eve-MS2 BAC, MCP-GFP, and histone-RFP imaged with a 63x objective, each capturing 3–5 stripes as described in Table 1.
Video 13
Promoter state movie for dataset EVE_D1.
Animation of pseudo-cells (resulting from a Voronoi tessellation based on the position of nuclei) where cells are colored based on their stripe, with intensity proportional to the measured eve MS2 fluorescence of the nucleus at the given time, and promoters in the ON and OFF states represented with light and dark gray pseudo-cell outlines, respectively.
Video 14
Promoter state movie for dataset EVE_D2.
Animation of pseudo-cells (resulting from a Voronoi tessellation based on the position of nuclei) where cells are colored based on their stripe, with intensity proportional to the measured eve MS2 fluorescence of the nucleus at the given time, and promoters in the ON and OFF states represented with light and dark gray pseudo-cell outlines, respectively.
Video 15
Promoter state movie for dataset EVE_D3.
Animation of pseudo-cells (resulting from a Voronoi tessellation based on the position of nuclei) where cells are colored based on their stripe, with intensity proportional to the measured eve MS2 fluorescence of the nucleus at the given time, and promoters in the ON and OFF states represented with light and dark gray pseudo-cell outlines, respectively.
Video 16
Promoter state movie for dataset EVE_D4.
Animation of pseudo-cells (resulting from a Voronoi tessellation based on the position of nuclei) where cells are colored based on their stripe, with intensity proportional to the measured eve MS2 fluorescence of the nucleus at the given time, and promoters in the ON and OFF states represented with light and dark gray pseudo-cell outlines, respectively.
Video 17
Promoter state movie for dataset EVE_D5.
Animation of pseudo-cells (resulting from a Voronoi tessellation based on the position of nuclei) where cells are colored based on their stripe, with intensity proportional to the measured eve MS2 fluorescence of the nucleus at the given time, and promoters in the ON and OFF states represented with light and dark gray pseudo-cell outlines, respectively.
Video 18
Promoter state movie for dataset EVE_D6.
Animation of pseudo-cells (resulting from a Voronoi tessellation based on the position of nuclei) where cells are colored based on their stripe, with intensity proportional to the measured eve MS2 fluorescence of the nucleus at the given time, and promoters in the ON and OFF states represented with light and dark gray pseudo-cell outlines, respectively.
Video 19
Promoter state movie for dataset EVE_D7.
Animation of pseudo-cells (resulting from a Voronoi tessellation based on the position of nuclei) where cells are colored based on their stripe, with intensity proportional to the measured eve MS2 fluorescence of the nucleus at the given time, and promoters in the ON and OFF states represented with light and dark gray pseudo-cell outlines, respectively.
Video 20
Promoter state movie for dataset EVE_D8.
Animation of pseudo-cells (resulting from a Voronoi tessellation based on the position of nuclei) where cells are colored based on their stripe, with intensity proportional to the measured eve MS2 fluorescence of the nucleus at the given time, and promoters in the ON and OFF states represented with light and dark gray pseudo-cell outlines, respectively.
Video 21
Promoter state movie for dataset EVE_D9.
Animation of pseudo-cells (resulting from a Voronoi tessellation based on the position of nuclei) where cells are colored based on their stripe, with intensity proportional to the measured eve MS2 fluorescence of the nucleus at the given time, and promoters in the ON and OFF states represented with light and dark gray pseudo-cell outlines, respectively.
Video 22
Promoter state movie for dataset EVE_D10.
Animation of pseudo-cells (resulting from a Voronoi tessellation based on the position of nuclei) where cells are colored based on their stripe, with intensity proportional to the measured eve MS2 fluorescence of the nucleus at the given time, and promoters in the ON and OFF states represented with light and dark gray pseudo-cell outlines, respectively.
Video 23
Promoter state movie for dataset EVE_D11.
Animation of pseudo-cells (resulting from a Voronoi tessellation based on the position of nuclei) where cells are colored based on their stripe, with intensity proportional to the measured eve MS2 fluorescence of the nucleus at the given time, and promoters in the ON and OFF states represented with light and dark gray pseudo-cell outlines, respectively.
Video 24
Kinetic fingerprint of eve stripe formation.
Nuclei are graphed at every time point at its registered AP (x-axis) and image y (y-axis) position when the cpHMM inferred that one copy (small circles) or two copies (large circles) of the promoter was in the ON state (see Figure 4B).
Tables
Table 1
Summary of movies collected.
| Embryo ID | Duration | Stripes | Data movies | Promoter state movies |
|---|---|---|---|---|
| EVE_D1 | 255 frames 71.2 min | 1–4 | Video 2 | Video 13 |
| EVE_D2 | 254 frames 70.9 min | 3–7 | Video 3 | Video 14 |
| EVE_D3 | 235 frames 65.6 min | 3–6 | Video 4 | Video 15 |
| EVE_D4 | 246 frames 68.7 min | 3–7 | Video 5 | Video 16 |
| EVE_D5 | 210 frames 58.6 min | 4–7 | Video 6 | Video 17 |
| EVE_D6 | 196 frames 54.7 min | 4–7 | Video 7 | Video 18 |
| EVE_D7 | 208 frames 58.1 min | 3–7 | Video 8 | Video 19 |
| EVE_D8 | 232 frames 64.8 min | 1–3 | Video 9 | Video 20 |
| EVE_D9 | 322 frames 89.9 min | 1–4 | Video 10 | Video 21 |
| EVE_D10 | 267 frames 74.5 min | 1–3 | Video 11 | Video 22 |
| EVE_D11 | 307 frames 85.7 min | 1–4 | Video 12 | Video 23 |
Additional files
-
Supplementary file 1
Data and code.
- https://cdn.elifesciences.org/articles/61635/elife-61635-supp1-v2.zip
-
Transparent reporting form
- https://cdn.elifesciences.org/articles/61635/elife-61635-transrepform-v2.docx
Download links
A two-part list of links to download the article, or parts of the article, in various formats.
Downloads (link to download the article as PDF)
Open citations (links to open the citations from this article in various online reference manager services)
Cite this article (links to download the citations from this article in formats compatible with various reference manager tools)
Kinetic sculpting of the seven stripes of the Drosophila even-skipped gene
eLife 9:e61635.
https://doi.org/10.7554/eLife.61635


