Real-time, low-latency closed-loop feedback using markerless posture tracking
- The Rowland Institute at Harvard, Harvard University, United States
- NeuroGEARS Ltd, United Kingdom
- Institute of Neuroscience, Department of Psychology, University of Oregon, United States
- Center for Neuroprosthetics, Center for Intelligent Systems, & Brain Mind Institute, School of Life Sciences, Swiss Federal Institute of Technology (EPFL), Switzerland
Figures
Figure 1
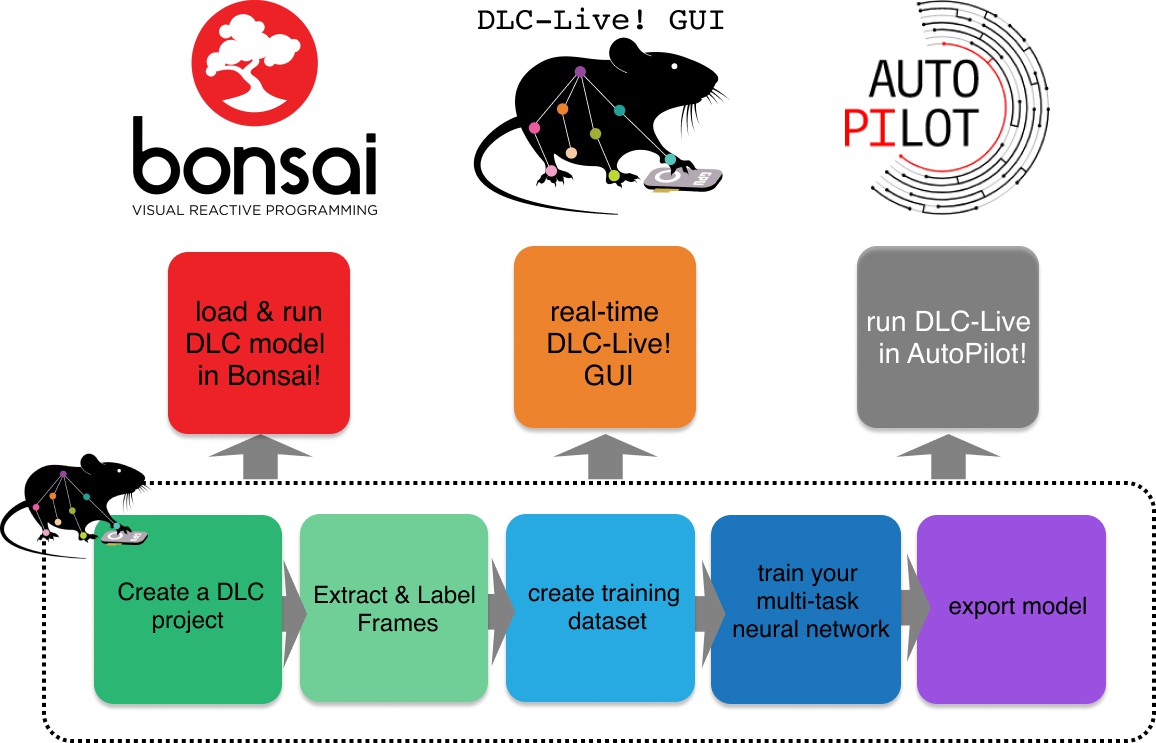
Overview of using DLC networks in real-time experiments within Bonsai, the DLC-Live! GUI, and AutoPilot.
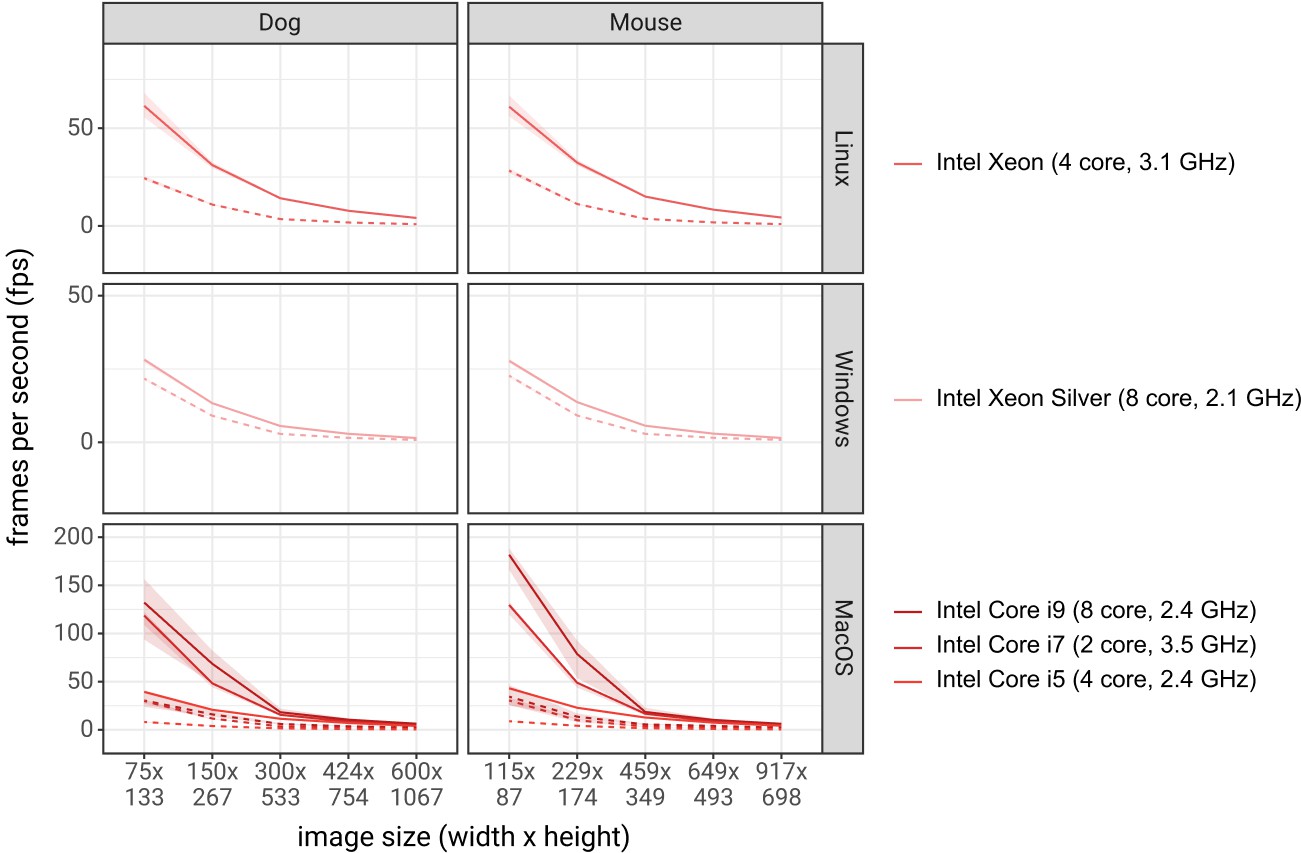
Figure 2 with 4 supplements

Inference speed of different networks with different image sizes on different system configurations.
Solid lines are tests using DLC-MobileNetV2-0.35 networks and dashed lines using DLC-ResNet-50 networks. Shaded regions represent 10th-90th percentile of the distributions. N = 1000–10,000 observations per point.
Figure 2—figure supplement 1
Inference speed of different networks with different image sizes with different system configurations, using CPUs for inference.
Inference speed of different networks with different image sizes with different system configurations, using CPUs for inference. Solid lines are tests using DLC-MobileNetV2-0.35 networks and dashed lines using DLC-ResNet-50 networks. Shaded regions represent 10th-90th percentile of the distributions. N = 1000–10,000 observations per point.
Figure 2—figure supplement 2
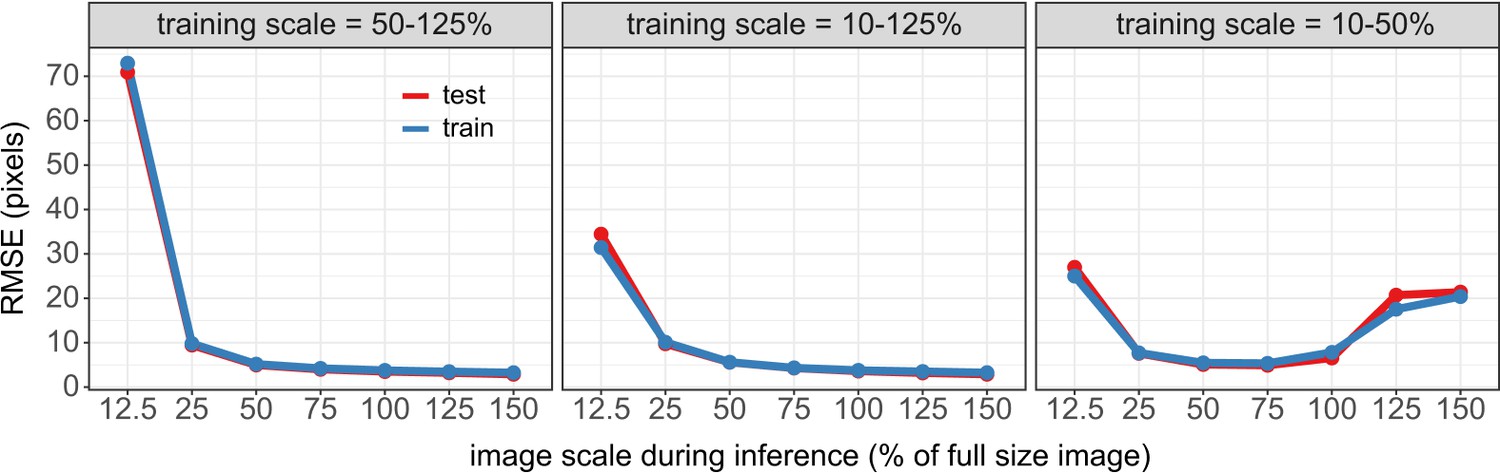
Accuracy of DLC networks on resized images.
Accuracy of DLC networks on resized images. Accuracy of DLC networks was tested on a range of image sizes (test image scale = 0.125–1.5, different panels). Lines indicate the root mean square error (RMSE, y-axis) between DLC predicted keypoints, using DLC networks trained with different scale parameters (x-axis), and human labels. Different colors are for errors on images in the training dataset (blue) vs. test dataset (red). Note, the RMSE is not reported as on the scaled image, but as would be in the original image (640 × 480) for comparability. .
Figure 2—figure supplement 3
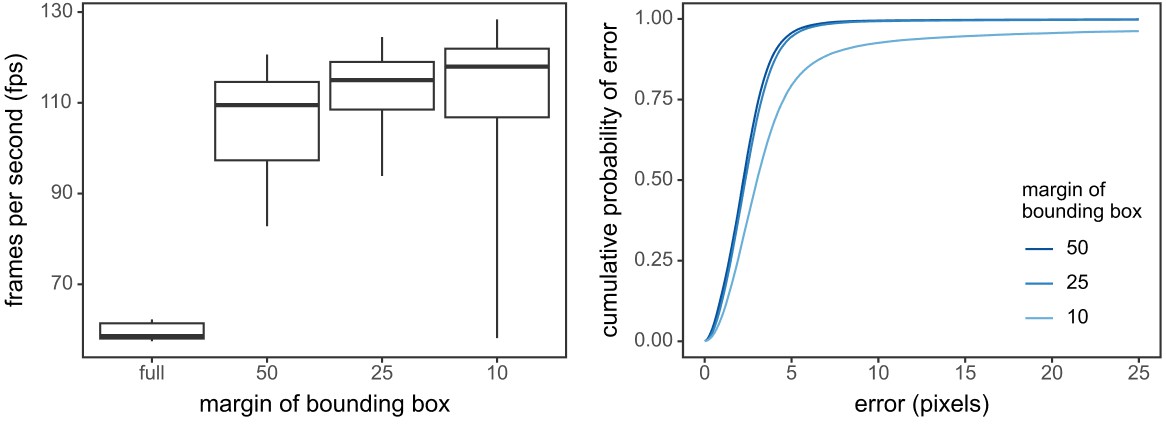
Dynamic cropping increased inference speed with little sacrifice to accuracy.
(Left) Inference speeds (in fps) for the full size images compared to dynamic cropping with 50, 25, or 10 pixel margin around the animals last position. Boxplots represent the 0.1, 0.3, 0.5, 0.7, and 0.9% quantiles of each distribution. (Right) The cumulative distribution of errors (i.e. the proportion of images with a smaller error) for dynamic tracking relative to full size images.
Figure 2—figure supplement 4
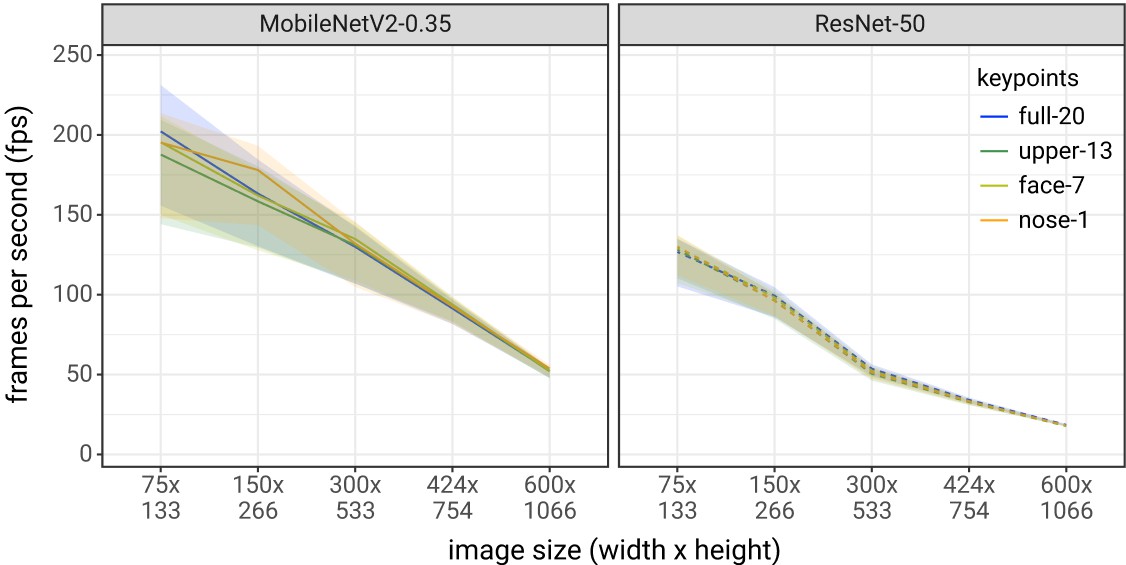
The number of keypionts in a DeepLabCut network does not affect inference speed.
Inference speeds were not affected by the number of keypoints in a DeepLabCut network. Inference speeds were tested on a series of dog tracking networks with 1 (only the nose), 7 (the face), 13 (the upper body), or 20 (the entire body) keypoints. Inference speeds were tested on different image sizes (x-axis) and on different DeepLabCut architectures (different panels). Lines represent the median and the ribbon represents the 0.1–0.9 quantiles of the distribution of inference speeds.
Figure 3
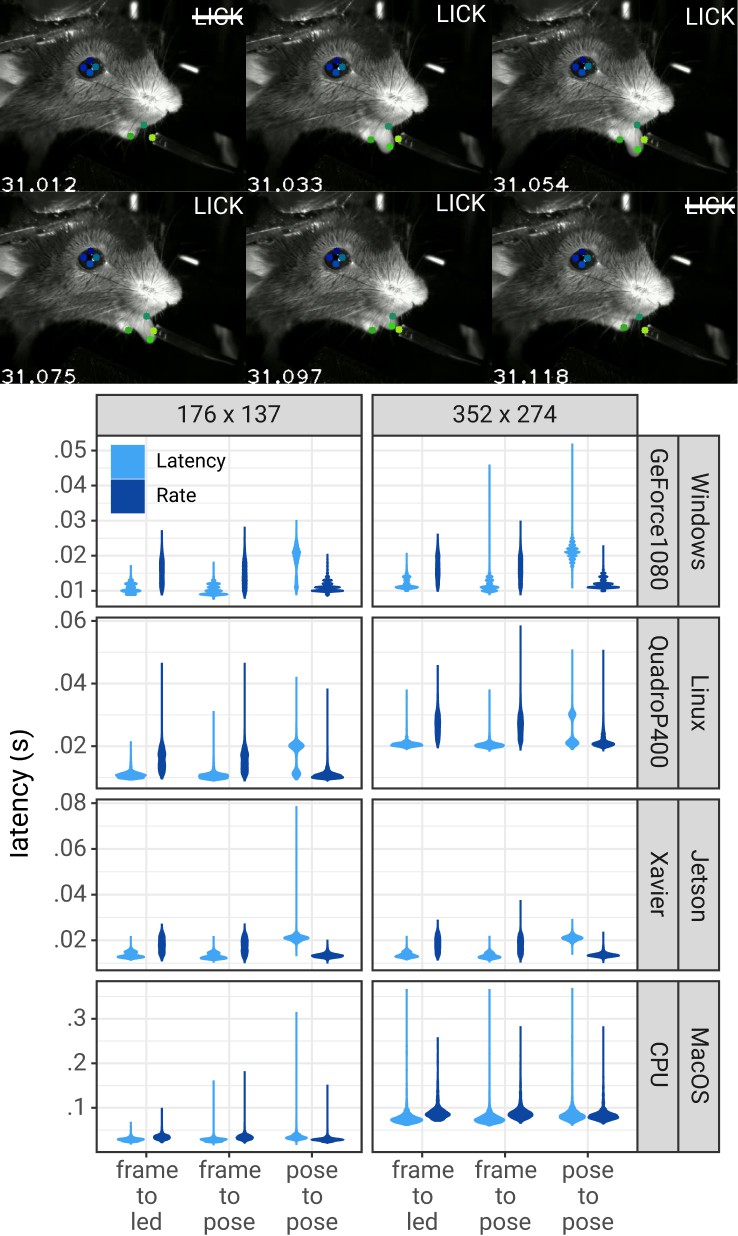
Pose estimation latency using the DLC-Live!-GUI.
Top: A lick sequence from the test video with eight keypoints measured using the DLC-Live!-GUI (using Windows/GeForce GTX 1080 GPU). Image timestamps are presented in the bottom-left corner of each image. Bottom: Latency from image acquisition to obtaining the pose, from the last pose to the current pose, and from image acquisition when the mouse’s tongue was detected to turning on an LED. The width of the violin plots indicate the probability density – the likelihood of observing a given value on the y-axis.
Figure 4
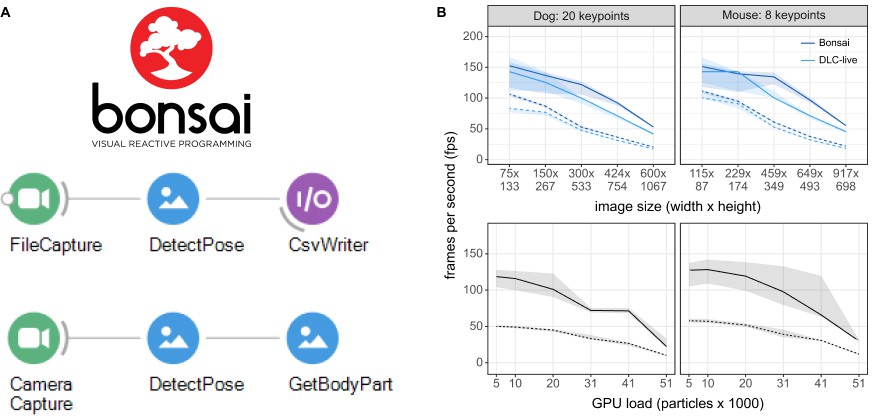
Inference speed using the Bonsai-DLC Plugin.
Dashed Lines are ResNet-50, solid lines are MobileNetV2-0.35 (A) Overview of using DeepLabCut within Bonsai. Both capture-to-write or capture to detect for real-time feedback is possible. (B) Top: Direct comparison of the inference speeds using Bonsai-DLC plugin vs. the DeepLabCut-Live! package across image sizes from the same computer (OS: Windows 10, GPU: NVIDIA Ge-Force 1080 with Max-Q Design). Bottom: Inference speeds using the Bonsai-DLC plugin while the GPU was engaged in a particle simulation. More particles indicates greater competition for GPU resources.
Figure 5
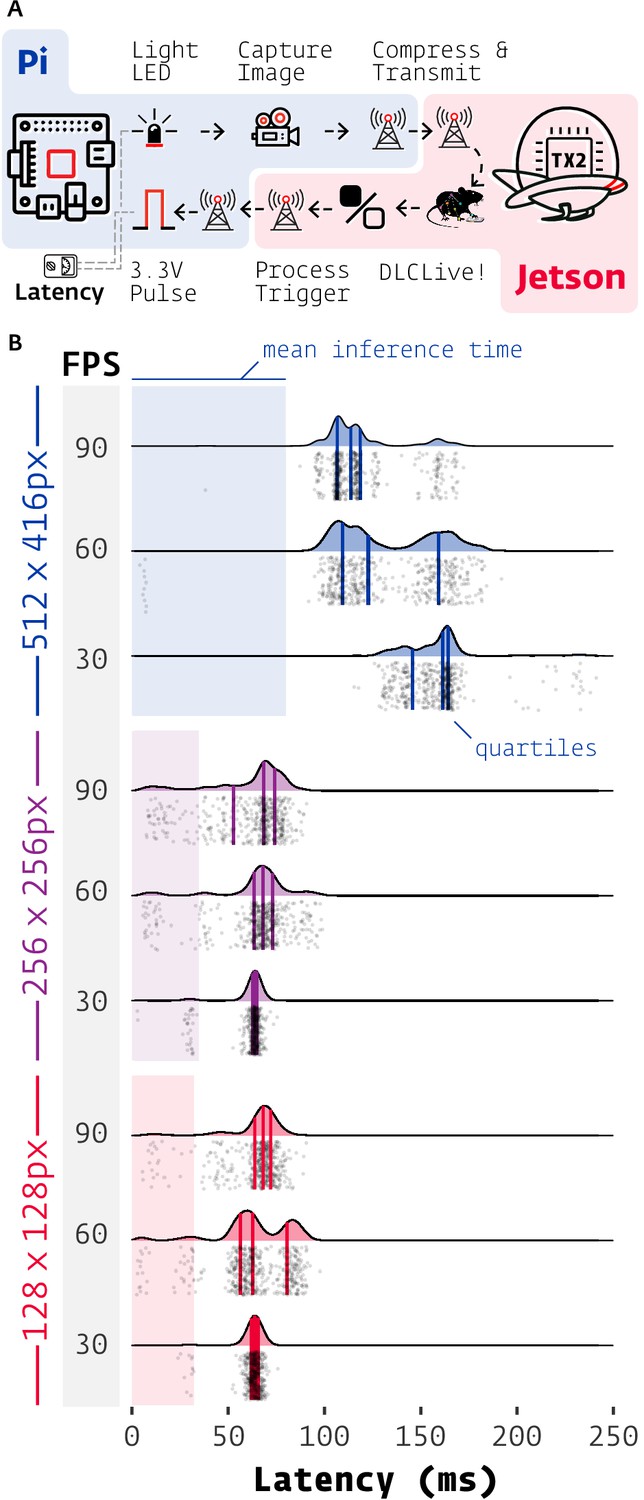
Latency of DeepLabCut-Live with Autopilot.
(A) Images of an LED were captured on a Raspberry Pi 4 (shaded blue) with Autopilot, sent to an Nvidia Jetson TX2 (shaded red) to process with DeepLabCut-Live and Autopilot Transforms, which triggered a TTL pulse from the Pi when the LED was lit. (B) Latencies from LED illumination to TTL pulse (software timestamps shown, points and densities) varied by resolution (color groups) and acquisition frame rate (shaded FPS bar). Processing time at each stage of the chain in (A) contributes to latency, but pose inference on the relatively slow TX2 (shaded color areas, from Figure 2) had the largest effect. Individual measurements (n = 500 each condition) cluster around multiples of the inter-frame interval (eg. 1/30 FPS = 33.3 ms).
Figure 6 with 2 supplements
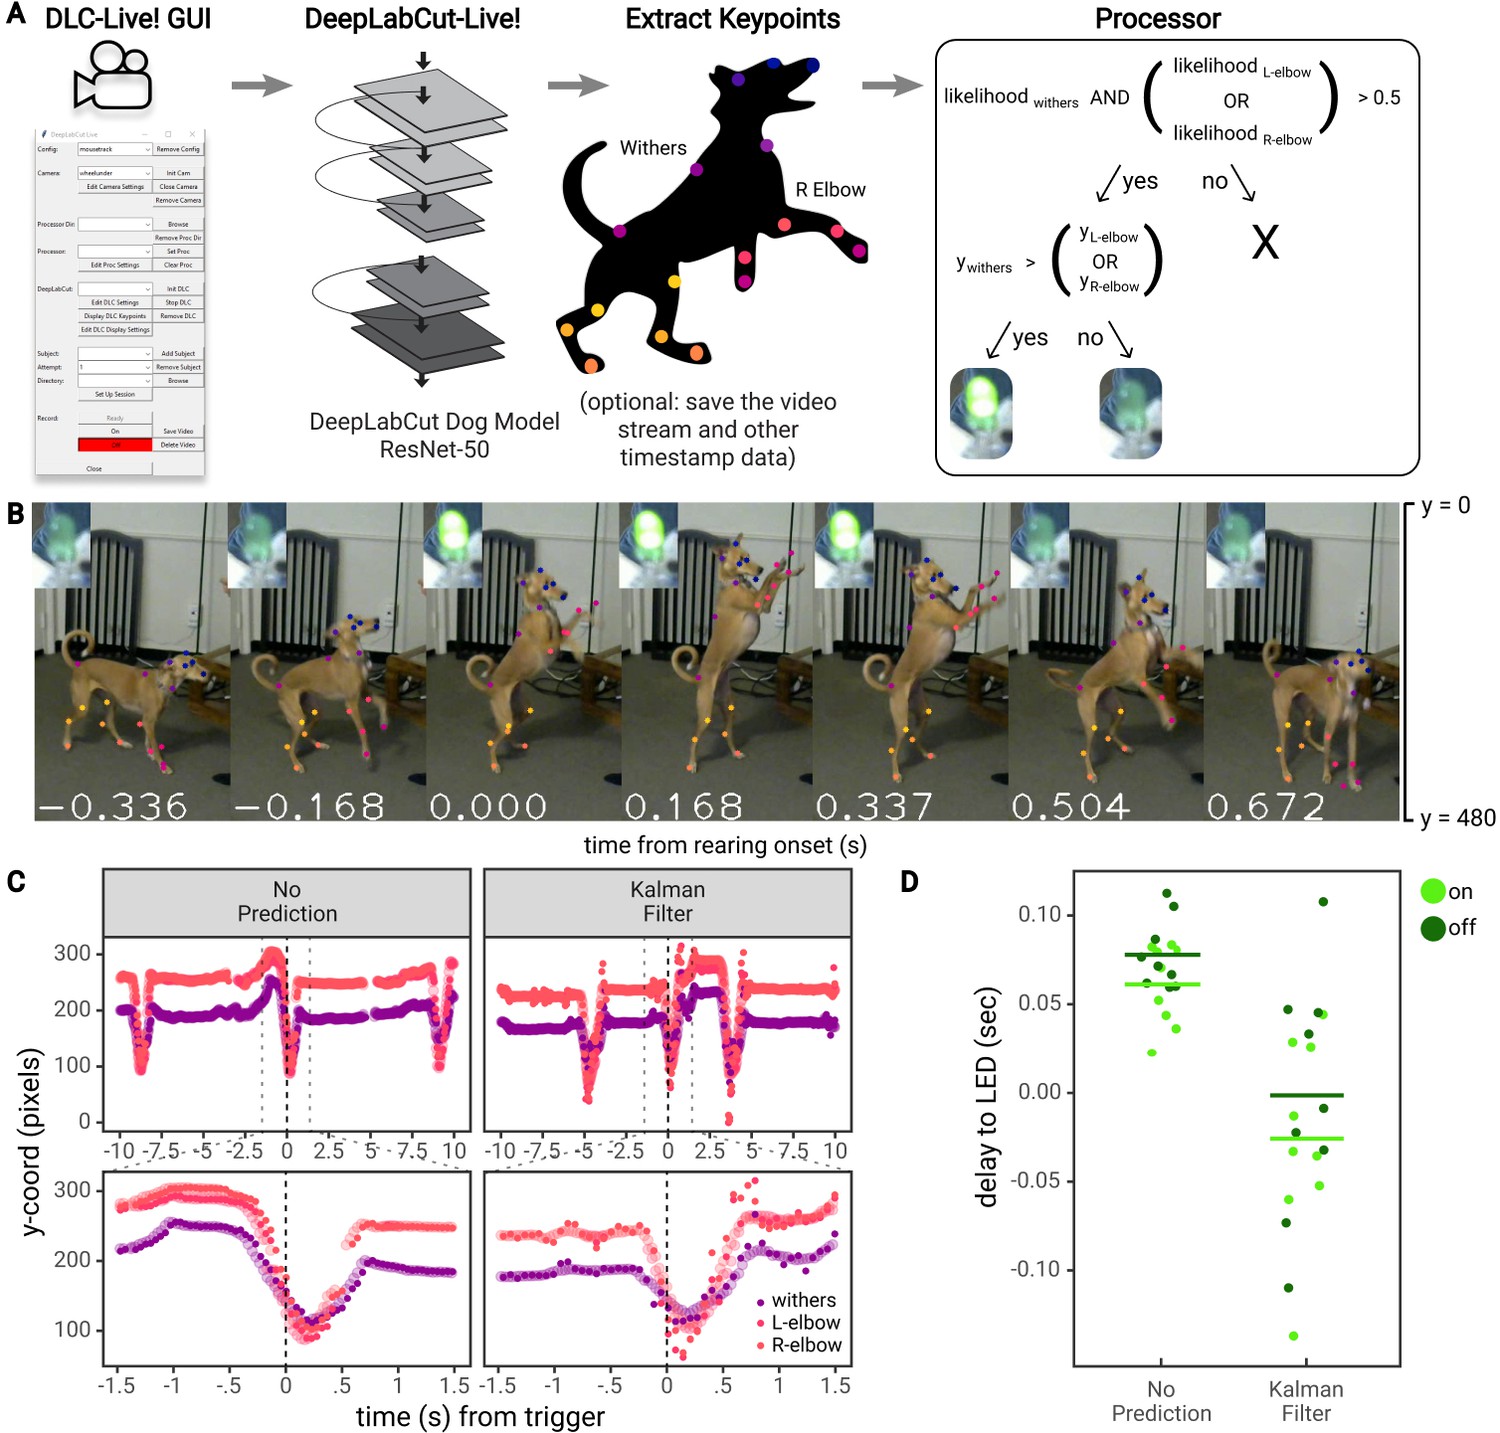
Real-time feedback based on posture.
(A) Diagram of the workflow for the dog feedback experiment. Image acquisition and pose estimation were controlled by the DLC-Live! GUI. A DeepLabCut-live Processor was used to detect ‘rearing’ postures based on the likelihood and y-coordinate of the withers and elbows and turn an LED on or off accordingly. (B) An example jump sequence with LED status, labeled with keypoints measured offline using the DeepLabCut-live benchmarking tool. The images are cropped for visibility. (C) Example trajectories of the withers and elbows, locked to one jump sequence. Larger, transparent points represent the true trajectories – trajectories measured offline, from each image in the video. The smaller opaque points represent trajectories measured in real-time, in which the time of each point reflects the delay from image acquisition to pose estimation, with and without the Kalman filter forward prediction. Without forward prediction, estimated trajectories are somewhat delayed from the true trajectories. With the Kalman filter forward prediction, trajectories are less accurate but less delayed when keypoints exhibit rapid changes in position, such as during a rearing movement. (D) The delay from the time the dog first exhibited a rearing posture (from postures measured offline) to the time the LED was turned on or off. Each point represents a single instance of the detection of a transition to a rearing posture or out of a rearing posture.
Figure 6—figure supplement 1
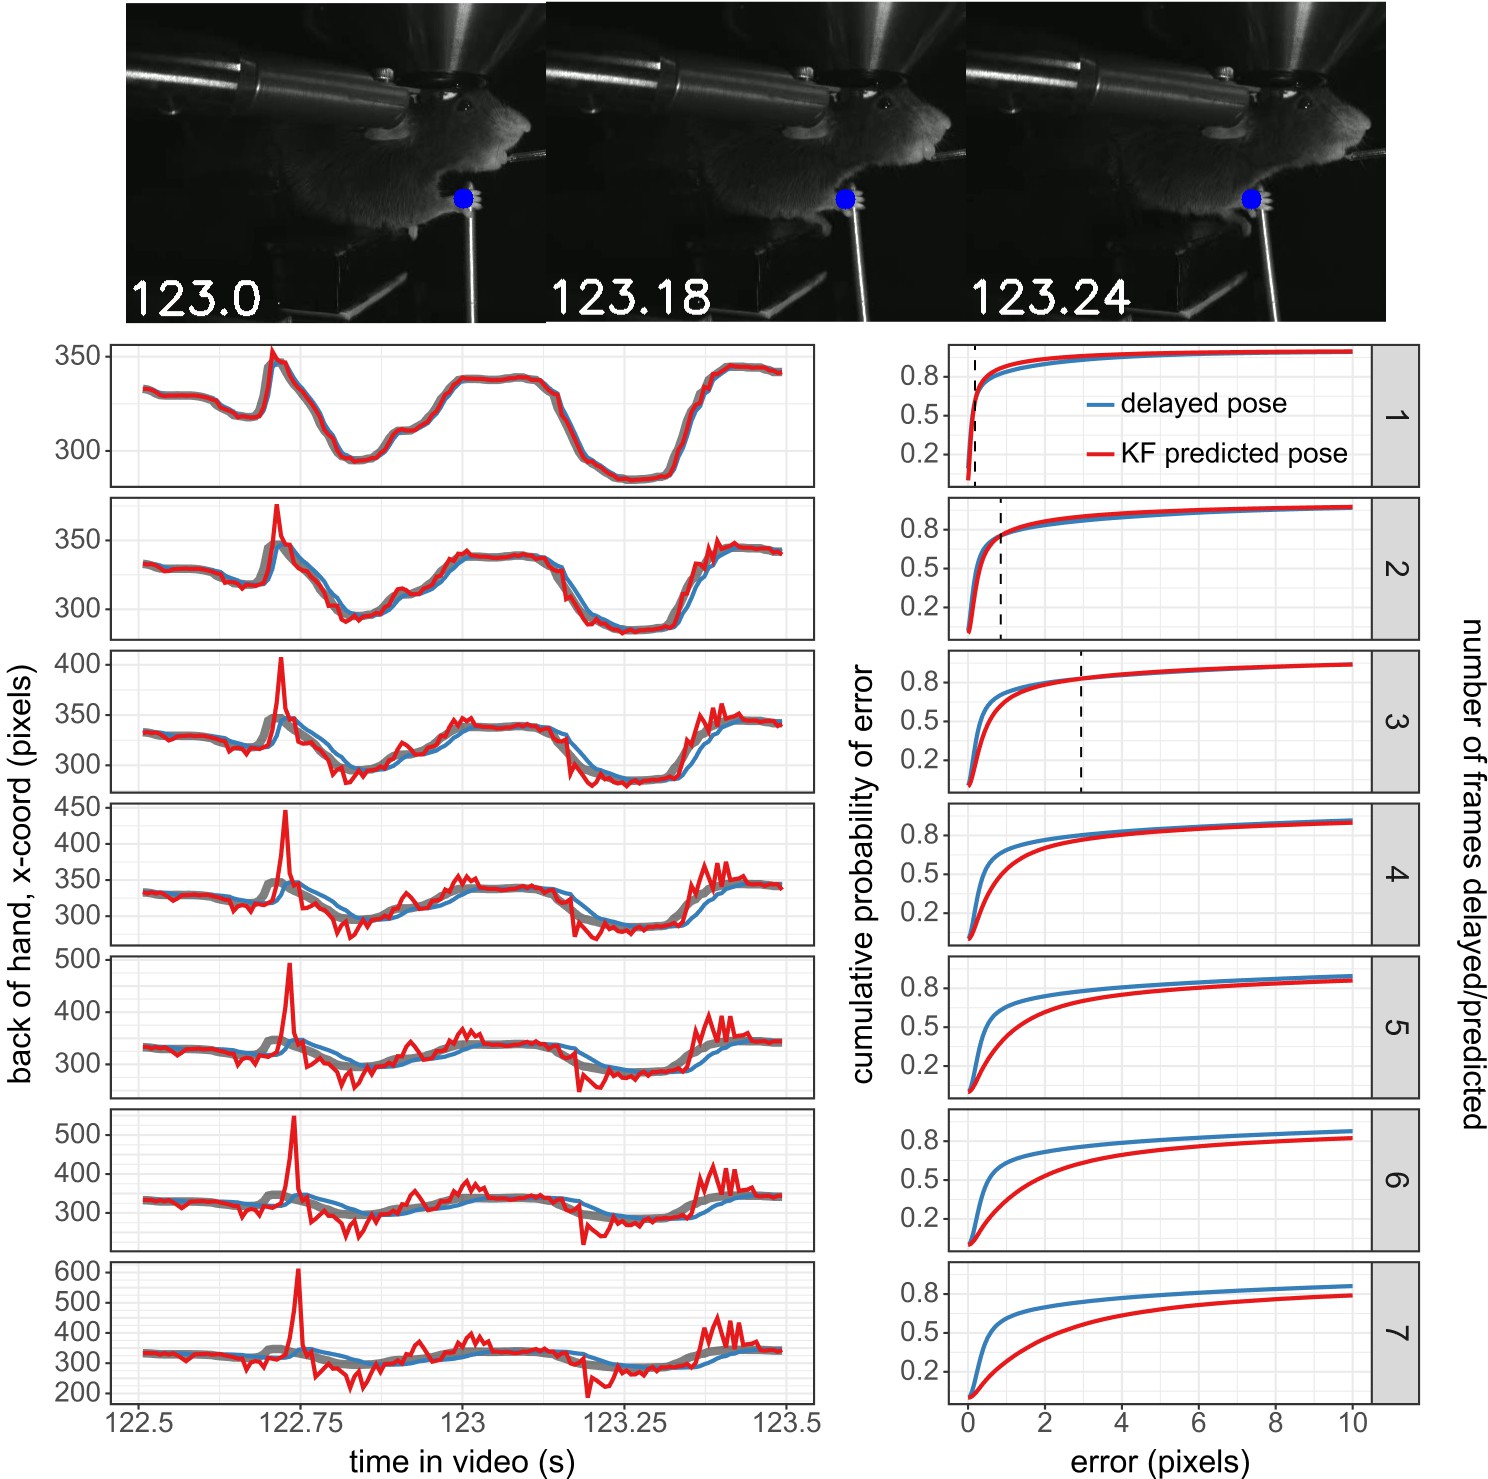
The Kalman filter predictor reduces errors when predicting up to three frames into the future in a mouse reaching task.
(Top) Images at different stages of the mouse reach, with the blue circle indicating the DeepLabCut predicted coordinate of the back of the hand. (Bottom, Left) The trajectory of the x-coordinate of the back of the mouse’s hand during the reach (pictured above). The thicker gray line indicates the trajectory measured by DLC. the blue line indicates the DLC trajectory as if it was delayed by 1–7 frames (indicated by the panel label on the right). The red line indicates the trajectory as if it were predicted 1–7 frames into the future by the Kalman filter predictor. (Bottom, Right) The cumulative distribution of errors for the back of the hand coordinate as if it were delayed 1–7 frames (blue) or as if it were predicted 1–7 frames into the future using the Kalman filter predictor (red) compared to the DLC estimated back of the hand coordinate. The dotted vertical line indicates the error at which the KF distribution intersects with the delayed pose distribution (i.e. the point at which there are more frames with this pixel error or smaller for the Kalman filter distribution than the delayed pose distribution). .
Figure 6—figure supplement 2
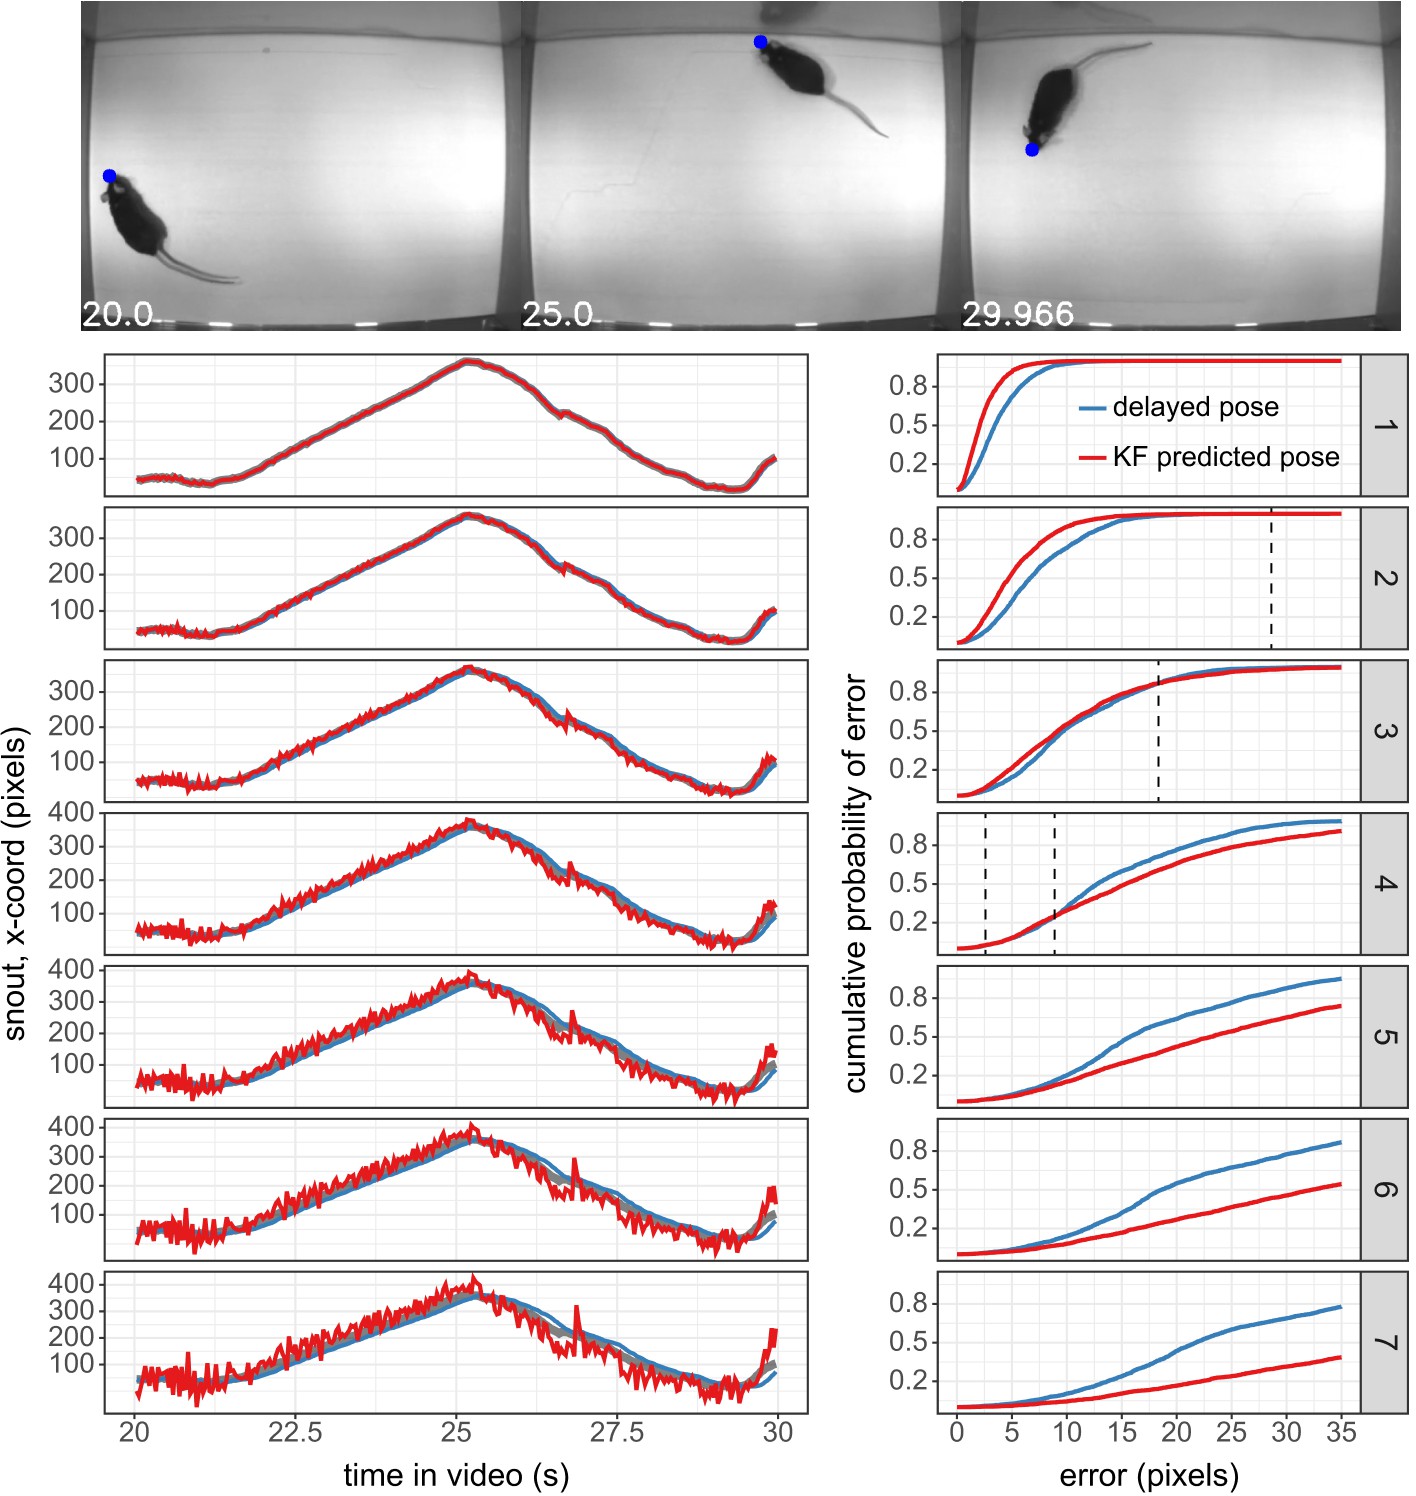
The Kalman filter predictor reduces errors when predicting up to three frames into the future in a mouse open-field task.
The Kalman filter predictor reduces errors when predicting up to three frames into the future in a mouse open-field task. (Top) Images at different stages of the mouse open field video, with the blue circle indicating the DeepLabCut predicted coordinate of the snout. (Bottom Left) The trajectory of the x-coordinate of the mouse’s snout. The thicker gray line indicates the trajectory measured by DLC. The blue line indicates the DLC trajectory as if it was delayed by 1–7 frames (indicated by the panel label on the right). The red line indicates the trajectory as if it were predicted 1–7 frames into the future by the Kalman filter predictor. (Bottom Right) The cumulative distribution of errors for the back of the hand coordinate as if it were delayed 1–7 frames (blue) or as if it were predicted 1–7 frames into the future using the Kalman filter predictor (red) compared to the DLC estimated snout coordinate. The dotted vertical line indicates the error at which the two distributions intersect (i.e. the point at which there are more frames with this pixel error or smaller for either the delayed pose or the Kalman filter distribution).
Tables
Table 1
Inference speed using the DeepLabCut-live package.
All values are mean ± standard deviation; Frames Per Second (FPS). See also: https://deeplabcut.github.io/DLC-inferencespeed-benchmark/.
| Dog video | Image size (pixels, w*h) | ||||||
|---|---|---|---|---|---|---|---|
| GPU type | DLC model | 75 × 133 | 150 × 267 | 300 × 533 | 424 × 754 | 600 × 1067 | |
| Linux | Intel Xeon CPU | MobileNetV2-0.35 | 62 ± 5 | 31 ± 1 | 14 ± 0 | 8 ± 0 | 4 ± 0 |
| (3.1 GHz) | ResNet-50 | 24 ± 1 | 11 ± 0 | 3 ± 0 | 2 ± 0 | 1 ± 0 | |
| GeForce GTX 1080 | MobileNetV2-0.35 | 256 ± 51 | 208 ± 46 | 124 ± 19 | 80 ± 9 | 43 ± 1 | |
| ResNet-50 | 121 ± 15 | 95 ± 13 | 52 ± 3 | 33 ± 1 | 19 ± 0 | ||
| TITAN RTX | MobileNetV2-0.35 | 168 ± 29 | 144 ± 20 | 133 ± 14 | 115 ± 9 | 71 ± 3 | |
| ResNet-50 | 132 ± 14 | 113 ± 11 | 82 ± 4 | 56 ± 2 | 33 ± 1 | ||
| Tesla V100-SXM2-16GB | MobileNetV2-0.35 | 229 ± 13 | 189 ± 10 | 138 ± 11 | 105 ± 6 | 64 ± 3 | |
| ResNet-50 | 169 ± 7 | 133 ± 4 | 90 ± 4 | 65 ± 2 | 42 ± 1 | ||
| Tesla P100-PCIE-16GB | MobileNetV2-0.35 | 220 ± 12 | 179 ± 9 | 114 ± 7 | 77 ± 3 | 44 ± 1 | |
| ResNet-50 | 115 ± 3 | 91 ± 2 | 59 ± 2 | 45 ± 1 | 26 ± 1 | ||
| Tesla K80 | MobileNetV2-0.35 | 118 ± 4 | 105 ± 3 | 64 ± 4 | 47 ± 2 | 26 ± 1 | |
| ResNet-50 | 58 ± 2 | 43 ± 1 | 21 ± 1 | 13 ± 0 | 7 ± 0 | ||
| Tesla T4 | MobileNetV2-0.35 | 200 ± 17 | 166 ± 13 | 117 ± 10 | 86 ± 5 | 49 ± 2 | |
| ResNet-50 | 134 ± 8 | 99 ± 5 | 51 ± 3 | 33 ± 1 | 18 ± 0 | ||
| Quadro P400 | MobileNetV2-0.35 | 105 ± 4 | 76 ± 2 | 31 ± 1 | 18 ± 0 | 10 ± 0 | |
| ResNet-50 | 24 ± 0 | 16 ± 0 | 6 ± 0 | 4 ± 0 | 2 ± 0 | ||
| Windows | Intel Xeon Silver CPU | MobileNetV2-0.35 | 28 ± 1 | 13 ± 0 | 6 ± 0 | 3 ± 0 | 1 ± 0 |
| (2.1 GHz) | ResNet-50 | 22 ± 1 | 9 ± 0 | 3 ± 0 | 2 ± 0 | 1 ± 0 | |
| GeForce GTX 1080 | MobileNetV2-0.35 | 142 ± 17 | 132 ± 14 | 98 ± 5 | 69 ± 3 | 41 ± 1 | |
| with Max-Q Design | ResNet-50 | 87 ± 3 | 77 ± 3 | 48 ± 1 | 31 ± 1 | 18 ± 0 | |
| GeForce GTX 1080 | MobileNetV2-0.35 | 128 ± 11 | 115 ± 10 | 94 ± 7 | 72 ± 3 | 41 ± 1 | |
| ResNet-50 | 101 ± 5 | 86 ± 4 | 49 ± 1 | 32 ± 1 | 18 ± 0 | ||
| Quadro P1000 | MobileNetV2-0.35 | 120 ± 11 | 108 ± 10 | 58 ± 2 | 39 ± 1 | 20 ± 0 | |
| ResNet-50 | 54 ± 2 | 38 ± 1 | 17 ± 0 | 10 ± 0 | 5 ± 0 | ||
| MacOS | Intel Core i5 CPU | MobileNetV2-0.35 | 39 ± 5 | 20 ± 2 | 11 ± 1 | 7 ± 1 | 4 ± 0 |
| (2.4 GHz) | ResNet-50 | 8 ± 1 | 4 ± 0 | 1 ± 0 | 1 ± 0 | 0 ± 0 | |
| Intel Core i7 CPU | MobileNetV2-0.35 | 117 ± 8 | 47 ± 3 | 15 ± 1 | 8 ± 0 | 4 ± 0 | |
| (3.5 GHz) | ResNet-50 | 29 ± 2 | 11 ± 1 | 3 ± 0 | 2 ± 0 | 1 ± 0 | |
| Intel Core i9 CPU | MobileNetV2-0.35 | 126 ± 25 | 66 ± 13 | 19 ± 3 | 11 ± 1 | 6 ± 0 | |
| (2.4 GHz) | ResNet-50 | 31 ± 6 | 16 ± 2 | 6 ± 1 | 4 ± 0 | 2 ± 0 | |
| Jetson | Xavier | MobileNetV2-0.35 | 68 ± 8 | 60 ± 7 | 54 ± 4 | 41 ± 1 | 25 ± 1 |
| ResNet-50 | 46 ± 1 | 34 ± 1 | 17 ± 0 | 12 ± 0 | 6 ± 0 | ||
| Tegra X2 | MobileNetV2-0.35 | 37 ± 2 | 32 ± 2 | 13 ± 0 | 7 ± 0 | 4 ± 0 | |
| ResNet-50 | 18 ± 1 | 12 ± 0 | 5 ± 0 | 3 ± 0 | 2 ± 0 | ||
| Mouse Video | image size (pixels, w*h) | ||||||
| GPU Type | DLC Model | 115 × 87 | 229 × 174 | 459 × 349 | 649 × 493 | 917 × 698 | |
| Linux | Intel Xeon CPU | MobileNetV2-0.35 | 61 ± 4 | 32 ± 1 | 15 ± 0 | 8 ± 0 | 4 ± 0 |
| (3.1 GHz) | ResNet-50 | 28 ± 1 | 11 ± 0 | 4 ± 0 | 2 ± 0 | 1 ± 0 | |
| GeForce GTX 1080 | MobileNetV2-0.35 | 285 ± 24 | 209 ± 23 | 134 ± 9 | 86 ± 2 | 44 ± 1 | |
| ResNet-50 | 136 ± 8 | 106 ± 3 | 60 ± 1 | 35 ± 0 | 19 ± 0 | ||
| TITAN RTX | MobileNetV2-0.35 | 169 ± 28 | 145 ± 19 | 152 ± 15 | 124 ± 9 | 78 ± 3 | |
| ResNet-50 | 140 ± 16 | 119 ± 11 | 92 ± 3 | 58 ± 2 | 35 ± 1 | ||
| Tesla V100-SXM2-16GB | MobileNetV2-0.35 | 260 ± 12 | 218 ± 9 | 180 ± 18 | 121 ± 8 | 68 ± 3 | |
| ResNet-50 | 184 ± 6 | 151 ± 5 | 111 ± 6 | 75 ± 3 | 47 ± 2 | ||
| Tesla P100-PCIE-16GB | MobileNetV2-0.35 | 246 ± 12 | 198 ± 7 | 138 ± 8 | 79 ± 3 | 46 ± 1 | |
| ResNet-50 | 128 ± 3 | 103 ± 2 | 70 ± 3 | 46 ± 1 | 28 ± 1 | ||
| Tesla K80 | MobileNetV2-0.35 | 127 ± 6 | 119 ± 5 | 79 ± 4 | 52 ± 2 | 28 ± 1 | |
| ResNet-50 | 60 ± 2 | 45 ± 2 | 23 ± 1 | 13 ± 0 | 7 ± 0 | ||
| Tesla T4 | MobileNetV2-0.35 | 242 ± 21 | 197 ± 16 | 156 ± 14 | 101 ± 6 | 56 ± 2 | |
| ResNet-50 | 141 ± 7 | 102 ± 5 | 57 ± 3 | 34 ± 1 | 20 ± 0 | ||
| Quadro P400 | MobileNetV2-0.35 | 114 ± 5 | 84 ± 3 | 37 ± 1 | 20 ± 0 | 10 ± 0 | |
| ResNet-50 | 25 ± 0 | 16 ± 0 | 7 ± 0 | 4 ± 0 | 2 ± 0 | ||
| Windows | Intel Xeon Silver CPU | MobileNetV2-0.35 | 28 ± 1 | 14 ± 0 | 6 ± 0 | 3 ± 0 | 1 ± 0 |
| (2.1 GHz) | ResNet-50 | 23 ± 1 | 9 ± 0 | 3 ± 0 | 2 ± 0 | 1 ± 0 | |
| GeForce GTX 1080 | MobileNetV2-0.35 | 147 ± 17 | 136 ± 15 | 108 ± 6 | 73 ± 3 | 46 ± 1 | |
| with Max-Q Design | ResNet-50 | 107 ± 5 | 93 ± 4 | 54 ± 2 | 32 ± 1 | 18 ± 0 | |
| GeForce GTX 1080 | MobileNetV2-0.35 | 133 ± 15 | 119 ± 14 | 100 ± 9 | 77 ± 3 | 43 ± 1 | |
| ResNet-50 | 110 ± 5 | 94 ± 3 | 55 ± 1 | 34 ± 1 | 19 ± 0 | ||
| Quadro P1000 | MobileNetV2-0.35 | 129 ± 13 | 115 ± 11 | 72 ± 3 | 43 ± 1 | 22 ± 0 | |
| ResNet-50 | 57 ± 2 | 41 ± 1 | 19 ± 0 | 10 ± 0 | 6 ± 0 | ||
| MacOS | Intel Core i5 CPU | MobileNetV2-0.35 | 42 ± 5 | 22 ± 2 | 12 ± 1 | 7 ± 1 | 4 ± 0 |
| (2.4 GHz) | ResNet-50 | 9 ± 1 | 4 ± 0 | 2 ± 0 | 1 ± 0 | 0 ± 0 | |
| Intel Core i7 CPU | MobileNetV2-0.35 | 127 ± 10 | 48 ± 3 | 16 ± 1 | 9 ± 1 | 4 ± 0 | |
| (3.5 GHz) | ResNet-50 | 30 ± 3 | 10 ± 2 | 3 ± 0 | 2 ± 0 | 1 ± 0 | |
| Intel Core i9 CPU | MobileNetV2-0.35 | 178 ± 15 | 74 ± 16 | 19 ± 3 | 10 ± 1 | 6 ± 0 | |
| (2.4 GHz) | ResNet-50 | 35 ± 8 | 14 ± 2 | 6 ± 1 | 4 ± 0 | 2 ± 0 | |
| Jetson | Xavier | MobileNetV2-0.35 | 79 ± 9 | 68 ± 9 | 59 ± 5 | 44 ± 2 | 27 ± 1 |
| ResNet-50 | 46 ± 2 | 36 ± 1 | 19 ± 0 | 12 ± 0 | 7 ± 0 | ||
| TX2 | MobileNetV2-0.35 | 39 ± 2 | 30 ± 2 | 18 ± 1 | 9 ± 0 | 5 ± 0 | |
| ResNet-50 | 19 ± 1 | 11 ± 0 | 6 ± 0 | 4 ± 0 | 2 ± 0 | ||
Table 2
Performance of the DeepLabCut-live-GUI (DLG).
F-P = delay from image acquisition to pose estimation; F-L = delay from image acquisition to turning on the LED; FPS (DLG) = Rate of pose estimation (in frames per second) in the DeepLabCut-live-GUI; FPS (DLCLive) = Rate of pose estimation for the same exact configuration directly tested using the DeepLabCut-live benchmarking tool. All values are mean ± STD.
| 176 × 137 pixels | 352 × 274 pixels | |||||||||
|---|---|---|---|---|---|---|---|---|---|---|
| GPU type | Mode | F-P | F-L | FPS | FPS | F-P | F-L | FPS | FPS | |
| (ms) | (ms) | (DLG) | (DLCLive) | (ms) | (ms) | (DLG) | (DLCLive) | |||
| Windows | GeForce GTX 1080 | Latency | 10 ± 1 | 11 ± 1 | 56 ± 16 | 123 ± 16 | 12 ± 2 | 12 ± 2 | 48 ± 6 | 112 ± 12 |
| Rate | 15 ± 3 | 16 ± 3 | 91 ± 11 | 16 ± 3 | 17 ± 3 | 84 ± 9 | ||||
| Linux | Quadro P400 | Latency | 11 ± 1 | 11 ± 1 | 63 ± 19 | 105 ± 4 | 20 ± 1 | 21 ± 1 | 42 ± 7 | 52 ± 1 |
| Rate | 15 ± 3 | 16 ± 3 | 93 ± 9 | 27 ± 4 | 27 ± 4 | 47 ± 4 | ||||
| Jetson | Xavier | Latency | 13 ± 1 | 14 ± 1 | 48 ± 3 | 84 ± 7 | 13 ± 1 | 14 ± 1 | 48 ± 3 | 73 ± 9 |
| Rate | 18 ± 3 | 18 ± 3 | 75 ± 5 | 18 ± 3 | 18 ± 3 | 74 ± 5 | ||||
| MacOS | CPU | Latency | 29 ± 5 | 29 ± 4 | 29 ± 5 | 62 ± 6 | 79 ± 19 | 79 ± 22 | 12 ± 2 | 21 ± 3 |
| Rate | 34 ± 7 | 35 ± 6 | 35 ± 4 | 91 ± 19 | 92 ± 22 | 12 ± 2 | ||||
Table 3
Materials for Autopilot tests.
| Tool | Version |
|---|---|
| Raspberry Pi | 4, 2 GB |
| Autopilot | 0.3.0-2f31e78 |
| Jetson | TX2 Developer Kit |
| Camera | FLIR CM3-U3-13Y3M-CS |
| Spinnaker SDK | 2.0.0.147 |
| Oscilloscope | Tektronix TDS 2004B |
Table 4
Software packages presented with this paper.
| Name | URL |
|---|---|
| DeepLabCut-Live! SDK | GitHub Link |
| Benchmarking Submission | GitHub Link |
| Benchmarking Results | Website Link |
| DLC-Live! GUI | GitHub Link |
| Bonsai - DLC Plugin | GitHub Link |
| AutoPilot - DLC | GitHub Link |
Table 5
Relevant DLC updates.
| Feature | DLC version | Pub. link |
|---|---|---|
| DLC-ResNets | 1, 2.0+ | Mathis et al., 2018b; Nath et al., 2019 |
| DLC-MobileNetV2s | 2.1+ | Mathis et al., 2020a |
| Model Export Fxn | 2.1.8+ | this paper |
| DeepLabCut-live | new package | this paper |
Additional files
Download links
A two-part list of links to download the article, or parts of the article, in various formats.
Downloads (link to download the article as PDF)
Open citations (links to open the citations from this article in various online reference manager services)
Cite this article (links to download the citations from this article in formats compatible with various reference manager tools)
Real-time, low-latency closed-loop feedback using markerless posture tracking
eLife 9:e61909.
https://doi.org/10.7554/eLife.61909


