Asynchrony between virus diversity and antibody selection limits influenza virus evolution
- Department of Ecology & Evolutionary Biology, Princeton University, United States
- Department of Human Genetics, Wellcome Trust Sanger Institute, United Kingdom
- Department of Veterinary Medicine, University of Cambridge, United Kingdom
- Department of Medical Microbiology, Academic Medical Center, University of Amsterdam, Netherlands
- Fogarty International Center, National Institutes of Health, United States
- Biozentrum, University of Basel, Switzerland
Figures
Figure 1
Empirical within-host influenza virus variant frequencies and model within-host evolutionary dynamics.
(A, B) meta-analysis of A/H3N2 viruses from next-generation sequencing studies of naturally-infected individuals (Debbink et al., 2017; McCrone et al., 2018). (A) Fraction of infections with one or more observed amino acid polymorphisms in the hemagglutinin (HA) protein, stratified by likelihood of affecting antigenicity: infections with a substitution in the ‘antigenic ridge’ of 7 key amino acid positions found by Koel et al., 2013 in red, infections with a substitution in a classically-defined ‘antigenic site’, (Wiley et al., 1981) in blue, infections with HA substitutions only in non-antigenic regions in gray, infections with no HA substitutions in cream. Infections grouped by whether individuals had been (left) vaccinated in a year that the vaccine matched the circulating strain, (center) vaccinated in a year that the vaccine did not match the circulating strain, or (right) not vaccinated. (B) Distribution of plotted polymorphic sites from (A) by within-host frequency of the minor variant. (C, D) heatmaps showing model probability of new antigenic variant selection to the NGS detection threshold of 1% (C) and to 50% (D) by 3 days post infection given the strength of immune selection , the antibody response time and a founding population composed of old variant virions. Probabilities calculated from Equation 27 in the Materials and methods. Calculated with , but for , replication selection probabilities are approximately equal for all trios that yield a given (see Materials and methods). Star denotes a plausible influenza-like parameter regime: 25% escape from sterilizing-strength immunity () with a recall response at 2.5 days post infection. Black lines are probability contours. (E–H) example model trajectories. Upper row: absolute counts of virions and target cells. Lower row: variant frequencies for old antigenic variant (blue) and new variant (red). Dashed line shows 1% frequency, the detection limit of NGS. Dotted line shows an analytical prediction for new variant frequency according to Equations 15 and 16 (see Materials and methods). Model scenarios: (E) naive; (F) experienced with ; (G) experienced with ; (H) experienced with and new antigenic variant virion incoulated. Lines faded when infection is below 5% transmission probability—approximately 107 virions with default parameters. All parameters as in Table 1 unless otherwise stated.
Figure 2
Example timecourses and distribution of outcomes when antibody immunity is active from the start of infection and sufficient to prevent detectable reinfection.
, , yielding for the old antigenic variant but for the new antigenic variant, where is the within-host effective reproduction number for variant i at time t (see Materials and methods). No mucosal antibody neutralization (); protection is only via neutralization during replication. Example timecourses from simulations with founding population (bottleneck) . Since neutralization during replication takes the place of mucosal sIgA neutralization, b here should be understood as comparable to the parameter v in models with sIgA neutralization. (A–C) Top panels: absolute abundances of target cells (green), old antigenic variant virions (blue), and new antigenic variant virions (red). Bottom panels: frequencies of virion types. Black dotted line is an analytical prediction for the new antigenic variant frequency given the time of first appearance. Black dashed line is the threshold for NGS detection. (D) Frequencies of no infection, de novo new antigenic variant infection, inoculated new antigenic variant infection, and old antigenic variant infection per 105 inoculations of an immune host by a naive host. Circles are frequencies from simulation runs (106 runs for bottlenecks 1–10, 105 runs for bottlenecks 50–200). Plus-signs are analytical model predictions for frequencies (see Appendix Section A3.6), with set equal to the average from donor-host stochastic simulations for the given bottleneck. Parameters as in Table 1 unless otherwise stated.
Figure 3
Selection for antigenic variants at the point of transmission (inoculation selection).
(A) Schematic of bottlenecks faced by both old antigenic variant (blue) and new antigenic variant (other colors) virions at the point of virus transmission. Key parameters for inoculation selection are the mucus bottleneck size v—the mean number of virions that encounter sIgA—and the cell infection bottleneck size b. (B–D) Effect of sIgA selection at the point of inoculation with . (B, C) Analytical model distribution of virions inoculated into an immune host immediately before (B) and after (C) mucosal neutralization/the sIgA bottleneck. set to mean of stochastic simulations. (D) Distribution of founding virion populations (after the cell infection bottleneck) among individuals who developed detectable new antigenic variant infections in stochastic simulations. (E–F) Analytical model probability that a variant survives the final bottleneck. Dashed horizontal lines indicate probability in naive hosts. (the approximate mean in stochastic simulations for ). (E) Variant probability of surviving all bottlenecks, as a function of old antigenic variant neutralization probability and new antigenic variant mucosal neutralization probability . (F) New antigenic variant survival probability as a function of the ratio of v to b. (G, H) Effect of host susceptibility model on the appearance of antigenic novelty. Per-inoculation rates of new variants surviving the bottleneck (H) depend on host immune status and on the relationship between virus antigenic phenotype and host susceptibility () (G). Plotted with , and 25% susceptibility to (75% protection against, ) a variant one antigenic cluster away from host memory. Unless noted, parameters for all plots as in Table 1.
Figure 4
Probability of a new variant surviving the transmission bottleneck as a function of donor-host replication selection and recipient host inoculation selection.
Calculated according to Equation 43, and plotted as a function of degree of replication selection in the donor host , the product of the selection strength and the time duration between the onset of the antibody response at and the transmission event at tt. Black dashed line: neutral (drift) expectation, where in the donor host and the recipient host does not neutralize either the old or the new variant at the point of transmission (). Purple dotted line: replication selection only: as given in the donor host, but a naive recipient host. Green solid line: inoculation selection only: in the donor host, but a recipient host with well-matched antibodies to the old variant (), with varying degrees of immune escape ( as given in the columns). Red dot-dashed line: combination of both replication selection in the donor host as before and inoculation selection in the recipient host as before. Plotted with a final bottleneck of and a mean of v virions encountering sIgA as given in the rows. Parameters as in Table 1 unless otherwise noted.
Figure 5
Distribution of mutant effects given replication and inoculation selection.
Distribution of antigenic changes along 1000 simulated transmission chains (A–D) and from an analytical model (E–H). In (A,E) all naive hosts, in other panels a mix of naive hosts and experienced hosts. Antigenic phenotypes are numbers in a 1-dimensional antigenic space and govern both sIgA cross immunity and replication cross immunity c. A distance of corresponds to no cross immunity between phenotypes and a distance of 0 to complete cross immunity. Gray line gives the shape of Gaussian within-host mutation kernel. Histograms show frequency distribution of observed antigenic change events and indicate whether the change took place in a naive (gray) or experienced (green) host. In (B–D) distribution of host immune histories is 20% of individuals previously exposed to phenotype −0.8, 20% to phenotype −0.5, 20% to phenotype 0 and the remaining 40% of hosts naive. In (E), naive hosts inoculate naive hosts. In (F–H) hosts with history −0.8 inoculate hosts with history −0.8. Initial variant has phenotype 0 in all sub-panels. Model parameters as in Table 1, except . Spikes in densities occur at 0.2 as this is the point of full escape in a host previously exposed to phenotype −0.8.
Figure 6
Population-level antigenic dynamics resulting from inoculation selection.
Analytical model results (see Materials and methods) for population-level inoculation selection, using parameters in Table 1 and unless otherwise stated. (A) Probability per inoculation of a new antigenic variant founding an infection, as a function of fraction of hosts previously exposed to the infecting old antigenic variant virus, mucus bottleneck size v and sIgA cross immunity . Red solid lines: . Purple dotted lines: . (B) Expected per-capita reinoculations of previously exposed hosts during an epidemic, given the fraction of previously exposed hosts in the population, if all hosts that were previously exposed to the circulating old antigenic variant virus are fully immune to that variant, for varying population-level basic reproduction number . (C) Probability per individual host that a new antigenic variant founds an infection in that host during an epidemic, as a function of the fraction of hosts previously exposed to the old antigenic variant. Other hosts naive. . Red solid lines: ; purple dotted lines: (as in A).
Figure 7
Variant within-host frequency as a function of time and initial variant frequency, according to derived replicator equation (Equations 13, 15).
(A, B) Variant frequency over time for an initially present new variant. (A) Selection strength varied, with initial frequency f0 equal to the mutation rate . (B) Initial frequency f0 varied, with . (C, D) Variant frequency over time when antigenic selections begins at days after first variant emergence, with ongoing mutation prior to that point. (C) varied and f0 fixed as in (A); (D) f0 varied and fixed as in (B). Parameters as in Table 1 unless otherwise noted.
Figure 8
Comparison of analytically calculated cumulative distribution function (CDF) for time of first successful de novo mutation with simulations.
Black line shows analytically calculated CDF. Blue cumulative histogram shows distribution of new variant mutation times for 250,000 simulations from the stochastic within-host model with (A) an immediate recall response () and (B) a realistic recall response at 48 hr post-infection (). Other model parameters as in Table 1. Note that time of first successful mutation tends to be later with an immediate recall response than with a delayed recall response. This occurs because the cumulative number of viral replication events grows more slowly in time at the start of the infection because of the strong, immediate recall response.
Figure 9
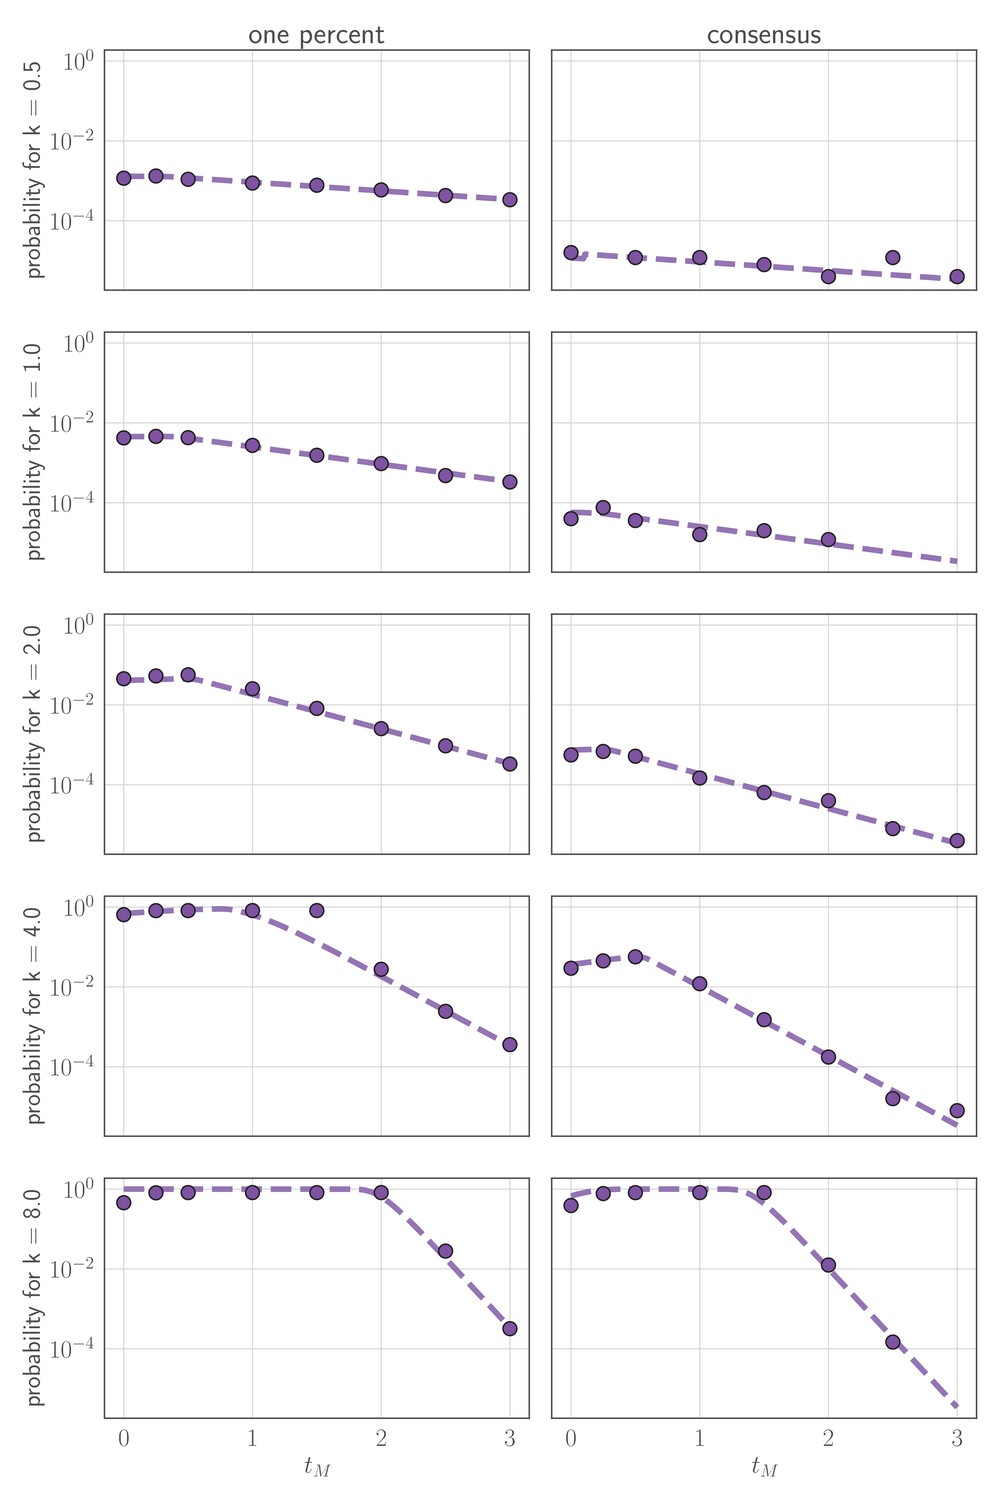
Comparison of analytically calculated probability of replication selection with stochastic simulations.
Probability of replication selection to one percent (left column) or consensus (right column) by days post-infection as a function of k and for 250,000 simulations from the stochastic within-host model. (so the fitness difference ). Other model parameters as parameters in Table 1. Dashed lines show analytical prediction and dots show simulation outcomes.
Appendix 1—figure 1
Probability that a new variant is present after the cell infection (final) bottleneck as a function of cross immunity and degree of competition for the final bottleneck.
Probability shown as a function of probability of no old variant infection (zw), degree of cross immunity between mutant and new variant , mucus bottleneck size v, and final bottleneck size b. Gray dotted line indicates probability that a new variant survives the transmission bottleneck in a host who is naive both to the old variant and to the new variant (i.e. drift). , a typical value for a naive transmitting host in stochastic simulations.
Appendix 1—figure 2
Distribution of mutant effects given replication and inoculation selection, with a transmission threshold model.
Threshold version of Figure 4. Distribution of antigenic changes along 1000 simulated transmission chains (A–D) and from an analytical model (E–H). In (A,E) all naive hosts, in other panels a mix of naive hosts and experienced hosts. Antigenic phenotypes are numbers in a 1-dimensional antigenic space and govern both sIgA cross immunity, , and replication cross immunity, A distance of corresponds to no cross immunity between phenotypes and a distance of 0 to complete cross immunity. Gray line gives the shape of Gaussian within-host mutation kernel. Histograms show frequency distribution of observed antigenic change events and indicate whether the change took place in a naive (gray) or experienced (green) host. In (B–D) distribution of host immune histories is 20% of individuals previously exposed to phenotype −0.8, 20% to phenotype −0.5, 20% to phenotype 0 and the remaining 40% of hosts naive. In (E), naive hosts inoculate naive hosts. In (F–H) hosts with history −0.8 inoculate hosts with history −0.8. Initial variant has phenotype 0 in all sub-panels. Model parameters as in Table 1, except . Spikes in densities occur at 0.2 as this is the point of full escape in a host previously exposed to phenotype −0.8.
Appendix 1—figure 3

Sensitivity analysis varying model parameters across biologically-reasonable parameter ranges.
(A, B) Probability of a detectable infection per inoculation of an experienced host. (C, D) Probability of a detectable new variant infections per inoculation of an experienced host. (E, F) Fraction of detectable infections of experienced hosts that are new variant infections. Points colored according to whether new variant infections were more frequently caused by de novo generated (purple) or inoculated (green) new variant viruses. Each point represents a random parameter set; 10 random parameter sets generated for each bottleneck value shown, and 50,000 inoculations of an experienced host simulated for each parameter set. Two regimes of simulated parameter set shown: (A, C, E) an immediate recall response regime, in which varied from 0 to 1, and (B, D, F) a realistically-timed response regime, in which varied from 2 to 4.5. All other parameters varied across the same ranges in both regimes (see Table 2 for ranges). Parameters Latin Hypercube sampled from within ranges for each regime and bottleneck size.
Appendix 1—figure 4
Sensitivity analysis: parameter values versus rate of new variant infections per 100 detectable infections of an experienced host, given an unrealistically early recall response.
Parameters randomly varied across the ranges given in Table 2, with varied between 0 and 1. Each point represents a parameter set; the rate of new variant infections per hundred 100 detectable infections is estimated from 50,000 simulated inoculations of an experienced host. A new variant infection is defined as one in which the new variant reached a transmissible frequency of at least 1% at any point in the infection. Points are colored according to whether new variant infections were more frequently caused by de novo generated (purple) or inoculated (green) new variant viruses.
Appendix 1—figure 5
Sensitivity analysis: parameter values versus rate of new variant infections per 100 detectable infections of an experienced host given a realistic (48 hours or more post-infection) recall response.
Parameters randomly varied across the ranges given in Table 2, with varied between 2 and 4.5. Each point represents a parameter set; the rate of new variant infections per hundred 100 detectable infections is estimated from 50,000 simulated inoculations of an experienced host. A new variant infection is defined as one in which the new variant reached a transmissible frequency of at least 1% at any point in the infection. Points are colored according to whether new variant infections were more frequently caused by de novo generated (purple) or inoculated (green) new variant viruses.
Appendix 1—figure 6
Phylogeny of A/H1N1 seasonal viruses for the period 1999 to 2008.
Branch tip color indicates the amino acid identity at position 140. Co-circulating lineages defined by the K140E fixation are highlighted. Scale bar indicates the number of nucleotide substitutions per site. Tree rooted to A/New Caledonia/20/1999.
Appendix 1—figure 7
Phylogeny of A/H3N2 seasonal viruses for the period 2008 to 2011.
Branch tip color indicates the amino acid identity at position 158 and 189. Co-circulating lineages defined by the K158N/N189K fixation are highlighted. Scale bar indicates the number of nucleotide substitutions per site. Tree rooted to A/Brisbane/10/2007.
Appendix 1—figure 8
Phylogeny of A/H3N2 seasonal viruses for the period 2012 to 2014.
Branch tip color indicates the amino acid identity at position 159. Co-circulating lineages defined by the F159X fixation are highlighted. Scale bar indicates the number of nucleotide substitutions per site. Tree is rooted to A/Perth/16/2009.
Tables
Table 1
Model parameters, default values, and sources/justifications.
| Parameter | Meaning | Units | Value | Source or justification |
|---|---|---|---|---|
| time post-infection of antibody response in experienced hosts | days | 2 | literature (see review in Appendix Section A2) | |
| time post-infection of a novel immune response to the old antigenic variant | days | 6 | literature (see review in Appendix Section A2) | |
| per-capita growth rate of target cells at low density | 0 | ignored on the timescale of a single infection | ||
| maximum number of target cells | cells | 4 × 10⁸ | standard in the modeling literature (Baccam et al., 2006; Luo et al., 2012; Hadjichrysanthou et al., 2016) | |
| within-host basic reproduction number for the virus | unitless | 5 | empirical fits of target cell models (Hadjichrysanthou et al., 2016) | |
| average number of infectious virions produced by a cell infected with old antigenic variant virus | virions | 100 | literature (Frensing et al., 2016) | |
| average number of infectious virions produced by a cell infected with new antigenic variant virus | virions | 100 | no within-host deleteriousness for new antigenic variants | |
| probability of mutation from old variant to new variant | unitless | 0.33 × 10⁻⁵ | literature (Nobusawa and Sato, 2006) | |
| probability of mutation from new variant to old variant | unitless | 0 | back-mutation neglected | |
| rate of infectious contact between virions and target cells per cell per virion | calculated | from | ||
| number of target cells lost per infectious contact | cells | 1 | one cell lost per cell infection | |
| exponential decay rate of infectious virions | 4 | empirical fits of target cell models (Hadjichrysanthou et al., 2016) and modeling literature (Baccam et al., 2006Luo et al., 2012) | ||
| additional per-virion neutralization rate in the presence of a well-matched antibody response | 6 | varied to test hypotheses | ||
| fractional cross reactivity during viral replication between host antibodies and the old antigenic variant | unitless | 0 or 1 | naive or homotypically reinfected hosts | |
| fractional cross reactivity during viral replication between host antibodies and the new antigenic variant | unitless | 0 | full escape variant | |
| probability that an individual old antigenic variant virion inoculated into an experienced host is neutralized in the respiratory tract mucosa | unitless | set from | calculated from Equation 38 | |
| probability that an individual new antigenic variant virion inoculated into an experienced host is neutralized in the respiratory tract mucosa | unitless | reduced relative to by immune escape | ||
| fractional cross immunity at the sIgA bottleneck between old antigenic variant and new antigenic variant | unitless | 0 | full escape variant | |
| number of virions encountering sIgA | virions | 10 × b | ||
| size of final/cell infection bottleneck | virions | 1 | NGS studies (McCrone et al., 2018; Xue and Bloom, 2019) | |
| viral load at which there is a fifty percent transmission probability | virions | 108 | chosen to give realistic transmission window (Tsang et al., 2015) and based on prior modeling studies (Russell et al., 2012) | |
| transmission threshold for threshold model | virions | 107 | chosen to be consistent with |
Table 2
Sensitivity analysis parameter ranges shared between models.
| Parameter | Minimum value | Maximum value |
|---|---|---|
| 6 | 9 | |
| 108 | 109 | |
| 5 | 15 | |
| r | 10 | 500 |
| 0.33 × 10⁻⁶ | 0.33 × 10⁻⁴ | |
| dv | 2 | 8 |
| k | 3 | 16 |
| cm | 0.5 | 1 |
| zw | 0.70 | 0.99 |
| 0.5 | 0.9 | |
| 107 | 109 | |
| 1 | 50 |
Appendix 1—table 1
Dataset composition.
| A/H1N1 1999–2008 | A/H3N2 2008–2011 | A/H3N2 2012–2014 | |||
|---|---|---|---|---|---|
| Pre-filter | Final dataset | Pre-filter | Final dataset | Pre-filter | Final dataset |
| 4882 | 3514 | 7050 | 5738 | 11970 | 10107 |
Appendix 1—table 2
Substitutions that characterize the co-circulating K140E-defined lineages.
| Lineage | Geographic composition in first year of co-circulation | Trunk substitutions from MRCA to K140E fixation | Trunk substitutions post- K140E fixation |
|---|---|---|---|
| 1 | South Asia | Y94H, R188K, E273K | D35N, K145R*, A189T, G185V, N183S, G185S |
| 2 | East Asia | Y94H, S36N, A189T, R188M, T193K* | N244S, K82R*, I47K, E68G |
| 3 | South-East Asia | Y94H, K73R, V128A*, A128T* | P270S |
Appendix 1—table 3
Substitutions that characterize the co-circulating genetic / antigenic clades defined by K158N and N189K.
| Lineage | Trunk substitutions from MRCA to K158N/N189K fixation | Trunk substitutions post- K158N/N189K fixation |
|---|---|---|
| 1 (Victoria / 2009-like) | T212A, S45N, T48A, K92R, Q57H, A198S, V223I, N312S, N278K,Q33R, N145S, G5E, E62V, D53N, E280A, I230V, Y94H, I192T, S199A | |
| 2 (Perth / 2009-like) | E62K | N144K, R261Q, I260M, P162S, E50K, V213A, N133D, T212A, R142G |
Appendix 1—table 4
Substitutions that characterize the co-circulating genetic / antigenic clades defined by F159Y and F159S.
| Lineage | Trunk substitutions from MRCA to F159X fixation | Trunk substitutions post- F159X fixation |
|---|---|---|
| F159Y (lineage 1, Clade 3C.2a) | L3I, N225D, Q311H, N144S, K160T | R142K, R261L |
| F159S (lineage 2, Clade 3C.3a) | R142G, T128A, A138S, N225D |
Additional files
Download links
A two-part list of links to download the article, or parts of the article, in various formats.
Downloads (link to download the article as PDF)
Open citations (links to open the citations from this article in various online reference manager services)
Cite this article (links to download the citations from this article in formats compatible with various reference manager tools)
Asynchrony between virus diversity and antibody selection limits influenza virus evolution
eLife 9:e62105.
https://doi.org/10.7554/eLife.62105


