Heterochromatin-dependent transcription of satellite DNAs in the Drosophila melanogaster female germline
- Department of Biomedical Genetics, University of Rochester Medical Center, United States
- Department of Biology, University of Rochester, United States
Abstract
Large blocks of tandemly repeated DNAs—satellite DNAs (satDNAs)—play important roles in heterochromatin formation and chromosome segregation. We know little about how satDNAs are regulated; however, their misregulation is associated with genomic instability and human diseases. We use the Drosophila melanogaster germline as a model to study the regulation of satDNA transcription and chromatin. Here we show that complex satDNAs (>100-bp repeat units) are transcribed into long noncoding RNAs and processed into piRNAs (PIWI interacting RNAs). This satDNA piRNA production depends on the Rhino-Deadlock-Cutoff complex and the transcription factor Moonshiner—a previously described non-canonical pathway that licenses heterochromatin-dependent transcription of dual-strand piRNA clusters. We show that this pathway is important for establishing heterochromatin at satDNAs. Therefore, satDNAs are regulated by piRNAs originating from their own genomic loci. This novel mechanism of satDNA regulation provides insight into the role of piRNA pathways in heterochromatin formation and genome stability.
Introduction
Repetitive DNA makes up a large fraction of eukaryotic genomes (Britten and Kohne, 1968). Most repeat-dense genomic regions are gene-poor and tightly packed into heterochromatin (reviewed in Allshire and Madhani, 2018; Janssen et al., 2018). Tandem arrays of repeated sequences called satellite DNAs (satDNAs) are abundant in the heterochromatin of the pericentromeres, subtelomeres, and on sex chromosomes (Charlesworth et al., 1994; Schmidt, 1998; Schueler et al., 2001). SatDNAs are typically viewed as selfish genetic elements that can spread rapidly in genomes and are generally repressed (Doolittle and Sapienza, 1980; Orgel and Crick, 1980). The de-repression of satDNA is associated with cellular senescence and various cancers (e.g., Ting et al., 2011; Zhu et al., 2011). However, satDNAs play roles in chromatin structure, chromosome segregation, and genome stability across a wide range of taxa (Weiler and Wakimoto, 1995; Dernburg et al., 1996; Lippman et al., 2004; Bouzinba-Segard et al., 2006; Zhu et al., 2011; Swanson et al., 2013; Plohl et al., 2014; Rošić et al., 2014). SatDNA-derived transcripts have been detected in many species (Ugarkovic, 2005; Usakin et al., 2007; Biscotti et al., 2015; Ferreira et al., 2015). In insects, these transcripts may have roles in early embryos (Pathak et al., 2013; Halbach et al., 2020) and spermatogenesis (Mills et al., 2019). Across organisms, satDNA-derived transcripts may generally be important for maintaining genome stability and integrity, yet the regulation and function of these transcripts remains poorly understood (reviewed in Janssen et al., 2018).
Insights might come from the small RNA pathways that protect genome integrity by silencing repeats. These RNA interference pathways play roles in heterochromatin formation and maintenance at repeats across species (Hall et al., 2002; Volpe et al., 2002; Fukagawa et al., 2004; Noma et al., 2004; Verdel et al., 2004; Novo et al., 2020). In these pathways, small RNAs guide Argonaute proteins to cleave mRNA or silence genomic DNA by targeting complementary sequences (Hutvagner and Simard, 2008). Among the most abundant types of repeat-derived small RNAs in animal germlines are the 23–32-nt PIWI-interacting RNAs (piRNAs) that target transposable elements (TEs)—genomic parasites that mobilize and can cause genome instability (Aravin et al., 2006; Girard et al., 2006; Grivna et al., 2006; Lau et al., 2006; Brennecke et al., 2007; Houwing et al., 2007). These piRNAs are particularly well-studied in Drosophila ovaries. The piRNA precursors are transcribed from discrete genomic loci containing primarily truncated TE sequences, called piRNA clusters. The piRNAs derived from these loci repress TE activity through both post-transcriptional (Brennecke et al., 2007; Gunawardane et al., 2007) and transcriptional silencing. In ovaries, piRNAs guide Piwi to genomic locations with complementary nascent RNAs and recruit heterochromatin factors to silence TEs (Wang and Elgin, 2011; Sienski et al., 2012; Le Thomas et al., 2013; Rozhkov et al., 2013).
There are two main types of piRNA sources in Drosophila ovaries—uni-strand and dual-strand piRNA clusters. Uni-strand piRNA clusters require promoter sequences and are either expressed only in somatic tissues (e.g., flamenco) or in both somatic tissues and the germline (e.g., 20A) (Brennecke et al., 2007; Malone et al., 2009; Mohn et al., 2014). However, most piRNA clusters are heterochromatic dual-strand clusters, which are bidirectionally transcribed and do not necessarily require promoters (e.g., 42AB, 80F, and 38C1/2; Brennecke et al., 2007; Mohn et al., 2014; Andersen et al., 2017). Dual-strand piRNA clusters are expressed primarily in the germline, where their transcription is licensed by a non-canonical pathway that depends on the heterochromatin protein-1 (HP1) variant called Rhino (Rhi) (Klattenhoff et al., 2009; Zhang et al., 2014). Rhi recruits Deadlock (Del), an unstructured linker protein (Wehr et al., 2006; Czech et al., 2013), and Cutoff (Cuff), a protein related to the yeast Rai1 decapping enzyme (Pane et al., 2011), to H3K9me3 chromatin. This complex is referred to as the Rhino, Deadlock, and Cutoff (RDC) protein complex (Mohn et al., 2014). Moonshiner (Moon)—a paralog of the transcription factor TFIIA-L—interacts with Del and recruits TBP-related factor 2 (TRF2) to initiate transcription of dual-strand piRNA clusters (Andersen et al., 2017). Most piRNA studies in Drosophila focus on their important role in repressing TE activity to protect genome integrity (e.g., Brennecke et al., 2007). Given that TEs and satDNAs both are abundant repeats in heterochromatin whose activities are associated with genomic instability, we suspect that satDNAs may also be regulated by this piRNA pathway.
Consistent with our hypothesis, small RNAs derived from satDNAs exist in germlines (e.g., Aravin et al., 2003; Saito et al., 2006). However, little is known about these satDNA-derived small RNAs. Here we leverage publicly available RNA-seq and ChIP-seq datasets and complement these data with cytological and molecular analyses of expression to study the regulation of satDNAs in the germline. SatDNAs are categorized based on their repeat unit size as simple (1–10 bp) or complex (>100 bp). We focus on two abundant families of complex satDNA in Drosophila melanogaster: Responder (Rsp) and satellites in the 1.688 g/cm3 family (1.688). We show that complex satDNAs are expressed and processed primarily into piRNAs in both testes and ovaries. In ovaries, this expression depends on the RDC complex and Moon. Disruptions of the piRNA pathway lead to a loss of both satDNA-derived piRNAs and heterochromatin marks at satDNA loci. Our analyses suggest a model where the establishment of heterochromatin at satDNA is regulated by piRNAs originating from their own genomic loci. These findings add insight into the role of piRNA pathways in heterochromatin formation and genome stability.
Results and discussion
SatDNA transcripts originate primarily from large heterochromatic satDNA blocks
To study satDNA expression patterns, we characterized transcripts from two representative complex satDNA families in D. melanogaster—Rsp and 1.688—across tissues and developmental time points. Rsp consists of a dimer of two closely related ~120 bp repeats in the pericentric heterochromatin on chromosome 2R of D. melanogaster (Wu et al., 1988; Pimpinelli and Dimitri, 1989). The 1.688 family of repeats is the most abundant complex satDNA in D. melanogaster (Lohe and Roberts, 1988). It comprises different subfamilies that exist as discrete tandem arrays in the pericentric heterochromatin named after their repeat unit sizes on chromosome 2L (260-bp), chromosome 3L (353-bp and 356-bp), and the X chromosome (359-bp) (Losada and Villasante, 1996; Abad et al., 2000). Because there is high sequence similarity among these repeats, we analyzed all 1.688 subfamilies together unless stated otherwise.
We mined modENCODE datasets (Supplementary file 1 and Graveley et al., 2011; Brown et al., 2014) and found evidence for satDNA expression in total RNA-seq datasets from both sexes and across different developmental stages (Figure 1, Figure 1—figure supplement 1). Both satDNA families are expressed in gonads, head, and other tissues (Figure 1A, Figure 1—figure supplement 1C). Their transcript abundance is low (RPMRsp < 10 and RPM1.688 < 300; Supplementary file 2) and generally increases throughout development and with adult age (Figure 1—figure supplement 1A, B). SatDNA-derived reads have very low abundance in the poly-A selected RNA-seq data (RPMRsp < 0.2 and RPM1.688 < 10; Supplementary file 2), indicating that the majority of satDNA transcripts are not polyadenylated.
Figure 1 with 2 supplements see all
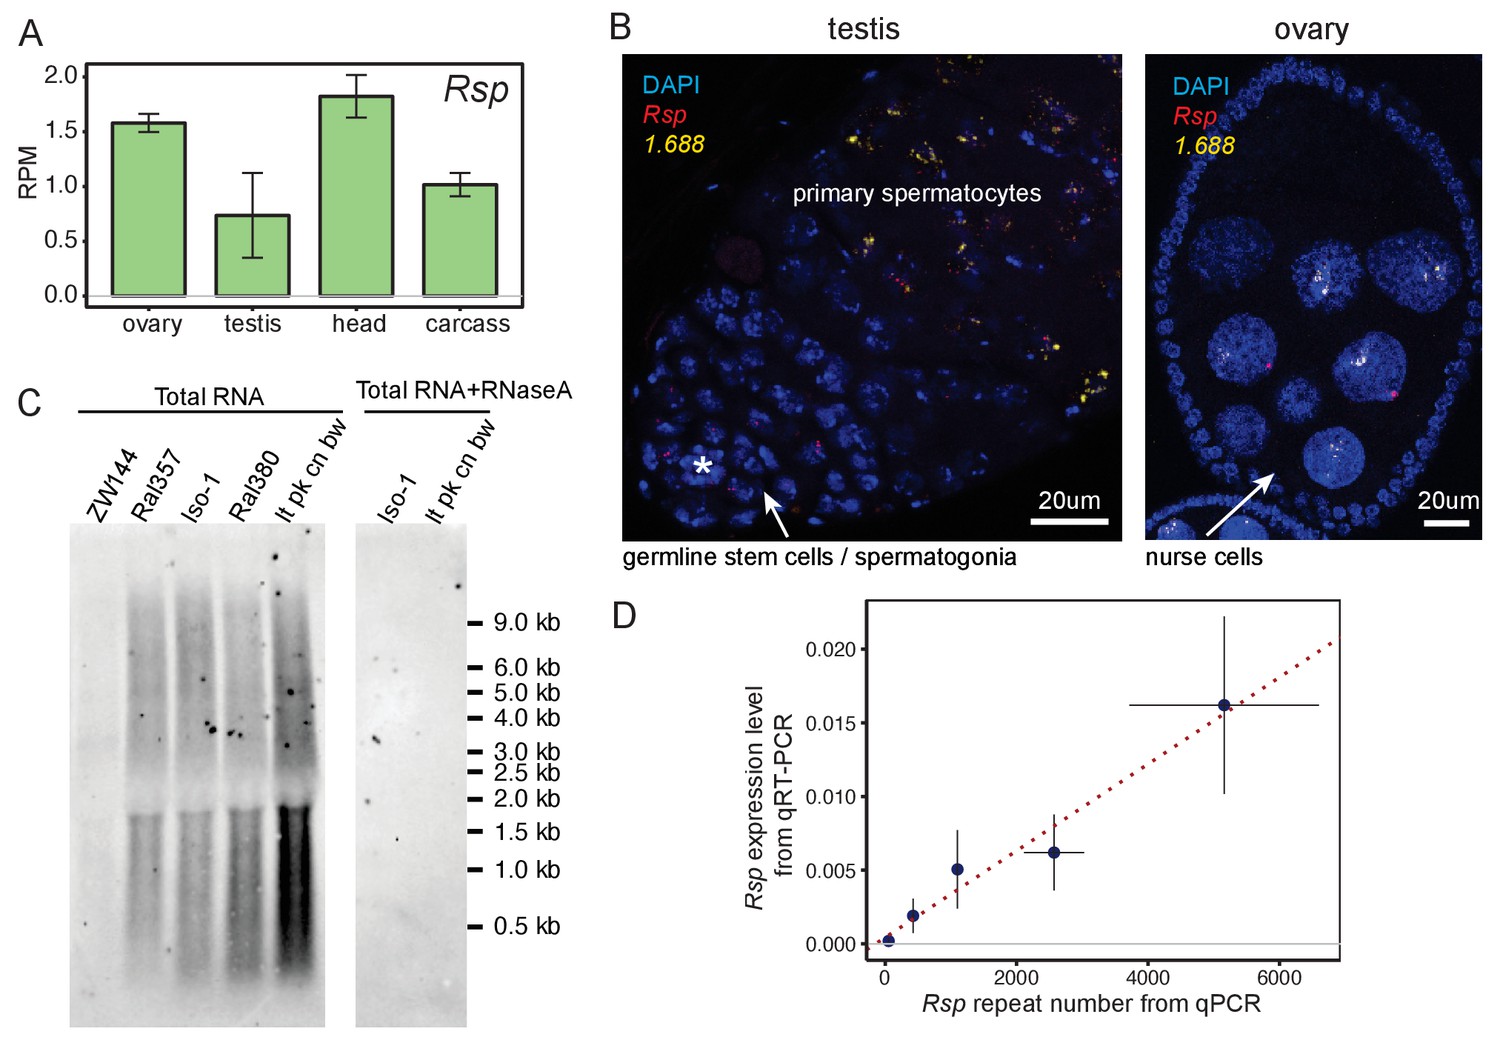
Satellite DNAs (satDNAs) are expressed in ovaries and testes.
(A) Rsp satDNA transcription level in various tissues (corresponding result for 1.688 is shown in Figure 1—figure supplement 1C). Carcass: whole body without the head, reproductive organs, and digestive tract. Source data in Figure 1—source data 1. (B) RNA fluorescence in situ hybridization shows evidence for Rsp and 1.688-derived transcripts in testes and ovaries; asterisk indicates the hub. The probe for 1.688 recognizes all 1.688 subfamilies except for 260-bp on chromosome 2L. (C) Northern blot probed with Rsp. Total RNA was extracted from ovaries of fly lines with varying copy numbers of Rsp: ZW144 (200 copies), Ral357 (600 copies), Iso-1 (1100 copies), Ral380 (2300), and lt pk cn bw (4100). There is no signal after RNaseA treatment. Signal quantification (shown in Figure 1—figure supplement 1D) shows Rsp transcript abundance correlates with its genomic copy number (Pearson’s correlation coefficient r2 = 0.93, p-value=0.02). (D) qPCR and qRT-PCR quantification of Rsp copy number and expression level, respectively, of strains used in northern blot. A linear regression line is shown in the plot with red dotted line (Pearson’s correlation coefficient r2 = 0.98, p-value=0.003). Details for (C) and (D) in Supplementary file 4.
-
Figure 1—source data 1
Satellite DNAs (SatDNA) transcription level in various developmental stages and tissues.
Related to Figure 1A and Figure 1—figure supplement 1A–C.
- https://cdn.elifesciences.org/articles/62375/elife-62375-fig1-data1-v2.xlsx
To validate the presence of satDNA-derived transcripts in gonads, we used RNA fluorescence in situ hybridization (FISH). Both Rsp and 1.688 satellite transcripts are visible in testes and ovaries (Figure 1B, Figure 1—figure supplement 2A). These signals are undetectable after treating with RNaseA prior to probe hybridization (Figure 1—figure supplement 2B), which degrades single-stranded RNAs, or RNaseH post-probe hybridization (Figure 1—figure supplement 2C), which degrades the RNA in DNA-RNA hybrids. This suggests that these signals are from RNA rather than DNA. We detected satDNA transcript foci in ovarian nurse cells and in pre-meiotic testicular germ cells. Interestingly, in testes we detected Rsp signal at earlier stages of spermatogenesis (i.e., germline stem cells/spermatogonia) than the 1.688 signals (i.e., primary spermatocytes; Figure 1B). The difference in timing is notable as Rsp is the specific target of Segregation Distorter (SD; Sandler et al., 1959): a well-known male meiotic drive system that causes a defect in post-meiotic germ cells (reviewed in Larracuente and Presgraves, 2012). Rsp transcription may therefore play some specific role in the male germline distinct from other complex satDNA.
The bulk of satDNAs are found in large blocks of tandem repeats in the heterochromatin with small blocks occurring in the euchromatin (Waring and Pollack, 1987; DiBartolomeis et al., 1992; Kuhn et al., 2012; Sproul et al., 2020). Some of the euchromatic (Menon et al., 2014; Joshi and Meller, 2017; Deshpande and Meller, 2018) and heterochromatic loci in the 1.688 family (Usakin et al., 2007) are transcribed. To determine if satDNA-derived transcripts originating from large heterochromatic loci is a general feature of other complex satDNAs, we examined transcript size and abundance in total RNA from ovaries of flies that vary in Rsp repeat copy number (Supplementary file 3; Khost et al., 2017). We determined that, while transcript lengths were similar among these lines—ranging between <300 nt and >9000 nt (Figure 1C)—the abundance of Rsp transcripts correlated with genomic copy number (Figure 1—figure supplement 1D and Supplementary file 4, Pearson’s correlation coefficient r2 = 0.93, p-value=0.02). We validated these hybridization results using qPCR and qRT-PCR to quantify Rsp genomic DNA and RNA transcript abundance, respectively (Figure 1D and Supplementary file 4, Pearson’s correlation coefficient r2 = 0.98, p-value=0.003). The correlation between genomic copy number and transcript abundance is consistent with most transcripts originating from the large blocks of heterochromatic satDNA.
SatDNA transcripts are processed into piRNAs in Drosophila germline
Many different repeat-derived transcripts are processed into piRNAs (Aravin et al., 2003; Saito et al., 2006; Brennecke et al., 2007) and endo-siRNAs (Czech et al., 2008; Ghildiyal et al., 2008; Okamura et al., 2008; Menon et al., 2014). To ask if complex satDNA-derived RNAs are processed into small RNAs, we reanalyzed published small RNA-seq data (Supplementary file 1; Ghildiyal et al., 2010; Rozhkov et al., 2010; Fagegaltier et al., 2014; Mohn et al., 2014; Quénerch'du et al., 2016; Andersen et al., 2017; Parhad et al., 2017). We indeed detected satDNA-derived small RNAs in testes and ovaries (Figure 2—figure supplement 1A, B). Our results suggest that the majority of these satDNA-derived small RNAs are piRNAs. First, these small RNAs are abundant in testes and ovaries, and their size distribution is typical for piRNA populations: an average of 90% of the RNAs range from 23 nt to 28 nt, with a peak at 24–26 nt in D. melanogaster (Brennecke et al., 2007; Figure 2A for Rsp and Figure 2—figure supplement 1C for 1.688). Second, the satDNA-derived small RNAs bear a signature of the piRNA-guided RNA cleavage process called the ping-pong cycle. piRNAs amplified through ping-pong have a 10 nt overlap of antisense-sense piRNAs with a preference of uridine at the 5′ end (1U) or adenosine at nucleotide position 10 (10A) (Brennecke et al., 2007; Gunawardane et al., 2007). Our analysis of the ovary small RNA-seq data (Mohn et al., 2014; Andersen et al., 2017; Parhad et al., 2017) confirms a ping-pong signature for satDNA-derived small RNAs: Z-score = 4.55 for Rsp and 6.85 for 1.688 satellite (Figure 2—figure supplement 1E, G) and ~60–80% have 1U/10A (Figure 2—figure supplement 1D, F). Third, satDNA-derived small RNAs are bound by the PIWI proteins, as expected for piRNAs. Our reanalysis of published Piwi, Aubergine (Aub), and Argonaute3 (Ago3) RIP-seq data from ovaries (Brennecke et al., 2007; Mohn et al., 2015; Sato et al., 2015) shows that Rsp and 1.688 RNAs interact with each of these proteins (Supplementary file 5). For example, ~0.9% and 0.1% of Piwi-bound RNAs map to 1.688 and Rsp, respectively. For comparison, ~2% and 17% Piwi-bound RNAs mapped to the dual-strand piRNA clusters 80F and 42AB, respectively. In contrast, only an average of 0.0005% of the reads from Piwi RIP-seq data mapped to miRNAs, which are abundant small RNAs not known to be bound by Piwi. This suggests that the abundance of satellite RNA in the RIP-seq data is not likely due to noise or contamination. Our results from Aub and Ago3 RIP data are similar to Piwi (Supplementary file 5; e.g., 3.1% and 0.1% of Aub-bound RNAs map to 1.688 and Rsp, respectively; and 1.8% and 0.07% of Ago3-bound RNAs map to 1.688 and Rsp, respectively). Together, these results indicate that satDNA-derived transcripts are processed into piRNAs in the female germline.
Figure 2 with 5 supplements see all
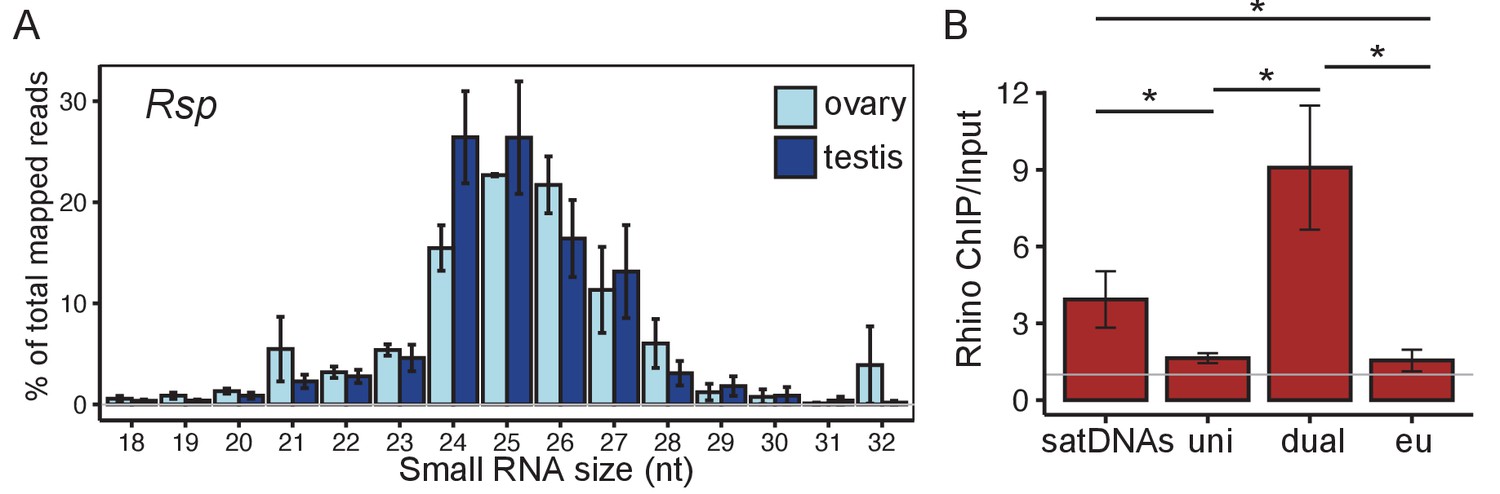
Satellite DNAs (satDNAs) produce small RNAs in D. melanogaster ovaries.
(A) Size distribution of Rsp small RNAs in testes and ovaries (1.688 distribution is in Figure 2—figure supplement 1C). Source data in Figure 2—source data 1. (B) Rhino ChIP-seq result from ovaries showing the enrichment scores for satDNAs, uni-strand (uni) piRNA clusters, dual-strand (dual), and euchromatin (eu). The enrichment scores for each satDNA and piRNA cluster are shown in Figure 2—figure supplement 5A. p-values are estimated by pairwise t-tests with FDR correction (Benjamini and Hochberg, 1995). * adjusted p-value<0.05. Source data in Figure 2—source data 2.
-
Figure 2—source data 1
Size distribution of small RNAs for Rsp and 1.688 in testes and ovaries.
Related to Figure 2A and Figure 2—figure supplement 1C.
- https://cdn.elifesciences.org/articles/62375/elife-62375-fig2-data1-v2.xlsx
-
Figure 2—source data 2
Rhino/H3K9me3 ChIP-seq enrichment scores for Rsp, 1.688 heterochromatic loci, piRNA clusters, and euchromatin.
Related to Figure 2B and Figure 2—figure supplement 5.
- https://cdn.elifesciences.org/articles/62375/elife-62375-fig2-data2-v2.xlsx
-
Figure 2—source data 3
Rhino ChIP-seq enrichment scores for all repeats in the genome.
- https://cdn.elifesciences.org/articles/62375/elife-62375-fig2-data3-v2.xlsx
We examined the piRNA distribution along individual repeat units for Rsp and two subfamilies of 1.688 (359-bp and 260-bp) by blasting the corresponding sequencing reads to each consensus sequence. We find that the distribution of piRNA read depth is not uniform along the length of single monomers (359-bp and 260-bp) or dimers (Rsp) of these satDNA repeats (Figure 2—figure supplement 2A, B). This pattern could arise if these piRNAs derive from repeat fragments overrepresented in the genome. However, when we look at the alignment depth of all genomic repeat variants, it is more uniform across the monomers/dimers than the piRNA pileup (Figure 2—figure supplement 2C). We observe similar non-uniform patterns of piRNA pileup over germline-dominant TEs (e.g., invader6, mdg3, and Het-A; Figure 2—figure supplement 3), suggesting that these uneven distributions may arise from piRNA processing. The piRNA read pileup pattern also differs between ovaries and testes (Figure 2—figure supplement 2A, B), suggesting that there may be differences in transcription machinery, precursor production, or precursor processing between these tissues.
SatDNA transcription resembles dual-strand piRNA clusters
D. melanogaster ovarian piRNAs originate primarily from uni- or dual-strand piRNA clusters. To determine which pathway controls the expression of satDNA-derived piRNA precursors, we asked whether transcripts come from one or both strands. We mapped total RNAseq reads from ovary and testis to the genome assembly. Collectively, for all genomic copies of Rsp or 1.688 satDNA (all subfamilies), we find a nearly 1:1 ratio of reads mapping to the plus and minus strands (Figure 2—figure supplement 4A; all mapped and uniquely mapped reads). However, the highly repetitive nature of satDNAs makes confidently assigning satellite-derived reads to a genomic location difficult. We therefore take advantage of our assemblies for two representative satDNA loci: the major Rsp locus on chromosome 2R and the 260-bp locus, a subfamily of 1.688, on chromosome 2L (Khost et al., 2017). For these two loci, we confirm that reads map uniquely to both strands of the contigs (Figure 2—figure supplement 4B). Together, these results suggest that satDNAs are transcribed from both strands, similar to dual-strand piRNA clusters.
Dual-strand piRNA clusters are associated with the heterochromatin binding protein Rhi (Klattenhoff et al., 2009; Zhang et al., 2014). We therefore reanalyzed publicly available ChIP-seq datasets from ovaries (Mohn et al., 2014; Zhang et al., 2014; Parhad et al., 2017) to determine if satDNA regions are also Rhi-associated. Our results for piRNA clusters are consistent with previous studies (Klattenhoff et al., 2009; Mohn et al., 2014; Andersen et al., 2017): the dual-strand piRNA clusters have higher Rhi enrichment (mean enrichment ChIP/Input Edual = 9.08) compared to uni-strand piRNA clusters (Euni = 1.69; pairwise t-test with Benjamini–Hochberg; Benjamini and Hochberg, 1995 adjusted p-value Padj=0.01) and euchromatic genes (Eeuch = 1.55; Padj=0.01). We found that complex satDNAs are in the top 30% of all repeats enriched in Rhi (full data in Figure 2—source data 3). The level of Rhi enrichment for satDNAs (Esat = 4.70) is intermediate between the highly enriched dual-strand piRNA clusters (Padj=0.1) and the minimally Rhi enriched uni-strand piRNA clusters (Padj=0.01) or euchromatin (Padj=0.01 Figure 2B and Figure 2—figure supplement 5A). Unlike the uneven distribution of piRNAs along satellite monomers/dimers (Figure 2—figure supplement 2A, B), the distribution of Rhi ChIP-seq reads (Figure 2—figure supplement 2D) is similar to the alignment depth of genomic repeats (Figure 2—figure supplement 2C). This suggests that Rhi localizes to the large satDNA genomic loci rather than a subset of smaller clusters or repeats across the genome (e.g., the 12 copies of Rsp inside an intron of Ago3 on chromosome 3L; Figure 2—figure supplement 2C) or in potentially unannotated piRNA clusters.
SatDNA transcription is regulated by RDC complex and Moon
Because we find that satDNAs generate piRNAs in the female germline and their chromatin is associated with Rhi, we asked if the same transcription and RNA processing machinery are used by both satDNAs and dual-strand piRNA clusters. We used publicly available small RNA-seq datasets generated from mutants of genes involved in the heterochromatin-dependent transcription initiation of dual-strand piRNA clusters: Rhi, Cuff, Del (RDC), and Moon (Klattenhoff et al., 2009; Pane et al., 2011; Czech et al., 2013; Le Thomas et al., 2014; Mohn et al., 2014; Andersen et al., 2017; Parhad et al., 2017). We normalized piRNA abundance to the number of reads mapped to either miRNAs (Figure 3A) or the uni-strand flamenco cluster (Figure 3—figure supplement 1), neither of which should be affected by mutations in the RDC pathway.
Figure 3 with 3 supplements see all
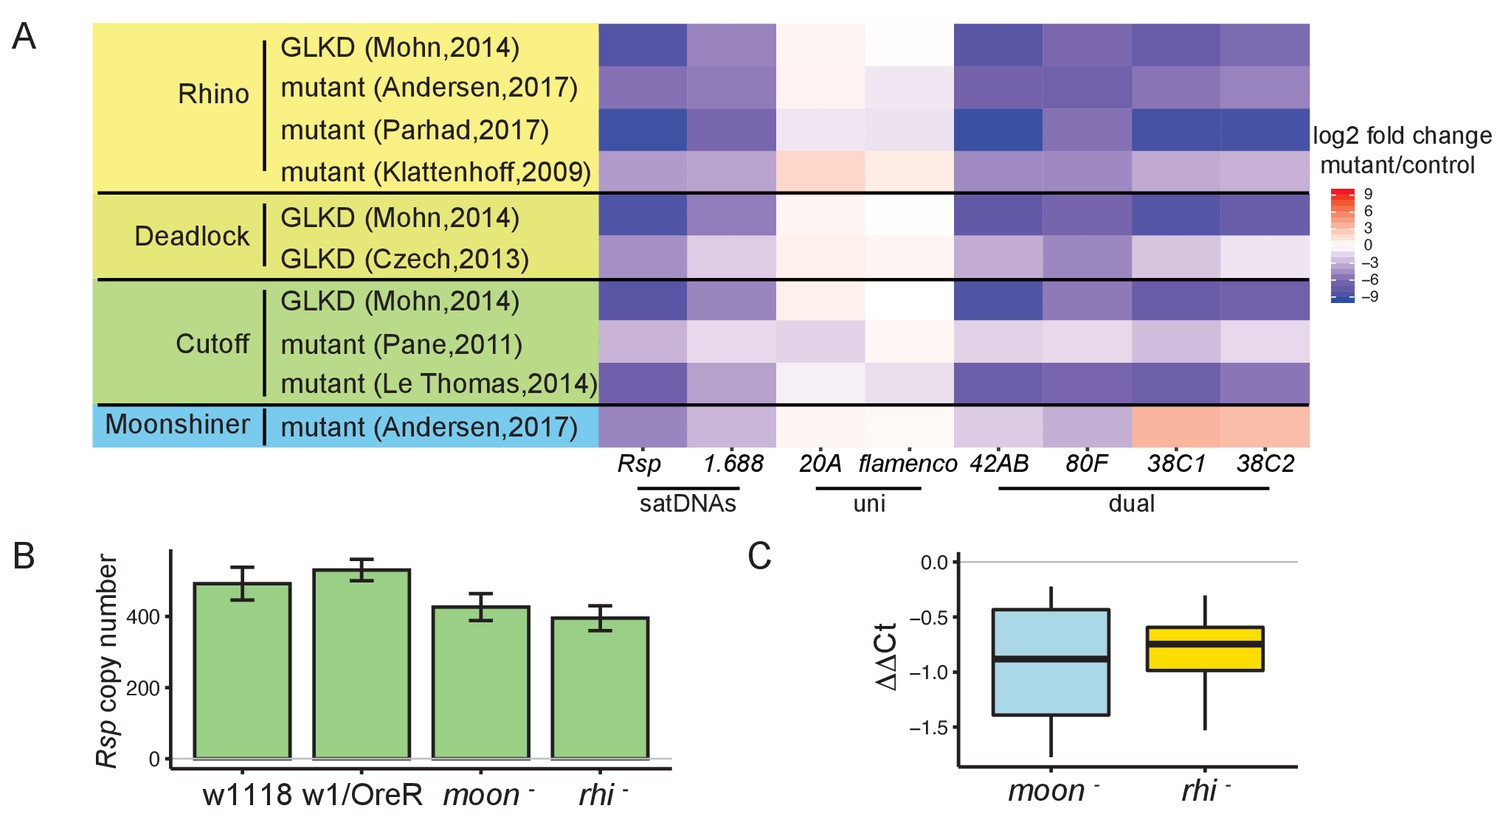
Satellite DNA (satDNA) loci are regulated by the heterochromatin-dependent transcription machinery in Drosophila ovaries.
(A) Heatmap showing the quantification of changes in piRNA abundance in small RNA-seq data from mutants of rhino, cutoff, deadlock, and moonshiner compared to controls for satDNAs and piRNA clusters, normalized by miRNA level. GLKD: germline knockdown. Complete list of log2 fold changes in Supplementary file 6. (B) qPCR estimate of Rsp copy number in wild types and mutants. (C) qRT-PCR estimate of Rsp transcript level in mutants compared to wild types. ΔΔCt = ΔCt(wild type) – ΔCt(mutant), a negative value indicates lower expression in mutant. Student’s t-test, p-value=0.077, 0.048. Source data in Figure 3—source data 1.
-
Figure 3—source data 1
Rsp copy number and expression level estimated from qPCR and q-RT-PCR.
Related to Figure 3B, C.
- https://cdn.elifesciences.org/articles/62375/elife-62375-fig3-data1-v2.xlsx
Our analysis of the known piRNA clusters agrees with published results: the dual-strand piRNA clusters 42AB and 80F are Rhi- and Moon-dependent, and 38C1/2 is Rhi-dependent but not Moon-dependent. The uni-strand piRNA clusters 20A and flamenco are not dependent on either protein (Klattenhoff et al., 2009; Pane et al., 2011; Mohn et al., 2014; Andersen et al., 2017). We find that the pools of complex satDNA-derived piRNAs are also reduced in RDC and Moon mutants (Figure 3A, Figure 3—figure supplement 1). In rhi mutants, Rsp piRNA abundance is 0.2–6.3% their levels in wild-type datasets. Similarly, piRNA abundance for 1.688 is 1.4–7.8% their levels in wild-type datasets (complete list of log2 fold change for satDNAs in Supplementary files 6 and 7). The reduction in satDNA piRNA level is robust to normalization method (miRNA in Figure 3A; flamenco cluster in Figure 3—figure supplement 1). While the expression of simple satellite repeats like AAGAG was not decreased in these mutants (Supplementary file 6 and Supplementary file 7), the low abundance of AAGAG reads (the number of reads mapping to AAGAG are only ~0.5% of Rsp and ~0.03% of 1.688) and known sources of bias for simple repeats (e.g., PCR bias in RNA-seq library preparation; Wei et al., 2018) points to the need for different approaches to verify this finding. Overall, our results indicate that piRNA production from complex satDNAs is regulated by the heterochromatin-dependent transcription machinery associated with dual-strand piRNA clusters.
To further examine how the RDC complex and Moon affect complex satDNA transcription, we reanalyzed total RNA-seq data of the corresponding mutants (Mohn et al., 2014; Andersen et al., 2017). RDC and Moon mutants affect piRNA precursor transcription at the dual-strand piRNA clusters 42AB and 80F (Mohn et al., 2014; Andersen et al., 2017). Consistent with published reports, we detected decreases in steady-state long RNA transcript levels at dual-strand piRNA clusters (Figure 3—figure supplement 2). However, we did not observe a significant decrease in steady-state long RNA transcript levels for satDNAs (Supplementary file 8). To confirm this finding, we performed qRT-PCR using total RNA from ovaries of rhino (rhi-) and moonshiner (moon-) mutants (Andersen et al., 2017). After controlling for genomic repeat copy number with qPCR (Figure 3B), Rsp expression level is lower, but not significantly so in rhi and moon mutants compared to wild type (p-value=0.048 and 0.077; Figure 3C). Because satDNAs have generally low expression levels (Rsp and 1.688 total RNA levels are ~3% and ~25%, respectively, of both 42AB and 80F), we may have insufficient power to detect decreased expression in the mutants. It is also possible that the signal is masked by non-precursor transcripts. That is, there may be two kinds of transcription at satDNA loci: (1) RDC-regulated transcription that generates non-polyadenylated piRNA precursors and, (2) non-precursor transcription, which is not well characterized and may also largely lack polyadenylation. In this context, it would be difficult to distinguish precursor from non-precursor transcripts derived from satDNA. However, when we reanalyzed the total and poly-A selected RNA-seq data from the rhi mutant (ElMaghraby et al., 2019), we find that the abundance of poly-A transcripts (which are likely a subset of non-precursors) is increased for Rsp and unchanged for 1.688 (Supplementary file 9) relative to wild type. This result suggests that changes in piRNA precursor levels may be masked by the non-precursor levels, similar to reports on piRNA cluster transcription in embryonic piwi knockdown ovaries (Akkouche et al., 2017). This situation might arise if only a subset of satDNA repeats are RDC-regulated. Alternatively, the proportion of piRNA precursor-to-non-precursor transcripts in these mutants might shift such that the abundance of piRNA precursors decreases but the total RNA level does not.
We also asked if the satDNA-derived piRNA pool is affected in mutants of 12 genes involved in piRNA precursor export from the nucleus, primary piRNA biogenesis, and the ping-pong cycle (Figure 3—figure supplement 3; Czech et al., 2018; datasets from Malone et al., 2009; Handler et al., 2011; Olivieri et al., 2012; Preall et al., 2012; Zhang et al., 2012; Czech et al., 2013; Sato et al., 2015; Wang et al., 2015; Supplementary file 1). For each of the datasets analyzed, we recapitulate previously reported results for all known piRNA clusters (Figure 3—figure supplement 3; Czech et al., 2018). Our reanalysis of these data suggests that piRNA production for all complex satDNA is regulated by the primary piRNA pathway (Gasz, Vreteno, Shutdown), UAP56, and the ping-pong pathway (Ago3, Krimper). Some of our reanalysis results varied between datasets from different studies for satDNAs. For example, satDNAs show decreased piRNA levels in one mutant Zucchini dataset (Olivieri et al., 2012) but increased levels in an independent Zucchini dataset (Malone et al., 2009; Handler et al., 2011). While further work is required to determine all of the components involved in processing satDNA transcripts, our results suggest that piRNA production at satDNA loci is regulated by the dual-strand piRNA pathway.
Heterochromatin establishment at satDNAs requires Piwi
Consistent with their Rhi enrichment, we find that satDNAs are enriched for H3K9me3 in ovaries (Figure 2—figure supplement 5B; datasets from Klenov et al., 2014; Le Thomas et al., 2014; Mohn et al., 2014). Piwi plays an important role in establishing H3K9 methylation on euchromatic TEs in ovaries (Mohn et al., 2014) and heterochromatin more generally in embryos (Akkouche et al., 2017). Transiently knocking down piwi expression early in the embryonic germline leads to a general decrease in H3K9me3 in the adult ovary, and a specific decrease in piRNA production and increase in spliced non-precursor transcripts at dual-strand piRNA clusters (Akkouche et al., 2017). We therefore reanalyzed H3K9me3 ChIP-seq data from embryonic piwi knock down ovaries (Akkouche et al., 2017). We detected a decrease of H3K9me3 at satDNAs (Figure 4A), suggesting that Piwi is also required for the establishment of heterochromatin at these loci. Consistent with the decrease in H3K9me3, piRNA production from satDNAs is also reduced (with some variation among replicates observed for Rsp; Figure 4B); and satDNA total RNA levels are increased (Figure 4—figure supplement 1), similar to dual-strand piRNA clusters (Akkouche et al., 2017). However, it is again difficult to distinguish between satDNA precursor and non-precursor RNAs.
Figure 4 with 1 supplement see all
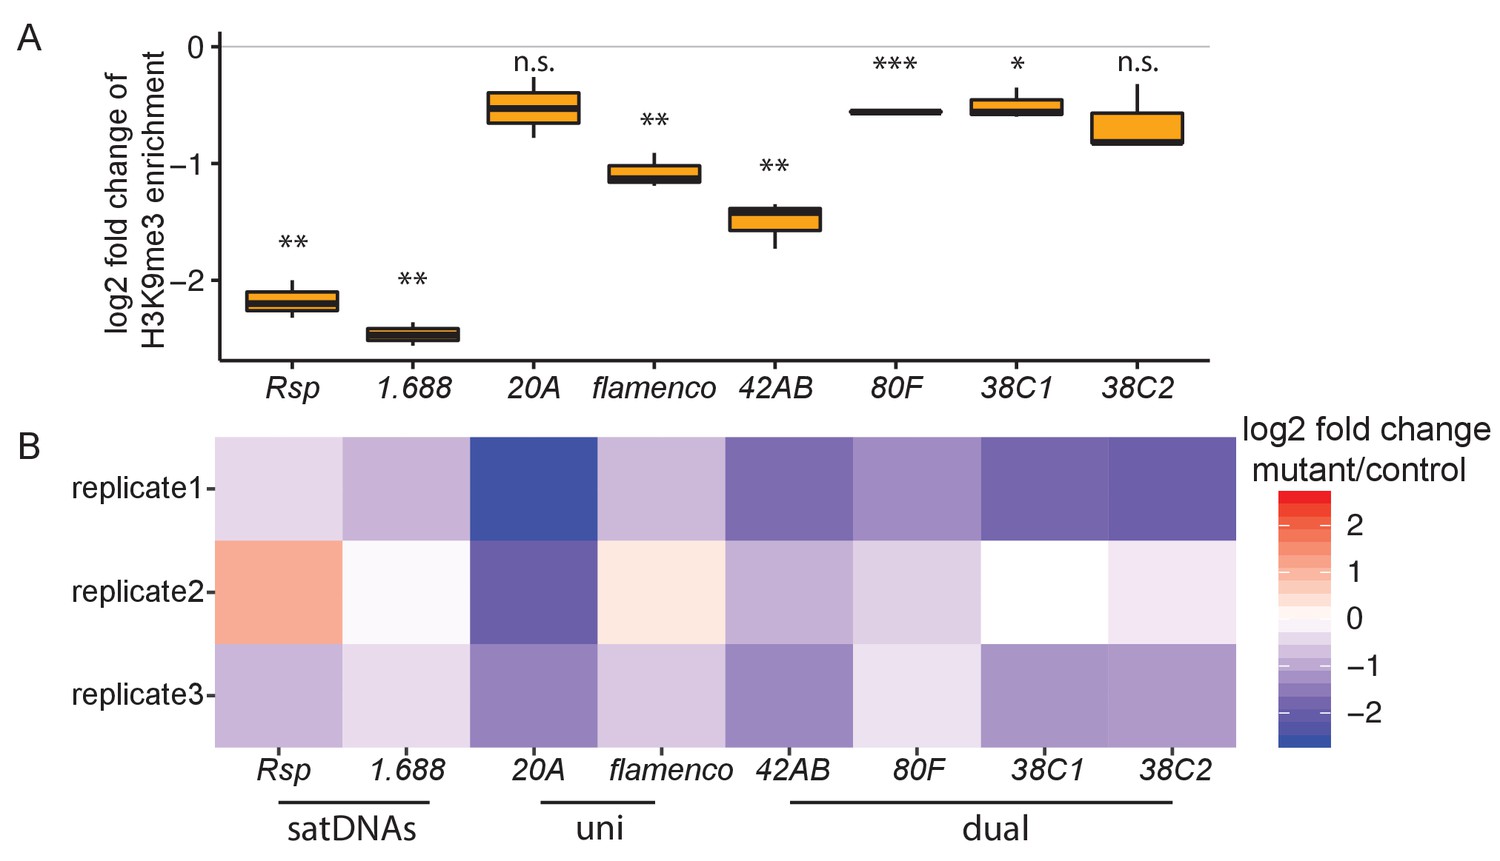
Heterochromatin establishment disrupted at satellite DNAs (satDNAs) in piwi embryonic knockdown ovaries.
(A) Log2 fold change of H3K9me3 ChIP/input enrichment shows satDNA H3K9me3 levels decrease in piwi embryonic knockdown ovaries compared to control. Source data in Figure 4—source data 1. p-values are estimated by one-sample t-test (mu = 0) with FDR corrections (Benjamini and Hochberg, 1995). * adjusted p-value<0.05, ** adjusted p-value<0.01, *** adjusted p-value<0.001. (B) Log2 fold change of small RNA abundance shows satDNA small RNA levels decrease compared to controls, with variation observed for replicate2. Small RNA abundance is normalized to the number of reads mapped to miRNAs. Source data in Figure 4—source data 2.
-
Figure 4—source data 1
Log2 fold change of H3K9me3 ChIP/input enrichment for satellite DNAs (satDNAs) and piRNA clusters in piwi embryonic knockdown ovaries.
Related to Figure 4A.
- https://cdn.elifesciences.org/articles/62375/elife-62375-fig4-data1-v2.xlsx
-
Figure 4—source data 2
Log2 fold change of small RNA abundance for satellite DNAs (satDNAs) and piRNA cluters in piwi embryonic knockdown ovaries.
Related to Figure 4B.
- https://cdn.elifesciences.org/articles/62375/elife-62375-fig4-data2-v2.xlsx
While Piwi is important for heterochromatin establishment at piRNA clusters, it appears to be dispensable for heterochromatin maintenance (Czech et al., 2018). Depleting Piwi in the nucleus with piwi mutants lacking a nuclear localization signal (NLS; Klenov et al., 2014), or knocking down germline piwi (Le Thomas et al., 2013; Mohn et al., 2014) affects H3K9me3 level on a subset of active transposons, but not on piRNA clusters (Klenov et al., 2014; Mohn et al., 2014). Similar to piRNA clusters, our reanalysis of these data shows that the level of H3K9me3 on satDNAs is largely unchanged in the knockdown or mutant ovaries (with some variation observed among datasets; Supplementary file 10). These analyses suggest a role for Piwi in establishing, but not maintaining, heterochromatin at satDNAs in early embryos, which is important for producing piRNAs later in adult ovaries.
Conclusions
piRNA pathways are primarily studied for their conserved role in protecting genome integrity by repressing TE activity in different organisms (Aravin et al., 2006; Girard et al., 2006; Grivna et al., 2006; Lau et al., 2006; Brennecke et al., 2007; Houwing et al., 2007; reviewed in Parhad and Theurkauf, 2019). However, our findings support a more general role for these pathways. Here we show that transcription from satDNAs is regulated by the heterochromatin-dependent RDC machinery and Moon in ovaries and these transcripts are processed into piRNAs. Thus, complex satDNA transcription is regulated in a manner similar to dual-strand piRNA clusters in the female germline (Figure 5).
Figure 5
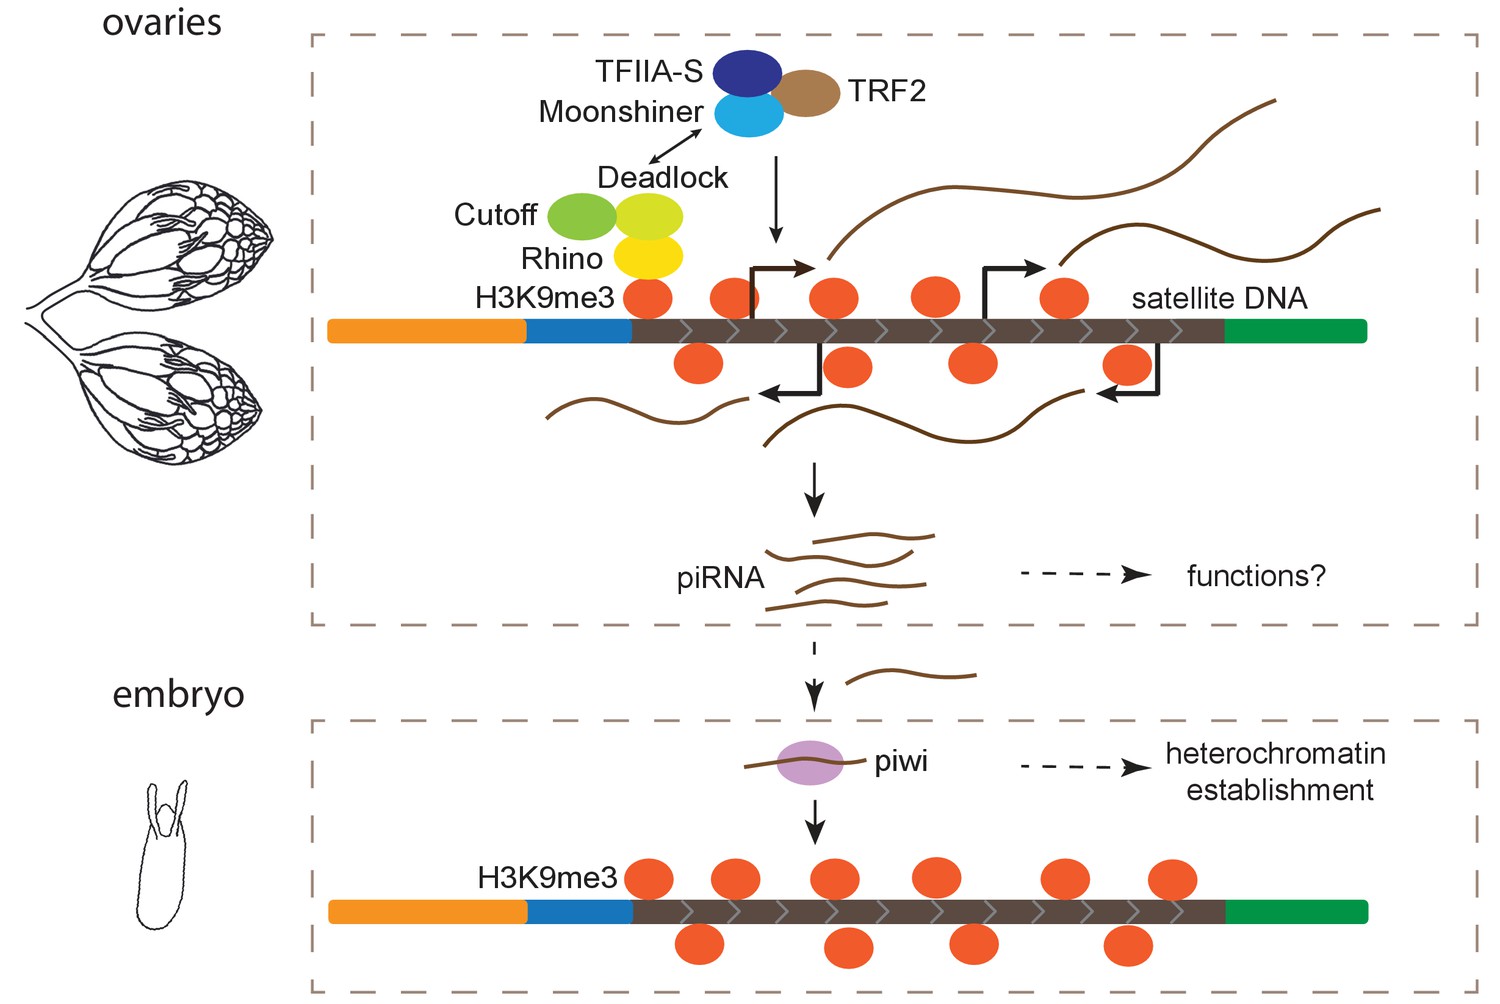
Model for maintenance of satellite DNA (satDNA) chromatin in female germline.
Complex satDNA transcription is regulated by the heterochromatin-dependent Rhino-Deadlock-Cutoff and Moonshiner machinery, and the long RNA transcripts are processed into piRNAs. While their functions in ovaries are unclear, these piRNAs play roles in the establishment of heterochromatin at their own genomic loci in embryos. This pathway may be important for maintaining genome stability in pericentric heterochromatin, proper nuclear organization, and other unexplored functions.
Our findings are consistent with a study that detected bidirectional transcription of the 1.688 satDNA family in ovaries (Usakin et al., 2007) and a recent analysis of satDNA-derived piRNAs in RDC mutants (Chen et al., 2020). Usakin et al. found that 1.688 transcript abundance is elevated in mutants of two piRNA processing genes, spn-E and aub (Usakin et al., 2007), suggesting that 1.688 is targeted by piRNAs, similar to TEs. However, the origins of the 1.688 piRNAs and how the transcription of precursors is regulated were unclear (Usakin et al., 2007). Here we provide evidence that most satellite-derived transcripts and small RNAs reported in previous studies (Aravin et al., 2003; Saito et al., 2006; Usakin et al., 2007; Rošić et al., 2014; Chen et al., 2020; Chen et al., 2021) come from the heterochromatin-dependent transcription of the large satDNA blocks. The role of these piRNAs in ovaries remains unknown, and we understand even less about piRNA biogenesis and function in D. melanogaster testes, where we also detect satDNA-derived piRNAs. Proportionally, far fewer piRNAs in the male germline are derived from TEs than in the female germline (Nishida et al., 2007; Nagao et al., 2010; Quénerch'du et al., 2016), suggesting roles outside of TE repression. For example, recent studies implicate piRNA pathways in intragenomic conflicts (e.g., male meiotic drive; Gell and Reenan, 2013; Courret et al., 2019), with satDNAs often at the center of these conflicts.
While it will take more work to understand the role of satDNA-derived transcripts in the germline, we hypothesize that the maternal deposition of these piRNAs contributes to heterochromatin establishment at satDNAs in the early embryo (Figure 5). Maternal deposition of Piwi contributes to heterochromatin establishment in the embryo (Gu and Elgin, 2013), and Piwi-dependent H3K9me3 deposition at canonical piRNA clusters is important for subsequent piRNA production at piRNA clusters (Akkouche et al., 2017). Similar to piRNA clusters, we found evidence that both H3K9me3 chromatin and piRNA production from complex satDNA is reduced when transiently depleting Piwi in the embryos, suggesting a role for the piRNA pathway in heterochromatin establishment at satDNA loci (Figure 5). We propose a simple model of self-regulation, where Piwi, guided by satDNA-derived piRNAs, establishes H3K9me3 at satDNA, marking the satDNAs as piRNA production sites later in development (Figure 5). While a contributor, Piwi might not be the only factor necessary for heterochromatin establishment in embryos (Wei et al., 2021a). And once established, the maintenance of heterochromatin at piRNA clusters and satDNAs is not Piwi-dependent (Supplementary file 10; Klenov et al., 2014; Mohn et al., 2014). Therefore, the piRNA pathway is likely to be one of several factors important for proper packaging and regulation of repeat-rich regions of the genome (Pal-Bhadra et al., 2004; Gu and Elgin, 2013).
The consequences of disrupting satDNA packaging/regulation are likely to be complicated. The ramifications could be especially serious if a reduction in heterochromatin at satDNA in early embryos affects heterochromatin in all tissues (reviewed in Janssen et al., 2018) and/or if establishing heterochromatin at satDNA loci serves as nucleation points for the larger-scale heterochromatinization of pericentric regions. First, heterochromatic regions form a distinct phase-separated nuclear compartment that contributes to nuclear organization and gene regulation (Larson et al., 2017; Strom et al., 2017), and chromocenter formation (Jagannathan et al., 2018). Unregulated satDNA may disrupt this organization (Novo et al., 2020) and lead to cell death (Jagannathan et al., 2019). Second, de-repressed satDNA may lead to genome instability (Peng and Karpen, 2007) including chromosomal structural rearrangements (reviewed in Janssen et al., 2018). In the short term, rearrangements involving satDNA may lead to mitotic defects in the developing embryo as they can affect chromosome segregation (Ferree and Barbash, 2009; Ferree, 2014). Over longer evolutionary time scales, these rearrangements contribute to variation in satDNA organization between individuals and species, and may cause genetic incompatibilities between closely related species (Ferree and Barbash, 2009). SatDNAs are indeed among the most rapidly evolving sequences in genomes (reviewed in Ferree and Prasad, 2012; Plohl et al., 2012).
Many mysteries remain surrounding the functions of the piRNA pathway outside of its role in controlling TE activity. Our finding that the piRNA pathway regulates satDNA suggests a general role for the piRNA pathway and for maternal satDNA-derived RNAs in remodeling chromatin in the developing embryo. This initial establishment of heterochromatin may be an important step in ensuring genome integrity throughout development and in adult tissues, but this remains an open question. Moving forward, it will be important for piRNA studies to continue to focus on satDNA and how these dynamic compartments of the genome contribute to genome function and stability.
Materials and methods
Key resources table
| Reagent type (species) or resource | Designation | Source or reference | Identifiers | Additional information |
|---|---|---|---|---|
| Gene (Drosophila melanogaster) | rhi | Flybase | Flybase: FBgn0004400 | |
| Gene (D. melanogaster) | moon | Flybase | Flybase: FBgn0030373 | |
| Gene (D. melanogaster) | del | Flybase | Flybase: FBgn0086251 | |
| Gene (D. melanogaster) | cuff | Flybase | Flybase: FBgn0260932 | |
| Gene (D. melanogaster) | piwi | Flybase | Flybase: FBgn0004872 | |
| Strain, strain background (D. melanogaster, female and male) | Iso-1 | Bloomington Drosophila Stock Center (BDSC) | BDSC: 2057; RRID:BDSC_2057 | |
| Strain, strain background (D. melanogaster, female) | ZW144 | doi:10.1534/g3.114.015883 Grenier et al., 2015 | ||
| Strain, strain background (D. melanogaster, female) | Ral357 | BDSC | BDSC:25184; RRID:BDSC_25184 | |
| Strain, strain background (D. melanogaster, female) | Ral380 | BDSC | BDSC:25190; RRID:BDSC_25190 | |
| Strain, strain background (D. melanogaster, female) | It pk cn bw | Ganetzky, 1977 | ||
| Strain, strain background (D. melanogaster, female) | w1118 | BDSC | BDSC:5905; RRID:BDSC_5905 | |
| Strain, strain background (D. melanogaster, female) | w1 | BDSC | BDSC:2390; RRID:BDSC_2390 | |
| Strain, strain background (D. melanogaster, female) | OregonR | BDSC | BDSC:2376; RRID:BDSC_2376 | |
| Genetic reagent (D. melanogaster) | rhi mutant | Vienna Drosophila Resource Center (VRDC) | VDRC:313487 | |
| Genetic reagent (D. melanogaster) | rhi mutant | VRDC | VDRC:313488 | |
| Genetic reagent (D. melanogaster) | moon mutant | VRDC | VDRC:313735 | |
| Genetic reagent (D. melanogaster) | moon mutant | VRDC | VDRC:313738 | |
| Sequence-based reagent | RPS3 forward | IDT | qPCR primer | AGTTGTACGCCGAGAAGGTG |
| Sequence-based reagent | RPS3 Reverse | IDT | qPCR primer | TGTAGCGGAGCACACCATAG |
| Sequence-based reagent | tRNA forward | IDT | qPCR primer | CTAGCTCAGTCGGTAGAGCATGA |
| Sequence-based reagent | tRNA Reverse | IDT | qPCR primer | CCAACGTGGGGCTCGAAC |
| Sequence-based reagent | Rsp forward | IDT | qPCR primer | GGAAAATCACCCATTTTGATCGC |
| Sequence-based reagent | Rsp Reverse | IDT | qPCR primer | CCGAATTCAAGTACCAGAC |
| Sequence-based reagent | Probe for 1.688 | IDT | RNA FISH probe | Cy5TTTTCCAAATTTCGGTCATCAAATAATCAT |
| Sequence-based reagent | Probe for Rsp | Stellaris | RNA FISH probe | Custom Stellaris FISH probes with 45 sequences listed in Supplementary file 11 |
| Sequence-based reagent | T7_rsp2 | IDT | Northern blot probe synthesis primer | TAATACGACTCACTATAGGGCCGAATTCAAGTACCAGAC |
| Sequence-based reagent | rsp1 | IDT | Northern blot probe synthesis primer | GGAAAATCACCCATTTTGATCGC |
| Sequence-based reagent | Rsp primer_F | IDT | Slot blot probe synthesis primer | TAATACGACTCACTATAGGGGAAAATCACCCATTTTGATCGC |
| Sequence-based reagent | Rsp primer_R | IDT | Slot blot probe synthesis primer | CCGAATTCAAGTACCAGAC |
| Sequence-based reagent | rp49 primer_F | IDT | Slot blot probe synthesis primer | TAATACGACTCACTATAGGGCAGTAAACGCGGTTCTGCATG |
| Sequence-based reagent | rp49 primer_R | IDT | Slot blot probe synthesis primer | CAGCATACAGGCCCAAGATC |
| Software, algorithm | Bowtie2 | doi:10.1038/nmeth.1923. | RRID:SCR_016368 | |
| Software, algorithm | Bowtie | doi:10.1002/0471250953.bi1107s32. | RRID:SCR_005476 | |
| Software, algorithm | DESeq2 | doi:10.1186/s13059-014-0550-8. | RRID:SCR_015687 | |
| Software, algorithm | piPipes | doi:10.1093/bioinformatics/btu647. | ||
| Software, algorithm | BLAST | NCBI | RRID:SCR_004870 | |
| Software, algorithm | R | R core team | RRID:SCR_001905 | |
| Software, algorithm | Customized Python scripts | This paper | Wei et al., 2021b GitHub (https://github.com/LarracuenteLab/Dmelanogaster_satDNA_regulation) |
Drosophila stocks
Request a detailed protocolIso-1 (RRID:BDSC_2057) was used as the wild-type strain, unless stated otherwise. In the qPCR validation experiment, rhi mutants (rhi-) are transheterozygotes from the Vienna Drosophila Resource Center (VDRC 313487 and 313488) as are the moonshiner mutants (moon-) (VDRC 313735 and 313738) as described in Andersen et al., 2017. Based on the origin and genetic background of these mutants, w1118 (RRID:BDSC_5905) or the progeny from OregonR (Ore) (RRID:BDSC_2376) crossed to w1 (RRID:BDSC_2390) were used as the wild-type controls for rhi- and moon-. All flies were maintained at 23°C on cornmeal medium.
Small RNA-seq
Request a detailed protocol6–8-day-old testes were dissected in RNase-free PBS buffer. Total RNA was extracted using mirVana miRNA Isolation Kit (Ambion) with procedures for isolating RNA fractions enriched for small RNAs (<200 nt), then treated with RNase free DNase I (Promega) at 37°C for 1 hr. Library preparation and sequencing were performed by Genomics Research Center at University of Rochester. Briefly, 2S rRNA was depleted (Wickersheim and Blumenstiel, 2013), small RNA library was prepared with TruSeq Small RNA Library Prep Kit (Illumina) and sequenced by Illumina platform HiSeq2500 Single-end 50 bp.
Total RNA-seq
Request a detailed protocol6–8-day-old testes were dissected in RNase-free PBS buffer. Total RNA was extracted using mirVana miRNA Isolation Kit (Ambion) with procedures for isolating RNA fractions enriched for long RNAs (>200 nt), then treated with RNase free DNase I (Promega) at 37°C for 1 hr. Library preparation and sequencing were performed by Genomics Research Center at University of Rochester. Briefly, rRNA was removed and total RNA library was prepared with TruSeq Stranded Total RNA Library Prep Human/Mouse/Rat (Illumina) and sequenced by Illumina platform HiSeq2500 Paired-end 125 bp.
SatDNA analysis
Request a detailed protocolReads were mapped to the heterochromatin-enriched genome assembly (Chang and Larracuente, 2019) and counted based on their annotations (e.g., Rsp or 1.688). Due to the highly repetitive nature of satDNAs, around 80% of total RNA-seq and 99% of small RNA-seq reads that are mapped to satDNA regions are not uniquely assigned; discarding these multiple mapped reads would result in loss of statistical power in the satDNA analysis. To deal with this, multiple mapped reads were randomly assigned to one of their multiple best mapping locations, unless stated otherwise. Reads were then counted based on the annotations of their assigned mapping locations. Because there is high-sequence similarity among the 1.688 subfamily repeats (260-bp, 359-bp, 353-bp, 356-bp), all 1.688 subfamilies were combined, unless stated otherwise. A similar approach was used in our analysis of piRNA clusters, except that only uniquely mapped reads were counted so that the published results could serve as controls for our method. Additional details specific to small RNA-seq, RNA-seq, ChIP-seq, and RIP-seq analyses are given below.
RNA-seq analysis
Request a detailed protocolAll total RNA-seq datasets reanalyzed in our study are listed in Supplementary file 1. Total RNA-seq reads were trimmed for adaptors and then mapped to the genome using Bowtie2 (RRID:SCR_016368) (Langmead and Salzberg, 2012). A customized Python script was used to count reads that mapped to each repeat feature or piRNA cluster, and RPM values were reported by normalizing raw counts to 1,000,000 total mapped reads (Wei et al., 2021b https://github.com/LarracuenteLab/Dmelanogaster_satDNA_regulation; Wei, 2020, htseq_bam_count_proportional.py; Wei et al., 2021b). For the 1.688 subfamilies, all subfamilies were combined into one 1.688 category, although analyzing each by subfamily (e.g., 353-bp, 356-bp, 359-bp, 260-bp) does not change our conclusions (https://github.com/LarracuenteLab/Dmelanogaster_satDNA_regulation) (Wei, 2020; Wei et al., 2021b). For results shown in Supplementary file 8, DESeq2 (RRID:SCR_015687) (Love et al., 2014) was used to perform differential expression analysis of the raw counts with combined data from different studies (Mohn et al., 2014; Andersen et al., 2017), with experimental condition and associated study as covariates. This analysis method is conservative and leads to smaller log2 fold changes than published results of piRNA clusters. For comparison with the published results, a similar approach was used to analyze piRNA clusters (Mohn et al., 2014; Andersen et al., 2017). Briefly, quantification of reads mapping to 1 kb windows inside each piRNA cluster was estimated using a customized Python script (https://github.com/LarracuenteLab/Dmelanogaster_satDNA_regulation; Wei, 2020;, htseq_bam_count_proportional.py; Wei et al., 2021b), and subsequent differential expression analysis between mutants and wildtype was done using DESeq2 (RRID:SCR_015687) (Love et al., 2014; results shown in Figure 3—figure supplement 2).
Small RNA-seq analysis
Request a detailed protocolAll small RNA-seq datasets reanalyzed in our study are listed in Supplementary file 1. Small RNA-seq reads were trimmed for adaptors, then mapped to the genome using Bowtie (RRID:SCR_005476) (Langmead, 2010). A customized Python script (https://github.com/LarracuenteLab/Dmelanogaster_satDNA_regulation; Wei, 2020, htseq_bam_count_proportional.py; Wei et al., 2021b) was used to count reads that mapped to each repeat feature or piRNA cluster. To control for differences in small RNA abundance and compare across samples, raw counts were then normalized to the number of reads that mapped to either miRNAs or the flamenco piRNA cluster. The difference in expression was represented by the log2 fold changes of these normalized counts in mutants compared to wild type (i.e., log2(countmutant/countWT)) for each repeat and piRNA cluster. We further analyzed the size distribution and relative nucleotide bias at positions along each satDNA by extracting reads mapped to the satDNA of interest using a customized Python script (https://github.com/LarracuenteLab/Dmelanogaster_satDNA_regulation; Wei, 2020, extract_sequence_by_feature_gff.py; Wei et al., 2021b). The 10nt overlap Z-score of piRNAs mapped to each satDNA was calculated using piPipes (Han et al., 2015). To determine which parts of these repeats are represented in piRNA or ChIP datasets, the read pileup patterns along the consensus sequence of a satDNA were examined (e.g., Figure 2—figure supplement 2). Reads (ChIP or piRNA) mapping to a particular satDNA or genomic satDNA variant (as a control) were BLAST-ed to the consensus dimer (for 1.688 satellite) or trimer (for Rsp because it has left and right consensus sequences), and then coordinates were converted along a dimer/trimer to coordinates along a monomer/dimer consensus sequence. All plots were made in R (R Development Core Team, 2017).
ChIP/RIP-seq analysis
Request a detailed protocolAll total ChIP-seq and RIP-seq datasets reanalyzed in our study are listed in Supplementary file 1. ChIP-seq and RIP-seq reads were trimmed for adaptors and mapped to the genome using Bowtie2 (RRID:SCR_016368) (Langmead and Salzberg, 2012). A customized Python script (https://github.com/LarracuenteLab/Dmelanogaster_satDNA_regulation; Wei, 2020, htseq_bam_count_proportional.py; Wei et al., 2021b) was used to count reads that mapped to each repeat feature or piRNA cluster. Raw counts were normalized to 1,000,000 total mapped reads.
For the ChIP-seq results, enrichment scores of each repeat and piRNA cluster were reported by comparing the ChIP sample with the antibody of interest to its no-antibody input control sample. For ChIP-seq analyses, consider satDNA as discrete loci rather than repeat unit types is appropriate because some loci are composed of several repeat types. To examine the large blocks of heterochromatic satDNA chromatin for the Rhi and H3K9me3 ChIP-seq analyses, euchromatic 1.688 satDNAs were excluded and only reads that map uniquely to satDNA loci were analyzed. Heterochromatic satDNA loci were defined as discrete loci on chromosomes: 2L (2L_2: 402701–460225; the 260-bp locus), 3L (3L_3: 46695–106272; primarily 353-bp and 356-bp repeats), and the unmapped contigs (Contig101 and Contig9; 353-bp, 356-bp, and 359-bp repeats). Our conclusions do not change when we look at all reads (not just uniquely mapped; https://github.com/LarracuenteLab/Dmelanogaster_satDNA_regulation; Wei, 2020; Wei et al., 2021b). These analyses were repeated by combining all 1.688 subfamilies into a single category, and each subfamily was analyzed separately (e.g., all 353-bp repeats combined) but the conclusions do not change (https://github.com/LarracuenteLab/Dmelanogaster_satDNA_regulation; Wei, 2020; Wei et al., 2021b). Euchromatic controls are included for the Rhi and H3K9me3 ChIP-seq analyses. Here, the euchromatic control corresponds to the median enrichment score for protein coding genes that are 5 Mb distal from heterochromatin boundaries (Riddle et al., 2011) and piRNA clusters.
For the RIP-seq analyses, reported was the percentage of reads mapped to each repeat and piRNA cluster with miRNAs as the negative control. For the 1.688 subfamilies, all subfamilies were combined into one 1.688 category, although analyzing each by subfamily (e.g., 353-bp, 356-bp, 359-bp, 260-bp) does not change the conclusions (https://github.com/LarracuenteLab/Dmelanogaster_satDNA_regulation; Wei, 2020; Wei et al., 2021b).
RNA FISH
Request a detailed protocolA Cy5-labeled oligo probe (5′-Cy5TTTTCCAAATTTCGGTCATCAAATAATCAT-3′) previously described in Ferree and Barbash, 2009 was used to detect 1.688 transcripts from all subfamilies except 260-bp on chromosome 2L. Custom Stellaris FISH probes were designed for Rsp (Supplementary file 11), and RNA FISH was performed following the manufacturer’s instructions (Biosearch Technologies, Inc). 3–6-day-old ovaries and testes were dissected in RNase-free PBS buffer, fixed with 4% paraformaldehyde in PBS buffer at room temperature for 30 min, and then washed twice with PBS for 5 min. To permeabilize, tissues were kept in RNase free 70% ethanol at 4°C overnight. The ethanol was aspirated, and samples washed with Stellaris wash buffer on a nutating mixer for 3 min and kept still for 2 min at room temperature. Hybridization was then performed with each probe in Stellaris hybridization buffer in a humidity chamber at 37°C overnight. The working concentration was 100 nM for the oligo probe and 125 nM for the Stellaris probes. From this point, samples were kept in the dark. The samples were washed with Stellaris wash buffer twice at 37°C for 30 min each. Samples were then transferred to mounting medium containing DAPI and imaged with Leica SP5 laser scanning confocal microscope.
For RNaseA controls, after fixation and permeation, tissues were treated with RNase A (100 μg/ml) in RNase digestion buffer (5 mM EDTA, 300 mM NaCl, 10 mM Tris-HCl pH 7.5, Cold Spring Harbor Protocols, http://cshprotocols.cshlp.org/content/2013/3/pdb.rec074146.full) at 37°C for 1 hr and washed three times with Stellaris wash buffer at room temperature for 10 min before hybridization.
For RNase H controls, after probe hybridization and washing, tissues were treated with 1.5 μl RNase H (5000 units/ml; New England Biolabs) in 50 μl final volume in 1X RNAse H buffer at 37°C for 2 hr and washed three times with Stellaris wash buffer at room temperature for 10 min before mounting and imaging.
qPCR
Request a detailed protocolFor genomic DNA qPCR, 3–8-day-old flies were mashed with pipette tips for 5–10 s and incubated in buffer (10 mM Tris-Cl pH 8.2, 1 mM EDTA, 25 mM NaCl, 200 μg/ml Proteinase K) at 37°C for 30 min (Gloor and Engels, 1992). To extract nucleic acids, a mixture of phenol/Sevag (1:1) of equal volume was added, and the samples vortexed for 45–60 s and then centrifuged for 3–5 min. The aqueous top layers were saved, an equal volume of Sevag added, and the samples vortexed for 30 s then centrifuged for 1 min. The aqueous top layers were saved and a second Sevag extraction performed. Diluted nucleic acid samples (concentration of 0.04 ng/μl) were used for qPCR to determine the repeat copy numbers in the genome. Repeat copy numbers are normalized to the tRNA:Lys-CTT copy numbers.
For RNA qRT-PCR, 3–6-day-old ovaries were dissected in RNase-free PBS buffer, and total RNA was extracted using the mirVana miRNA Isolation Kit (Ambion). RNA samples were treated with RNase free DNase I (Promega) at 37°C for 1 hr. The RNA samples were reverse transcribed using random hexamer primers and M-MuLV Reverse Transcriptase (New England Biolabs) and the resulting cDNA subjected to qPCR. To exclude the possibility of DNA signal in qRT-PCR experiments, controls with no Reverse Transcriptase enzyme were used for all samples in the reverse transcription step. Expression levels were normalized to ribosomal protein S3 (RPS3) expression. To detect the transcript abundance difference between wild-type and mutant, ΔΔCT was calculated (Livak and Schmittgen, 2001).
The replicate number for genomic DNA qPCR is 2–4 and for RNA qRT-PCR is 4–6. The sequences of primers used are: Rsp (forward: GGAAAATCACCCATTTTGATCGC, reverse: CCGAATTCAAGTACCAGAC); tRNA (forward: CTAGCTCAGTCGGTAGAGCATGA, reverse: CCAACGTGGGGCTCGAAC); RPS3 (forward: AGTTGTACGCCGAGAAGGTG, reverse: TGTAGCGGAGCACACCATAG).
Northern blot analysis
Isolation of total RNA and RNase controls
Request a detailed protocolStocks of D. melanogaster were chosen, which represented a range of Rsp repeat copy numbers; flies were collected (0–20 hr old) and aged for 6 days. Ovaries were dissected from approximately 20 females (i.e., 6.0–6.8 days old) from each stock, and total nucleic acid isolated using a standard phenol/Sevag procedure (Khost et al., 2017). Total nucleic acid was then treated with DNase I as recommended (20 units; Promega), re-extracted with phenol/Sevag, and ethanol precipitated. Total RNA was resuspended in distilled water. The integrity of the RNA was checked on 1% agarose gels, and the concentration estimated by an optical density at 260 nm.
For RNase controls, 10 μg of total RNA was resuspended in 50 mM NaCl, 5 mM EDTA, 10 mM Tris pH 7.5, 100 μg/ml RNaseA, and incubated at 37°C for 30 min. Samples were phenol/Sevag extracted, 10 μg of ytRNA added as carrier, and ethanol precipitated.
Northern blot analysis
Request a detailed protocolTotal RNA (10 μg)/RNase controls were suspended in 1× MOPS (0.04 M morpholinepropanesulfonic acid [MOPS] pH 7.0, 0.01 M Na acetate, 0.001 M EDTA), 2.2 M formaldehyde, 50% formamide. The RNA was then heated at 65°C for 15 min, placed on ice, and one-tenth volume loading buffer (1× MOPS, 50% formamide, 2.2 M formaldehyde, 4% Ficoll, 0.25% bromophenol blue) added. RNAs were separated on a 1% agarose gel containing 0.5 M formaldehyde/1× MOPS at 40 V for 3 hr. Standard RNA lanes were cut from the gel and stained with ethidium bromide to monitor electrophoresis. Gels were washed for 25 min in sterile water (with four changes). RNA was transferred to GeneScreen Plus nylon membrane (prewet in 10× SSC) by capillary action using 10× SSC. After transfer, the nylon membrane was rinsed in 2× SSC, UV crosslinked, and then baked for 2 hr under vacuum at 80°C. The membrane was prehybridized in 2× SSC, 5× Denhardt's solution, 1% sodium dodecyl sulfate (SDS), 10% polyethylene glycol (PEG- molecular weight, 8,000), 25 mM sodium phosphate (pH 7.2), 0.1% sodium pyrophosphate, and 50% formamide for 3 hr at 55°C. Hybridizations were done overnight at 55°C in the same buffer containing a biotinylated RNA probe (see slot blot; primers: T7_rsp2 5′-TAATACGACTCACTATAGGGCCGAATTCAAGTACCAGAC-3′ and rsp1 5′-GGAAAATCACCCATTTTGATCGC-3′). The hybridized membranes were washed in 1 M sodium phosphate pH 6.8, 0.5 M EDTA, 5% SDS (2×, 10 min each) at 60°C and then at 1 M sodium phosphate pH 6.8, 0.5M EDTA, 1% SDS (3×, 10 min each) at 65°C. The washed membranes were then processed as recommended for the Chemiluminescent Nucleic Acid Detection Module (ThermoScientific), and the signal recorded on a ChemiDoc XR+ (Bio-Rad).
Slot blot
Request a detailed protocolFive female flies were mashed and the total nucleic acid phenol/Sevag extracted as described above for qPCR. Approximately 200 ng of the nucleic acid was denatured (final concentration 0.25 M NaOH, 0.5 M NaCl) for 10 min at room temperature, the sample transferred to a tube with an equal volume of ice-cold loading buffer (0.1× SSC, 0.125 M NaOH) and left on ice. The slot blotter was then prepared and samples loaded as recommended for the 48-well BioDot SF microfiltration apparatus (Bio-Rad). After loading, the wells were washed with 200 μl of loading buffer. The nylon membrane (GeneScreen Plus) was then rinsed for 2 min with 2× SSC before being UV crosslinked (Stratalinker). The membrane was first hybridized with a biotinylated rp49 RNA probe in North2South hybridization solution (ThermoScientific) at 65°C overnight. The membrane was processed as recommended for the Chemiluminescent Nucleic Acid Detection Module (ThermoScientific), and the signal recorded on a ChemiDoc XR+ (Bio-Rad). The membrane was then stripped with a 100°C solution of 0.1× SSC/0.5% SDS (three times for ~20 min each) and re-hybridized with a Rsp probe (60°C overnight) and processed as above. Signals were quantitated using the ImageLab software (Bio-Rad). We determined the relative signal compared to Iso-1 for each line (5–7 replicates), and then estimate the Rsp copy number by scaling the relative slot blot signal to our estimate of Rsp copy number in Iso-1 (1100 repeats). Our Iso-1 estimate is based on Rsp count in a long-read assembly, which is supported by empirical slot blots (Khost et al., 2017).
To make the biotinylated RNA probes, gel extracted PCR amplicons (primers: Rsp 5′-TAATACGACTCACTATAGGGGAAAATCACCCATTTTGATCGC-3′ and 5′-CCGAATTCAAGTACCAGAC-3′; rp49 5′- TAATACGACTCACTATAGGGCAGTAAACGCGGTTCTGCATG-3′ and 5′-CAGCATACAGGCCCAAGATC-3′) were transcribed using the Biotin RNA Labeling Mix (Roche) and T7 polymerase (Promega).
Data availability
Request a detailed protocolSequencing data generated in this paper are available in the NCBI Sequence Read Archive under project accession PRJNA647441. All data files and code to recreate analyses and figures are deposited in GitHub (https://github.com/LarracuenteLab/Dmelanogaster_satDNA_regulationWei, 2020) and at the Dryad Digital Repository (https://doi.org/10.5061/dryad.hdr7sqvj3; Wei et al., 2021b).
Data availability
Sequencing data generated in this study have been deposited in NCBI Sequence Read Archive (SRA) under project accession PRJNA647441. Published sequencing data used in this study are from NCBI SRA database, and the full list of accession numbers can be found in Supplementary File 1.
-
NCBI BioProjectID PRJNA647441. Heterochromatin-dependent transcription of satellite DNAs in the Drosophila melanogaster female germline.
References
-
Ten principles of heterochromatin formation and functionNature Reviews Molecular Cell Biology 19:229–244.https://doi.org/10.1038/nrm.2017.119
-
The small RNA profile during Drosophila melanogaster developmentDevelopmental Cell 5:337–350.https://doi.org/10.1016/S1534-5807(03)00228-4
-
Controlling the false discovery rate: a practical and powerful approach to multiple testingJournal of the Royal Statistical Society: Series B 57:289–300.https://doi.org/10.1111/j.2517-6161.1995.tb02031.x
-
Transcription of tandemly repetitive DNA: functional rolesChromosome Research 23:463–477.https://doi.org/10.1007/s10577-015-9494-4
-
Meiotic drive mechanisms: lessons from DrosophilaProceedings of the Royal Society B: Biological Sciences 286:20191430.https://doi.org/10.1098/rspb.2019.1430
-
piRNA-Guided genome defense: from biogenesis to silencingAnnual Review of Genetics 52:131–157.https://doi.org/10.1146/annurev-genet-120417-031441
-
How can satellite DNA divergence cause reproductive isolation? let Us count the chromosomal waysGenetics Research International 2012:1–11.https://doi.org/10.1155/2012/430136
-
Dicer is essential for formation of the heterochromatin structure in vertebrate cellsNature Cell Biology 6:784–791.https://doi.org/10.1038/ncb1155
-
Global diversity lines - a five-continent reference panel of sequenced Drosophila melanogaster strainsG3: Genes, Genomes, Genetics 5:593–603.https://doi.org/10.1534/g3.114.015883
-
A novel class of small RNAs in mouse spermatogenic cellsGenes & Development 20:1709–1714.https://doi.org/10.1101/gad.1434406
-
Argonaute proteins: key players in RNA silencingNature Reviews Molecular Cell Biology 9:22–32.https://doi.org/10.1038/nrm2321
-
Heterochromatin: guardian of the genomeAnnual Review of Cell and Developmental Biology 34:265–288.https://doi.org/10.1146/annurev-cellbio-100617-062653
-
Impact of nuclear piwi elimination on chromatin state in Drosophila melanogaster ovariesNucleic Acids Research 42:6208–6218.https://doi.org/10.1093/nar/gku268
-
The 1.688 repetitive DNA of Drosophila: concerted evolution at different genomic scales and association with genesMolecular Biology and Evolution 29:7–11.https://doi.org/10.1093/molbev/msr173
-
Aligning short sequencing reads with bowtieCurr Protoc Bioinformatics 11:17.https://doi.org/10.1002/0471250953.bi1107s32
-
Fast gapped-read alignment with bowtie 2Nature Methods 9:357–359.https://doi.org/10.1038/nmeth.1923
-
BookEvolution of satellite DNA sequences in DrosophilaIn: Verma R. S, editors. Heterochromatin: Molecular and Structural Aspects. Cambridge University Press. pp. 1–10.
-
Centromere identity from the DNA point of viewChromosoma 123:313–325.https://doi.org/10.1007/s00412-014-0462-0
-
SoftwareR: A language and environment for statistical computingR Foundation for Statistical Computing, Vienna, Austria.
-
Repetitive centromeric satellite RNA is essential for kinetochore formation and cell divisionJournal of Cell Biology 207:335–349.https://doi.org/10.1083/jcb.201404097
-
Multiple roles for piwi in silencing Drosophila transposonsGenes & Development 27:400–412.https://doi.org/10.1101/gad.209767.112
-
Genomes, genes and junk: the large-scale organization of plant chromosomesTrends in Plant Science 3:195–199.https://doi.org/10.1016/S1360-1385(98)01223-0
-
Dynamic evolution of euchromatic satellites on the X chromosome in Drosophila melanogaster and the simulans CladeMolecular Biology and Evolution 37:2241–2256.https://doi.org/10.1093/molbev/msaa078
-
Higher-order unfolding of satellite heterochromatin is a consistent and early event in cell senescenceJournal of Cell Biology 203:929–942.https://doi.org/10.1083/jcb.201306073
-
Functional elements residing within satellite DNAsEMBO Reports 6:1035–1039.https://doi.org/10.1038/sj.embor.7400558
-
Variable rates of simple satellite gains across the Drosophila phylogenyMolecular Biology and Evolution 35:925–941.https://doi.org/10.1093/molbev/msy005
-
Heterochromatin and gene expression in DrosophilaAnnual Review of Genetics 29:577–605.https://doi.org/10.1146/annurev.ge.29.120195.003045
Article and author information
Author details
Amanda M Larracuente

Funding
National Institutes of Health (R35 GM119515)
- Amanda M Larracuente
University of Rochester (Stephen Biggar and Elisabeth Asaro fellowship)
- Amanda M Larracuente
University of Rochester (Agnes M. and George Messersmith Dissertation Fellowship)
- Xiaolu Wei
The funders had no role in study design, data collection and interpretation, or the decision to submit the work for publication.
Acknowledgements
This work was supported by the National Institutes of Health General Medical Sciences (R35 GM119515 to AML), a Stephen Biggar and Elisabeth Asaro fellowship in Data Science to AML, and a University of Rochester Agnes M. and George Messersmith Dissertation Fellowship to XW. We thank Drs. Ching-Ho Chang, John Sproul, Cécile Courret, and Lucas Hemmer for providing feedback on the manuscript. We also thank the University of Rochester Center for Integrated Research Computing for access to computing facilities and the University of Rochester Genomics Research Center for sequencing services.
Copyright
© 2021, Wei et al.
This article is distributed under the terms of the Creative Commons Attribution License, which permits unrestricted use and redistribution provided that the original author and source are credited.
Metrics
-
- 3,059
- views
-
- 430
- downloads
-
- 45
- citations
Views, downloads and citations are aggregated across all versions of this paper published by eLife.
Citations by DOI
-
- 45
- citations for umbrella DOI https://doi.org/10.7554/eLife.62375
Download links
A two-part list of links to download the article, or parts of the article, in various formats.
Downloads (link to download the article as PDF)
Open citations (links to open the citations from this article in various online reference manager services)
Cite this article (links to download the citations from this article in formats compatible with various reference manager tools)
Heterochromatin-dependent transcription of satellite DNAs in the Drosophila melanogaster female germline
eLife 10:e62375.
https://doi.org/10.7554/eLife.62375


