Heterochromatin-dependent transcription of satellite DNAs in the Drosophila melanogaster female germline
- Department of Biomedical Genetics, University of Rochester Medical Center, United States
- Department of Biology, University of Rochester, United States
Figures
Figure 1 with 2 supplements
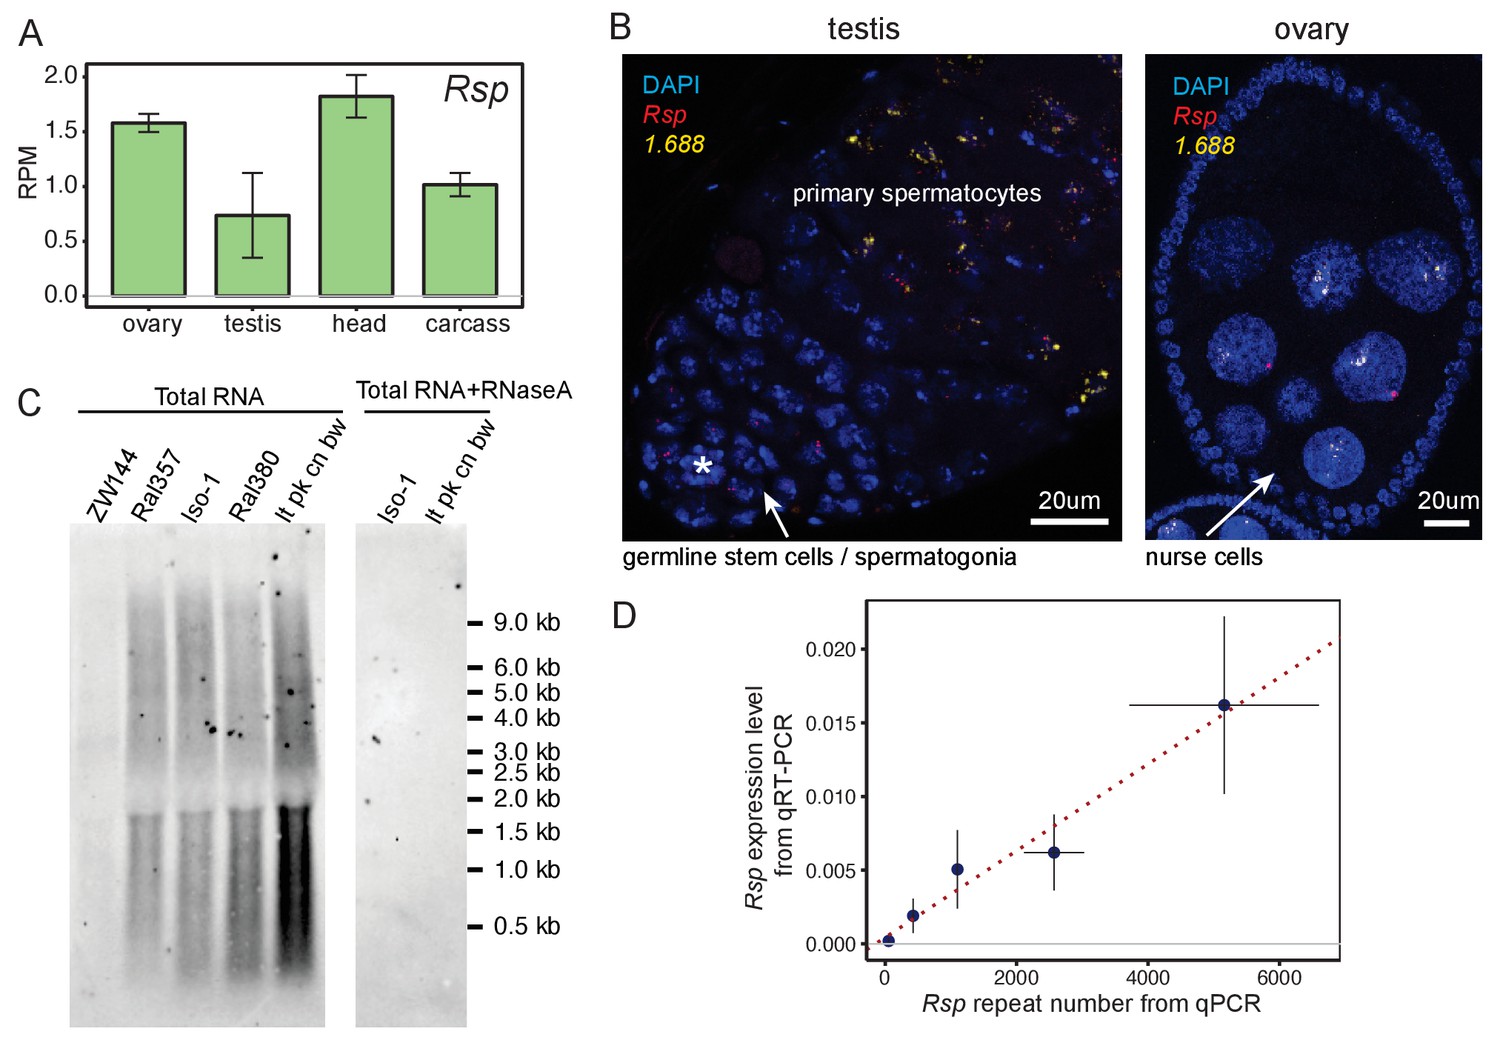
Satellite DNAs (satDNAs) are expressed in ovaries and testes.
(A) Rsp satDNA transcription level in various tissues (corresponding result for 1.688 is shown in Figure 1—figure supplement 1C). Carcass: whole body without the head, reproductive organs, and digestive tract. Source data in Figure 1—source data 1. (B) RNA fluorescence in situ hybridization shows evidence for Rsp and 1.688-derived transcripts in testes and ovaries; asterisk indicates the hub. The probe for 1.688 recognizes all 1.688 subfamilies except for 260-bp on chromosome 2L. (C) Northern blot probed with Rsp. Total RNA was extracted from ovaries of fly lines with varying copy numbers of Rsp: ZW144 (200 copies), Ral357 (600 copies), Iso-1 (1100 copies), Ral380 (2300), and lt pk cn bw (4100). There is no signal after RNaseA treatment. Signal quantification (shown in Figure 1—figure supplement 1D) shows Rsp transcript abundance correlates with its genomic copy number (Pearson’s correlation coefficient r2 = 0.93, p-value=0.02). (D) qPCR and qRT-PCR quantification of Rsp copy number and expression level, respectively, of strains used in northern blot. A linear regression line is shown in the plot with red dotted line (Pearson’s correlation coefficient r2 = 0.98, p-value=0.003). Details for (C) and (D) in Supplementary file 4.
-
Figure 1—source data 1
Satellite DNAs (SatDNA) transcription level in various developmental stages and tissues.
Related to Figure 1A and Figure 1—figure supplement 1A–C.
- https://cdn.elifesciences.org/articles/62375/elife-62375-fig1-data1-v2.xlsx
Figure 1—figure supplement 1
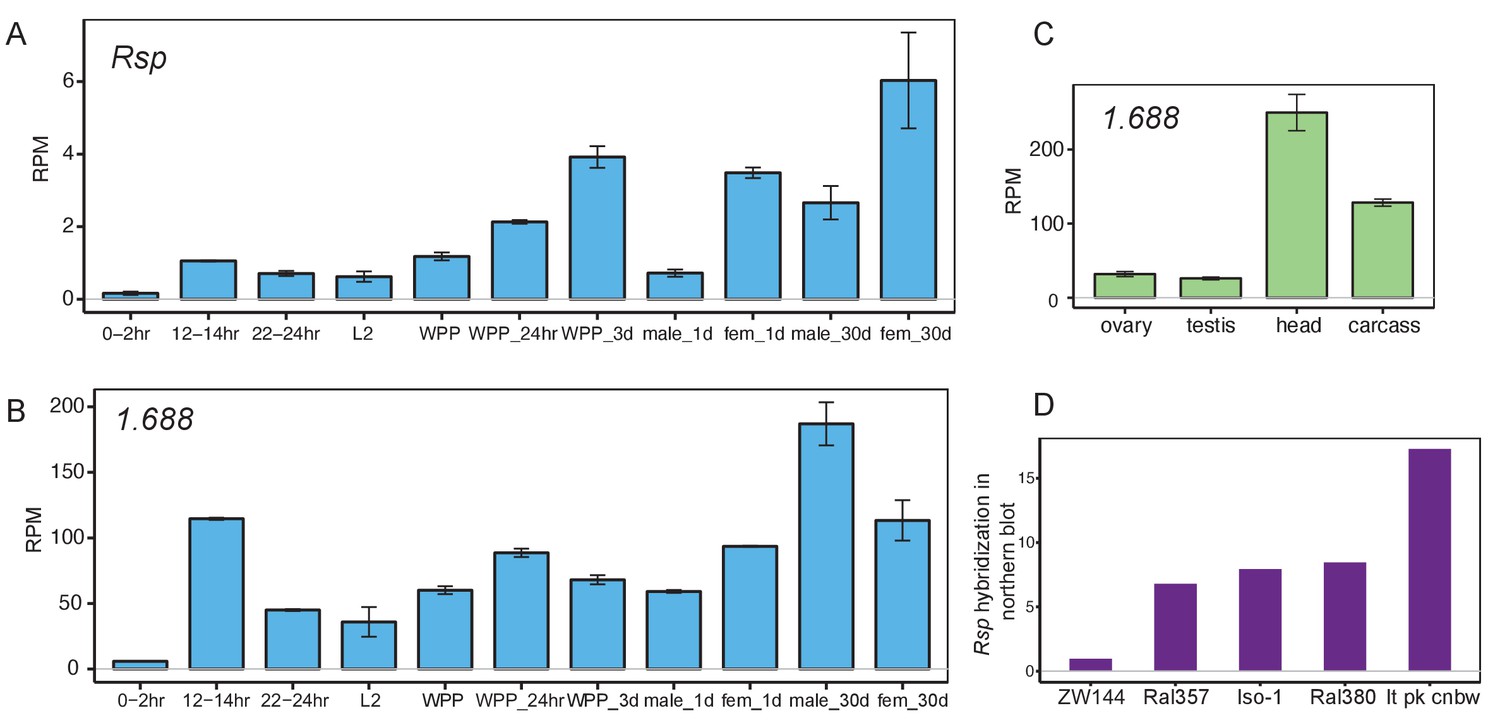
Satellite DNAs (satDNAs) are expressed across tissues and developmental stages.
(A, B) SatDNA transcription level in various developmental stages (A for Rsp and B for 1.688). L2: second instar larvae; WPP: white prepupae; Fem: female. Complex satDNA expression increases with adult age. (C) 1.688 satDNA transcription level in various tissues (corresponding result for Rsp is shown in Figure 1A). Carcass: whole body without the head, reproductive organs, and digestive tract. Source data in Figure 1—source data 1. (D) Northern signal quantification of Rsp transcript abundance. Data for (A–C) from modENCODE (Graveley et al., 2011; Brown et al., 2014).
Figure 1—figure supplement 2

RNA fluorescence in situ hybridization (FISH) signals of satellite DNAs (satDNAs) are from RNAs, not DNAs.
RNA FISH of Rsp and 1.688 in ovary (A), with RNaseA treatment prior to probe hybridization (B) and with RNaseH treatment after DNA probe hybridization (C). The 1.688 probe recognizes major 1.688 loci on chromosomes X and 3.
Figure 2 with 5 supplements
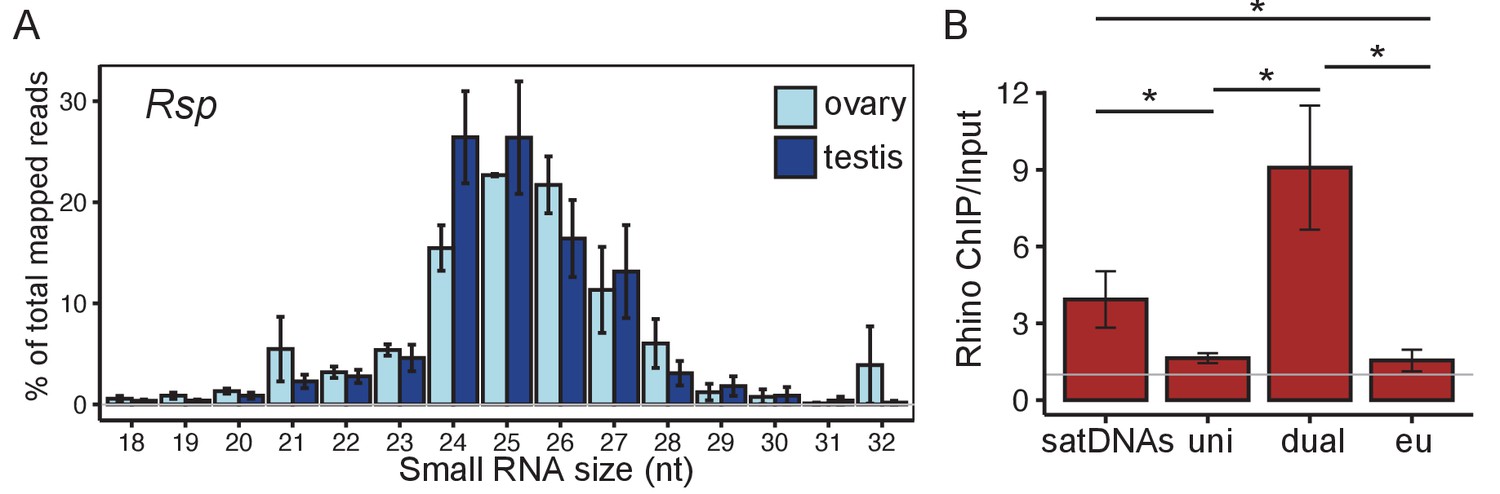
Satellite DNAs (satDNAs) produce small RNAs in D. melanogaster ovaries.
(A) Size distribution of Rsp small RNAs in testes and ovaries (1.688 distribution is in Figure 2—figure supplement 1C). Source data in Figure 2—source data 1. (B) Rhino ChIP-seq result from ovaries showing the enrichment scores for satDNAs, uni-strand (uni) piRNA clusters, dual-strand (dual), and euchromatin (eu). The enrichment scores for each satDNA and piRNA cluster are shown in Figure 2—figure supplement 5A. p-values are estimated by pairwise t-tests with FDR correction (Benjamini and Hochberg, 1995). * adjusted p-value<0.05. Source data in Figure 2—source data 2.
-
Figure 2—source data 1
Size distribution of small RNAs for Rsp and 1.688 in testes and ovaries.
Related to Figure 2A and Figure 2—figure supplement 1C.
- https://cdn.elifesciences.org/articles/62375/elife-62375-fig2-data1-v2.xlsx
-
Figure 2—source data 2
Rhino/H3K9me3 ChIP-seq enrichment scores for Rsp, 1.688 heterochromatic loci, piRNA clusters, and euchromatin.
Related to Figure 2B and Figure 2—figure supplement 5.
- https://cdn.elifesciences.org/articles/62375/elife-62375-fig2-data2-v2.xlsx
-
Figure 2—source data 3
Rhino ChIP-seq enrichment scores for all repeats in the genome.
- https://cdn.elifesciences.org/articles/62375/elife-62375-fig2-data3-v2.xlsx
Figure 2—figure supplement 1
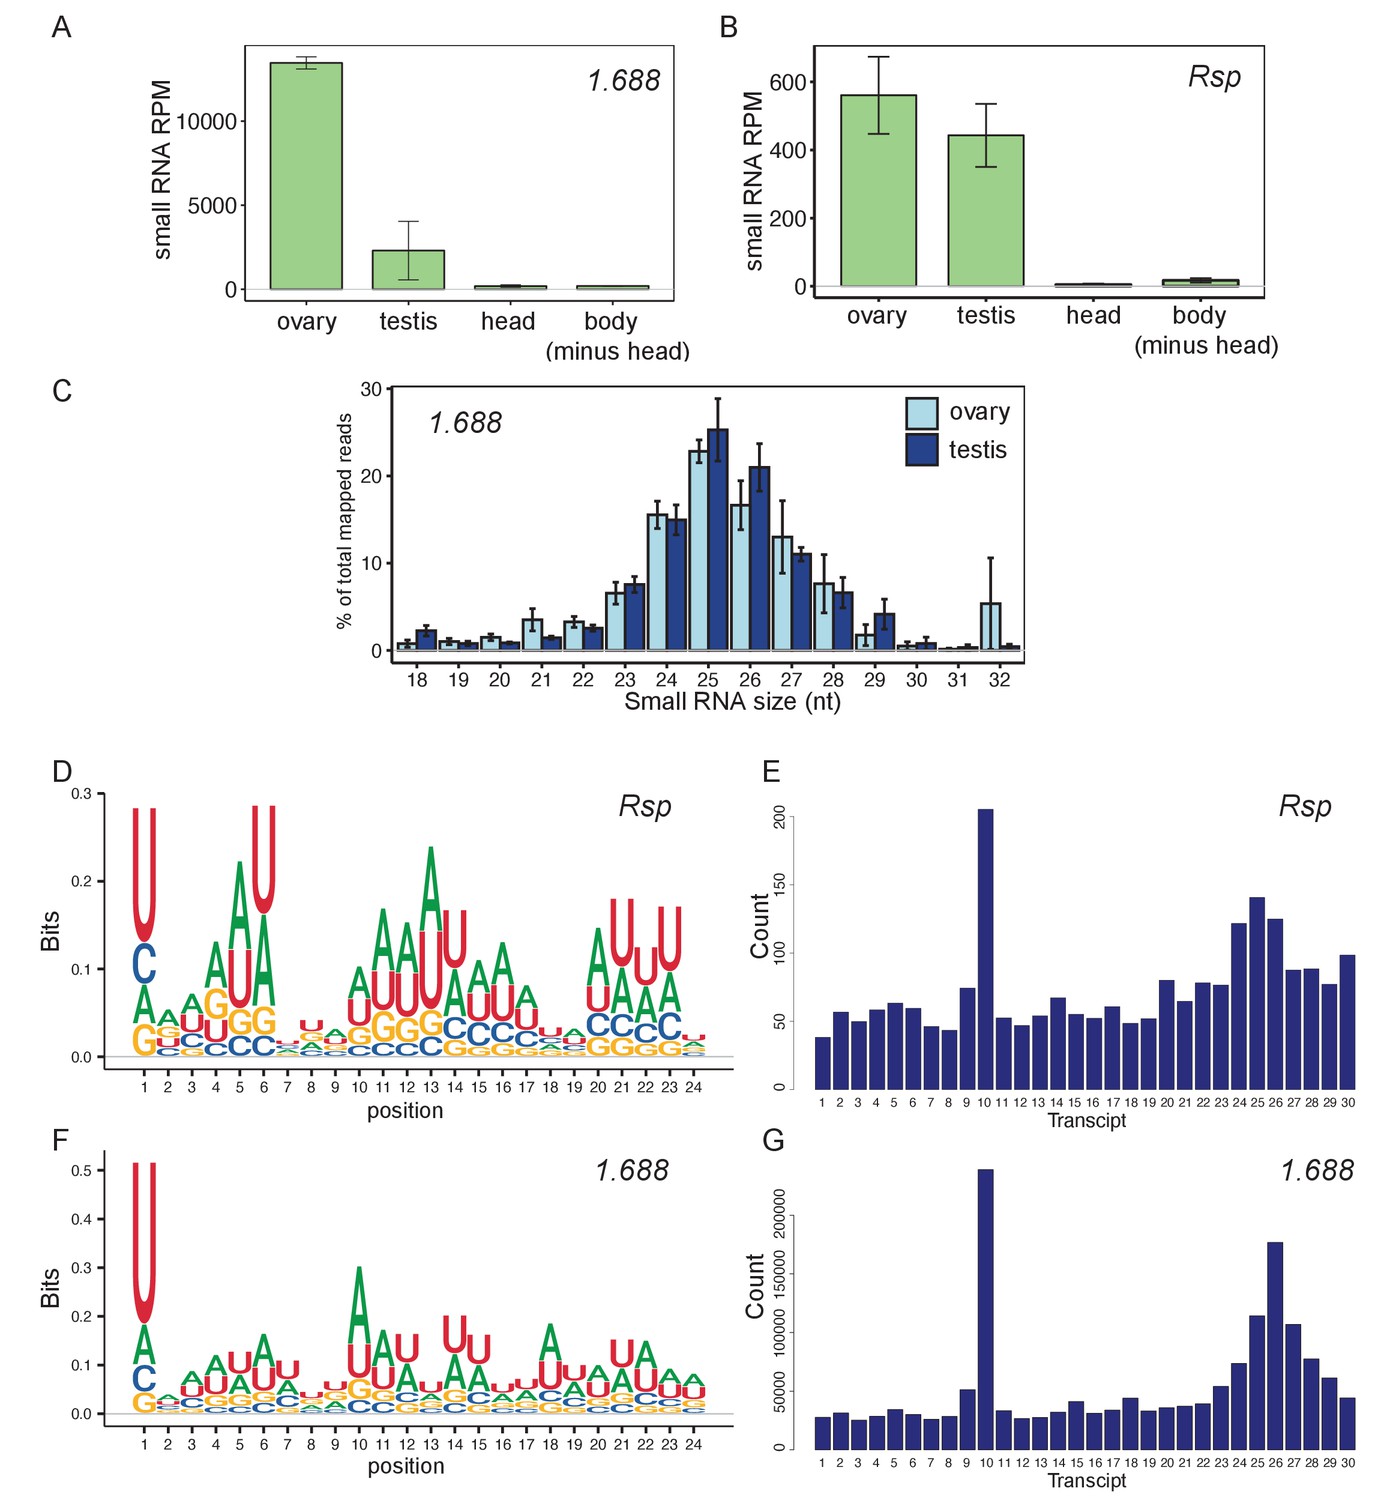
Satellite-derived RNAs are mainly processed into piRNAs in the germline.
(A, B) Small RNA levels (RPM) in ovary, testis, head, and body (minus head) for 1.688 (A) and Rsp (B). Source data in Figure 2—figure supplement 1—source data 1. (C) Size distribution of 1.688 small RNAs in gonads. (D, F) Relative nucleotide bias of each position in small RNAs from Rsp (D) and 1.688 (F) satellite in ovary. (E, G) 5′-to-5′ end distance analysis results of small RNAs from Rsp (E) and 1.688 (G) satellite in ovary show bias of 10-nt overlap. Z-score = 4.55 for Rsp and 6.85 for 1.688 satellite. Data from Ghildiyal et al., 2010; Rozhkov et al., 2010; Fagegaltier et al., 2014; Mohn et al., 2014; Quénerch'du et al., 2016; Andersen et al., 2017; Parhad et al., 2017.
-
Figure 2—figure supplement 1—source data 1
Small RNA levels (RPM) in ovary, testis, head, and body (minus head) for 1.688 and Rsp.
Related to Figure 2—figure supplement 1A, B.
- https://cdn.elifesciences.org/articles/62375/elife-62375-fig2-figsupp1-data1-v2.tissue.xlsx
Figure 2—figure supplement 2
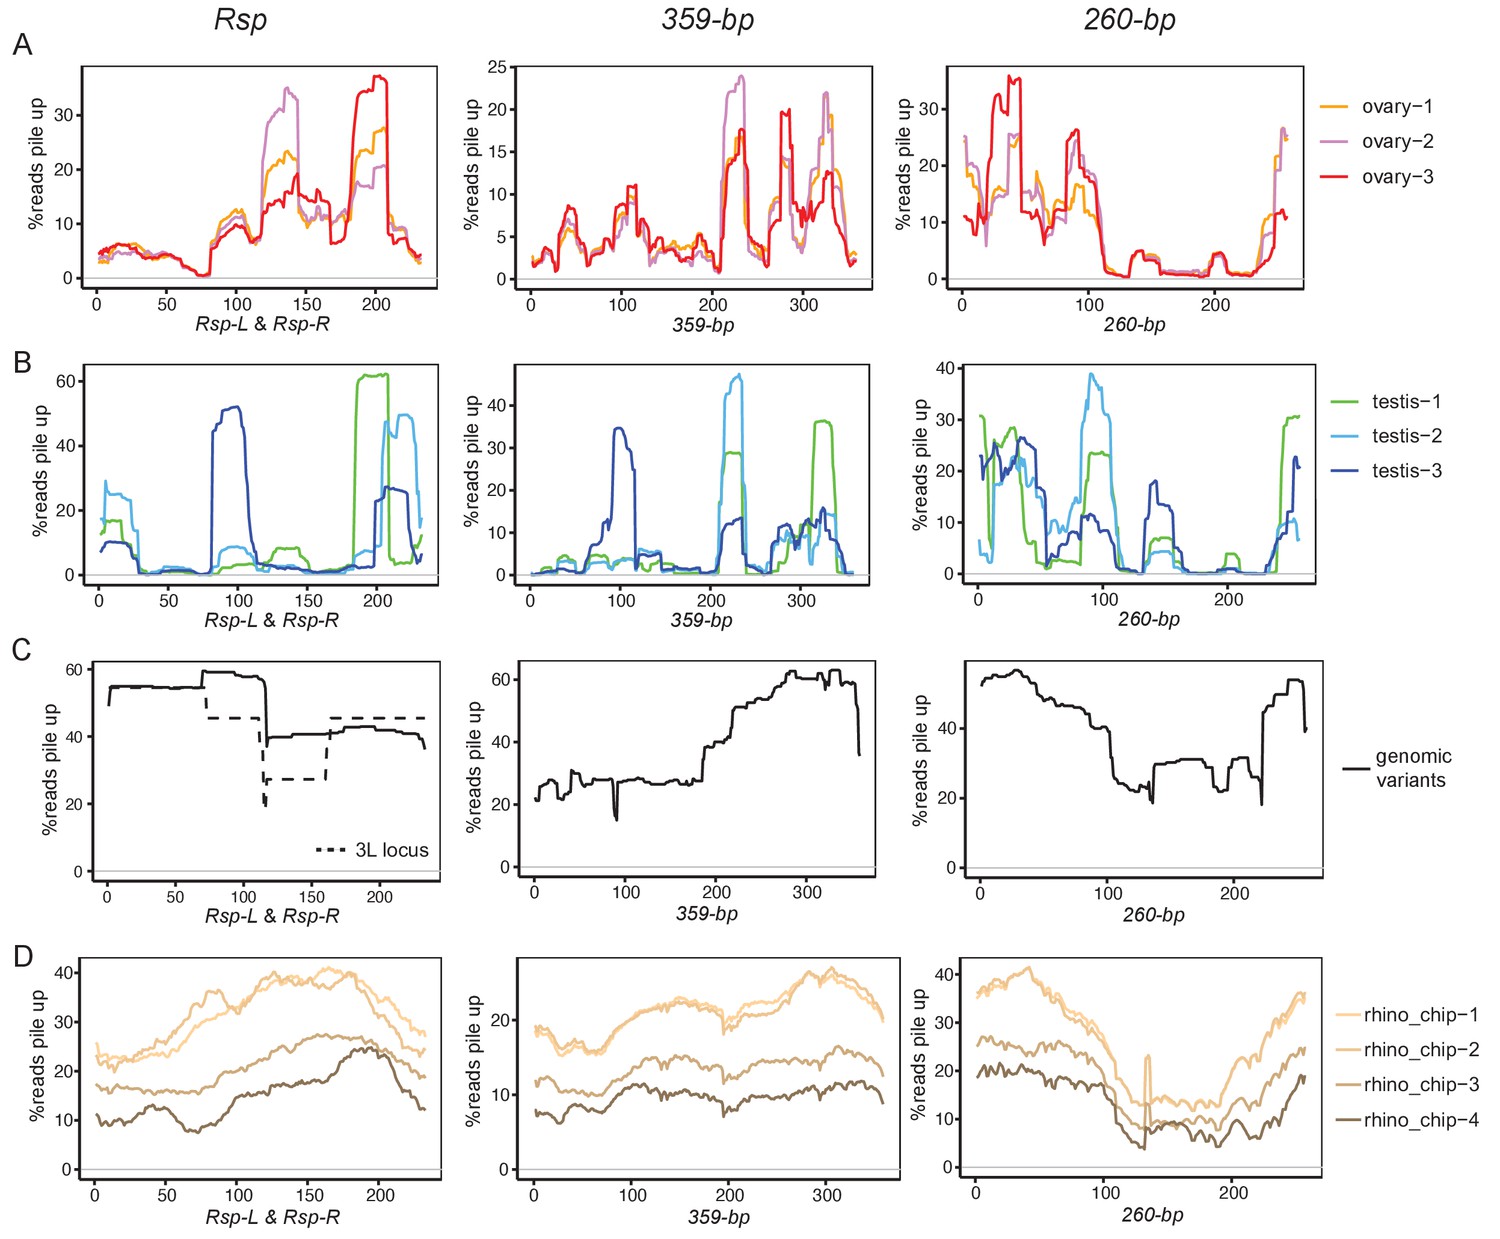
Non-uniform distribution of piRNA reads along satellite DNA (satDNA) consensus sequences.
Small RNA reads pileup along Rsp, 260-bp and 359-bp (representative 1.688 satellites) consensus sequences for ovary (A) and testis (B). Rsp-L is 1–116 nt and Rsp-R is 117–223 nt in a Rsp dimer sequence. (C) Alignment depth of genomic satDNA repeat variants extracted from the genome assembly along consensus sequences. Rsp variants resident inside the Ago3 intron on chromosome 3L (3L locus) are shown separately in a dashed line. (D) Rhino ChIP-seq reads pileup along the satellite consensus sequences. Data from Rozhkov et al., 2010; Mohn et al., 2014; Zhang et al., 2014; Quénerch'du et al., 2016; Andersen et al., 2017; Parhad et al., 2017.
Figure 2—figure supplement 3
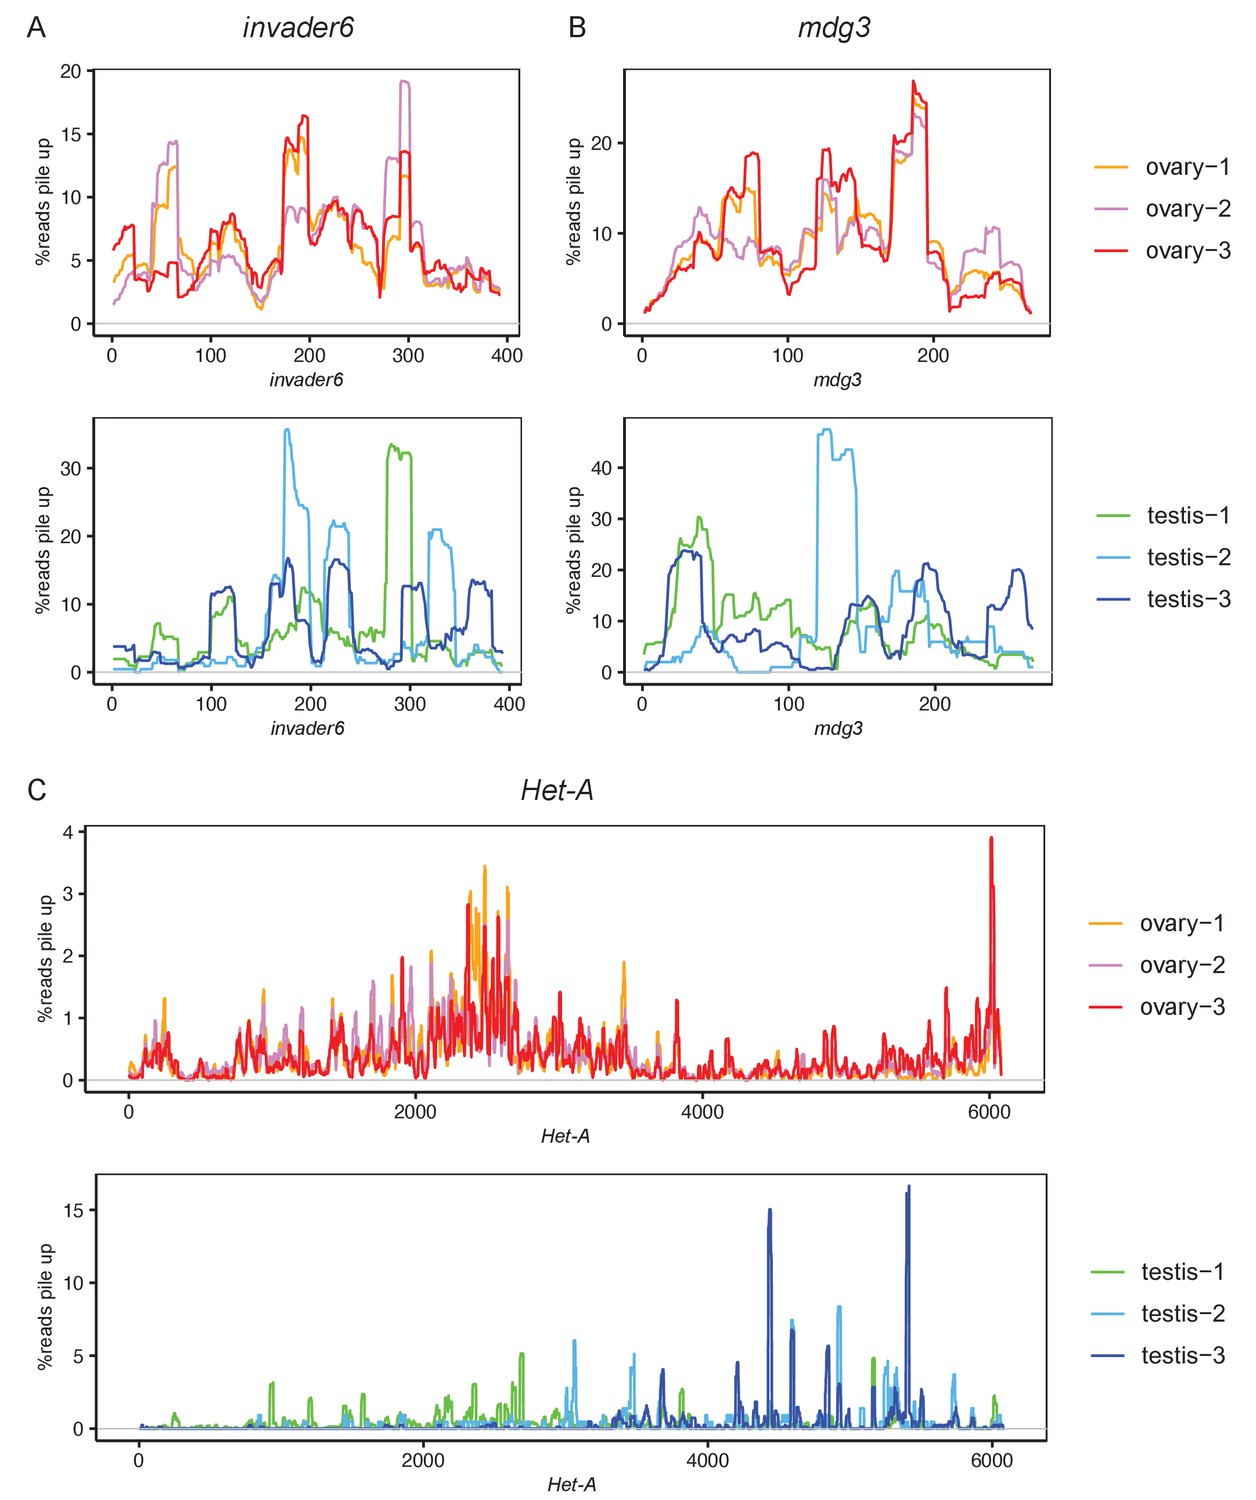
Non-uniform distribution of piRNA reads along the germline-dominant transposable element (TE) consensus sequences.
Small RNA reads pileup along Invader6 (A), mdg3 (B), and Het-A (C) consensus sequences for ovary and testis. Data from Rozhkov et al., 2010; Mohn et al., 2014; Quénerch'du et al., 2016; Andersen et al., 2017; Parhad et al., 2017.
Figure 2—figure supplement 4
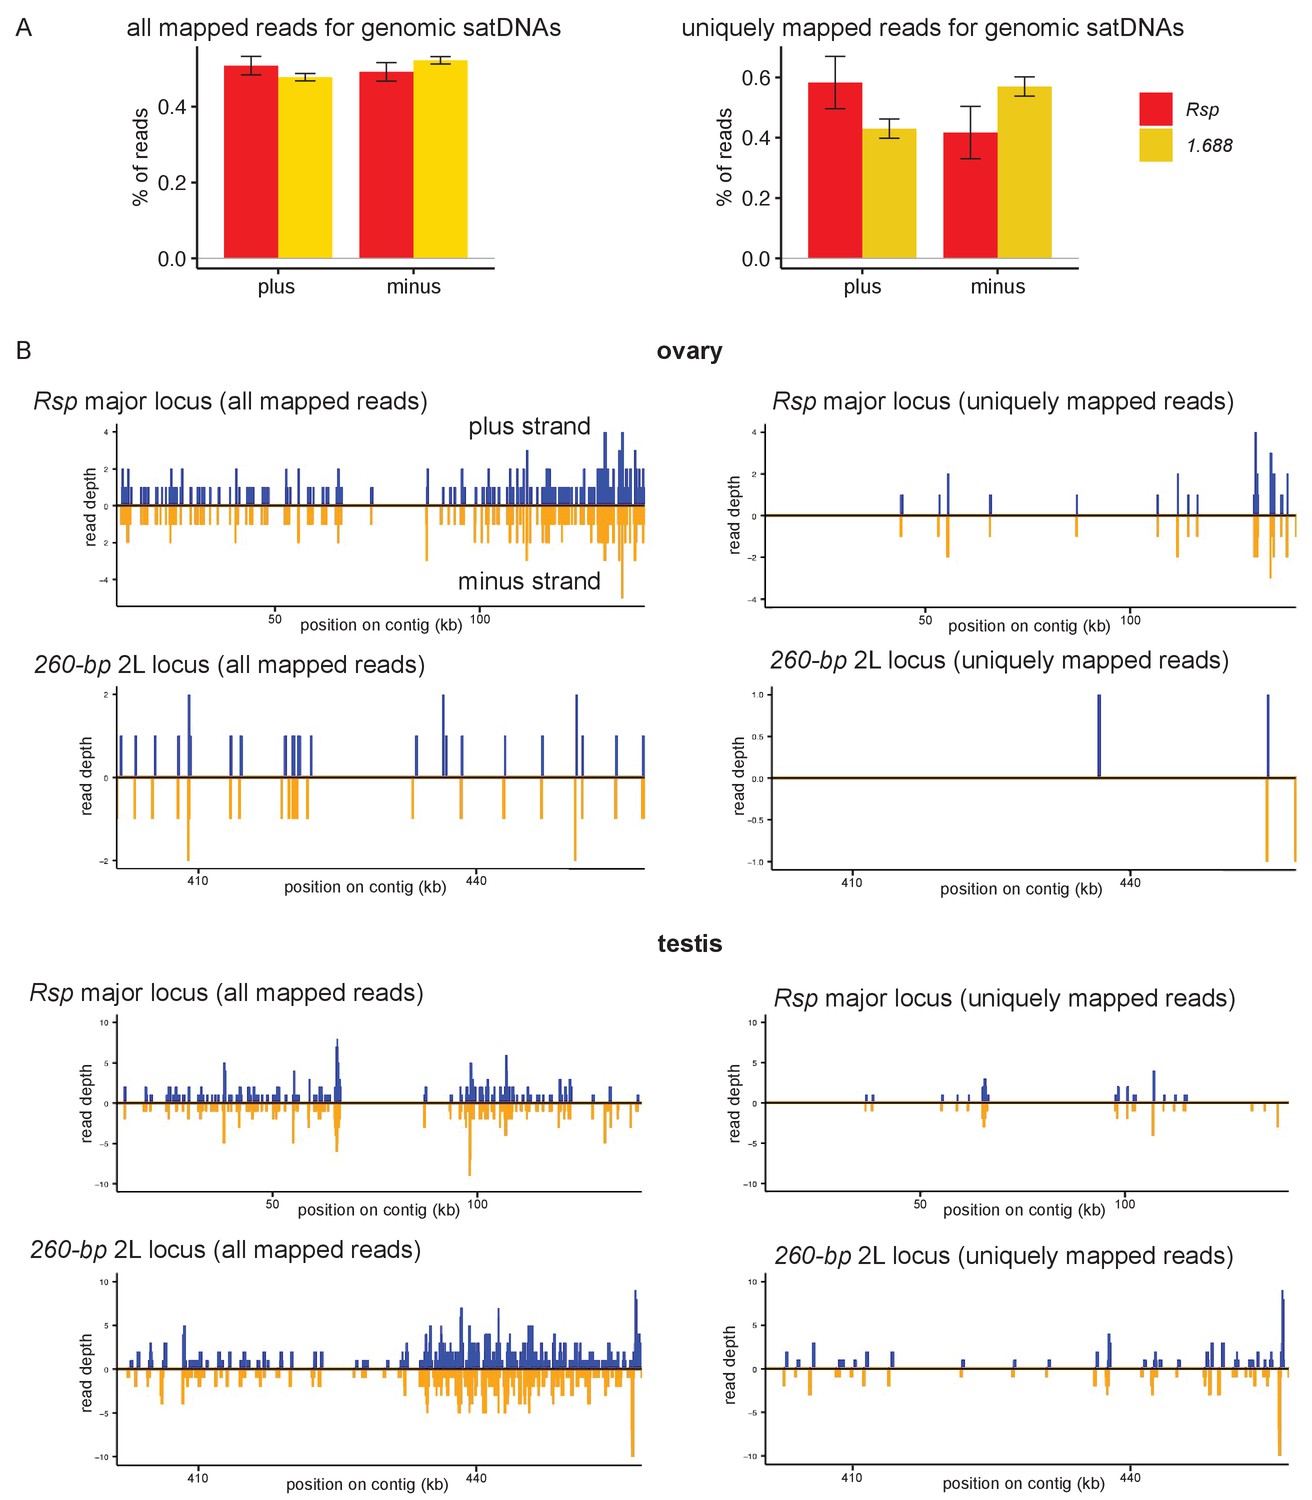
Satellite DNAs (satDNAs) are transcribed from both strands.
(A) Percentages of reads mapped to plus and minus strands at all genomic copies of Rsp or 1.688 satellites for all mapped reads (left) and uniquely mapped reads (right). Source data in Figure 2—figure supplement 4—source data 1. (B) Read depth for the plus and minus strands on the contigs containing the Rsp 2R major locus and 260-bp 2L locus (Khost et al., 2017). Read depth of all reads mapped to each locus is shown on the left, and depth of uniquely mapped reads is shown on the right. Ovary data is from Mohn et al., 2014; Andersen et al., 2017, and testis data is from this study.
-
Figure 2—figure supplement 4—source data 1
Percentages of reads mapped to plus and minus strands at all genomic copies of Rsp or 1.688 satellites.
Related to Figure 2—figure supplement 4A.
- https://cdn.elifesciences.org/articles/62375/elife-62375-fig2-figsupp4-data1-v2.ratio.xlsx
Figure 2—figure supplement 5
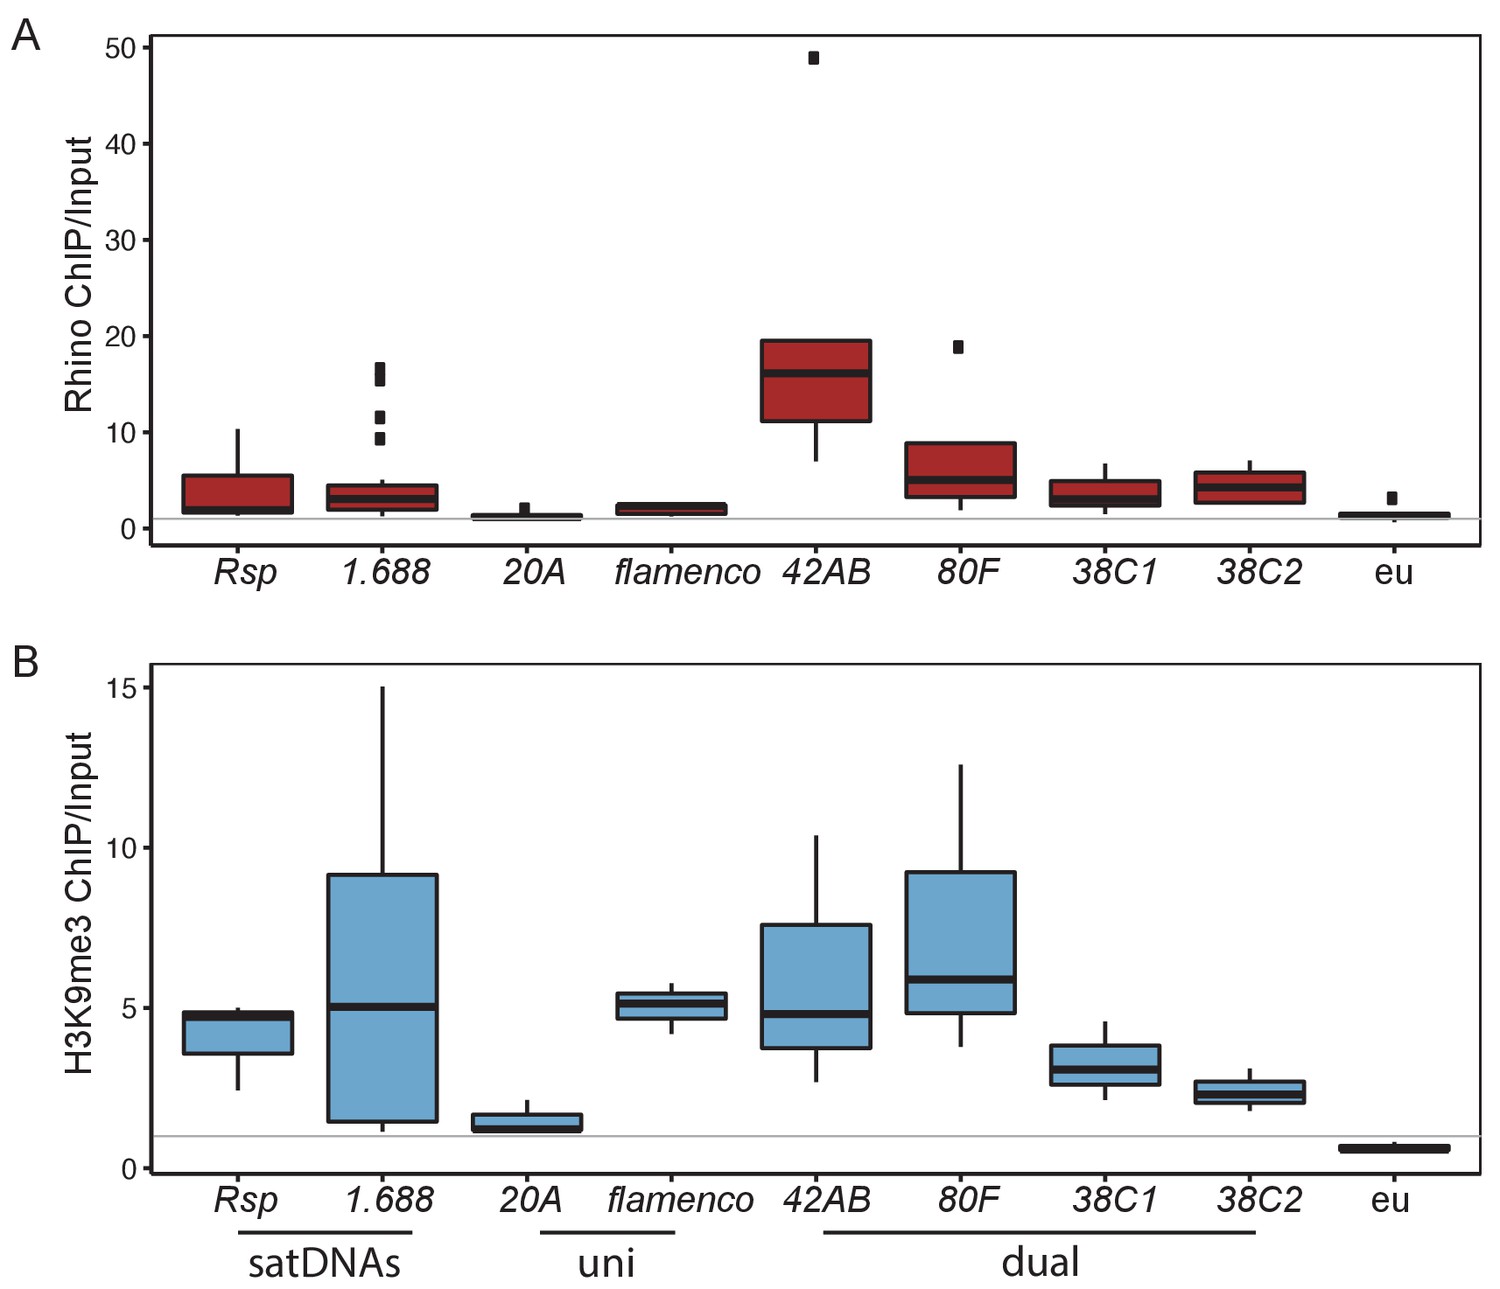
ChIP-seq result shows the chromatin state of satellite DNAs (satDNAs), uni-strand piRNA clusters, dual-strand piRNA clusters, and euchromatin (eu).
(A) Rhino ChIP-seq enrichment scores for Rsp, 1.688 (based on an analysis of discrete heterochromatic loci, details in Materials and methods), piRNA clusters, and euchromatin indicate that satDNAs are enriched for Rhino, resembling dual-strand piRNA clusters. Uni-strand piRNA clusters and euchromatin are not Rhino enriched. The Rhino enrichment results for 1.688 with all subfamilies across the genome are similar. (B) H3K9me3 ChIP-seq enrichment scores indicate that Rsp, 1.688 (based on an analysis of discrete heterochromatic loci, details in Materials and methods) and most piRNA clusters are enriched for H3K9me3, while euchromatin is not. Source data in Figure 2—source data 2. Data from Klenov et al., 2014; Le Thomas et al., 2014; Mohn et al., 2014; Zhang et al., 2014; Parhad et al., 2017.
Figure 3 with 3 supplements
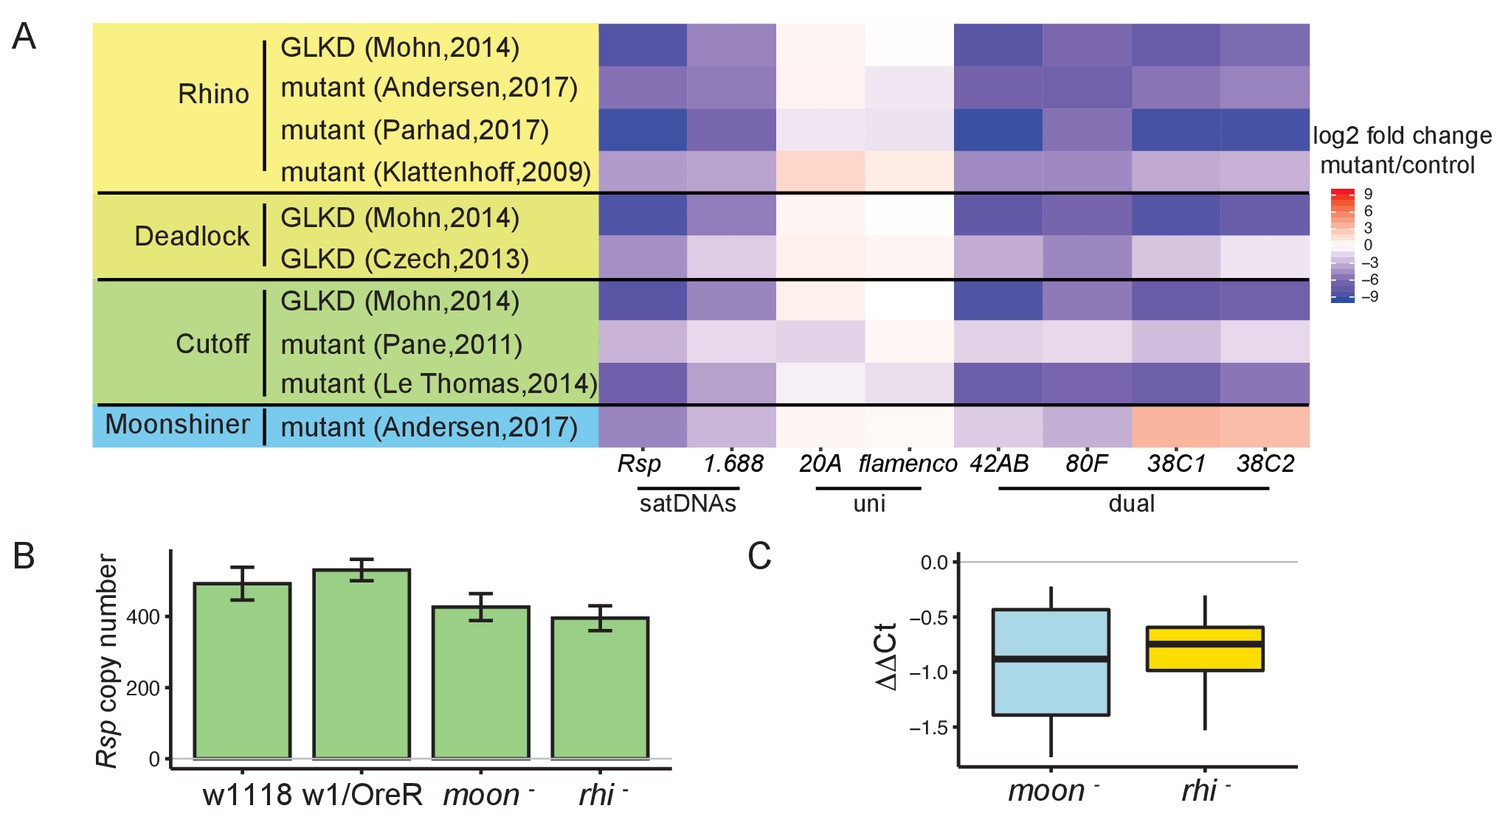
Satellite DNA (satDNA) loci are regulated by the heterochromatin-dependent transcription machinery in Drosophila ovaries.
(A) Heatmap showing the quantification of changes in piRNA abundance in small RNA-seq data from mutants of rhino, cutoff, deadlock, and moonshiner compared to controls for satDNAs and piRNA clusters, normalized by miRNA level. GLKD: germline knockdown. Complete list of log2 fold changes in Supplementary file 6. (B) qPCR estimate of Rsp copy number in wild types and mutants. (C) qRT-PCR estimate of Rsp transcript level in mutants compared to wild types. ΔΔCt = ΔCt(wild type) – ΔCt(mutant), a negative value indicates lower expression in mutant. Student’s t-test, p-value=0.077, 0.048. Source data in Figure 3—source data 1.
-
Figure 3—source data 1
Rsp copy number and expression level estimated from qPCR and q-RT-PCR.
Related to Figure 3B, C.
- https://cdn.elifesciences.org/articles/62375/elife-62375-fig3-data1-v2.xlsx
Figure 3—figure supplement 1
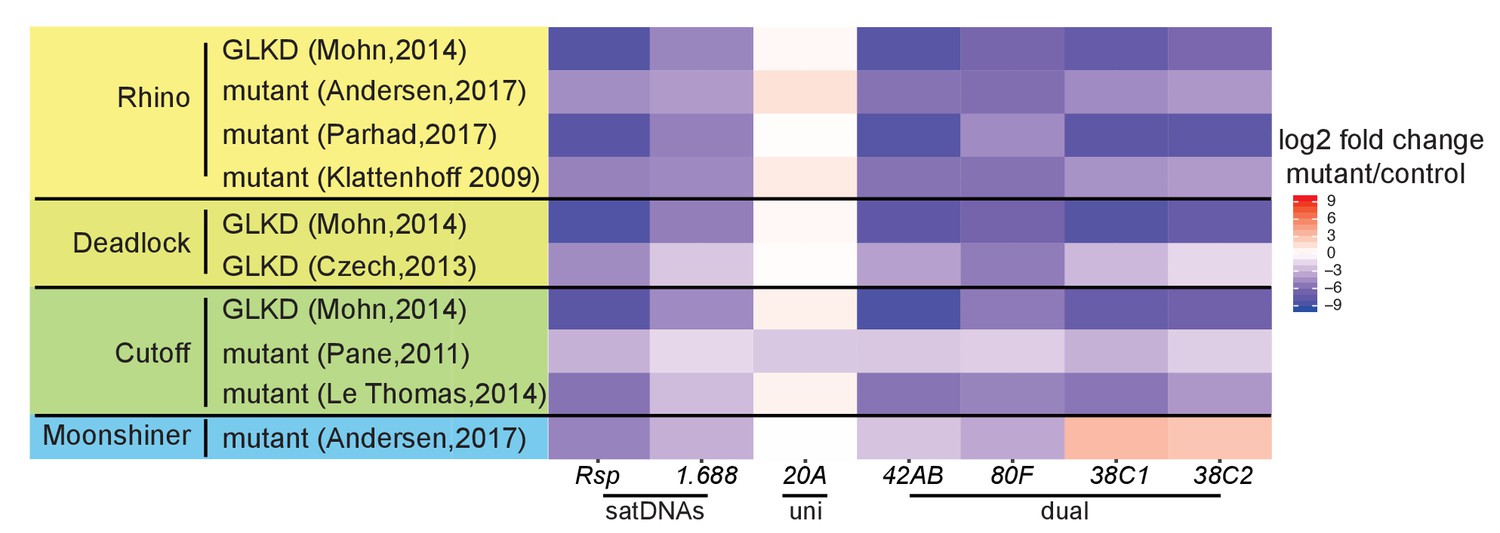
Satellite DNA (satDNA) loci are regulated by the heterochromatin-dependent transcription machinery in Drosophila ovaries.
Heatmap showing the quantification of changes in piRNA abundance from mutants of rhino, cutoff, deadlock, and moonshiner compared to controls for satDNAs and piRNA clusters, normalized to the flamenco piRNA cluster. GLKD: germline knockdown. Complete list of log2 fold changes in Supplementary file 7. Data from Klattenhoff et al., 2009; Pane et al., 2011; Czech et al., 2013; Le Thomas et al., 2014; Mohn et al., 2014; Andersen et al., 2017; Parhad et al., 2017.
Figure 3—figure supplement 2
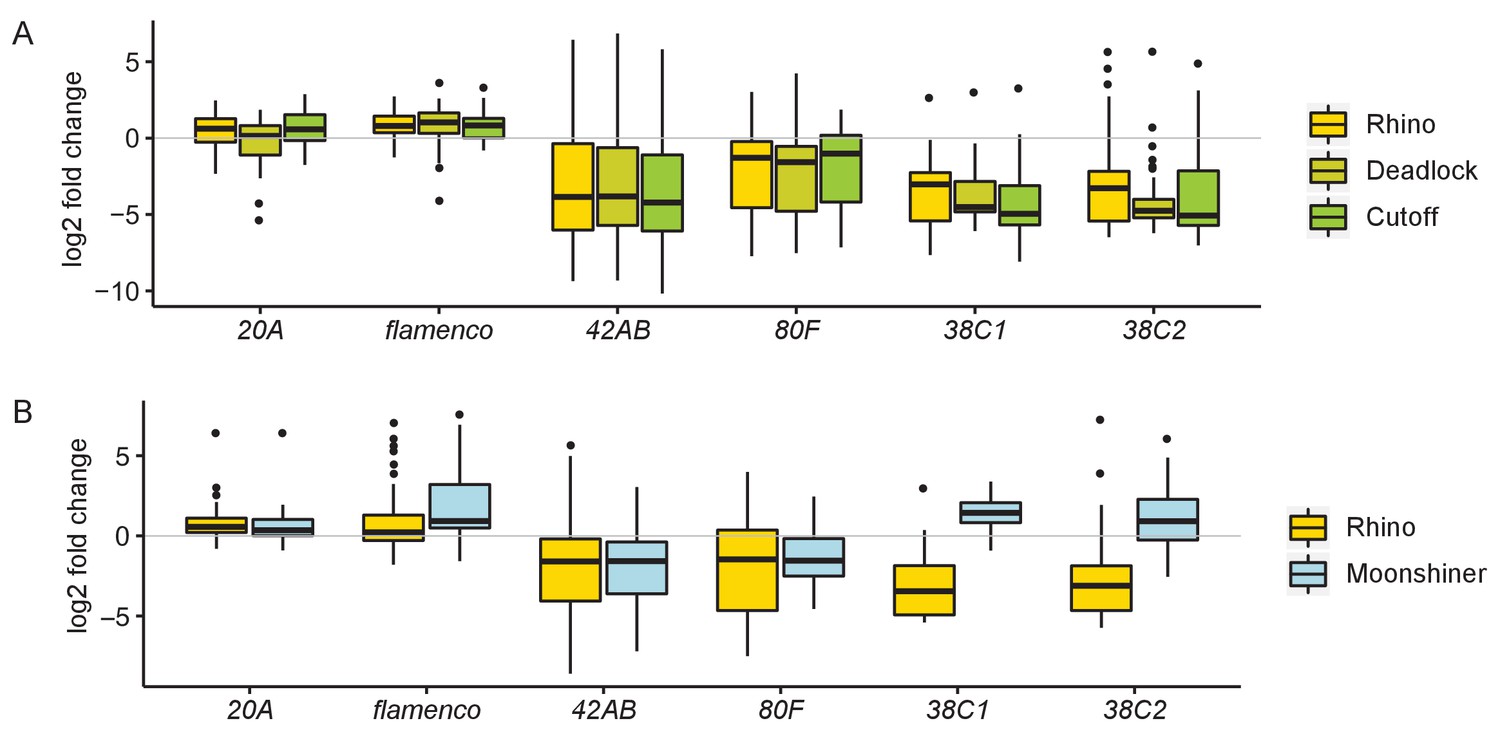
Rhino, Deadlock, and Cutoff (RDC) and moon mutants affect piRNA precursor transcription at piRNA clusters.
Boxplots showing the quantification of total RNA abundance for piRNA clusters in RDC (A) and rhi/moon (B) mutant ovaries relative to wild type (log2 fold change of 1 kb windows). 20A and flamenco are uni-strand piRNA clusters; 42AB, 80F, and 38C1/2 are dual-strand piRNA clusters. Source data in Figure 3—figure supplement 2—source data 1. Data from Mohn et al., 2014 for (A) and (Andersen et al., 2017) for (B). A sliding window method is not feasible for analyzing satellite DNAs (satDNAs) because it relies on uniquely mapped reads, of which there are relatively few at satDNA loci. Therefore, we instead count reads mapping to all genomic repeat variants for each satDNA and piRNA cluster (the whole locus; Supplementary file 8). The locus-wide results are comparable with the sliding window analysis, but more conservative.
-
Figure 3—figure supplement 2—source data 1
Log2 fold changes of total RNA abundance for piRNA clusters from Rhino, Deadlock, and Cutoff (RDC) and Moon mutants.
- https://cdn.elifesciences.org/articles/62375/elife-62375-fig3-figsupp2-data1-v2.xlsx
Figure 3—figure supplement 3

Satellite DNA (satDNA) piRNA production is affected in mutants of pathways involving piRNA precursor export, primary piRNA biogenesis, and the ping-pong cycle.
Heatmap showing the quantification of changes in small RNA abundance from mutants of proteins in the primary piRNA pathway (A), pathway for piRNA precursor export from the nucleus and ping-pong pathway (B, C) compared to controls. The results are consistent between replicates/studies regarding Vreteno, Shutdown, Krimper, and UAP56, suggesting that complex satDNA piRNA production is regulated by these proteins. For some mutants, including Aub, SpnE, and Piwi, the results differed between complex satDNAs; for example, the 1.688 family of satDNAs shows consistently decreased piRNA levels, but not Rsp for Piwi. For other proteins such as Zucchini and Armitage, the patterns of change for satDNAs are variable between different datasets; for example, satDNAs show decreased piRNA levels in one of the datasets, but increased levels in the other dataset for Zucchini. For all the datasets analyzed, all piRNA clusters behave as reported previously. GLKD: germline knockdown. Flamenco is only expressed in somatic tissues, GLKD does not affect its abundance. piRNAs are resistant to oxidation, for one of the datasets from Zhang et al., 2012, they were selected for sequencing after oxidation to exclude other types of small RNAs (e.g., siRNAs, miRNAs), so normalization to miRNA is not appropriate, thus it is excluded in (B). In the piwi mutant from Malone et al., 2009, flamenco expression is affected and not appropriate as control for normalization, thus it is excluded in (C). Source data in Figure 3—figure supplement 3—source data 1. Data from Malone et al., 2009; Handler et al., 2011; Olivieri et al., 2012; Preall et al., 2012; Zhang et al., 2012; Czech et al., 2013; Sato et al., 2015; Wang et al., 2015.
-
Figure 3—figure supplement 3—source data 1
Log2 fold changes of small RNA abundance for satellite DNAs (satDNAs) and piRNA clusters from mutants of proteins in the primary piRNA pathway, pathway for piRNA precursor export from the nucleus and ping-pong pathway.
- https://cdn.elifesciences.org/articles/62375/elife-62375-fig3-figsupp3-data1-v2.xlsx
Figure 4 with 1 supplement
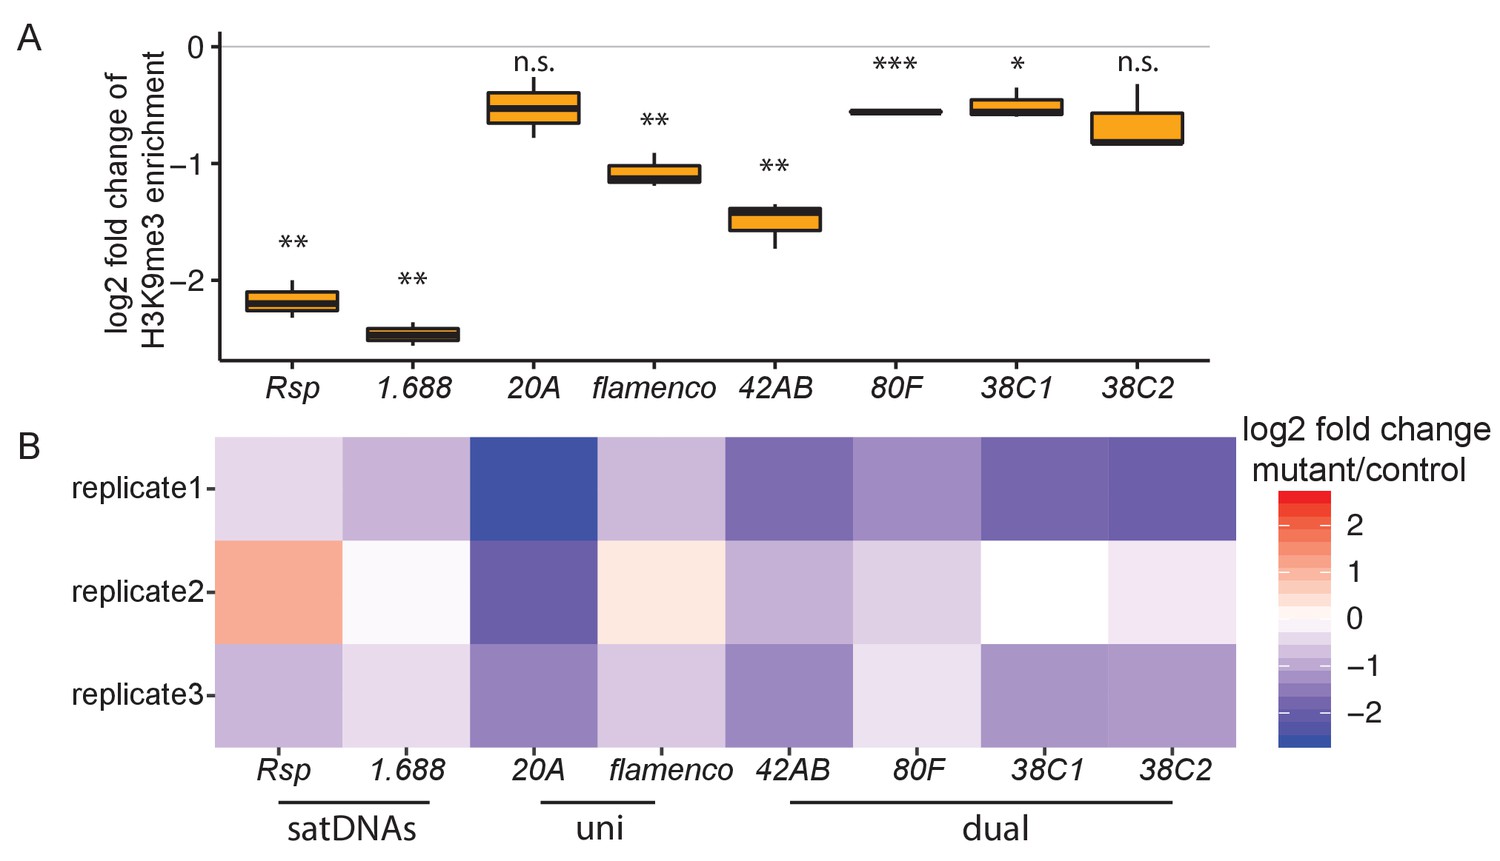
Heterochromatin establishment disrupted at satellite DNAs (satDNAs) in piwi embryonic knockdown ovaries.
(A) Log2 fold change of H3K9me3 ChIP/input enrichment shows satDNA H3K9me3 levels decrease in piwi embryonic knockdown ovaries compared to control. Source data in Figure 4—source data 1. p-values are estimated by one-sample t-test (mu = 0) with FDR corrections (Benjamini and Hochberg, 1995). * adjusted p-value<0.05, ** adjusted p-value<0.01, *** adjusted p-value<0.001. (B) Log2 fold change of small RNA abundance shows satDNA small RNA levels decrease compared to controls, with variation observed for replicate2. Small RNA abundance is normalized to the number of reads mapped to miRNAs. Source data in Figure 4—source data 2.
-
Figure 4—source data 1
Log2 fold change of H3K9me3 ChIP/input enrichment for satellite DNAs (satDNAs) and piRNA clusters in piwi embryonic knockdown ovaries.
Related to Figure 4A.
- https://cdn.elifesciences.org/articles/62375/elife-62375-fig4-data1-v2.xlsx
-
Figure 4—source data 2
Log2 fold change of small RNA abundance for satellite DNAs (satDNAs) and piRNA cluters in piwi embryonic knockdown ovaries.
Related to Figure 4B.
- https://cdn.elifesciences.org/articles/62375/elife-62375-fig4-data2-v2.xlsx
Figure 4—figure supplement 1
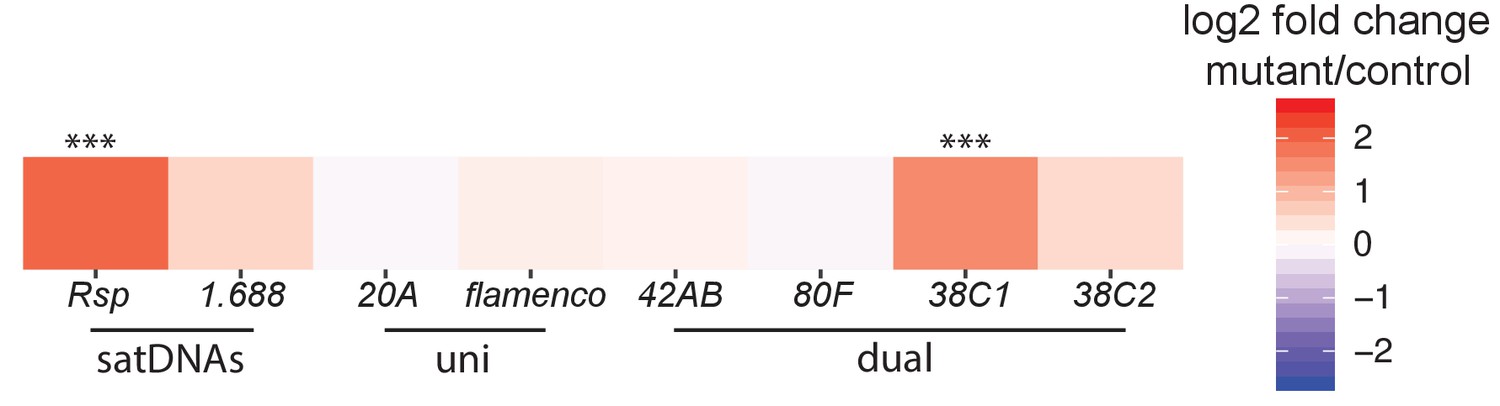
Log2 fold change of total RNA abundance shows satellite DNA (satDNA) long RNA levels increase in piwi embryonic knockdown ovaries compared to control.
Adjusted p-values are reported by DESeq2. 20A and flamenco are uni-strand piRNA clusters (uni), 42AB, 80F, and 38C1/2 are dual-strand piRNA clusters (dual). *** adjusted p-value<0.001. Source data in Figure 4—figure supplement 1—source data 1. Data from Akkouche et al., 2017.
-
Figure 4—figure supplement 1—source data 1
Log2 fold change of total RNA abundance for satellite DNA (satDNA) and piRNA clusters in piwi embryonic knockdown ovaries.
- https://cdn.elifesciences.org/articles/62375/elife-62375-fig4-figsupp1-data1-v2.csv
Figure 5
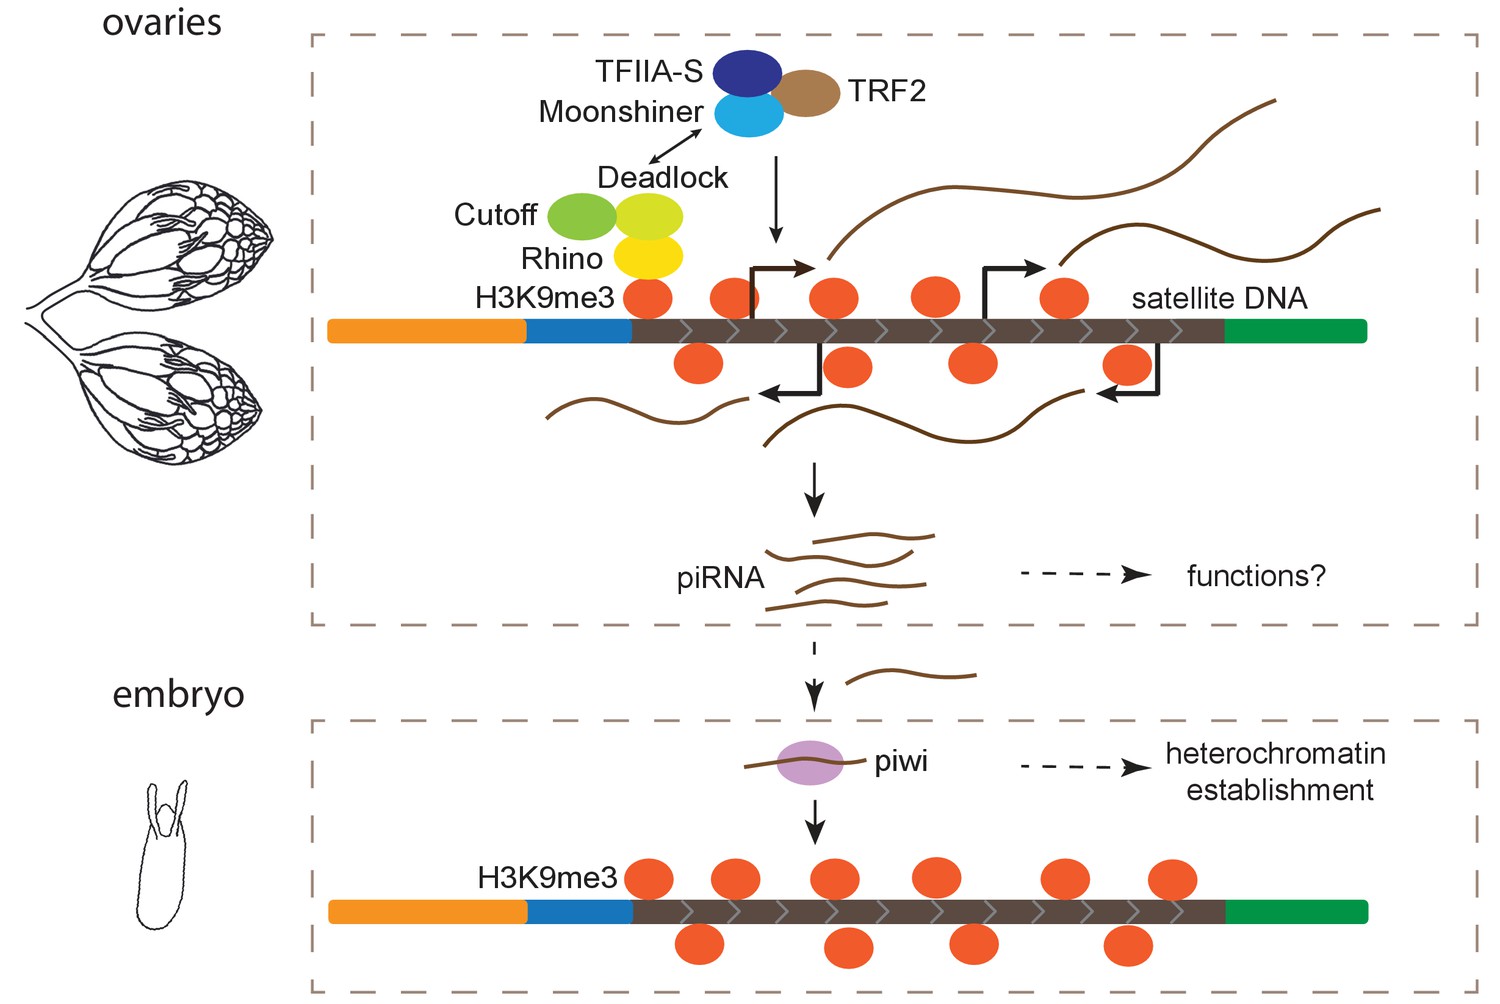
Model for maintenance of satellite DNA (satDNA) chromatin in female germline.
Complex satDNA transcription is regulated by the heterochromatin-dependent Rhino-Deadlock-Cutoff and Moonshiner machinery, and the long RNA transcripts are processed into piRNAs. While their functions in ovaries are unclear, these piRNAs play roles in the establishment of heterochromatin at their own genomic loci in embryos. This pathway may be important for maintaining genome stability in pericentric heterochromatin, proper nuclear organization, and other unexplored functions.
Tables
Key resources table
| Reagent type (species) or resource | Designation | Source or reference | Identifiers | Additional information |
|---|---|---|---|---|
| Gene (Drosophila melanogaster) | rhi | Flybase | Flybase: FBgn0004400 | |
| Gene (D. melanogaster) | moon | Flybase | Flybase: FBgn0030373 | |
| Gene (D. melanogaster) | del | Flybase | Flybase: FBgn0086251 | |
| Gene (D. melanogaster) | cuff | Flybase | Flybase: FBgn0260932 | |
| Gene (D. melanogaster) | piwi | Flybase | Flybase: FBgn0004872 | |
| Strain, strain background (D. melanogaster, female and male) | Iso-1 | Bloomington Drosophila Stock Center (BDSC) | BDSC: 2057; RRID:BDSC_2057 | |
| Strain, strain background (D. melanogaster, female) | ZW144 | doi:10.1534/g3.114.015883 Grenier et al., 2015 | ||
| Strain, strain background (D. melanogaster, female) | Ral357 | BDSC | BDSC:25184; RRID:BDSC_25184 | |
| Strain, strain background (D. melanogaster, female) | Ral380 | BDSC | BDSC:25190; RRID:BDSC_25190 | |
| Strain, strain background (D. melanogaster, female) | It pk cn bw | Ganetzky, 1977 | ||
| Strain, strain background (D. melanogaster, female) | w1118 | BDSC | BDSC:5905; RRID:BDSC_5905 | |
| Strain, strain background (D. melanogaster, female) | w1 | BDSC | BDSC:2390; RRID:BDSC_2390 | |
| Strain, strain background (D. melanogaster, female) | OregonR | BDSC | BDSC:2376; RRID:BDSC_2376 | |
| Genetic reagent (D. melanogaster) | rhi mutant | Vienna Drosophila Resource Center (VRDC) | VDRC:313487 | |
| Genetic reagent (D. melanogaster) | rhi mutant | VRDC | VDRC:313488 | |
| Genetic reagent (D. melanogaster) | moon mutant | VRDC | VDRC:313735 | |
| Genetic reagent (D. melanogaster) | moon mutant | VRDC | VDRC:313738 | |
| Sequence-based reagent | RPS3 forward | IDT | qPCR primer | AGTTGTACGCCGAGAAGGTG |
| Sequence-based reagent | RPS3 Reverse | IDT | qPCR primer | TGTAGCGGAGCACACCATAG |
| Sequence-based reagent | tRNA forward | IDT | qPCR primer | CTAGCTCAGTCGGTAGAGCATGA |
| Sequence-based reagent | tRNA Reverse | IDT | qPCR primer | CCAACGTGGGGCTCGAAC |
| Sequence-based reagent | Rsp forward | IDT | qPCR primer | GGAAAATCACCCATTTTGATCGC |
| Sequence-based reagent | Rsp Reverse | IDT | qPCR primer | CCGAATTCAAGTACCAGAC |
| Sequence-based reagent | Probe for 1.688 | IDT | RNA FISH probe | Cy5TTTTCCAAATTTCGGTCATCAAATAATCAT |
| Sequence-based reagent | Probe for Rsp | Stellaris | RNA FISH probe | Custom Stellaris FISH probes with 45 sequences listed in Supplementary file 11 |
| Sequence-based reagent | T7_rsp2 | IDT | Northern blot probe synthesis primer | TAATACGACTCACTATAGGGCCGAATTCAAGTACCAGAC |
| Sequence-based reagent | rsp1 | IDT | Northern blot probe synthesis primer | GGAAAATCACCCATTTTGATCGC |
| Sequence-based reagent | Rsp primer_F | IDT | Slot blot probe synthesis primer | TAATACGACTCACTATAGGGGAAAATCACCCATTTTGATCGC |
| Sequence-based reagent | Rsp primer_R | IDT | Slot blot probe synthesis primer | CCGAATTCAAGTACCAGAC |
| Sequence-based reagent | rp49 primer_F | IDT | Slot blot probe synthesis primer | TAATACGACTCACTATAGGGCAGTAAACGCGGTTCTGCATG |
| Sequence-based reagent | rp49 primer_R | IDT | Slot blot probe synthesis primer | CAGCATACAGGCCCAAGATC |
| Software, algorithm | Bowtie2 | doi:10.1038/nmeth.1923. | RRID:SCR_016368 | |
| Software, algorithm | Bowtie | doi:10.1002/0471250953.bi1107s32. | RRID:SCR_005476 | |
| Software, algorithm | DESeq2 | doi:10.1186/s13059-014-0550-8. | RRID:SCR_015687 | |
| Software, algorithm | piPipes | doi:10.1093/bioinformatics/btu647. | ||
| Software, algorithm | BLAST | NCBI | RRID:SCR_004870 | |
| Software, algorithm | R | R core team | RRID:SCR_001905 | |
| Software, algorithm | Customized Python scripts | This paper | Wei et al., 2021b GitHub (https://github.com/LarracuenteLab/Dmelanogaster_satDNA_regulation) |
Additional files
-
Supplementary file 1
List of datasets used in this paper.
- https://cdn.elifesciences.org/articles/62375/elife-62375-supp1-v2.xlsx
-
Supplementary file 2
Count in RPM values of Rsp/1.688 transcripts in total and poly-A RNA-seq datasets from various tissues.
- https://cdn.elifesciences.org/articles/62375/elife-62375-supp2-v2.count.docx
-
Supplementary file 3
Slot blot estimate of Rsp copy number.
- https://cdn.elifesciences.org/articles/62375/elife-62375-supp3-v2.docx
-
Supplementary file 4
Rsp expression level correlates with its copy number in the genome.
Estimates from slot blot, northern blot, qPCR, and qRT-PCR indicate correlation between Rsp genomic copy number and expression level.
- https://cdn.elifesciences.org/articles/62375/elife-62375-supp4-v2.table.docx
-
Supplementary file 5
RIP-seq results for Piwi, Aub, and Ago3 from ovaries.
- https://cdn.elifesciences.org/articles/62375/elife-62375-supp5-v2.xlsx
-
Supplementary file 6
Log2 fold changes of small RNA abundance for satDNAs and piRNA clusters normalized to miRNA abundance in Rhino, Deadlock, and Cutoff (RDC) and Moon mutants.
- https://cdn.elifesciences.org/articles/62375/elife-62375-supp6-v2.xlsx
-
Supplementary file 7
Log2 fold changes of small RNA abundance for satDNAs and piRNA clusters normalized to the flamenco piRNA cluster in Rhino, Deadlock, and Cutoff (RDC) and Moon mutants.
- https://cdn.elifesciences.org/articles/62375/elife-62375-supp7-v2.xlsx
-
Supplementary file 8
Log2 fold change of total RNA abundance for satDNAs and piRNA clusters in Rhino, Deadlock, and Cutoff (RDC) and Moon mutants.
- https://cdn.elifesciences.org/articles/62375/elife-62375-supp8-v2.csv
-
Supplementary file 9
Log2 fold change of total and polyA selected RNA abundance in rhi mutant for satellite DNAs (satDNAs) and piRNA clusters.
- https://cdn.elifesciences.org/articles/62375/elife-62375-supp9-v2.csv
-
Supplementary file 10
Log2 fold change of H3K9me3 ChIP/input enrichment levels in piwi germline knockdown/mutant for satellite DNAs (satDNAs) and piRNA clusters.
- https://cdn.elifesciences.org/articles/62375/elife-62375-supp10-v2.xlsx
-
Supplementary file 11
Rsp probe sequences for RNA fluorescence in situ hybridization (FISH).
- https://cdn.elifesciences.org/articles/62375/elife-62375-supp11-v2.xlsx
-
Transparent reporting form
- https://cdn.elifesciences.org/articles/62375/elife-62375-transrepform-v2.pdf
Download links
A two-part list of links to download the article, or parts of the article, in various formats.
Downloads (link to download the article as PDF)
Open citations (links to open the citations from this article in various online reference manager services)
Cite this article (links to download the citations from this article in formats compatible with various reference manager tools)
Heterochromatin-dependent transcription of satellite DNAs in the Drosophila melanogaster female germline
eLife 10:e62375.
https://doi.org/10.7554/eLife.62375


