Cystic proliferation of germline stem cells is necessary to reproductive success and normal mating behavior in medaka
- Instituto Tecnológico de Chascomús, INTECH (CONICET-UNSAM), Argentina
- Reproductive and Molecular Biology Group, Department of Structural and Functional Biology, Institute of Biosciences, São Paulo State University (UNESP), Brazil
- Salmonid Experimental Station at Campos do Jordão, UPD-CJ, Sao Paulo Fisheries Institute (APTA/SAA), Brazil
Figures
Figure 1 with 1 supplement
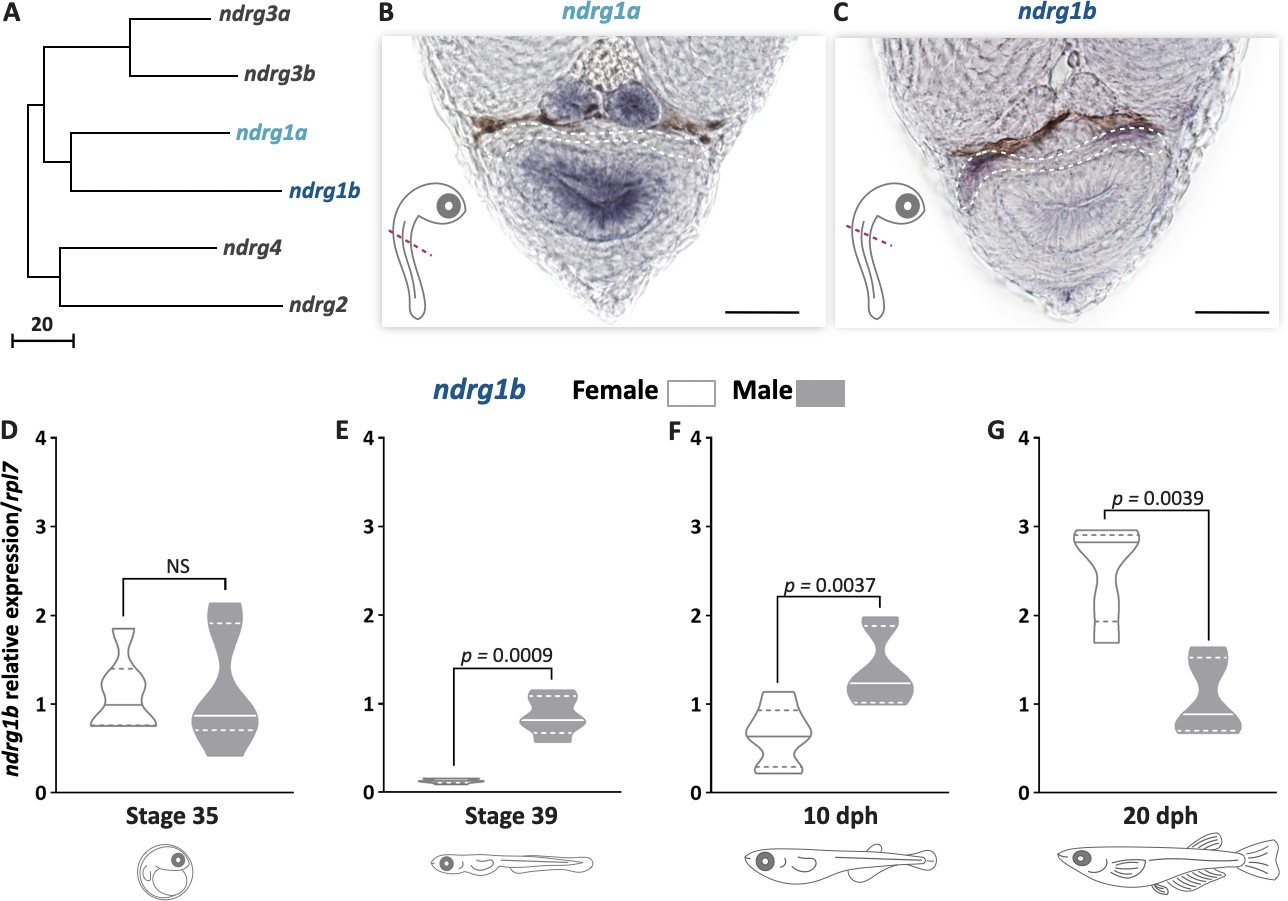
ndrg1b is down-regulated during cystic proliferation in gonadal development.
Phylogenetic tree showing the relationships among the ndrg family members in medaka (A), obtained using the neighbor-joining method and a bootstrap test (MEGA 7.0 software). The scale beneath the tree reflects sequence distances. ENSEMBL accession sequences are provided in Supplementary file 1A. Transversal sections of gonadal region (red line) in whole embryos at stage 35 to detect ndrg1a (B) and ndrg1b (C) transcripts using in situ hybridization. Gonadal region is surrounded by white dotted line; scale bar represents 20 µm. Transcript abundance levels of ndrg1b in different stages of gonadal development: 35 (D), 39 (E), 10 days post hatching (dph) (F), and 20 dph (G). Quantification was performed using the 2-ΔΔCt method and ndrg1b values were normalized to rpl7. Genotypic sex was determined by the presence/absence of the dmy gene; female (XX) and male (XY) are represented by empty bars or full bars, respectively. n = 5–6 pools per sex in stages 35 and 39, and n = 6–7 individuals per sex in 10 and 20 dph. p-Values are indicated when transcript abundance between sexes at the same developmental stage differ significantly (p<0.05). NS: not statistically significant. Relative gene expression levels were compared as described by Pfaffl, 2001.
Figure 1—figure supplement 1
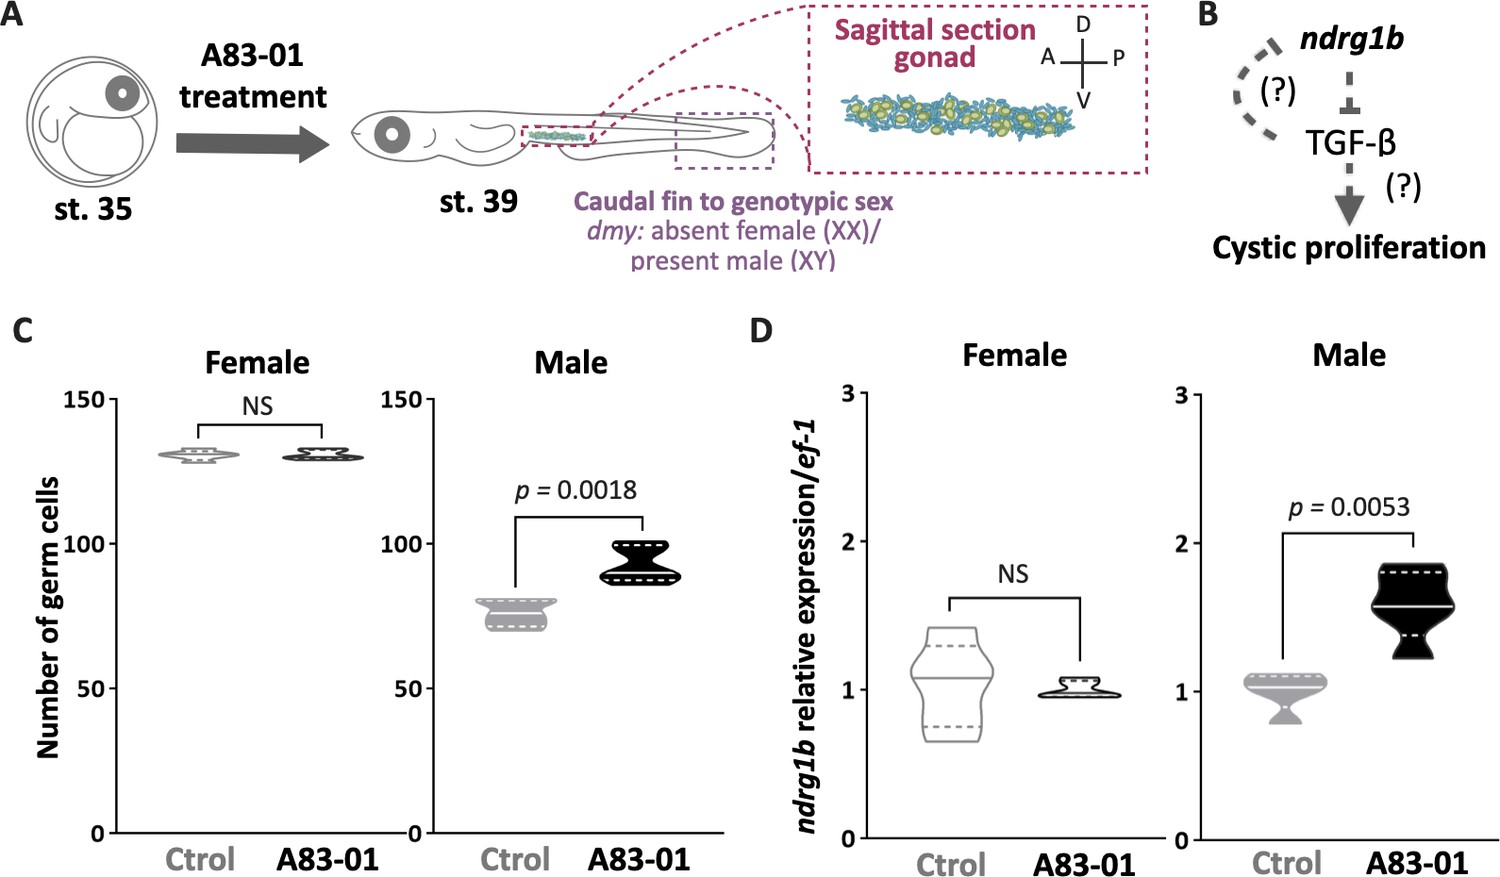
TGF-β is not involved in the cystic proliferation during early gonadal development.
Schematic representation of the experimental procedure adopted for TGF-β inhibitor (A83-01) treatment (A). Proposed hypothesis (B). Total number of embryonic germline stem cells in XX and XY groups (C) in embryos at stage 39 treated with A83-01. n = 5 pools per group. p-Values are indicated when transcript abundance and number of germ cells between treated group and untreated group (Ctrol) of the same sex differ significantly (p<0.05). Transcript abundance levels of ndrg1b in XX and XY (D) embryos at stage 39 treated with A83-01. Quantification was performed using the 2-ΔΔCt method and values were normalized to rpl7 (n = 5 pools of five individuals per group). Genotypic sex was determined by the presence/absence of the dmy gene; female (XX) and male (XY) are represented by empty bars or full bars, respectively. NS: not statistically significant. Relative gene expressions compared according to Pfaffl, 2001 for transcript abundance and unpaired Student’s t-test for germ cell number.
Figure 2 with 4 supplements

The mutation of ndrg1b affects gonadal development at stage 39.
Schematic representation of the experimental procedure adopted to analyze the effect of ndrg1b loss on germ cell number and proliferation (A: anterior, P: posterior, D: dorsal; and V: ventral) (A). Fluorescent images of gonads in female or male embryos; wild-type (wt) = injected with cas9 (B) and sgN1b = injected cas9+sg1_ndrg1b (C). Embryonic germline stem cells (EGSCs) were stained with an anti-OLVAS antibody (green), nuclei were stained with DAPI (blue), and proliferating cells with PCNA (: Proliferating cell nuclear antigenDMSO: Dimethyl sulfoxide) antibody (red), scale bar represents 20 µm. Total numbers of EGSCs (D), number of EGSCs per cyst with type II division (E), total numbers of germ cells with type I or type II division (F), and number of PCNA-positive type I and cystic type II germ cells relative to the total number of type I or type II germ cells, respectively (G), in wt female or male embryos (represented by gray empty bars or full bars, respectively) and sgN1b female or male embryos (represented by cyan empty bars or full bars, respectively). Vertical bars indicate mean, with its respective standard error of the mean. n = 8 per each wt group and n = 12 per each sgN1b group. p-Values are indicated when the number of germ cells between groups differs significantly (p<0.05). NS: not statistically significant. Unpaired Student’s t-test per E and Tukey’s multiple comparisons test per D, F, and G.
Figure 2—figure supplement 1
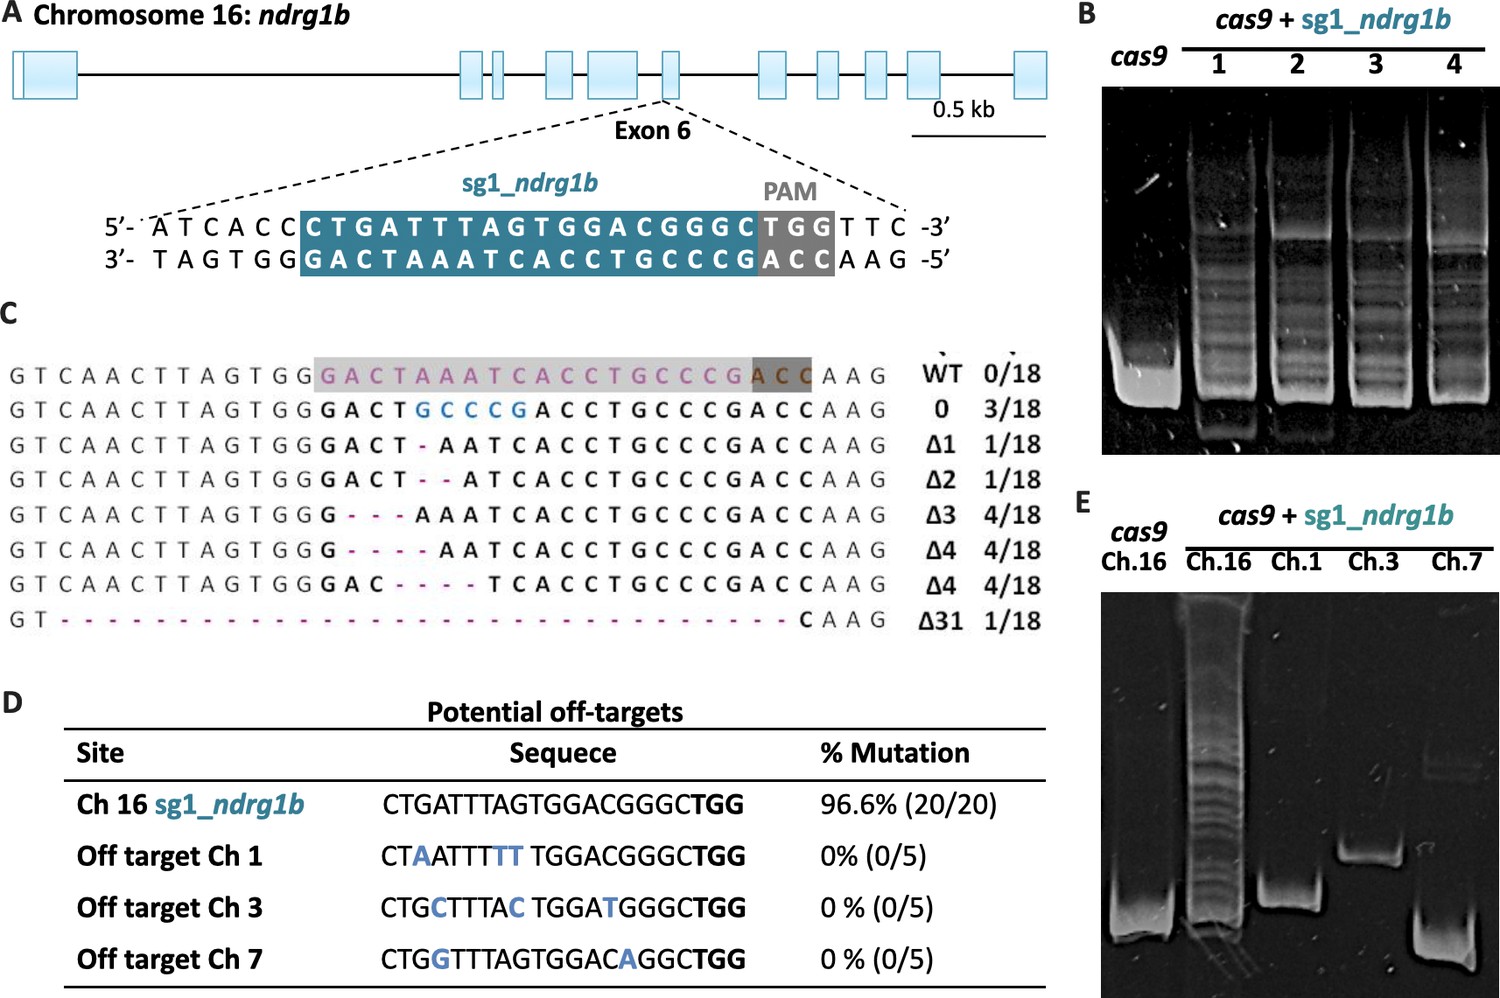
CRISPR/Cas9: sg1_ndrg1b design, heteroduplex mobility assay (HMA), efficiency, and potential off-targets.
Schematic representation of the genomic structure of ndrg1b. Coding exon regions are shown as blue solid boxes, the targeting sequence of sg1_ndrg1b is indicated by the cyan box, and NGG protospacer adjacent motif (PAM) sequence by the gray box (A). Images of heteroduplex mobility assay (HMA) for cas9-injected embryo (wild-type, single band) and cas9 + sg1_ndrg1b-injected embryos (1–4, multiple bands) (B). Subcloned sequences observed in the cas9 and cas9+sg1_ndrg1b embryos at F1, n = 18 sequenced individuals (C). The targeting sequence of the sg1_ndrg1b is indicated by the cyan box and adjacent to PAM sequence by the dark gray box. Blue letters indicate the identified insertion, and purple dashes indicate the different deletions. The size of indels is shown to the right of each mutated sequence. Numbers on the right edge indicate the numbers of mutated clones identified from all analyzed clones from each embryo. Table indicates the target and potential off-target loci identified with respective chromosome (Ch), sequence, percentage of biallelic mutation detected (D), with the number of embryos with biallelic mutations/total eggs injected shown in parentheses. Sequences of the off-target primers used for HMA are listed in Supplementary file 1A. Image of heteroduplex mobility assay (HMA) for detecting off-target alterations (E). Potential off-target loci for sg1_ndrg1b were analyzed using genomic DNA extracted from five embryos co-injected with 100 ng/ml of cas9 and 25 ng/ml of sg1_ndrg1b.
Figure 2—figure supplement 2

Corroboration of the specificity of CRISPR/Cas9 methodology to mutate ndrg1b with a second RNA guide (sg2_ndrg1b).
Schematic representation of the genomic structure of ndrg1b. Coding exon regions are shown as blue solid boxes. The targeting sequence of sg2_ndrg1b is indicated by the orange box and NGG protospacer adjacent motif (PAM) sequence by the gray box (A). Images of heteroduplex mobility assay for cas9-injected embryo (wild-type, single band) and cas9+sg2_ndrg1b-injected embryos (1–4, multiple bands) (B). Fluorescent sagittal images of gonads from XX or XY embryos injected with cas9 (C) or cas9 + sg2_ndrg1b (D) at stage 39. Germ cells were immunostained using an anti-OLVAS antibody (green), nuclei were stained with DAPI (blue), and proliferating cells with anti-PCNA antibody (red). Scale bars represent 50 µm. The total numbers of germ cells in cas9 and sg2_ndrg1b female or male embryos (E). n = 3 per group. p-Value is indicated when the number of germ cells between groups differs significantly (p<0.05). Tukey's multiple comparisons test (E).
Figure 2—figure supplement 3
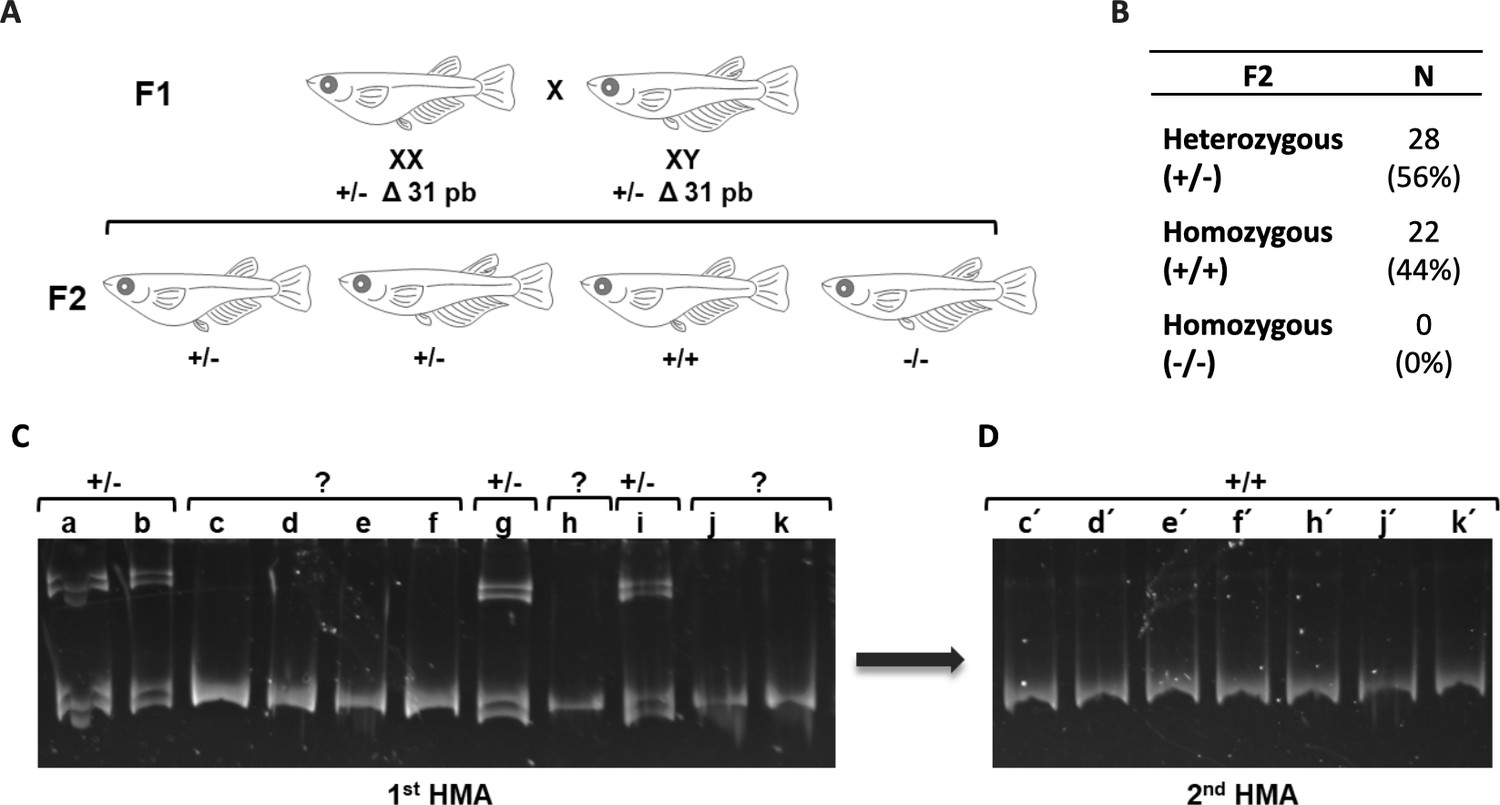
Identification of ndrg1b KO fish in an F2 trial.
Schematic representation of the procedure to obtain an F2 family obtained by mating F1 fish harboring the Δ31 mutation with each other (A). Table indicates the obtained proportion of heterozygous and homozygous of F2 individuals analyzed by heteroduplex mobility assay. (B). Images of heteroduplex mobility assay (HMA) for the F2 family. Fish are distinguished by HMA using genomic DNA extracted from fin clip of each F2 fish (1st HMA) where heterozygous mutants (+/-: a, b, g, and i) were identified because they showed multiple banding patterns (C). To clearly discriminate homozygous mutants from wild-type fish (individuals that show single band in 1st HMA: c, d, e, f, h, j, and k), each PCR product from the 1st HMA was mixed with a wild-type template, then reannealed to perform the 2nd HMA. The PCR products show homozygous wild-type (c′, d′, e′, f′, h′, j′, and k′), but no homozygous mutant (expected multiple banding pattern similar to heterozygotes) (D).
Figure 2—figure supplement 4
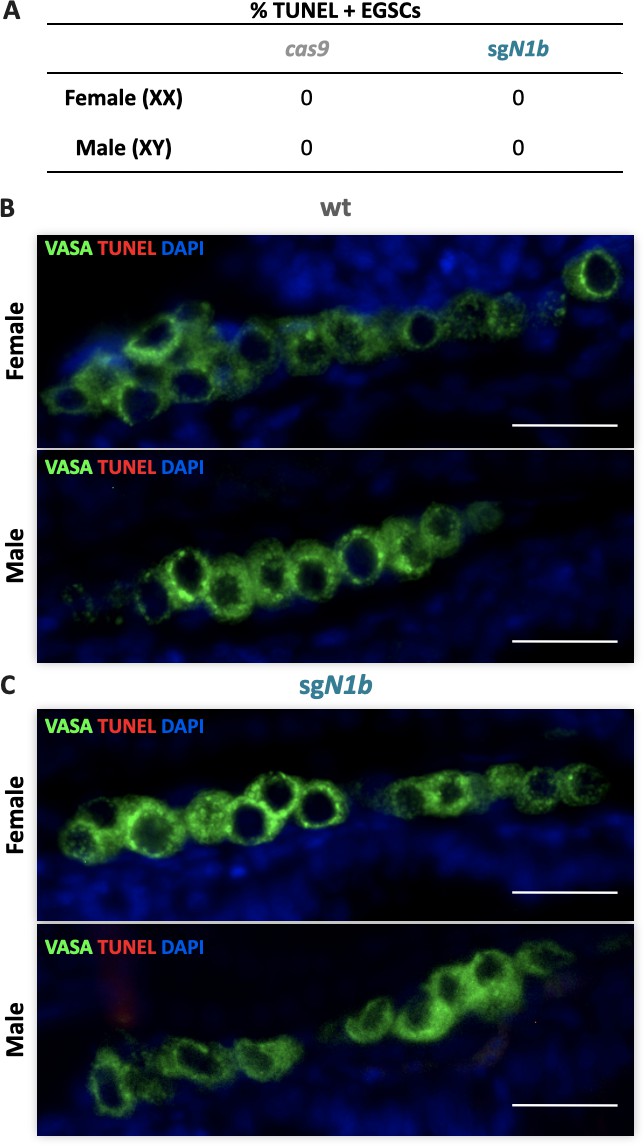
Apoptosis of embryonic germline stem cells (EGSCs) at stage 39.
Percentage of TUNEL-positive EGSCs at stage 39 was determined using 10 sagittal sections per individual (n = 4) (A). Fluorescent images of gonads from female or male embryos injected with cas9 (B) or sgN1b (cas9+sg1_ndrg1b) (C) at stage 39. Germ cells were immunostained using an anti-OLVAS antibody (green), nuclei were stained with DAPI (blue), and TUNEL-positive cells (red). Scale bars represent 20 µm.
Figure 3
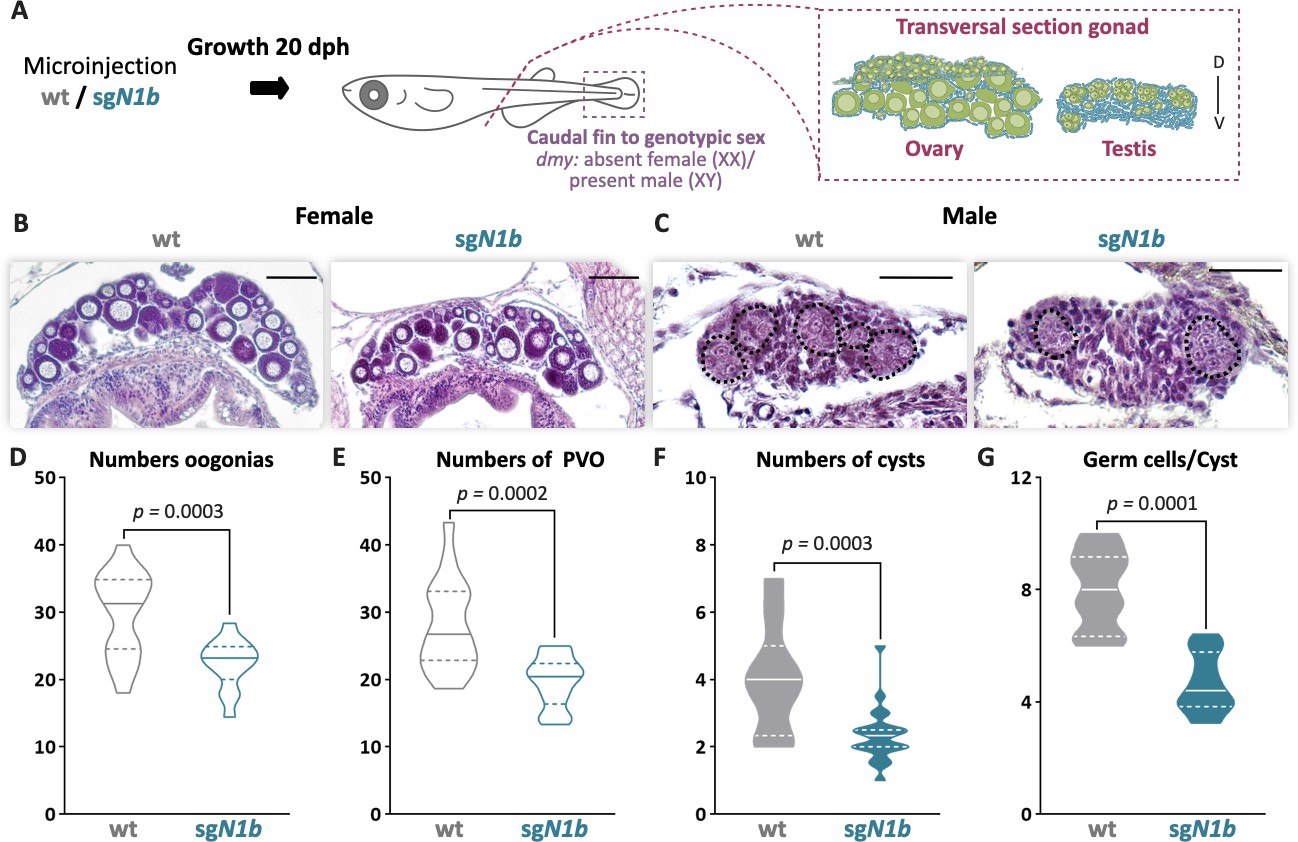
The mutation of ndrg1b affects gonadal development at 20 days post hatching (dph).
Schematic representation of the experimental procedure adopted to analyze the effect of ndrg1b mutation on gonadal histology at 20 dph (D: dorsal, V: ventral) (A). Histological transverse sections of gonads. Wild-type (wt) = injected with cas9 or sgN1b=injected with cas9+sg1_ndrg1b from individuals for XX (B) and XY (C). In the testis, each cyst of germ cells (spermatogonia-like cells) is encircled by a black dotted line. Scale bars in B and C represent 50 µm. Total number of oogonia (D), number of pre-vitellogenic oocytes (PVO) (E), number of spermatogonial cysts (F), and number of spermatogonia per cyst (G) in wt female or male embryos (represented by gray empty bars or full bars, respectively) and sgN1b female or male embryos (represented by cyan empty bars or full bars, respectively). n = 16 per female groups and n = 20 per male groups. p-Values are indicated when the number of germ cells between groups differs significantly (p<0.05). NS: not statistically significant. Unpaired Student’s t-test.
Figure 4 with 1 supplement
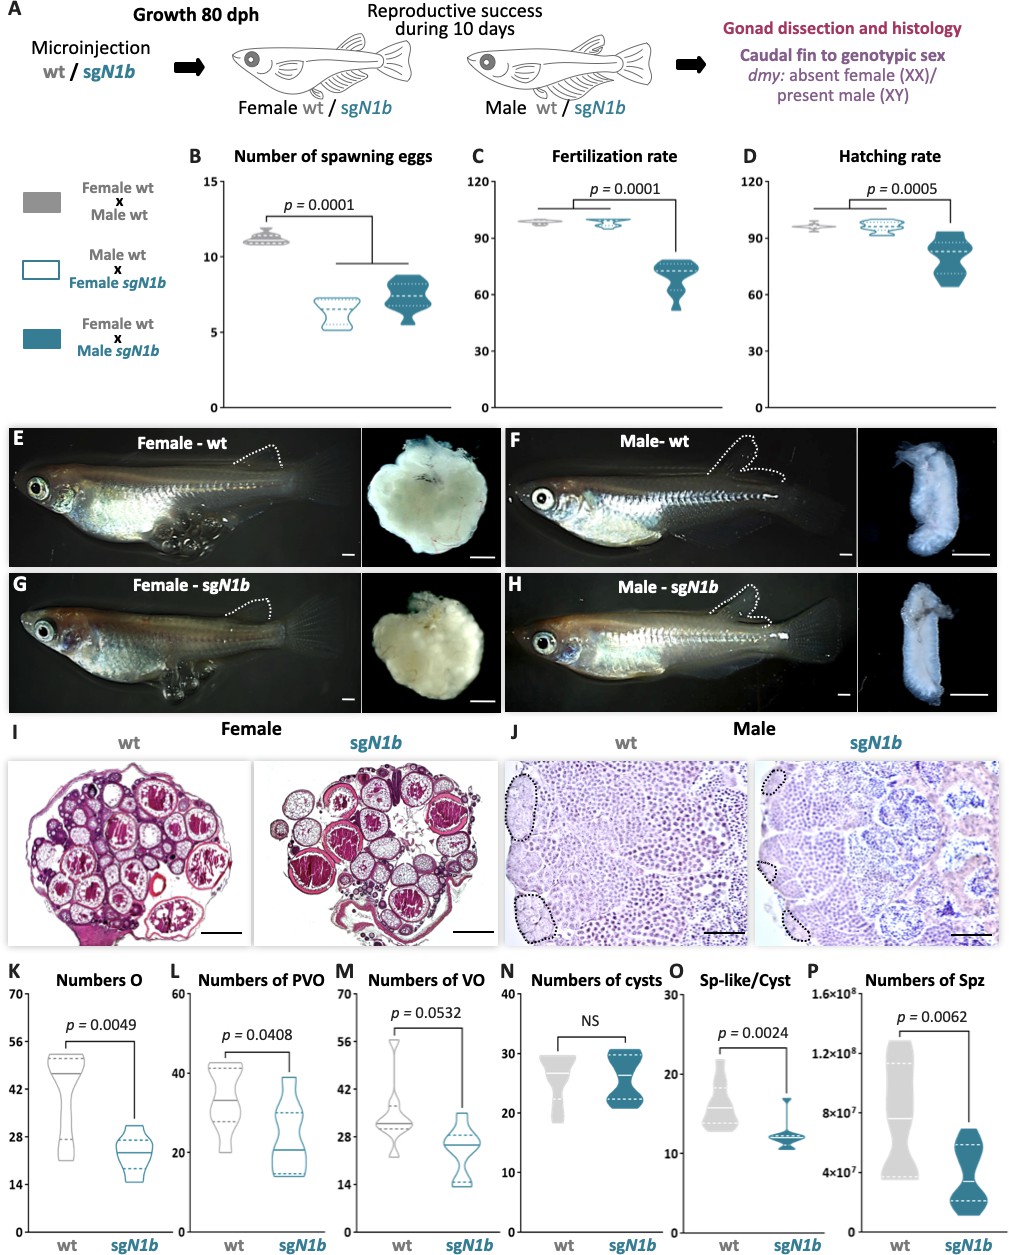
Mutation of ndrg1b alters the gametogenesis and reproduction success of both sexes in adults.
Schematic representation of the experimental procedure adopted to analyze the effect of ndrg1b loss of function in the reproductive success at 80 days post hatching (dph) (A). Reproductive success was evaluated by crossing the wild-type (wt) males with sgN1b females (cyan full), wt females with sgN1b males (cyan empty), and as a control, wt females with wt males (gray). For all crossings, we quantified the total number of eggs spawned (B), percentage of fertilization (C), and percentage of hatching (D) of the total eggs spawned. The biallelic mutants of ndrg1b did not exhibit morphological sexual differences: adult females with their ovaries, wt (E) and sgN1b (G), and adult males with their testis, wt (F) and sgN1b (H). The secondary sexual characteristics are indicated by the separation of hindmost rays from other rays in the dorsal fin. Scale bars are 1 mm. Histological transverse sections of wt and sgN1b gonads from XX (I) or male (J) individuals. In the testis, each cyst of germ cells (spermatogonia-like cells) is encircled by a black dotted line. Scale bars represent 500 µm (I) and 50 µm (J). Number of oogonia (O) (K), number of pre-vitellogenic oocytes (PVO) (L), number of vitellogenic oocytes (VO) (M), number of spermatogonial cysts (N), number of spermatogonia per cyst (O), and number of spermatozoa (P) from wt female or male individuals (represented by gray empty bars or full bars, respectively) and sgN1b female or male individuals (represented by cyan empty bars or full bars, respectively). n = 10 per group. p-Values are indicated when groups differ significantly (p<0.05). NS: not statistically significant. Tukey´s multiple comparisons test (B–D). Unpaired Student’s t-test (K–P).
Figure 4—figure supplement 1
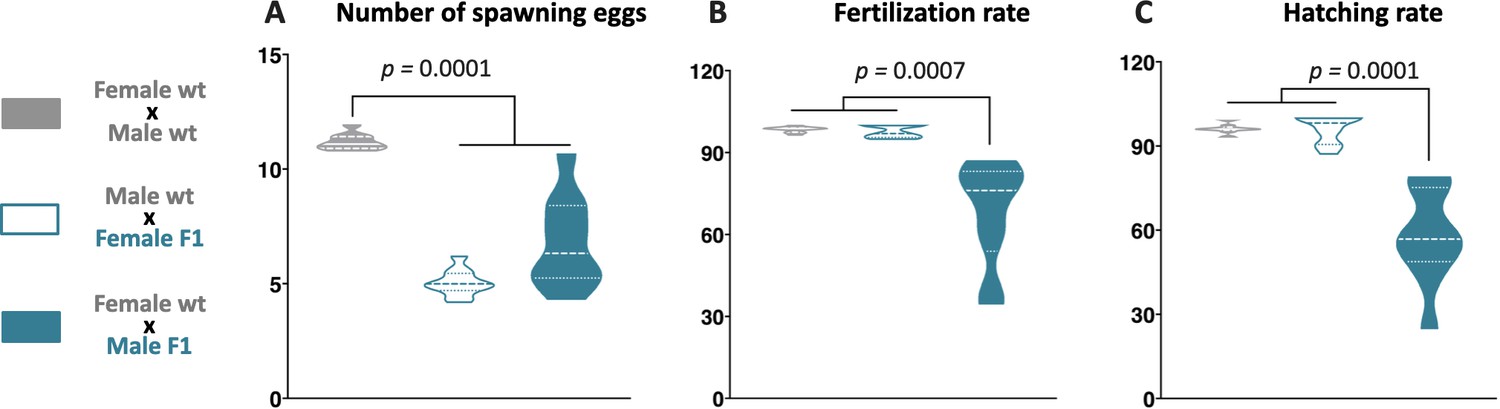
F1 reproductive success was evaluated by crossing the wild-type (wt) males with F1 females (cyan full), wt females with F1 males (cyan empty), and as a control, wt females with wt males (gray).
For all F1 crossings, we quantified the total number of eggs spawned (A), percentage of fertilization (B), and percentage of hatching (C) of the total eggs spawned. p-Value is indicated when between groups differ significantly (p<0.05). Tukey's multiple comparisons test.
Figure 5 with 2 supplements
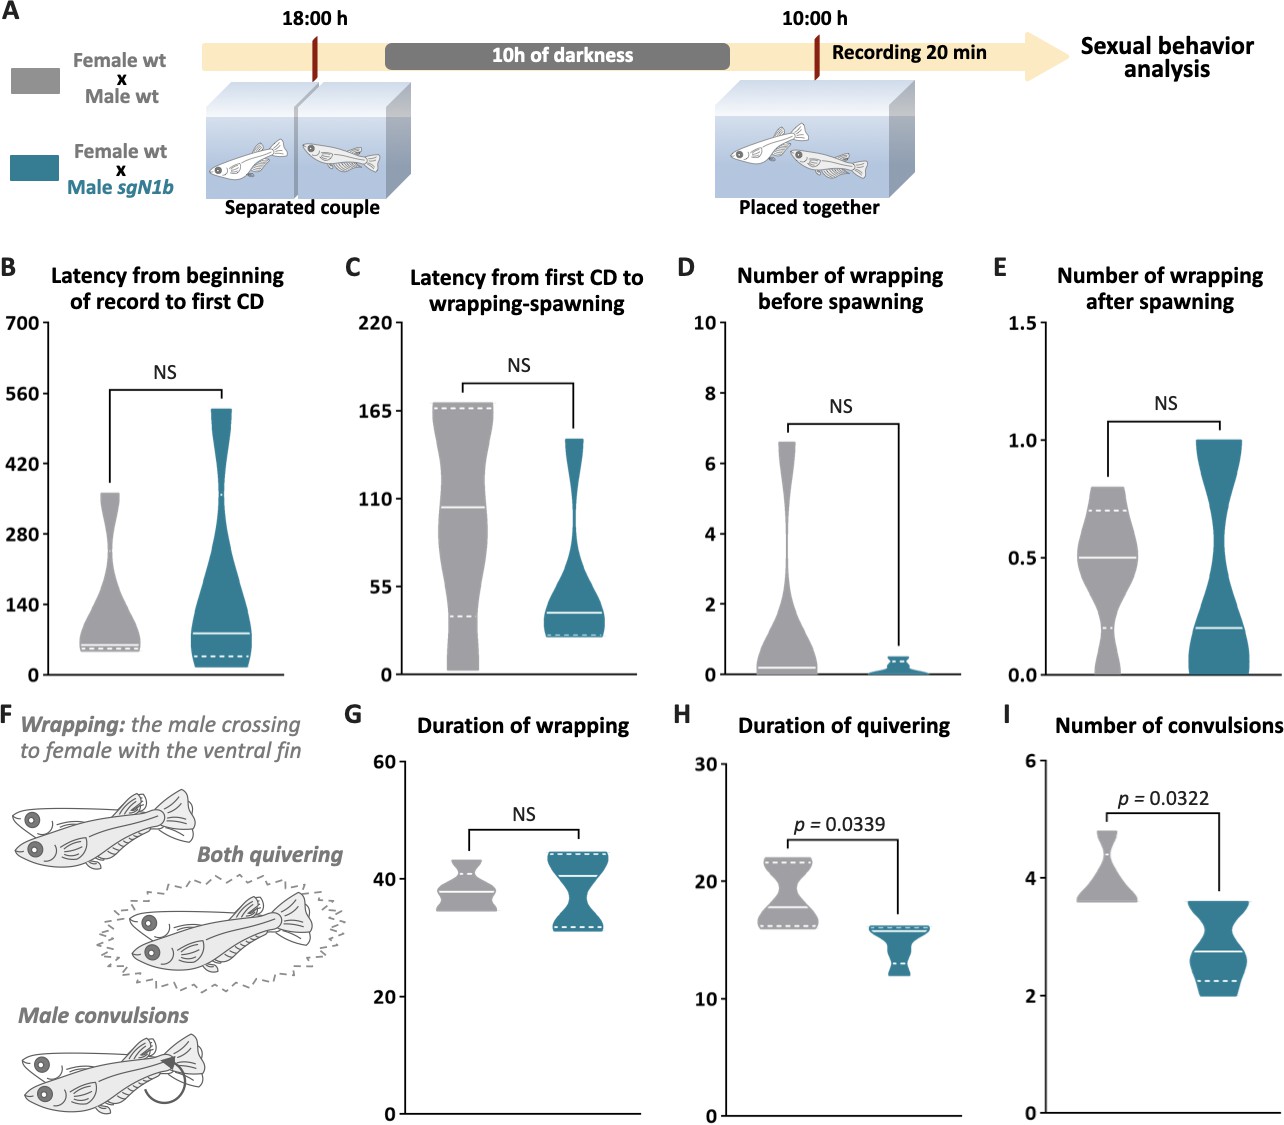
Reduction of cystic proliferation in ndrg1b mutants decreases male sexual behavior, with a decrease of mating vigor.
Schematic representation of the experimental procedure adopted to analyze reproductive behavior for 5 days; five couples per group were analyzed. (A) Couples of wild-type (wt) individuals (gray) or sgN1b males with wt females (cyan) were separated in the evening (6–7 PM) the day before the assay using a transparent plastic tank with small holes for water exchange. The following morning, each mating pair was placed together in a single tank and sexual behavior was recorded for 20 min. Each video was analyzed to determinate the latency from beginning of recording to the first courtship display (B), latency from first courtship display to the wrapping that resulted in spawning (C), number of wrappings of 2 s of duration before (D) and after (E) spawning, and specific wrapping actions (F), such as duration of wrapping (G), duration of quivering (H), and number of convulsions (I). Representative videos of wrapping actions in couples of wt female and male (https://www.youtube.com/watch?v=KrI8t90_tMA&feature=youtu.be) and male sgN1b with female wt (https://www.youtube.com/watch?v=MCjhYG7lfwM&feature=youtu.be). n = 5 per group. p-Values are indicated when the number of germ cells between groups differs significantly (p<0.05). NS: not statistically significant. Unpaired Student’s t-test.
Figure 5—figure supplement 1
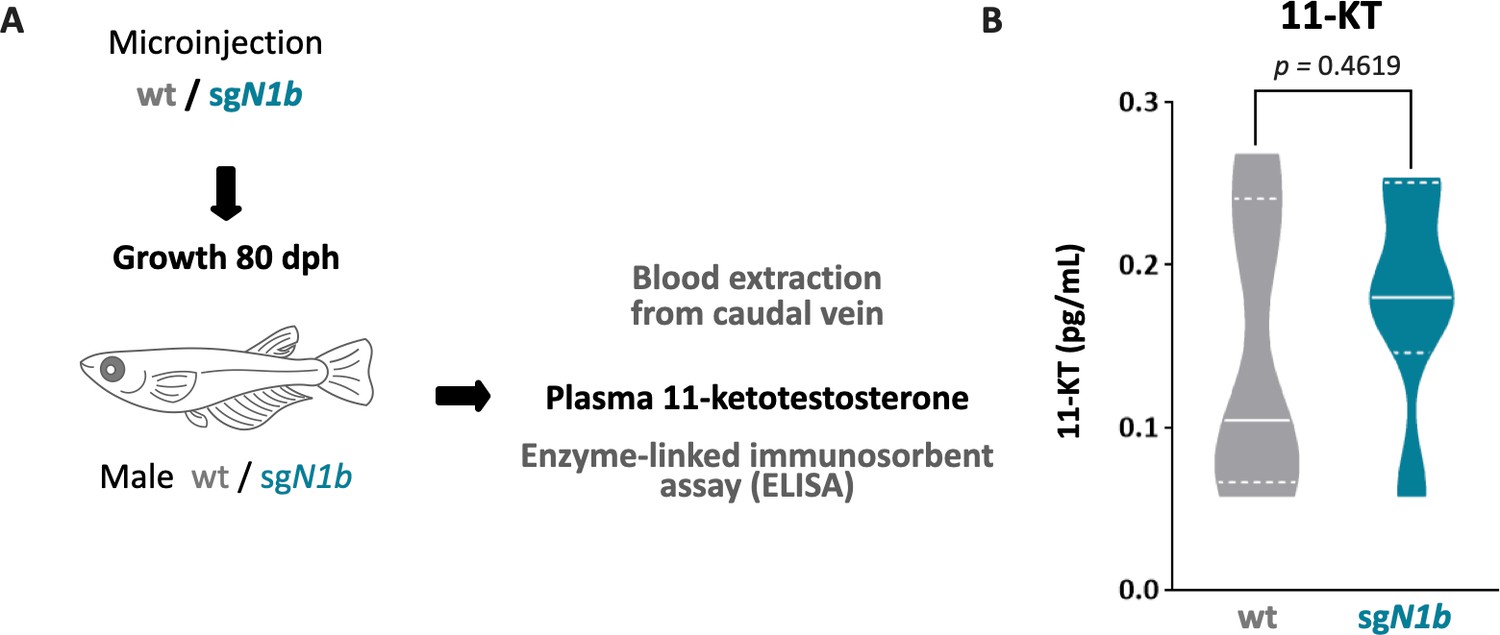
ndrg1b mutation did not alter the 11-ketotestosterone (11-KT) levels in medaka adults.
Quantification of whole blood 11-KT levels in male adults (A). Wild-type male (represented by gray full bars), and sgN1b male (represented by cyan full bars) (B). n = 6 per group. p-Values are indicated. Unpaired Student’s t-test.
Figure 5—figure supplement 2
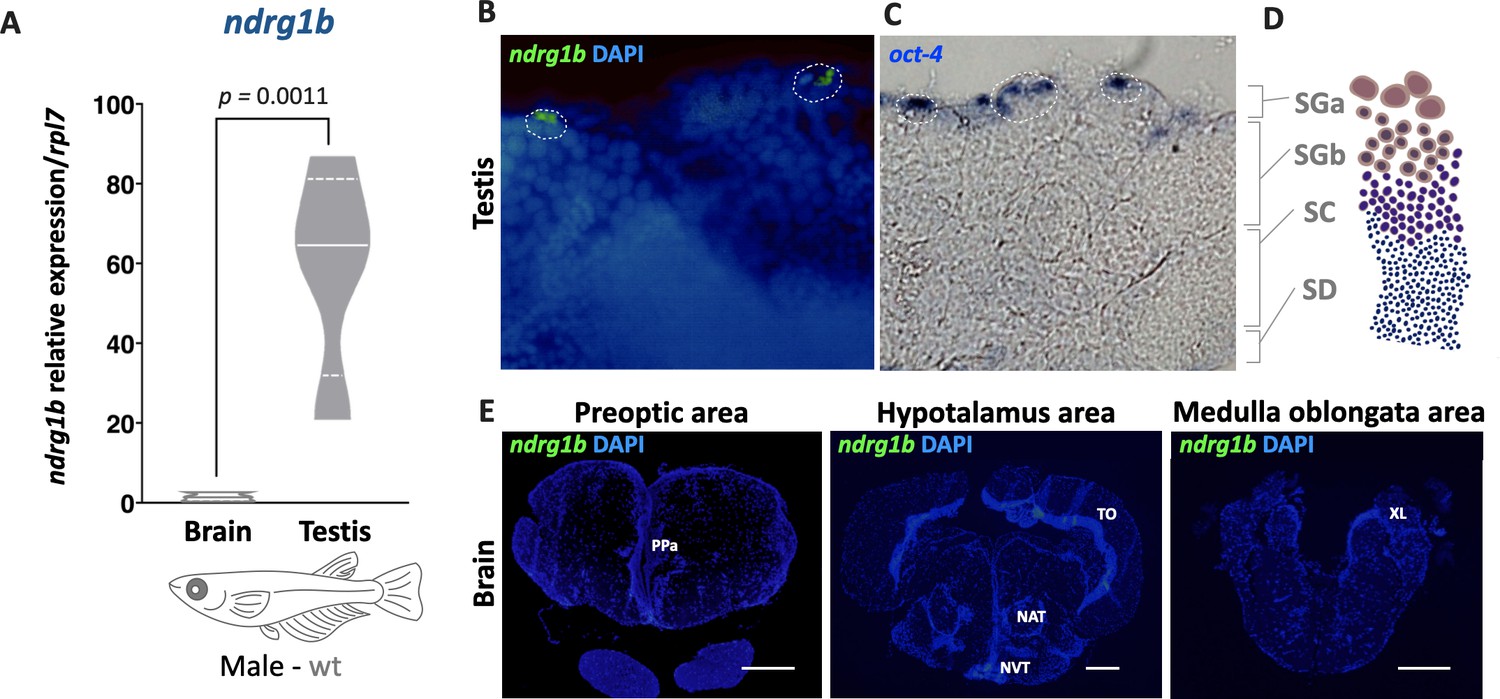
ndrg1b is expressed only in presumptive A-type spermatogonia (SG) from the testis.
Transcript abundance levels of ndrg1b in male adult brain and testis (A). Quantification was performed using the 2-ΔΔCt method, and ndrg1b values were normalized to rpl7. Brain and testis are represented by empty bars or full bars, respectively. n = 5 per organ. p-Value is indicated when transcript abundance between organs differs significantly (p<0.05). Relative gene expressions compared according to Pfaffl, 2001. Transverse sections of male adult testis (B) and brain (E) to detect ndrg1b transcripts using in situ hybridization with ndrg1b fluorescein isothiocyanate-labeled RNA probe. SG region is surrounded by a white dotted line (B) and identified by oct4 presence in the distal portion of the lobule of the testis (C). Scale bar represents 50 µm (B, C) and 100 µm (E). Anterior tuberal nucleus (NAT), nucleus ventralis tuberis (NVT), anterior parvocellular preoptic nucleus (PPa), tectum opticus (TO), and lobus vagi (XL) (from Ishikawa et al., 1999). A schematic transverse section of the gonad is shown to indicate different germ cell lines (D), as A-type spermatogonia (SGa), B-type spermatogonia (SGb), spermatocytes (SC), and spermatotides (SD).
Author response image 1

Additional files
-
Supplementary file 1
(A) Primers sequences, ENSEMBL accession numbers and respective references of each gene were added. (B) Sex ratio of both sexes embryos injected with cas9 (wildtype) and the sgNb1 (cas9+sg1_ndrg1b).
- https://cdn.elifesciences.org/articles/62757/elife-62757-supp1-v2.docx
-
Transparent reporting form
- https://cdn.elifesciences.org/articles/62757/elife-62757-transrepform-v2.docx
Download links
A two-part list of links to download the article, or parts of the article, in various formats.
Downloads (link to download the article as PDF)
Open citations (links to open the citations from this article in various online reference manager services)
Cite this article (links to download the citations from this article in formats compatible with various reference manager tools)
Cystic proliferation of germline stem cells is necessary to reproductive success and normal mating behavior in medaka
eLife 10:e62757.
https://doi.org/10.7554/eLife.62757


