Investigation of Drosophila fruitless neurons that express Dpr/DIP cell adhesion molecules
- Department of Biomedical Sciences and Program of Neuroscience, Florida State University, College of Medicine, United States
- Department of Molecular and Human Genetics, Baylor College of Medicine, United States
- Division of Biology and Biological Engineering, California Institute of Technology, United States
Figures
Figure 1
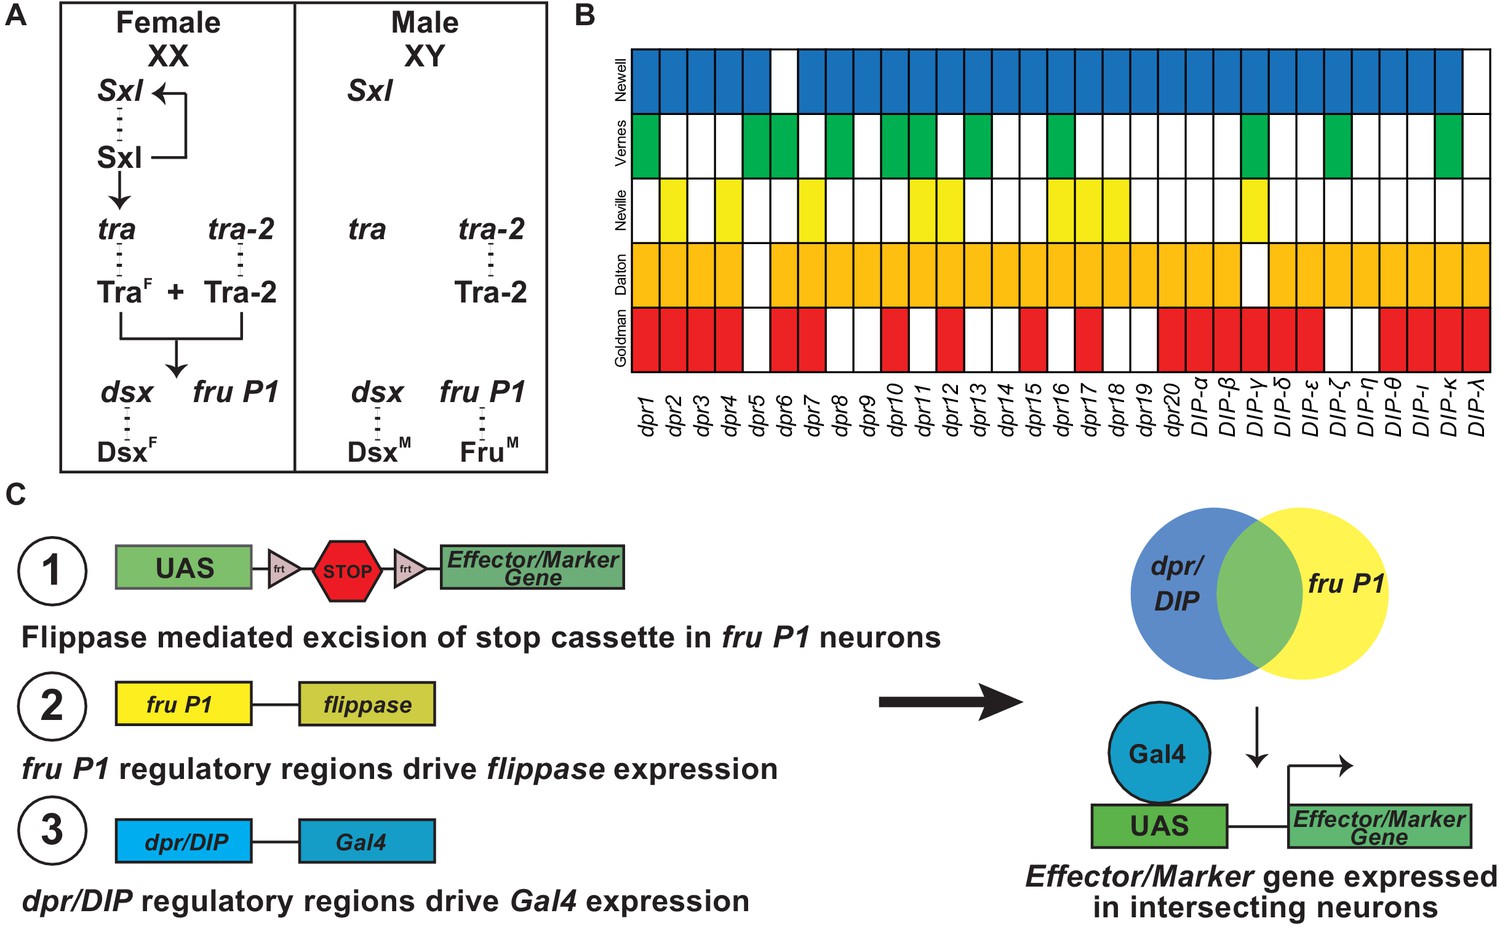
Overview of sex hierarchy and experimental design.
(A) The Drosophila somatic sex determination hierarchy is an alternative pre-mRNA splicing cascade (reviewed in Andrew et al., 2019). The presence of two X chromosomes in females results in splicing of Sxl pre-mRNA, such that functional Sxl is produced. Sxl regulates Sxl and tra pre-mRNA splicing, resulting in continued production of functional Sxl and Tra in females. Tra and Tra-2 regulate the pre-mRNA splicing of dsx and fru P1 in females, whereas in males dsx and fru P1 are spliced by the default pre-mRNA splicing pathway. The sex-specific splicing results in production of sex-specific Dsx and Fru transcription factors (Burtis and Baker, 1989; Ito et al., 1996; Ryner et al., 1996). dsx regulates sex differences that lead to both dimorphic behavior and gross anatomical morphological differences, whereas fru P1 regulates sex differences that lead to dimorphic behaviors. (B) Previous genome-wide studies found that dpr/DIPs are regulated downstream of fru P1, FruM, and/or are expressed in fru P1 neurons (Goldman and Arbeitman, 2007; Dalton et al., 2013; Neville et al., 2014; Vernes, 2015; Newell et al., 2016). (C) A genetic intersectional strategy was used to express marker or effector genes in fru P1 ∩ dpr/DIP neurons. This strategy takes advantage of the two-component Gal4/UAS expression system, and Flippase-mediated removal of a stop cassette within an expression vector. Expression of the marker/effector gene requires both removal of the stop cassette via fru P1-flippase (flp) expression and expression of Gal4 via dpr/DIP regulation. Therefore, only neurons that express both fru P1 and one of the dpr/DIPs have expression of the effector or marker (shown on right).
-
Figure 1—source data 1
Data table of FruM binding sites in dpr and DIP genes for three FruM isoforms.
This is an excel table that contains the number of times a FruM binding site is found in either a dpr or DIP gene.
- https://cdn.elifesciences.org/articles/63101/elife-63101-fig1-data1-v2.docx
Figure 2 with 1 supplement
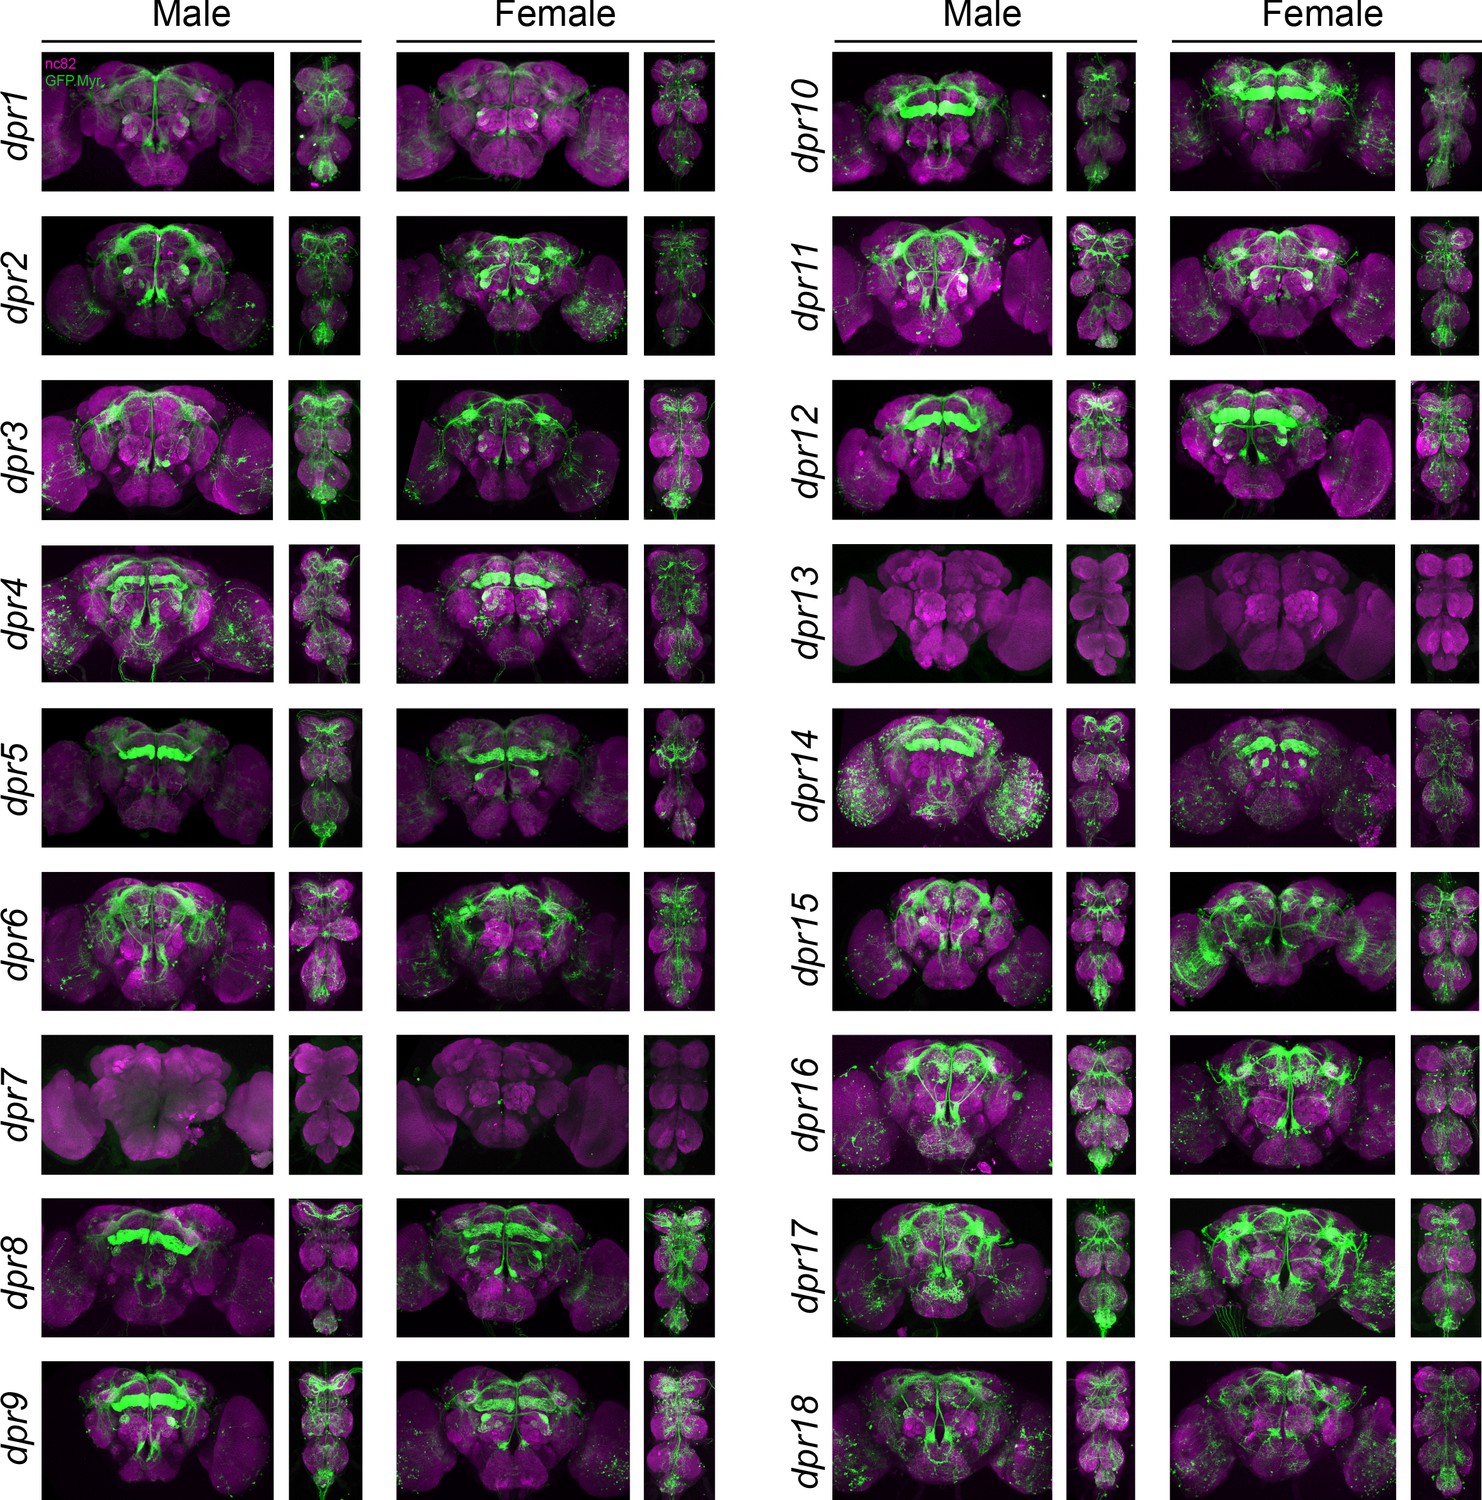
Visualization of fru P1 ∩ dpr neurons.
Maximum intensity projections of brain and ventral nerve cord tissues from 4- to 7-day-old male and female flies. The fru P1 ∩ dpr intersecting neurons are labeled with green (rabbit α-GFP Alexa Flour 488), and neuropil are labeled with magenta (mouse α-nc82, Alexa Flour 633). The genotype is dpr-Gal4/10xUAS > stop > GFP.Myr; fru P1FLP, except for dpr4, dpr14, dpr18, and dpr19. These Gal4 transgenic strains were generated using a CRISPR-mediated insertion of the T2A-Gal4 with the dominant 3xP3-GFP marker. For this strain, 10xUAS > stop > myr::smGdP-cMyc was used and fru P1 ∩ dpr intersecting neurons are labeled with red (rabbit α-Myc, Alexa Flour 568) and then false-colored to green. The neuropil are labeled with magenta (mouse α-nc82, Alexa Flour 633). These Gal4s did not show consistent fru P1 intersecting expression: dpr7, dpr13, and dpr19. The dpr7 and dpr13 Gal4s have expression with 10xUASmCD8gfp, confirming the Gal4s can drive expression outside of fru P1 neurons. dpr19 was tested with 10xUAS-RFP and did not show expression outside of fru P1 neurons.
Figure 2—figure supplement 1
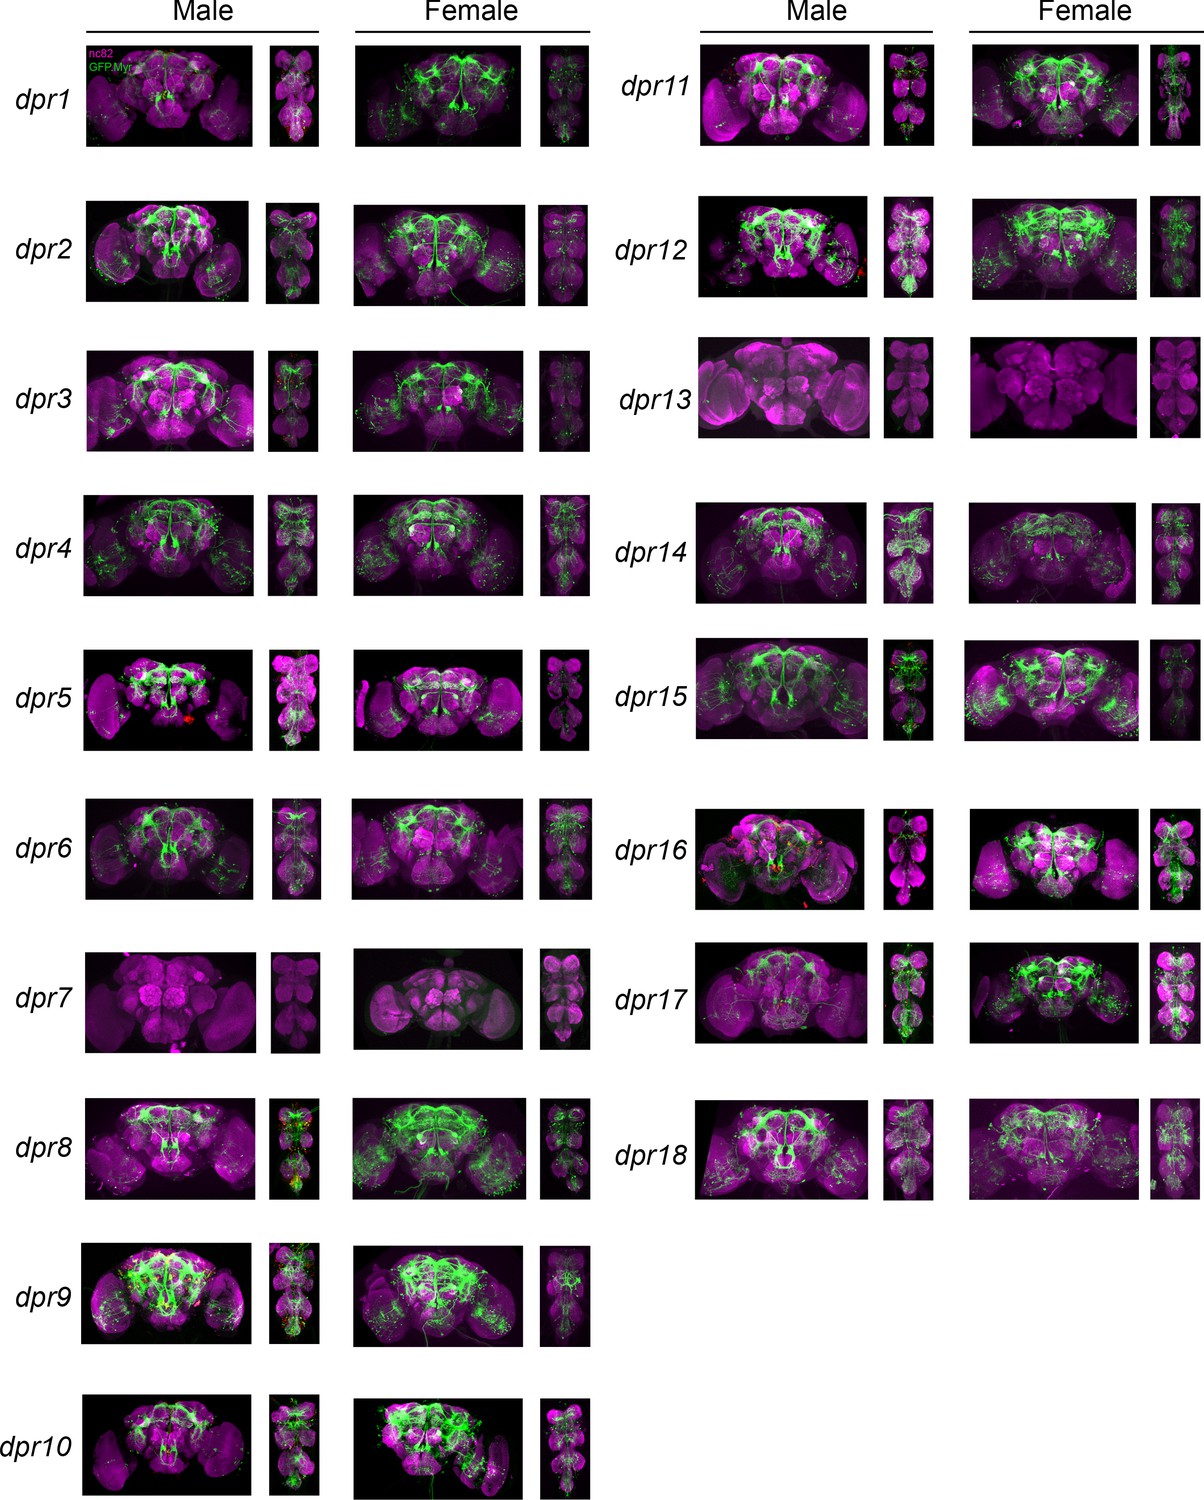
Visualization of fru P1 ∩ dpr neurons from 0-to 24-hour adults.
Maximum intensity projections of brain and ventral nerve cord tissues from 0- to 24-hr-old male and female flies. The fru P1 ∩ dpr intersecting neurons are labeled with green (rabbit α-GFP Alexa Flour 488), and neuropil are labeled with magenta (mouse α-nc82, Alexa Flour 633). The genotype is dpr-Gal4/10xUAS > stop > GFP.Myr; fru P1FLP, except for dpr4, dpr14, dpr18, and dpr19. These Gal4 transgenic strains were generated using a CRISPR-mediated insertion of the T2A-Gal4 with the dominant 3xP3-GFP marker. For these strains, 10xUAS > stop > myr::smGdP-cMyc was used and fru P1 ∩ dpr intersecting neurons are labeled with red (rabbit α-Myc, Alexa Flour 568) and then false-colored to green. The neuropil are labeled with magenta (mouse α-nc82, Alexa Flour 633).
Figure 3 with 1 supplement
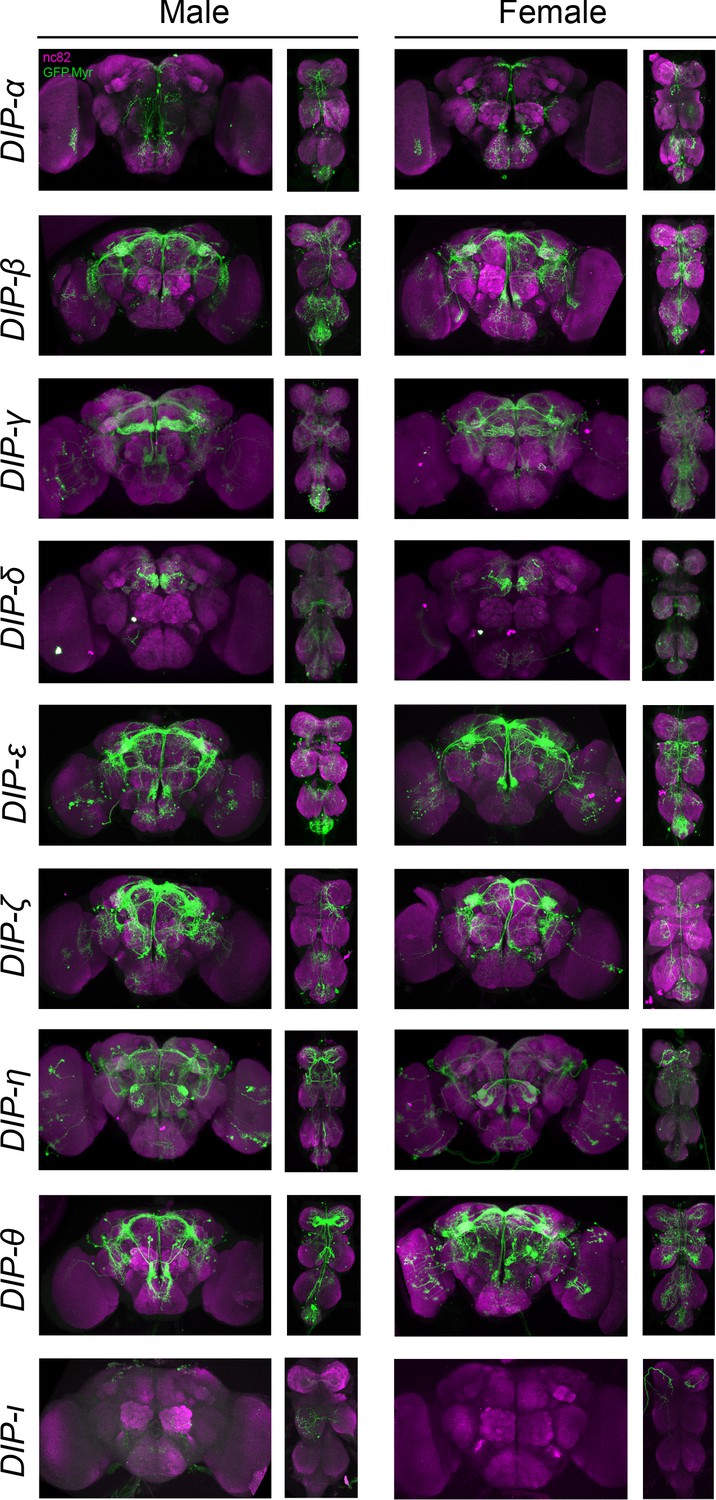
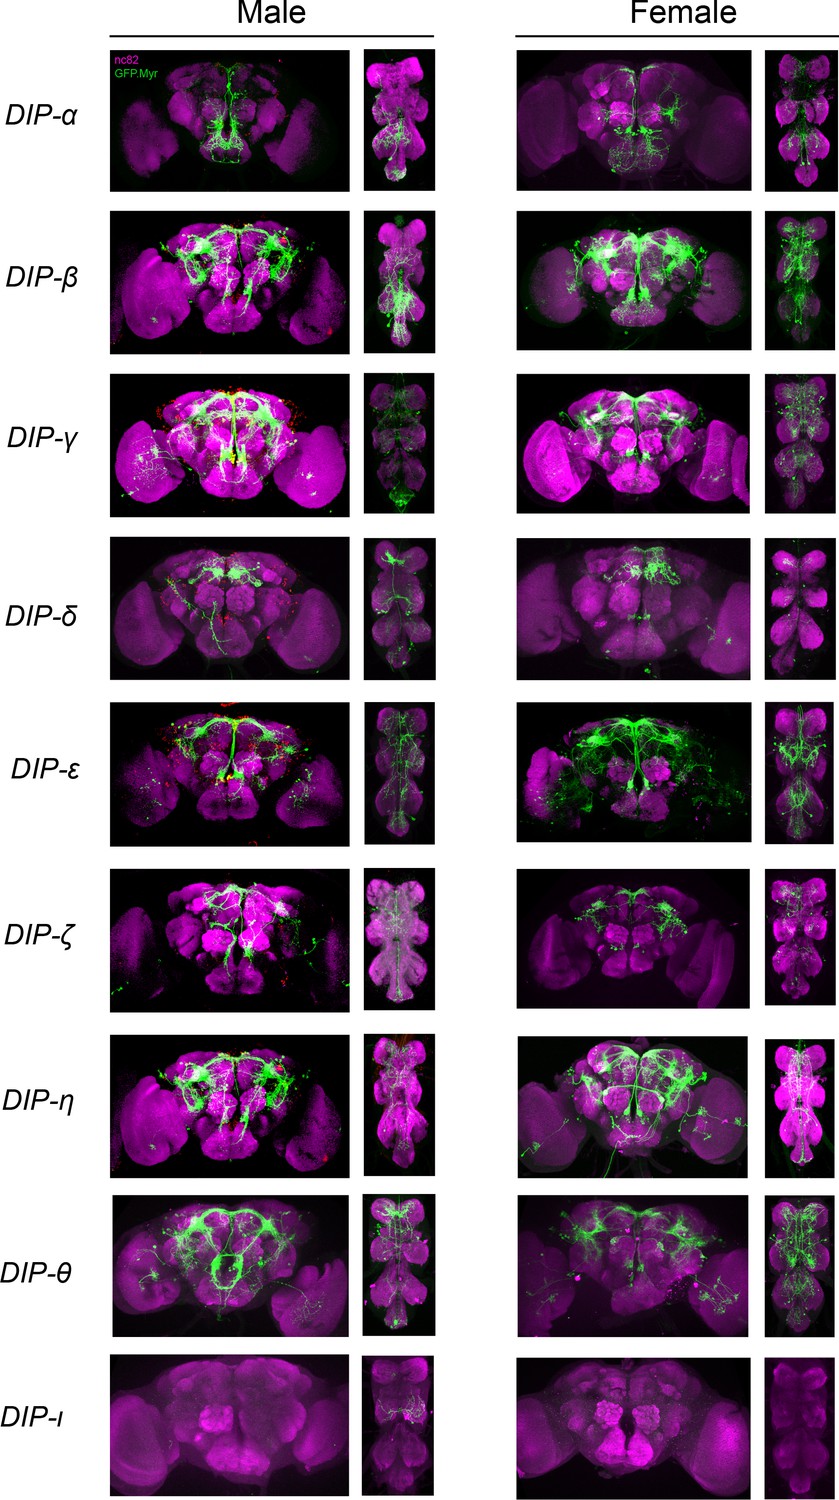
Visualization of fru P1 ∩ DIP neurons.
Maximum intensity projections of brain and ventral nerve cord tissues from 4- to 7-days old male and female flies. The fru P1 ∩ DIP intersecting neurons are labeled with green (rabbit α-GFP Alexa Flour 488), and neuropil are labeled with magenta (mouse α-nc82, Alexa Flour 633). The genotype is DIP-Gal4/10xUAS > stop > GFP.Myr; fru P1FLP, except for DIP-ι. This Gal4 transgenic strains was generated using a CRISPR-mediated insertion of the T2A-Gal4 with the dominant 3xP3-GFP marker. For this strain, 10xUAS > stop > myr::smGdP-cMyc was used and fru P1 ∩ DIP intersecting neurons are labeled with red (rabbit α-Myc, Alexa Flour 568) and then false-colored to green. The neuropil are labeled with magenta (mouse α-nc82, Alexa Flour 633). One Gal4 did not show consistent expression upon intersecting: DIP-iota. DIP-iota was tested with 10xUAS-RFP, and showed expression outside of fru P1 neurons.
Figure 3—figure supplement 1
Visualization of fru P1 ∩ DIP neurons from 0- to 24-hr-adults.
Maximum intensity projections of brain and ventral nerve cord tissues from 0- to 24-hr-old male and female flies. The fru P1 ∩ DIP intersecting neurons are labeled with green (rabbit α-GFP Alexa Flour 488), and neuropil are labeled with magenta (mouse α-nc82, Alexa Flour 633). The genotype is DIP-Gal4/10xUAS > stop > GFP.Myr; fru P1FLP, except for DIP-ι. This Gal4 transgenic strain was generated using a CRISPR-mediated insertion of the T2A-Gal4 with the dominant 3xP3-GFP marker. For this strain, 10xUAS > stop > myr::smGdP-cMyc was used and fru P1 ∩ DIP intersecting neurons are labeled with red (rabbit α-Myc, Alexa Flour 568) and then false-colored to green. The neuropil are labeled with magenta (mouse α-nc82, Alexa Flour 633).
Figure 4 with 1 supplement
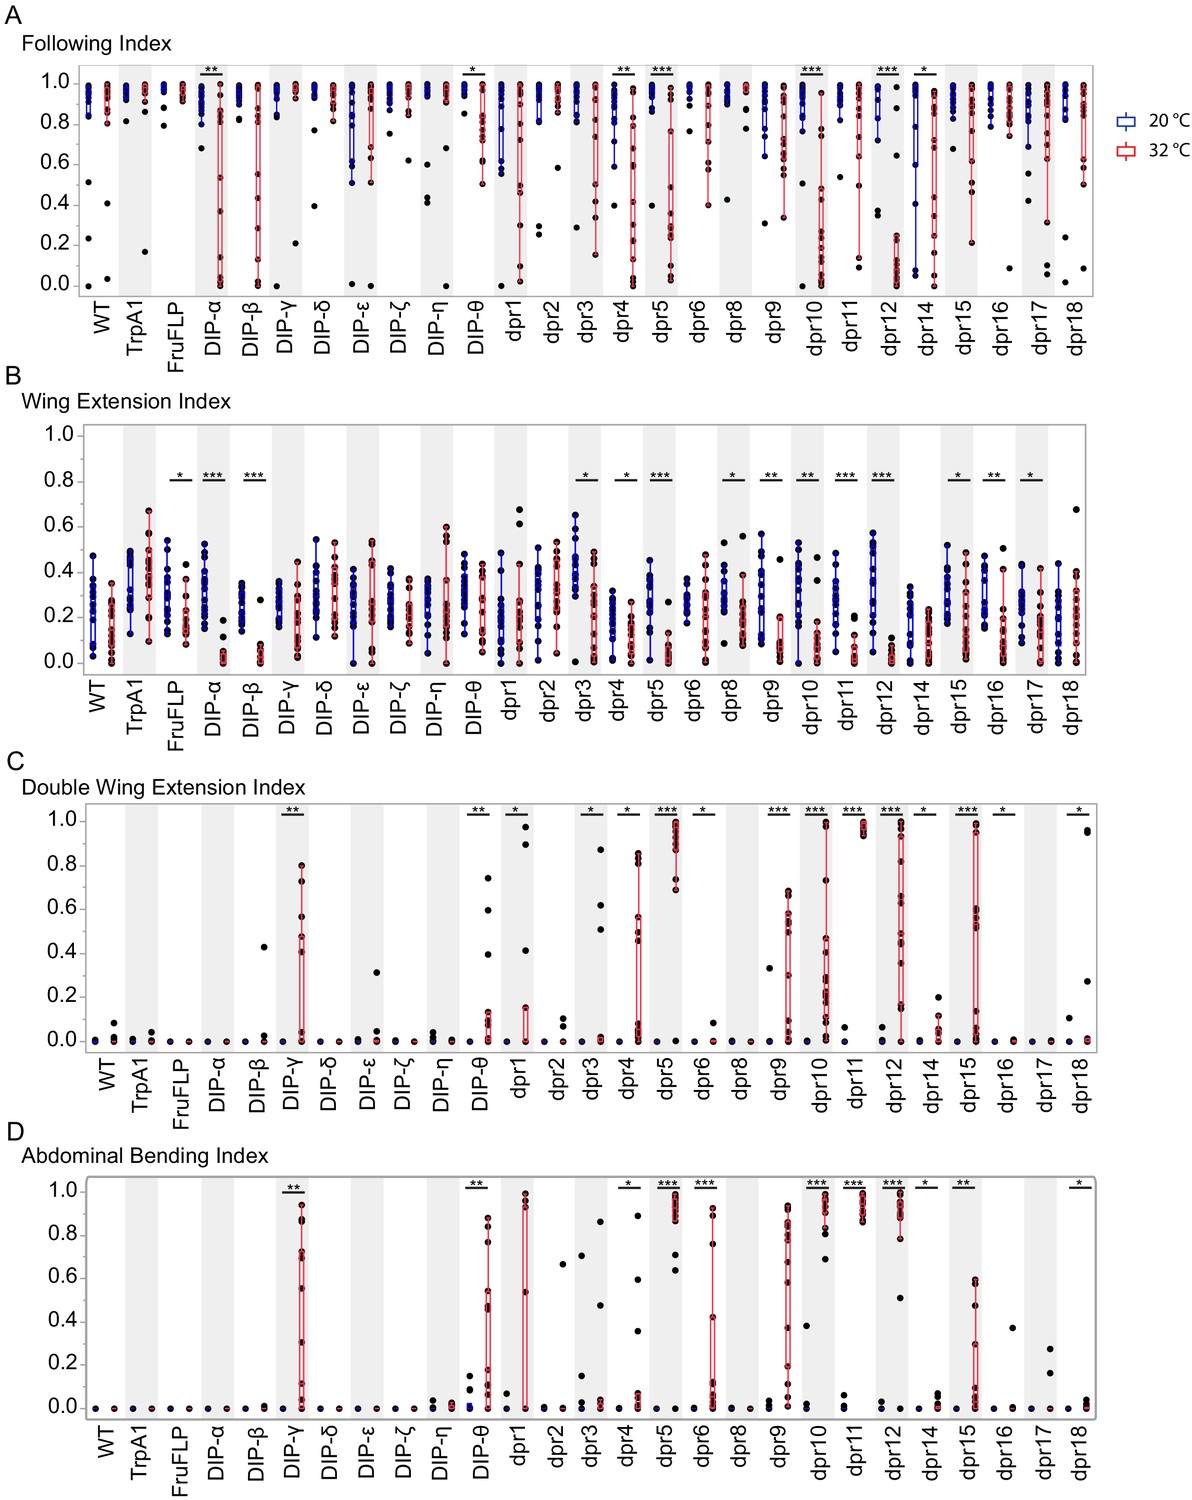
Activation of fru P1 ∩ dpr/DIP intersecting neurons results in atypical courtship behaviors.
Courtship behaviors of dpr/DIP-Gal4/ UAS > stop > TrpA1; fru P1FLP males were recorded at the control temperature (20°C, blue box plots) and the activating temperature for TrpA1 (32°C, red box plots). The control genotypes are the wild-type strain Canton S, and the UAS > stop > TrpA1 and fru P1FLP single transgenes, which were crossed to Canton S. Virgin Canton S (white) females were used as targets. (A) Following index is the fraction of time the male spent oriented toward or chasing the female around the chamber. (B) Wing extension index is the fraction of time the male spent unilaterally extending and vibrating his wing. (C) Double wing extension index is the fraction of time the male spent extending and vibrating both wings simultaneously. (D) Abdominal bending index is the fraction of time the male spent curling his abdomen under. A movie is provided to show a male with atypical abdominal bending (fru P1 ∩ dpr1 genotype; Figure 4—video 1). The lines on the quantile box plot correspond to the quantiles in the distribution output, with the center line as the median. The whiskers extend from the 1st and 3rd quartiles to the edges, which correspond to the minimum and maximum values, excluding outliers. The nonparametric Wilcoxon rank sum test was used to test for significant difference between control and activating temperature within each genotype. n = 15. *p<0.05, **p<0.005, ***p<0.0005. All lines were examined for expression of TrpA1 to confirm the system was working effectively (data not shown).
Figure 4—video 1
A movie showing a male that has atypical abdominal bending when fru P1 ∩ dpr1 neurons are activated by TrpA1.
Initially, the male shows wild type courtship phenotypes, but as the temperature increases and neuronal activation occurs, the male shows atypical abdominal bending, where he bends for a long amount of time, even after the female has moved away.
Figure 5
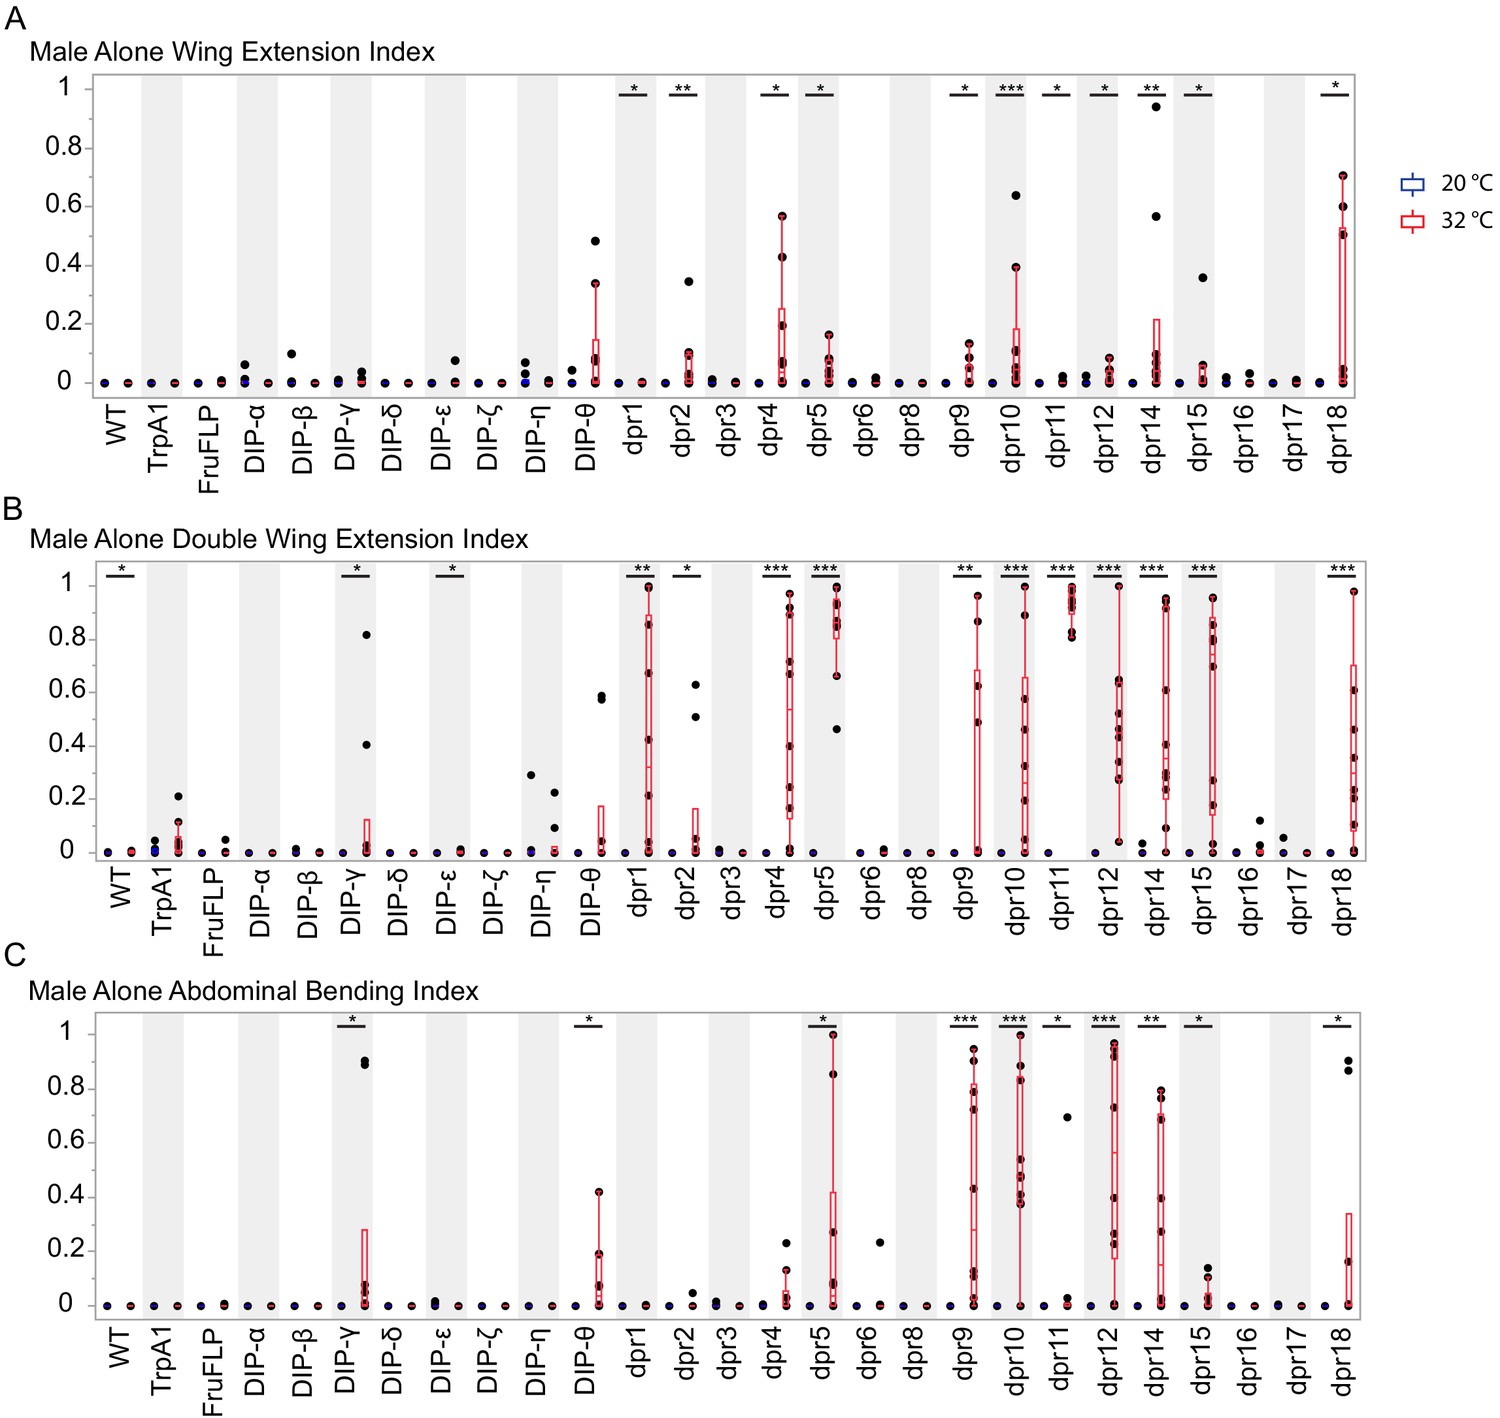
Activation of fru P1 ∩ dpr/DIP intersecting neurons is sufficient to induce courtship behaviors in solitary males.
Courtship behaviors of dpr/DIP-Gal4/ UAS > stop > TrpA1; fru P1FLP solitary males were recorded at the control temperature (20°C, blue box plots) and the activating temperature (32°C, red box plots). The control genotypes are the wild type strain Canton S, and the UAS > stop > TrpA1 and fru P1FLP single transgenes, which were crossed to Canton S. (A) Wing extension index, (B) Double wing extension index (C) Abdominal bending index, and quantile box plots are as described in Figure 3. The nonparametric Wilcoxon rank sum test was used to test for significant difference between control and activating temperature within each genotype. n = 10. *p<0.05, **p<0.005, ***p<0.0005.
Figure 6
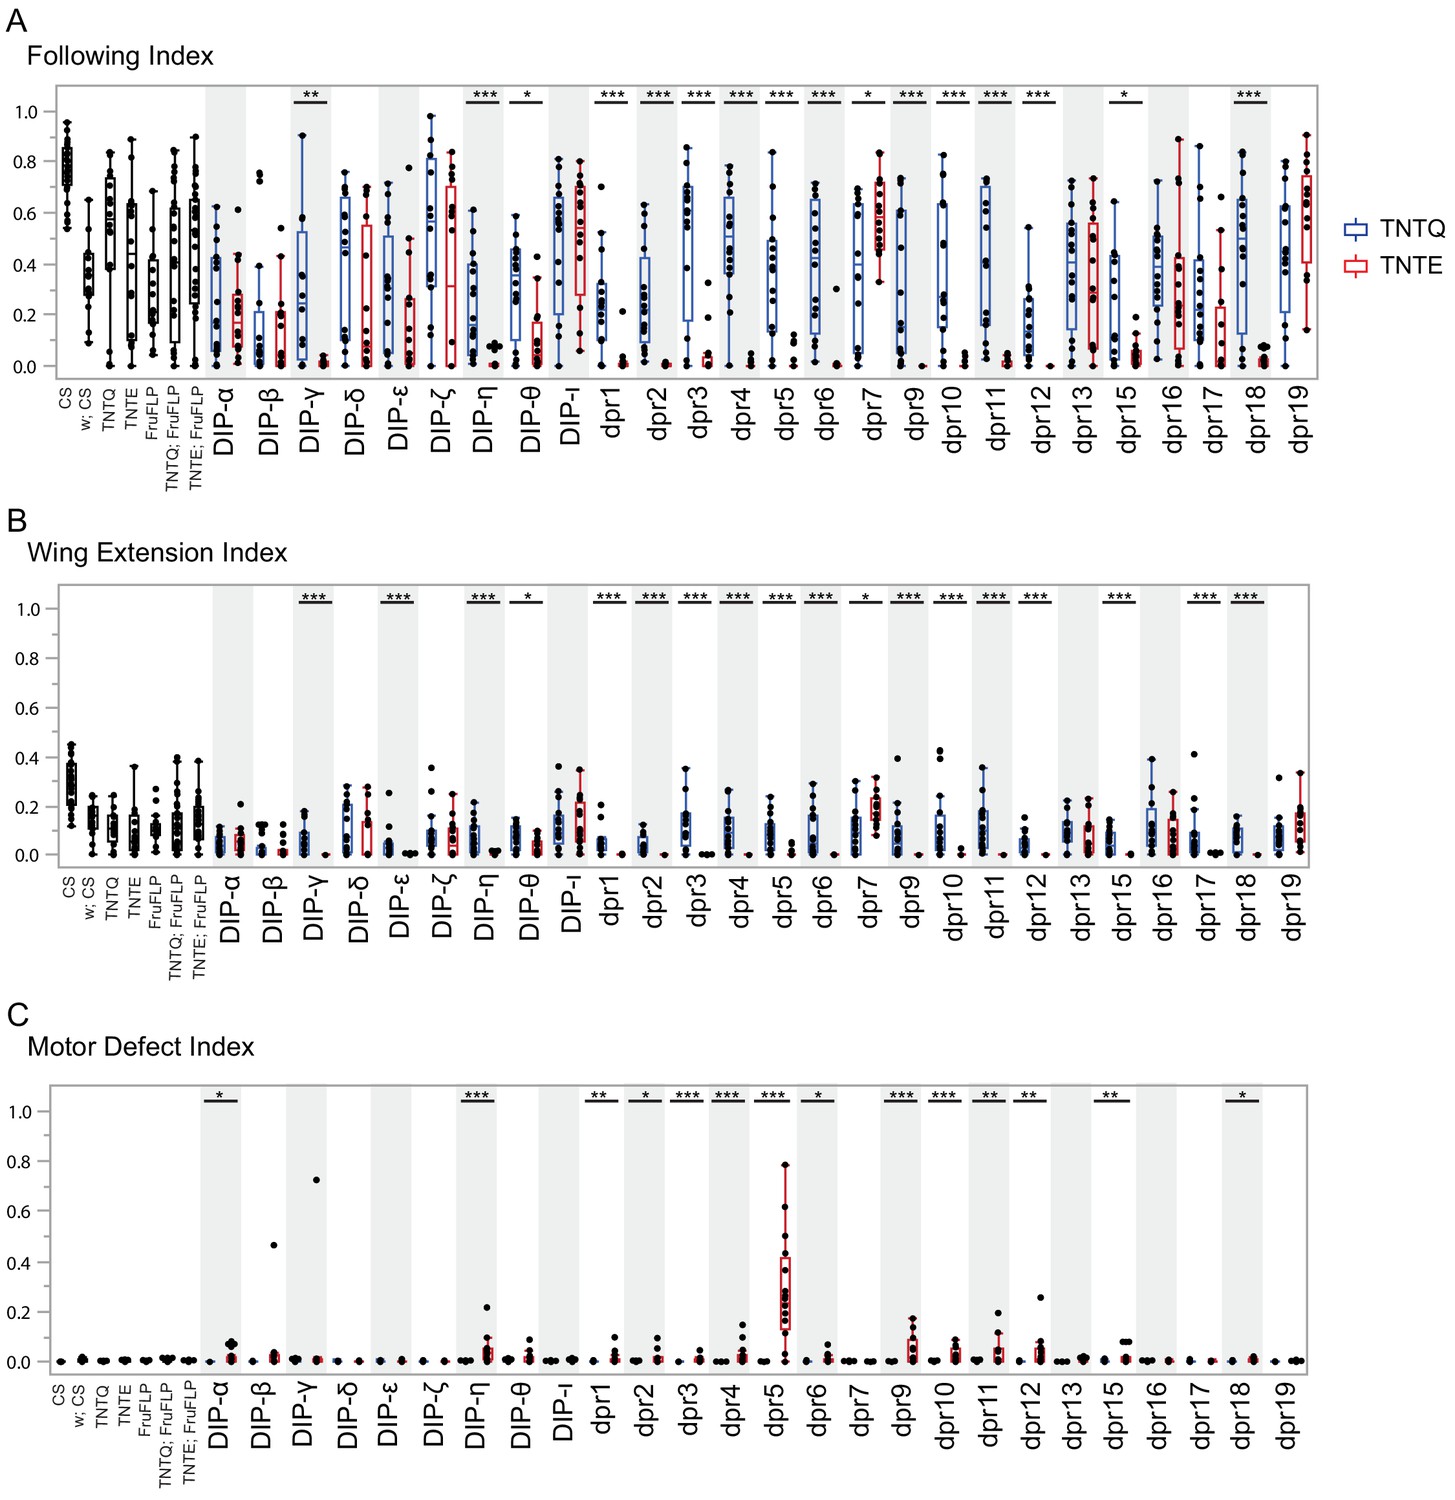
Silencing fru P1 ∩ dpr/DIP intersecting neurons results in atypical courtship and severe motor defects.
Courtship behaviors of dpr/DIP-Gal4/ UAS > stop > TNTQ; fru P1FLP (control condition, blue boxplots) and of dpr/DIP-Gal4/ UAS > stop > TNTE; fru P1FLP (experimental condition, red boxplots) males were quantified. Control genotypes (black boxplots) are the wild-type strain Canton S and Canton S (white), fru P1FLP, UAS > stop > TNTQ, and UAS > stop > TNTE single transgenes, as well as UAS > stop > TNTQ; fru P1FLP and UAS > stop > TNTE; fru P1FLP double transgenes. The single and double transgene controls were crossed to Canton S (white). The dpr- or DIP- Gal4 is listed on the x-axis and the fraction of time spent performing the behavior is on the y-axis. (A) Following index, (B) wing extension index, and the quantile box plots are as described in Figure 4. (C) Motor defect index is the fraction of time the fly spent on his back after falling. The nonparametric Wilcoxon rank sum test was performed to determine significant differences between experimental and control conditions with the same dpr/DIP-Gal4. n = 16 for all genotypes except for Canton S, and the double transgene controls, which have n = 32. Those three genotypes were assayed twice, n = 16 each time, to ensure consistency throughout the duration of the experiment and pooled for this analysis. fru P1 ∩ DIP- ι and dpr7 were not included in the activating experiments, but are here, as those lines were not available until after completion of the activation assays. The dpr19-Gal4 did not produce an expression pattern in the nervous system, using both a 10XUAS-RFP reporter and the intersectional approach, at the time points examined. n = 16. *p<0.05, **p<0.005, ***p<0.0005.
Figure 7

Meta-analysis of expression patterns of fru P1 ∩ dpr/DIP intersecting neurons and behavior data.
Meta-analysis using behavior data and image analysis data of 4- to 7-day-old flies. (A) Heatmap of fru P1 ∩ dpr/DIP intersecting neurons expression patterns in the male adult CNS. For each row, the minimum (blue), middle (white), and maximum (red) values are indicated. The top of the heatmap shows the relationship across the expression patterns of the dprs and DIPs, with a dendrogram. The summary of phenotypic analyses of male sexual behaviors, using either activating or silencing effector genes (see Figures 4–6), is shown below the heatmap. The dot indicates a significant change in behavior (p<0.05, unless indicated). The black X indicates that there was no experimental progeny from the cross, due to lethality, and therefore were not tested behaviorally. (B) Labeled confocal images showing the morphological featured scored. (C) Correlation analysis of GFP expression results (male on left and female on right). The scale for the spearman correlation is −1 (blue) to 1 (red). The dots to the right indicate the DIP interacting partners for each Dpr (left-hand side of each graph) (Dpr-DIP interactome based on Cosmanescu et al., 2018). The full data set is provided (Source data 1).
Figure 8 with 2 supplements
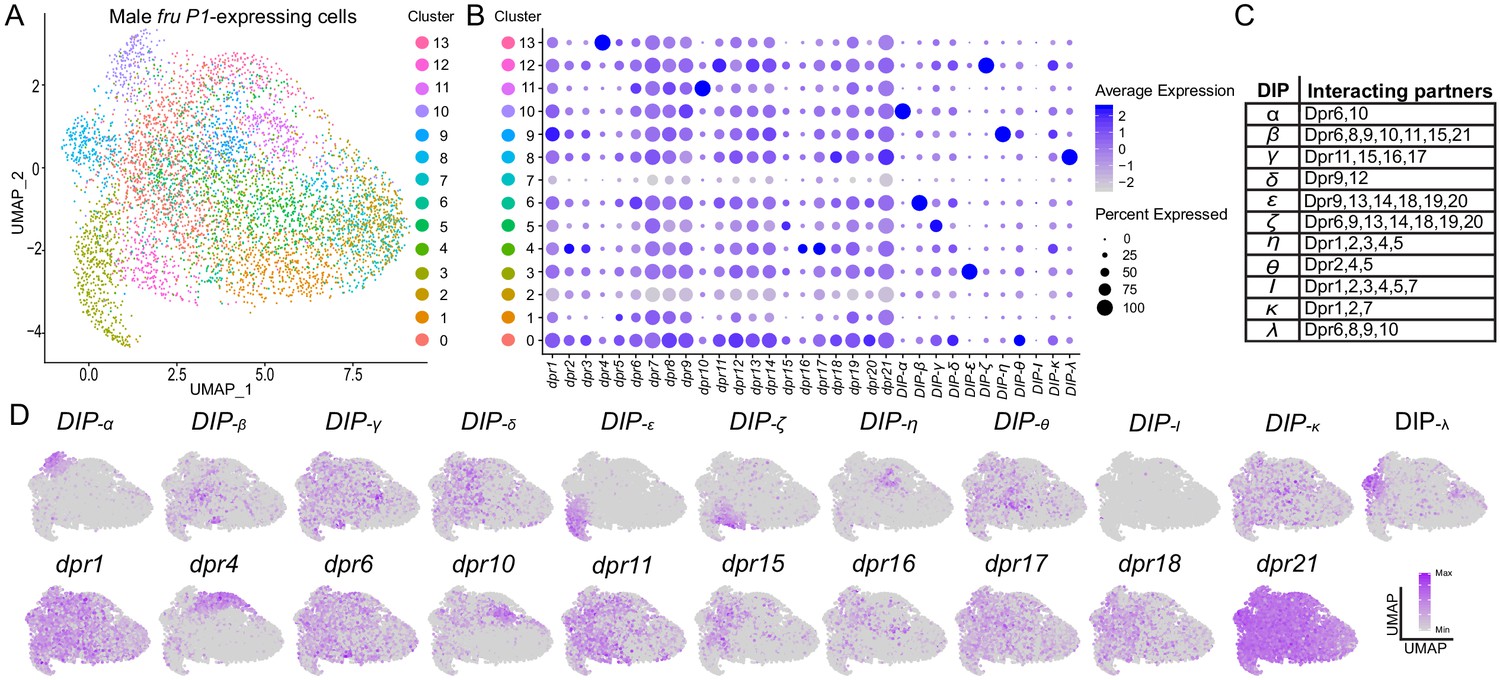
Single-cell RNA-sequencing analysis of dpr/DIP expression analysis in male fru P1 neurons.
(A) UMAP plot of 5621 fru P1 neurons, isolated from male tissue 48-hr after puparium formation. The data are clustered on dpr/DIP gene expression. (B) Dot plot showing the expression of dpr/DIP genes across all clusters identified in UMAP. Dot diameter indicates the fraction of cells expressing each gene in each cluster, as shown in legend. Color intensity indicates the average normalized expression levels. (C) Heterophilic interactions that have been demonstrated between DIPs and Dprs (Cosmanescu et al., 2018). (D) A subset of expression visualization of DIPs (top row) and subset of dprs (bottom row) in the UMAP-clustered cells. dpr or DIP-positive cells are labeled purple and color intensity is proportional to log normalized expression level shown in legend. The UMAP visualization for all dprs/DIPs is provided (Figure 8—figure supplement 1). The numerical expression values are in Source data 3.
Figure 8—figure supplement 1
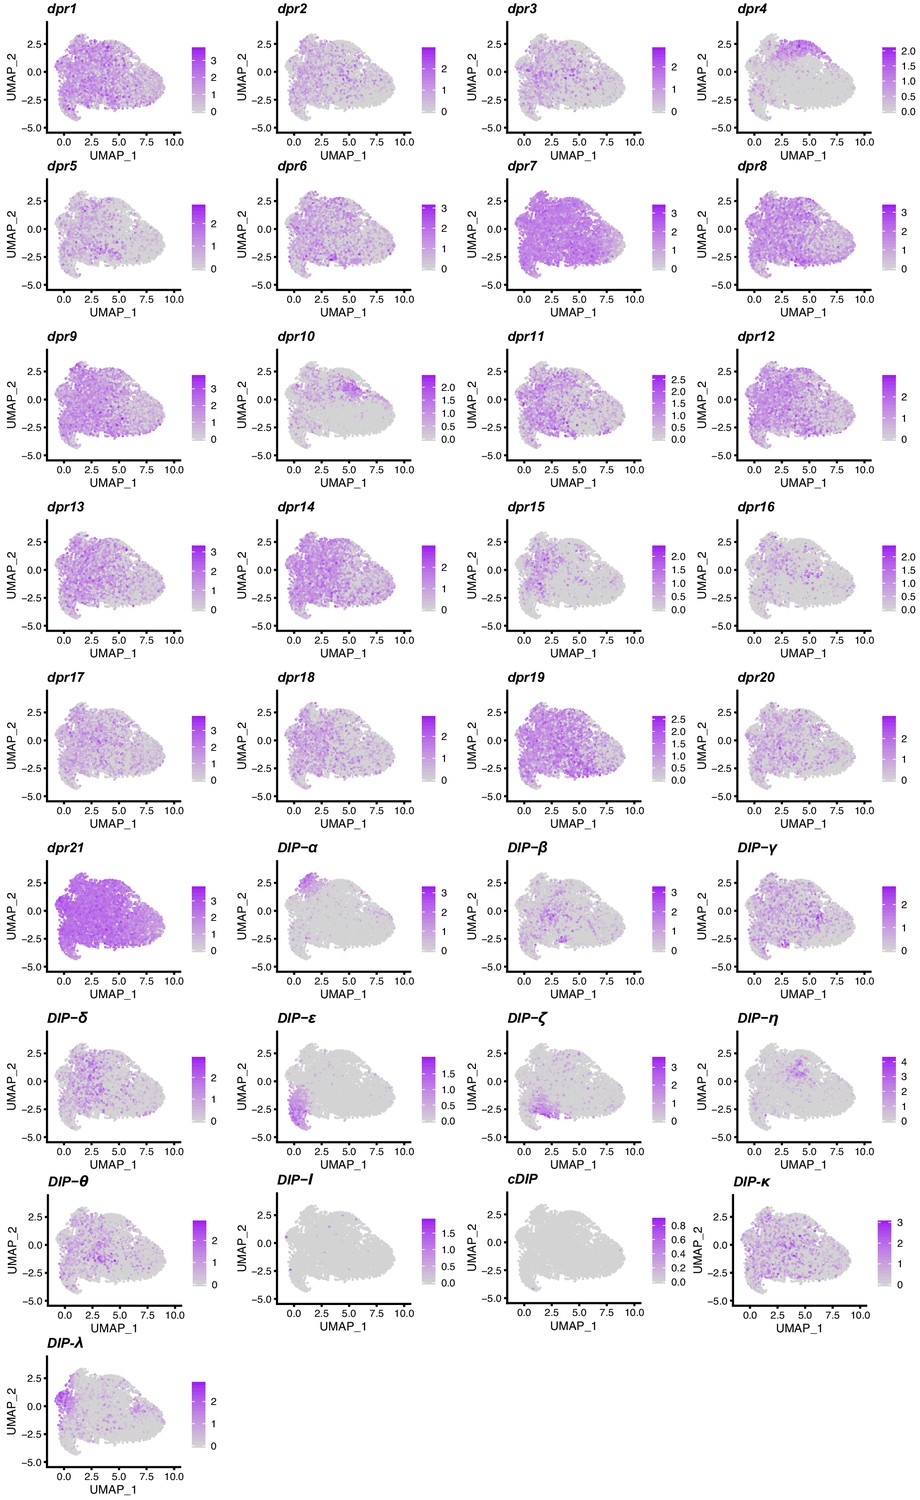
dpr/DIP expression visualization in the UMAP cluster.
dpr or DIP expression is shown in purple and color intensity is proportional to log normalized expression level. The legend to the right of each UMAP plot indicates the log normalized expression levels.
Figure 8—figure supplement 2
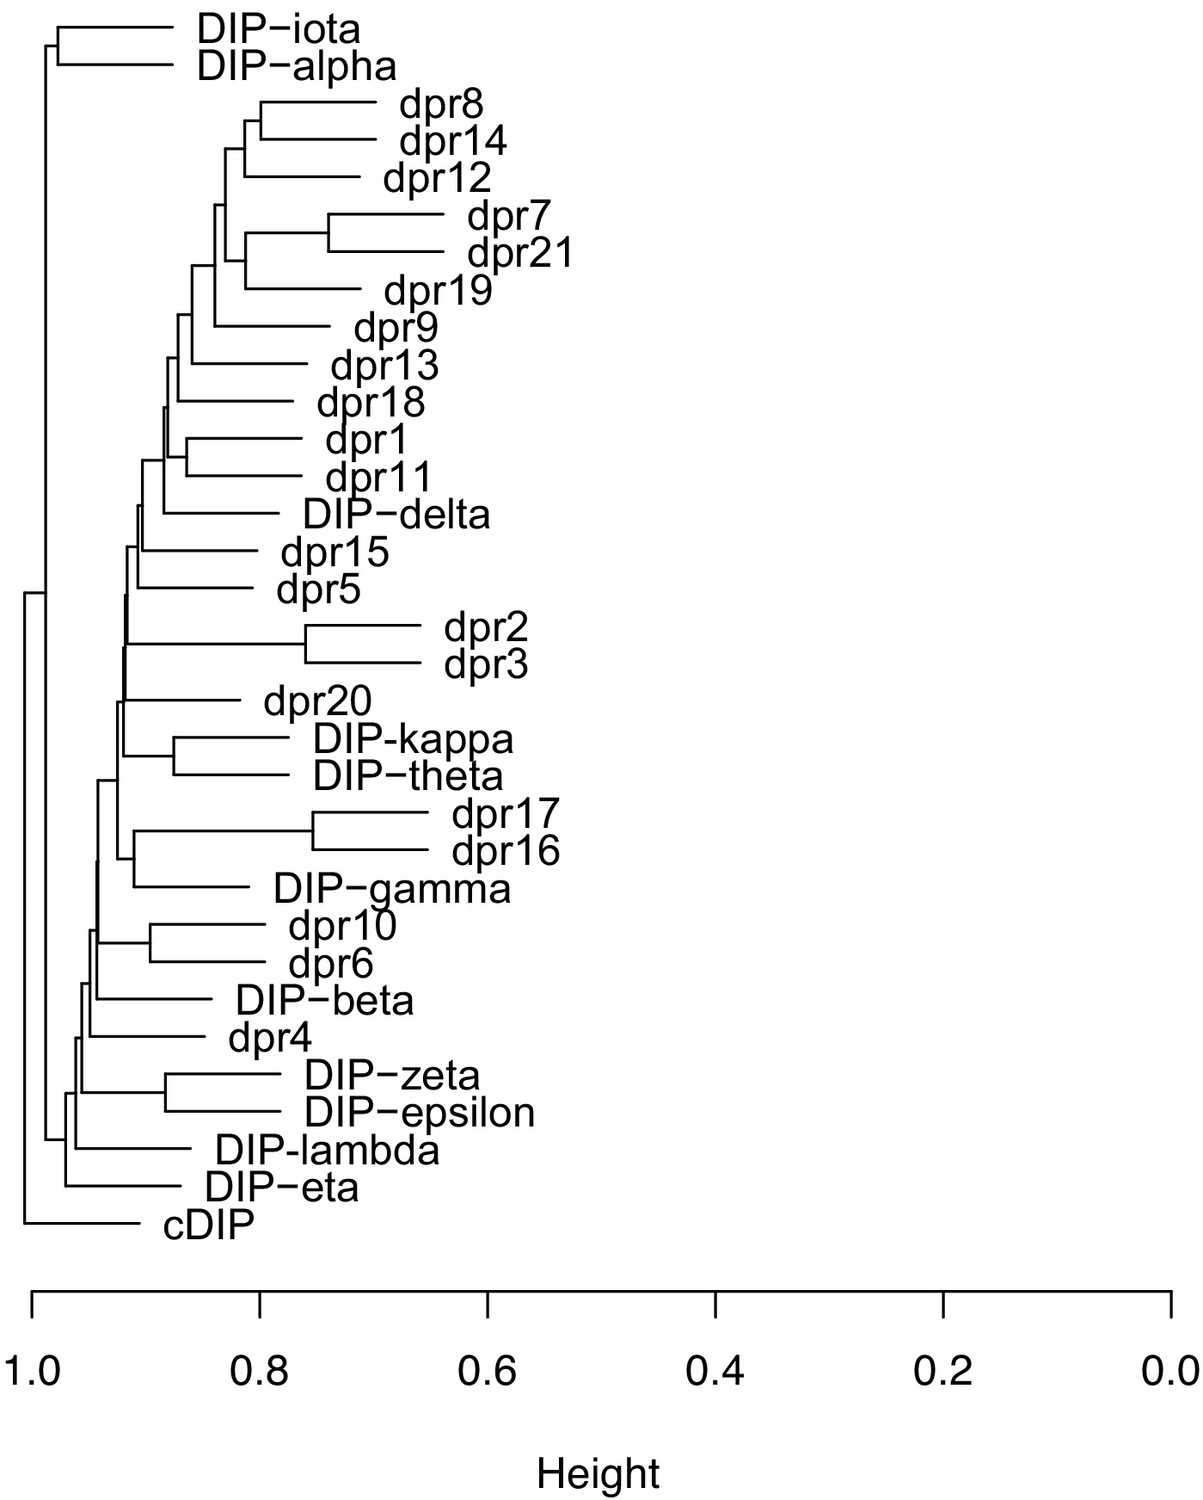
Hierarchical cluster dendrogram of dpr/DIP expression.
The dendrogram was generated using normalized and scaled UMI counts per cell from the 5621 fru P1 neurons. The x-axis height represents expression dissimilarity between dprs/DIPs across single cells calculated using a Pearson averge linkage matrix.
Figure 9 with 1 supplement
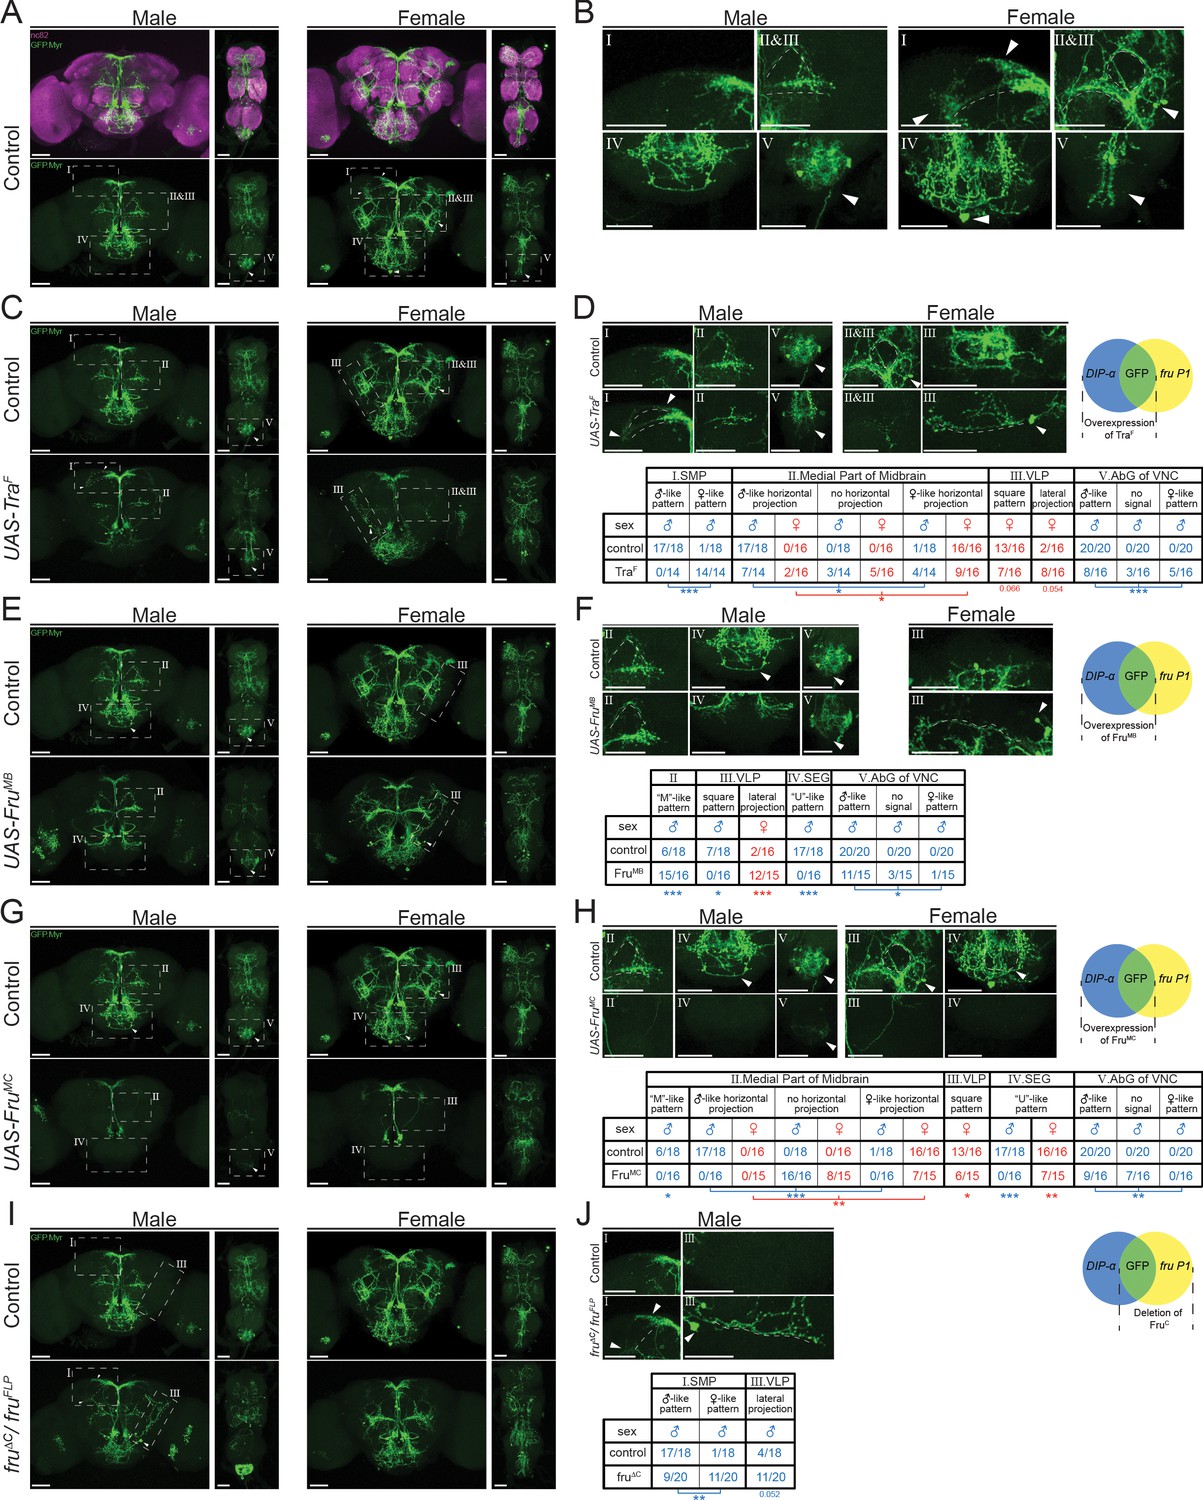
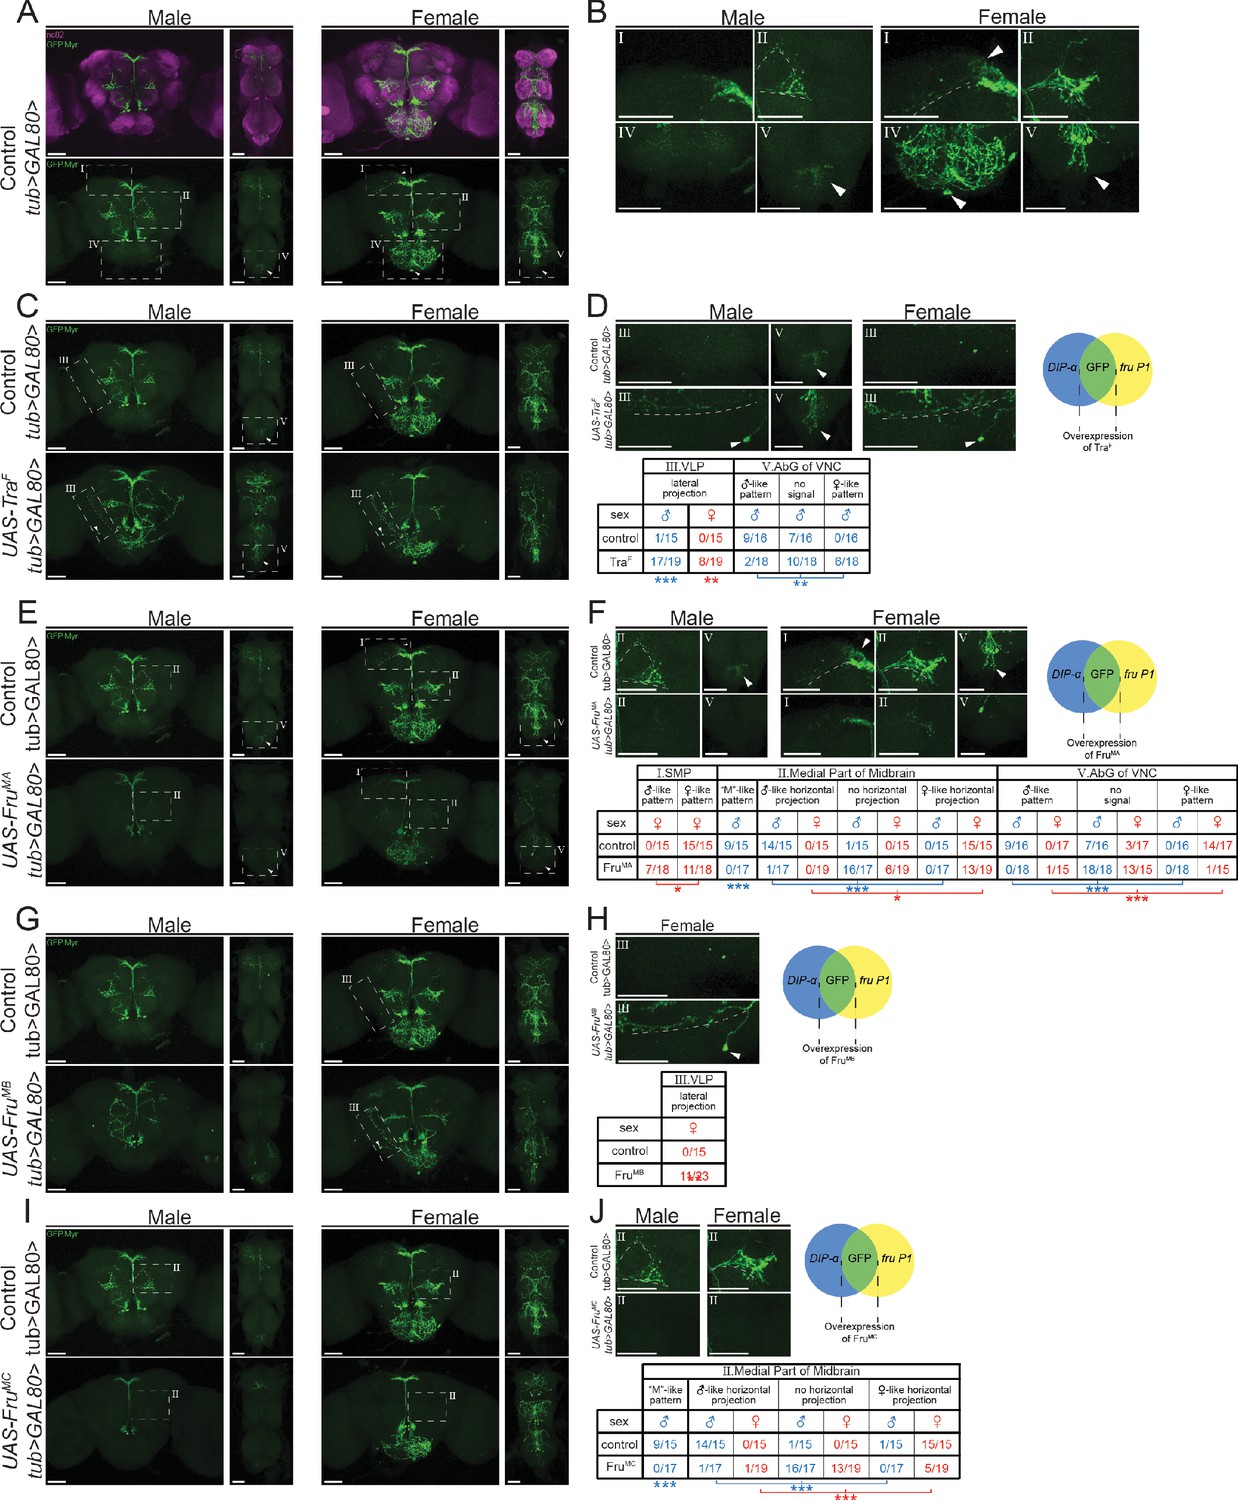
Higher resolution analyses of fru P1 ∩ DIP-α neurons with sex hierarchy perturbations.
Confocal maximum intensity projections of brains and ventral nerve cords from 4- to 7-day-old adult flies. fru P1 ∩ DIP-α neurons are in green (rabbit α-GFP Alexa Flour 488). Staining with the α-nc82 neuropil maker shows brain morphology in magenta (mouse α-nc82, goat α-mouse Alexa Flour 633). Image data were captured with ×20 objective, with scale bars showing 50 µM (A-J). Higher magnification images were generated using the Zeiss Zen software package (B, D, F, H, and J). Roman numerals are consistent across the panels in the same row. Venn diagrams show where membrane-bound GFP and sex hierarchy transgenes are expressed. (A) fru P1 ∩ DIP-α expression patterns in males and females. (B) Computationally magnified images, with sexually dimorphic regions indicated. Subpanels show: [I] superior medial protocerebrum (SMP) region of the brain; [II and III] medial part of midbrain region, where there are horizontal projections, and the ‘M’-like pattern (more frequent in males). The square pattern (more frequent in females) is in the ventral lateral protocerebrum (VLP) region of the brain. The medial horizontal projection is in a more exterior section of the confocal stack then the other features [II and III]; [IV] Subesophageal ganglion region of the brain (SEG). The U-like pattern and a set of cell bodies more frequently found in females are shown; [V] The abdominal ganglion of the ventral nerve cord (AbG). (C-J) Examination of morphology of fru P1 ∩ DIP-α neurons when sex hierarchy transgenes are expressed in DIP-α neurons. The quantification and statistics are provided in a table within the subpanel on the right of each row. This figure only shows regions that had significant changes due to sex hierarchy perturbation (full dataset provided; Source data 4). (C-D) TraF overexpression in DIP-α neurons. [III] a lateral projection in females that is not shown in wild-type data in panel B. (E-F) FruMB overexpression in DIP-α neurons. (G-H) FruMC overexpression in DIP-α neurons, (I-J) FruC isoform deletion. FruMC is absent or highly reduced in fru P1 neurons in this genotype, as transheterozygous for fruFLP/ fruΔC. Statistical significance of the differences in morphological features, between same sex control and genotypes with sex hierarchy transgene expression are indicated. Comparisons were done using the Fisher’s exact test (*p<0.05, **p<0.005, ***p<0.0005). The morphological features with significant differences are indicated by lines below the table (male in blue and female in red). n > 15 for each category. The genotypes of the samples shown are: DIP-αGal4; UAS>stop>GFP.Myr/+; fruFLP/+ (A-B), DIP- αGal4; UAS>stop>GFP.Myr/ UAS-TraF; fruFLP/+ (C-D), DIP- αGal4; UAS>stop>GFP.Myr/ UAS-FruMB; fruFLP/+ (E-F), DIP- αGal4; UAS>stop>GFP.Myr/ UAS-FruMC; fruFLP/+ (G-H), DIP- αGal4; UAS>stop>GFP.Myr/+; fruFLP/ fruΔC (I-J). Brain region nomenclature are consistent with previous reports (Insect Brain Name Working Group et al., 2014).
Figure 9—figure supplement 1
Sex hierarchy perturbation in only fru P1 ∩ DIP-α neurons.
Confocal maximum intensity projections of brains and ventral nerve cords from 4- to 7-day-old adult flies. fru P1 ∩ DIP-α neurons are in green (rabbit α-GFP Alexa Flour 488). Staining with the α-nc82 neuropil maker shows brain morphology in magenta (mouse α-nc82, goat α-mouse Alexa Flour 633). Image data were captured with ×20 objective, with scale bars showing 50 µM (A–J). Higher magnification images were generated using the Zeiss Zen software package (B, D, F, H, and J). Roman numerals are consistent across the panels in the same row. Venn diagrams show where membrane-bound GFP and sex hierarchy transgenes are expressed. The genotypes of the samples shown are: (A–B). DIP-αGal4; UAS>stop>GFP.Myr/+; fruFLP/ tub>Gal80>. (C–D) DIP- αGal4; UAS>stop>GFP.Myr/ UAS-TraF; fruFLP/ tub>Gal80>. (E–F) DIP- αGal4; UAS>stop>GFP.Myr/ UAS-FruMA; fruFLP/ tub>Gal80>. (G–H) DIP- αGal4; UAS>stop>GFP.Myr/ UAS-FruMB; fruFLP/ tub>Gal80>. (I–J) DIP- αGal4; UAS>stop>GFP.Myr/ UAS-FruMC; fruFLP/ tub>Gal80>. Brain region nomenclature are consistent with previous reports (Insect Brain Name Working Group et al., 2014).
Figure 10
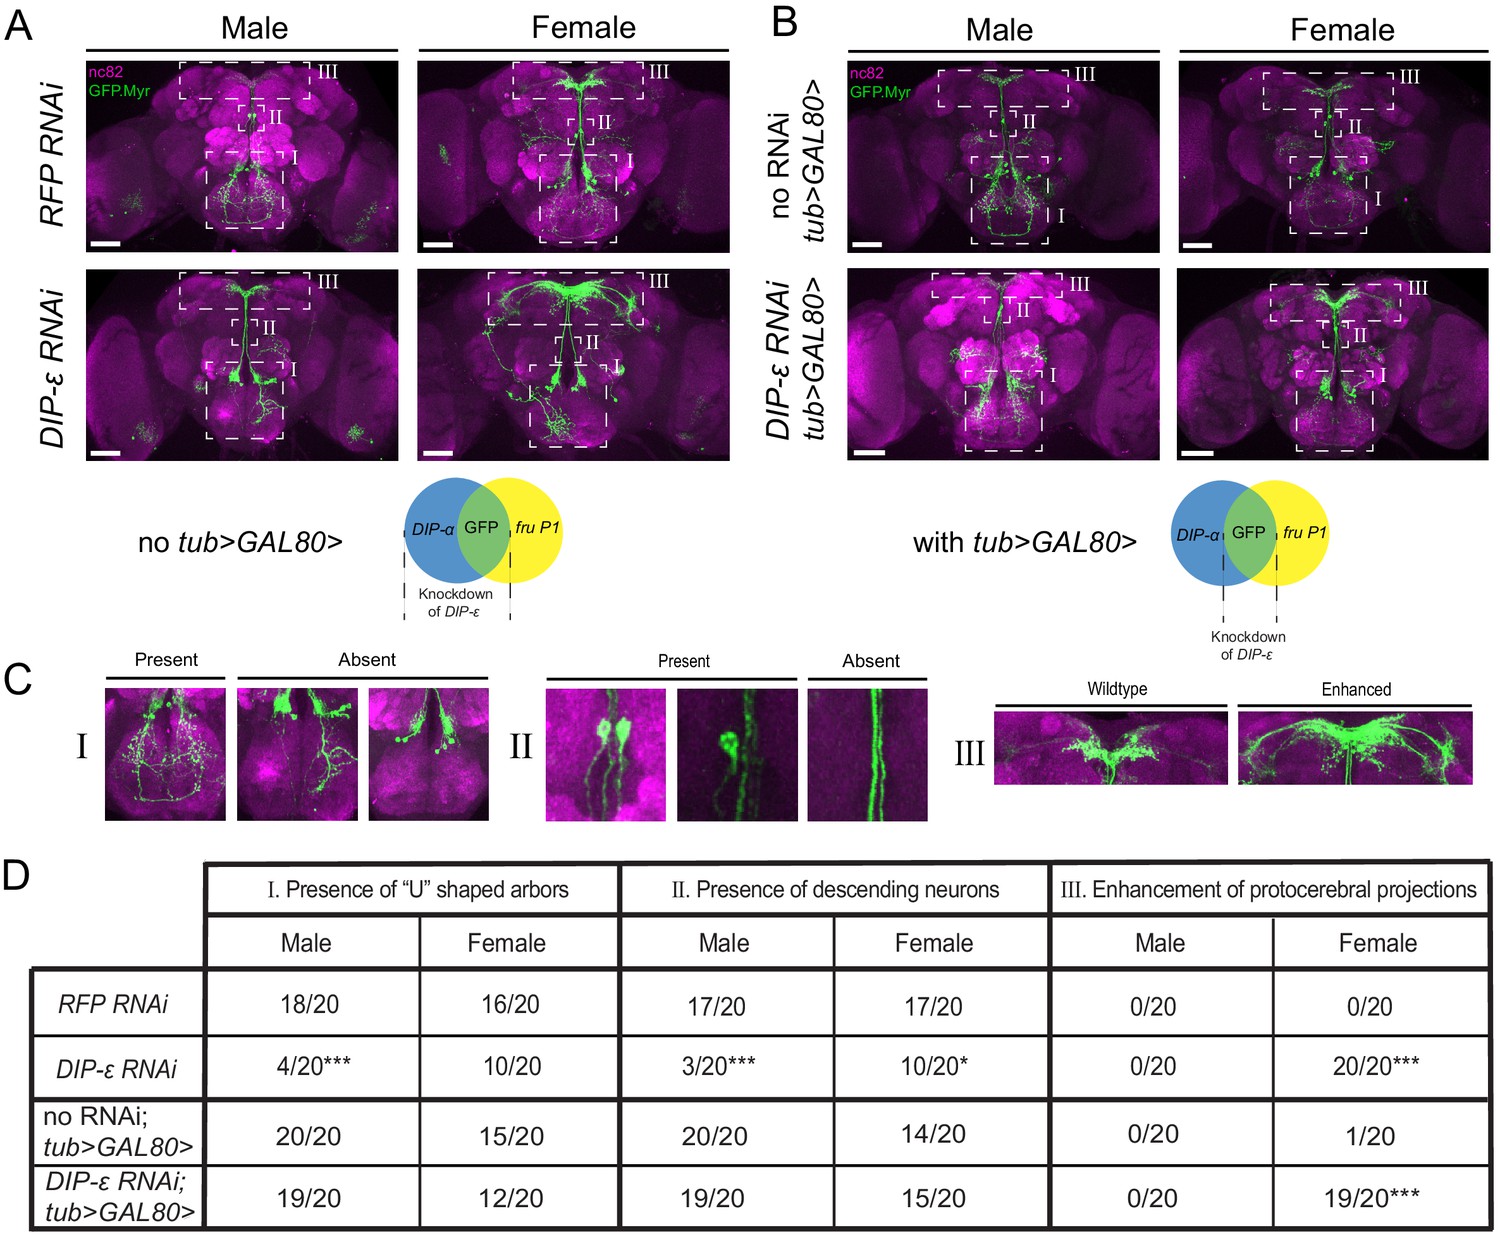
RNAi mediated knockdown of DIP-ε in fru P1 ∩ DIP-α neurons results in perturbations.
Maximum intensity projections of brains of 4–7 days old adult flies showing fru P1 ∩ DIP-α neurons stained with anti-GFP (green; rabbit α-GFP Alexa Flour 488) and the neuropil marker nc82 (magenta; mouse α-nc82, Alexa Flour 633). (A) fru P1 ∩ DIP-α neurons with DIP-ε or RFP (control) knockdown in all DIP-α expressing neurons. Genotypes are DIP-α Gal4; UAS > stop > GFP.Myr / RNAi; fruFLP / + with RNAi indicating either RFP or DIP-ε RNAi. (B) fru P1 ∩ DIP-α neurons with DIP-ε or no knockdown (control) restricted to only the visualized neurons (GFP+) through use of tub>GAL80>. Genotypes are DIP-α Gal4; UAS > stop > GFP.Myr / RNAi; fruFLP / tub>GAL80> with RNAi indicating either DIP-ε or no RNAi. The neuronal populations with RNAi expression are illustrated in the Venn diagrams. White dashed boxes indicate phenotypes of interest, which are located in (C) and include (subpanel I) presence of the U-shaped arbors, (subpanel II) presence of at least one descending neuron, and (subpanel III) enhancement of protocerebral projections. All phenotypes were scored blind and are quantified in (D). Statistical significance in between control flies and DIP-ε RNAi flies was evaluated by the Fisher’s exact test. In this figure, signicance is indicated as follows: *p<0.05, **p<0.01, ***p<0.001. n = 20 brains for each category. Magnification is ×20 and scale bars represent 50 µM.
Tables
Key resources table
| Reagent type (species) or resource | Designation | Source or reference | Identifiers | Additional information |
|---|---|---|---|---|
| Genetic reagent (D. melanogaster) | dpr1-Gal4 | Provided by Zinn lab | w;dpr1-T2A-GAL4/cyo | |
| Genetic reagent (D. melanogaster) | dpr2-Gal4 | Provided by Zinn lab | w;dpr2-T2A-GAL4/cyo | |
| Genetic reagent (D. melanogaster) | dpr3-Gal4 | Provided by Zinn lab | w;dpr3-T2A-GAL4/cyo (#2) | |
| Genetic reagent (D. melanogaster) | dpr4-Gal4 Flybase symbol: Dmel\TI{CRIMIC.TG4.1}dpr4CR00485-TG4.1 | Hugo Bellen/ Gene Disruption Project (GDP) Lee et al., 2018 PMID:29565247 | RRID:BDSC_79271 | y(1) w[*]; TI{GFP[3xP3.cLa]=CRIMIC.TG4.1}dpr4[CR00485-TG4.1]/TM3, Sb(1) Ser(1) |
| Genetic reagent (D. melanogaster) | dpr5-Gal4 | Provided by Zinn lab | w;;dpr5-T2A-GAL4/TM6b (#2) | |
| Genetic reagent (D. melanogaster) | dpr6-Gal4 | Provided by Zipursky Tan et al., 2015 PMID:26687360 | dpr6-T2A-GAL4/TM6b | |
| Genetic reagent (D. melanogaster) | dpr7-Gal4 Flybase symbol: Dmel\Mi{MIC}dpr7MI05719 | Hugo Bellen/ Gene Disruption Project (GDP) Nagarkar-Jaiswal et al., 2015a PMID:25824290 | RRID:BDSC_60786 | Y(1)Mi{y[+Dint2]=MIC}dpr7[MI05719] |
| Genetic reagent (D. melanogaster) | dpr8-Gal4 | Provided by Zinn lab | dpr8-GAL4/Fm7a | |
| Genetic reagent (D. melanogaster) | dpr9-Gal4 | Provided by Zinn lab | w; BL/Cyo; dpr9-T2A-GAL4/TM6b | |
| Genetic reagent (D. melanogaster) | dpr10-Gal4 | Provided by Zinn lab | w;;dpr10-T2A-GAL4/TM6b (#3) | |
| Genetic reagent (D. melanogaster) | dpr11-Gal4 | Provided by Zinn lab | w; BL/Cyo; dpr11-GAL4/TM6b | |
| Genetic reagent (D. melanogaster) | dpr12-Gal4 | Provided by Zinn lab | w; dpr12-GAL4/cyo; TM2/TM6b | |
| Genetic reagent (D. melanogaster) | dpr13-Gal4 | Provided by Zinn lab | w;dpr13-GAL4/cyo; TM2/TM6b | |
| Genetic reagent (D. melanogaster) | dpr14-Gal4 Flybase symbol: Dmel\TI{CRIMIC.TG4.1}dpr14CR00516-TG4.1 | Hugo Bellen/ Gene Disruption Project (GDP) Lee et al., 2018 PMID:29565247 | RRID:BDSC_80586 | y(1) TI{GFP[3xP3.cLa]=CRIMIC.TG4.1}dpr14[CR00516-TG4.1] w[*] |
| Genetic reagent (D. melanogaster) | dpr15-Gal4 Flybase symbol: Dmel\Mi{Trojan-GAL4.1}dpr15MI01408-TG4.1 | Hugo Bellen/ Gene Disruption Project (GDP) Lee et al., 2018 PMID:29565247 | RRID:BDSC_66827 | y(1) w[*];; Mi{Trojan-GAL4.1}dpr15[MI01408-TG4.1]/TM3, Sb(1) Ser(1) |
| Genetic reagent (D. melanogaster) | dpr16-Gal4 | Provided by Zinn lab | w;;dpr16-T2A-GAL4/TM6b (#3) | |
| Genetic reagent (D. melanogaster) | dpr17-Gal4 Flybase symbol: Dmel\Mi{Trojan-GAL4.1}dpr17MI08707-TG4.1 | Hugo Bellen/ Gene Disruption Project (GDP) Lee et al., 2018 PMID:29565247 | RRID:BDSC_76200 | y(1) w[*]; Mi{Trojan-GAL4.1}dpr17[MI08707-TG4.1]/TM3, Sb(1) Ser(1) |
| Genetic reagent (D. melanogaster) | dpr18-Gal4 Flybase symbol: Dmel\TI{CRIMIC.TG4.1}dpr18CR01004-TG4.1 | Hugo Bellen/ Gene Disruption Project (GDP) Lee et al., 2018 PMID:29565247 | RRID:BDSC_83245 | y(1) w[*]; TI{GFP[3xP3.cLa]=CRIMIC.TG4.1}dpr18[CR01004-TG4.1] |
| Genetic reagent (D. melanogaster) | dpr19-Gal4 Flybase symbol: Dmel\TI{CRIMIC.TG4.1}dpr19CR00996-TG4.1 | Hugo Bellen/ Gene Disruption Project (GDP) Lee et al., 2018 PMID:29565247 | RRID:BDSC_83242 | y(1) w[*]; TI{GFP[3xP3.cLa]=CRIMIC.TG4.1}dpr19[CR00996-TG4.1]/SM6a |
| Genetic reagent (D. melanogaster) | DIP-α-Gal4 | Provided by Zinn lab | DIP-alpha-T2A-GAL4/(Fm7) | |
| Genetic reagent (D. melanogaster) | DIP-β-Gal4 | Provided by Zinn lab | DIP-beta--T2A-GAL4GAL4 | |
| Genetic reagent (D. melanogaster) | DIP-γ-Gal4 | Provided by Zinn lab | w;;DIP-gamma--T2A-GAL4GAL4/TM3, Sb (#8) | |
| Genetic reagent (D. melanogaster) | DIP-δ-Gal4 | Provided by Zinn lab | w;;DIP-delta--T2A-GAL4GAL4/TM6b (#3) | |
| Genetic reagent (D. melanogaster) | DIP-ε-Gal4 Flybase symbol:Dmel\Mi{Trojan-GAL4.1}DIP-εMI11827-TG4.1 | Hugo Bellen/ Gene Disruption Project (GDP) Lee et al., 2018 PMID:29565247 | RRID:BDSC_67502 | |
| Genetic reagent (D. melanogaster) | DIP-ζ-Gal4 | Provided by Zinn lab | w;DIP-zeta-T2A-GAL4/Cyo | |
| Genetic reagent (D. melanogaster) | DIP-η-Gal4 | Provided by Zinn lab | w;DIP-eta-T2A-GAL4/Cyo | |
| Genetic reagent (D. melanogaster) | DIP-θ-Gal4 | Provided by Zinn lab | w;DIP-theta-Gal4/cyo;TM2/TM6b | |
| Genetic reagent (D. melanogaster) | DIP-ι-Gal4 Flybase symbol: Dmel\TI{CRIMIC.TG4.1}DIP-ιCR00997-TG4.1 | Hugo Bellen/ Gene Disruption Project (GDP) Lee et al., 2018 PMID:29565247 | RRID:BDSC_83243 | y(1) w[*]; TI{GFP[3xP3.cLa]=CRIMIC.TG4.1}DIP-iota[CR00997-TG4.1]/SM6a |
| Genetic reagent (D. melanogaster) | 10xUAS > stop > myr::smGdP-cMyc Flybase symbol: Dmel\P{10XUAS(FRT.stop)GFP.Myr}su(Hw)attP5 | Pfeiffer, B., Rubin, G. (2014.4.16). Recombinase and tester constructs and insertions. Flybase ID: FBrf0224689 | RRID:BDSC_55810 | +/+; P{10XUAS(FRT.stop)GFP.Myr}su(Hw)attP5; +/+ |
| Genetic reagent (D. melanogaster) | Canton S | Ulrike Heberlein | Wild type | |
| Genetic reagent (D. melanogaster) | Canton S (white) | Ulrike Heberlein | Wild type with white mutation introgression | |
| Genetic reagent (D. melanogaster) | UAS > stop > TrpA1 Flybase symbol: Dmel\P{UAS(FRT.stop)TrpA1myc}VIE-260B | Dickson, B. (2017.1.31). Barry Dickson Stocks. Flybase ID: FBrf0234603 | RRID:BDSC_66871 | w[*]; P{y[+t*] w[+mC]=UAS(FRT.stop)TrpA1[myc]}VIE-260B |
| Genetic reagent (D. melanogaster) | fru P1FLP Flybase symbol: Dmel\TI{FLP}fruFLP | Donor: Barry Dickson, Howard Hughes Medical Institute, Janelia Research Campus | RRID:BDSC_66870 | w[*]; TI{FLP}fru[FLP]/TM3, Sb(1) |
| Genetic reagent (D. melanogaster) | UAS > stop > TNTQ Flybase symbol: P{UAS(FRT.stop)Ctet\tetXin} | Barry Dickson Stockinger et al., 2005 PMID:15935765 | w[*]; P{w[+m*]=UAS(FRT.stop)Ctet\tetXin}VIE-19A/CyO | |
| Genetic reagent (D. melanogaster) | UAS > stop > TNTE Flybase symbol: Dmel\P{UAS(FRT.stop)Ctet\tetX}VIE-19A | Barry Dickson, Howard Hughes Medical Institute, Janelia Research Campus | RRID:BDSC_67690 | w[*]; P{w[+m*]=UAS(FRT.stop)Ctet\tetX}VIE-19A/CyO |
| Genetic reagent (D. melanogaster) | tub >GAL80> Flybase symbol: Dmel\P{αTub84B(FRT.GAL80)}3 | Zhang, B. (2012.5.29). P{alphaTub84B(FRT.GAL80)} insertions from Bing Zhang Flybase ID: FBrf0218396 | RRID:BDSC_38881 | w[*]; Bl(1)/CyO; P{w[+mC]=alphaTub84B(FRT.GAL80)}3 |
| Genetic reagent (D. melanogaster) | UAS-DIP-α | Provided by Zipursky Xu et al., 2018 PMID:30467079 | w;BL/CyO;UAS-Dipalpha-2ATdTom/TM6b | |
| Genetic reagent (D. melanogaster) | RFP-RNAi Flybase symbol: Dmel\P{TRiP.HMS05847}attP40 | Donor: Transgenic RNAi Project Perkins et al., 2015 PMID:26320097 | RRID:BDSC_67984 | y(1) v(1); P{y[+t7.7] v[+t1.8]=TRiP.HMS05847}attP40 |
| Genetic reagent (D. melanogaster) | DIP-α-RNAi Flybase symbol: Dmel\P{TRiP.HMS05847}attP40 | Donor: Transgenic RNAi Project Perkins et al., 2015 PMID:26320097 | RRID:BDSC_67984 | y(1) v(1); P{y[+t7.7] v[+t1.8]=TRiP.HMS01879}attP40/CyO |
| Genetic reagent (D. melanogaster) | DIP-β RNAi Flybase symbol: Dmel\P{TRiP.HMS01774}attP40 | Donor: Transgenic RNAi Project Perkins et al., 2015 PMID:26320097 | RRID:BDSC_38310 | y(1) sc[*] v(1); P{y[+t7.7] v[+t1.8]=TRiP.HMS01774}attP40 |
| Genetic reagent (D. melanogaster) | DIP-ε-RNAi Flybase symbol: Dmel\P{TRiP.HMS01718}attP40 | Donor: Transgenic RNAi Project Perkins et al., 2015 PMID:26320097 | RRID:BDSC_38936 | y(1) sc[*] v(1); P{y[+t7.7] v[+t1.8]=TRiP.HMS01718}attP40 |
| Genetic reagent (D. melanogaster) | DIP-η-RNAi Flybase symbol: Dmel\P{TRiP.HMS01673}attP40 | Donor: Transgenic RNAi Project Perkins et al., 2015 PMID:26320097 | RRID:BDSC_38229 | y(1) sc[*] v(1); P{y[+t7.7] v[+t1.8]=TRiP.HMS01673}attP40 |
| Genetic reagent (D. melanogaster) | DIP-ι-RNAi Flybase symbol: Dmel\P{TRiP.HMS01675}attP40 | Donor: Transgenic RNAi Project Perkins et al., 2015 PMID:26320097 | RRID:BDSC_38231 | y(1) sc[*] v(1); P{y[+t7.7] v[+t1.8]=TRiP.HMS01675}attP40 |
| Genetic reagent (D. melanogaster) | DIP-θ-RNAi Flybase symbol: Dmel\P{TRiP.JF03069}attP2 | Donor: Transgenic RNAi Project Perkins et al., 2015 PMID:26320097 | RRID:BDSC_28654 | y(1) v(1);; P{y[+t7.7] v[+t1.8]=TRiP.JF03069}attP2 |
| Genetic reagent (D. melanogaster) | DIP-ζ-RNAi Flybase symbol: Dmel\P{TRiP.HMS01671}attP40 | Donor: Transgenic RNAi Project Perkins et al., 2015 PMID:26320097 | RRID:BDSC_38227 | y(1) sc[*] v(1); P{y[+t7.7] v[+t1.8]=TRiP.HMS01671}attP40 |
| Genetic reagent (D. melanogaster) | dpr5-RNAi Flybase symbol: Dmel\P{TRiP.JF03306}attP2 | Donor: Transgenic RNAi Project Perkins et al., 2015 PMID:26320097 | RRID:BDSC_29627 | y(1) v(1);; P{y[+t7.7] v[+t1.8]=TRiP.JF03306}attP2 |
| Genetic reagent (D. melanogaster) | dpr10-RNAi Flybase symbol: Dmel\P{TRiP.JF02920}attP2 | Donor: Transgenic RNAi Project Perkins et al., 2015 PMID:26320097 | RRID:BDSC_27991 | y(1) v(1);; P{y[+t7.7] v[+t1.8]=TRiP.JF02920}attP2 |
| Genetic reagent (D. melanogaster) | dpr12-RNAi Flybase symbol: Dmel\P{TRiP.JF03210}attP2 | Donor: Transgenic RNAi Project Perkins et al., 2015 PMID:26320097 | RRID:BDSC_28782 | y(1) v(1);; P{y[+t7.7] v[+t1.8]=TRiP.JF03210}attP2 |
| Genetic reagent (D. melanogaster) | UAS-DIP-ε | FlyORF PMID:23637332 and 24922270 | Fly line ID: F004486 | ;;M{UAS-DIP-epsilon.ORF.3xHA.GW}ZH-86Fb* |
| Genetic reagent (D. melanogaster) | UAS-DIP-γ | FlyORF PMID:23637332 and 24922270 | Fly line ID: F003086 | ;;M{UAS-DIP-gamma.ORF.3xHA.GW}ZH-86Fb* |
| Genetic reagent (D. melanogaster) | UAS-DIP-ι | FlyORF PMID:23637332 and 24922270 | Fly line ID: F004254 | ;;M{UAS-DIP-iota.ORF.3xHA.GW}ZH-86Fb* |
| Genetic reagent (D. melanogaster) | UAS-dpr1 | FlyORF PMID:23637332 and 24922270 | Fly line ID: F004145 | ;;M{UAS-dpr1.ORF.3xHA.GW}ZH-86Fb |
| Genetic reagent (D. melanogaster) | UAS-dpr4 | FlyORF PMID:23637332 and 24922270 | Fly line ID: F002762 | ;;M{UAS-dpr4.ORF.3xHA.GW}ZH-86Fb |
| Genetic reagent (D. melanogaster) | UAS-dpr6 | Provided by Zipursky Xu et al., 2018 PMID:30467079 | w;UAS-Dpr6F-V5/CyO;TM2/TM6b | |
| Genetic reagent (D. melanogaster) | UAS-dpr10 | Provided by Zipursky Xu et al., 2018 PMID:30467079 | w;UAS-Dpr10D-V5/CyO;TM2/TM6b | |
| Genetic reagent (D. melanogaster) | UAS-dpr18 | FlyORF PMID:23637332 and 24922270 | ;;M{UAS-dpr18.ORF.3xHA.GW}ZH-86Fb* | |
| Genetic reagent (D. melanogaster) | UAS-TraF Flybase symbol: Dmel\P{UAS-tra.F}20J7 | Donor: Ralph Greenspan, New York University | RRID:BDSC_4590 | w[1118]; P{w[+mC]=UAS-tra.F}20J7 |
| Genetic reagent (D. melanogaster) | UAS-FruMA7 | Provided by Stephen Goodwin | ||
| Genetic reagent (D. melanogaster) | UAS-FruMB25 | Provided by Stephen Goodwin | ||
| Genetic reagent (D. melanogaster) | UAS-FruMC1 | Provided by Stephen Goodwin | ||
| Genetic reagent (D. melanogaster) | FruΔC | PMID:16753560 | ||
| Genetic reagent (D. melanogaster) | Flybase symbol: Dmel\P{10XUAS-IVS-mCD8::GFP}attP40 | Donor: Gerald M. Rubin and Barret Pfeiffer, Howard Hughes Medical Institute, Janelia Research Campus | RRID:BDSC_32186 | w[*]; P{y[+t7.7] w[+mC]=10XUAS-IVS-mCD8::GFP }attP40 |
| Genetic reagent (D. melanogaster) | fru P1-Gal4 | Provided by Baker lab PMID:15959468 |
Additional files
-
Source data 1
Image quantification.
Data tables of quantification of fru P1 ∩ dpr/DIP neurons. This is an excel data table with 10 sheets that contain: 1. Raw Data Brain: raw data and observation notes only for areas of the brain scored/counted. 2. Raw Data VNC: raw data and observation notes for areas of the VNC scored/ counted. 3. Raw Scoring Data: raw scoring observations of areas in both brain and VNC scored. 4. Scoring Data Processed: assigning numerical values between 0 and 1 to scoring observations. 5. Raw Count Data: raw cell counts for areas in both the brain and VNC. 6. Cell Count Calculations: math done to cell counts so they were between 0 and 1. 7. Full Data Set: both male and female image analysis data with scoring observations and cell counts as values between 0 and 1. 8. Male Only: image analysis results for males (used to create heatmaps). 9. Female only: image analysis results for females (used to create heatmap). 10. Heatmap_Behavior_Plot: supplemental figure of the heatmap and behavior plot where the count data and scoring data has been separated. This sheet also contains additional heat maps of the male and female image count data.
- https://cdn.elifesciences.org/articles/63101/elife-63101-data1-v2.xlsx
-
Source data 2
Behavioral data.
Data tables of quantification of behavioral phenotypes. This is an excel data table with five sheets that contain all the behavioral data as follows: 1. READ ME: This first sheet is to explain the following four tabs. Please note that TNTQA1, as opposed to TNTQ is used in the following sheets. They both refer to the inactive form of TNT, but TNTQA1 is our lab nomenclature. 2. TrpA1 male-female courtship behavior data. 3. TrpA1 male alone courtship behavior data. 4. TNT courtship behavior data. 5. TNT DAM activity locomoter behavior data: This tab contains line crossing reads from Drosophila Activity Monitors (DAM).
- https://cdn.elifesciences.org/articles/63101/elife-63101-data2-v2.xlsx
-
Source data 3
Single-cell RNA-seq.
Data tables that include information from the single-cell RNA-seq study, including data matrices and UPSET analyses, in five sheets as follows: 1. Barcode rank plot and sequencing matrices. 2. Male 48 hr APF fru P1 neurons dpr/DIP gene-cell barcode matrix of log normalized and scaled gene counts. Columns are cell barcodes, rows are dpr/DIP genes. 3. Male 48 hr APF fru P1 neurons dpr/DIP expression matrix binarized by 0 or one where normalized, scaled expression >1 = 1 and expression <1 = 0. Data table is presented in transposed in format. Columns are dpr/DIP genes, rows are cell barcodes. 4. Numbers of single cells with increasing numbers of dprs/DIPs co-expressed, derived from data on sheet 3. 5. Upset plot of dpr/DIP expression combinations based on binarized expression matrix (sheet 3) where normalized, scaled expression >1 = 1 and expression <1 = 0. dpr/DIP expression dendrogram based on expression matrix presented in sheet 2.
- https://cdn.elifesciences.org/articles/63101/elife-63101-data3-v2.xlsx
-
Source data 4
Sex hierarchy perturbation.
Data tables of quantification of confocal data from sex hierarchy perturbations in fru P1 ∩ DIP-α neurons. This excel file has the quantification from the sex hierarchy perturbation analyses, with the following sheets: 1. Read Me: This first sheet is to explain the following tabs and to display the features scored. Representative confocal 3D projections are shown below. 2. Genotype and Condition: Description of genotypes, conditions, expected perturbations and changes. 3A. Scoring Summary of set one overexpressors: Overexpression of sex hierarchy related genes in ALL DIP-α cells plus a loss-of-function line (Control: DIP-α-GAL4; UAS>stop>GFP.Myr/+; fruFLP/+). 3B. The corresponding scoring raw data of 4A. 4A. Scoring Summary of set two overexpressors (with tubGal80): Overexpression of sex hierarchy related genes in DIP-α and fru P1 intersecting cells. (Control: DIP-α-GAL4; UAS>stop>GFP.Myr/+; fruFLP/tub>GAL80>). 4B. The corresponding scoring raw data of 5A (with tubGal80). 5. The conclusive tables of all scoring data and the corresponding statistics (p values from Fisher's Exact test; when p ≦ 0.05, the cell will be highlighted). 6. Confocal images showing staining controls: UAS-FruM constructs and expression pattern of Dip-alpha with UAS-GFP.
- https://cdn.elifesciences.org/articles/63101/elife-63101-data4-v2.xlsx
-
Source data 5
RNAi and overexpression screen.
Data tables of quantification of confocal data of RNAi and dpr/DIP overexpression analyses, in four sheets as follows: 1. READ ME: This first sheet is to explain the following four tabs. 2. DIP-α- and DIPδ-GAL4 screen: This sheet contains all genotypes tested in the initial RNAi/overexpressor screen using both DIP-α and DIP-δ as the GAL4 driver. The controls are bolded. N = 5. This sheet contains the following columns: Genotype: Contains an abbreviated genotype, including the GAL4 driver and dpr/DIP knocked-down (RNAi) or overexpressed (UAS). Although not explicitly stated, all genotypes also contained a UAS > stop > GFP.Myr transgene as well as a fruFLP transgene. Temperature Raised: The RNAi crosses were set up at 25°C where the flies were allowed to lay eggs for 2–3 days. Then, the parents were turned into a new vial, and the eggs were raised at 29°C. This was done to ensure that the RNAi was fully functional, as it was found to be less effective at 25°C. All overexpressor flies were raised at 25°C, as noted. Difficulty getting males: This was only an issue with the RNAi crosses at 29°C. Some of these crosses did not produce males at all, or produced far fewer males than females. Of note, these crosses always produced females with ease. Assayed at 16–24 hr: ‘Yes’ in this column indicated that five replicates per sex were dissected and stained as 16–24 hr adults. Assayed at 4–7 days: ‘Yes’ in this column indicated that five replicates per sex were dissected and stained as 4- to 7-day adults. Phenotype: Any phenotype observed when comparing the RNAi with its respective control. Notes: Relevant notes. 3.DIP-α-GAL4; DIP-ε-RNAi: Of all the genotypes tested, this was the only one to show a robust phenotype. The czi files were scored blind for conditions with and without tub>GAL80>. n = 20. A table summarizing the statistics is to the right of the raw data. See below for a more detailed description of how these phenotypes were scored. 4. UAS DIP-α screen: Although not explicitly stated, all genotypes also contained a UAS > stop > GFP.Myr transgene as well as a fruFLP transgene. Each of the 7 GAL4s of interest were first crossed to UAS DIP-alpha (experimental) and Canton S (white) (control) with n = 5. The GAL4 stock was crossed to Canton S (white) (w;cs) as a control to eliminate balancers. The controls are bolded in this data sheet. 3 GAL4 drivers that showed potential phenotypes upon overexpressing DIP-alpha were identified for further study (DIP-β, DIP-δ, and DIP-ε). These genotypes were retested with an n = 15 and with tub>GAL80>. Upon further analysis, no robust phenotypes were observed and as a result, the images were not scored.
- https://cdn.elifesciences.org/articles/63101/elife-63101-data5-v2.xlsx
-
Transparent reporting form
- https://cdn.elifesciences.org/articles/63101/elife-63101-transrepform-v2.docx
Download links
A two-part list of links to download the article, or parts of the article, in various formats.
Downloads (link to download the article as PDF)
Open citations (links to open the citations from this article in various online reference manager services)
Cite this article (links to download the citations from this article in formats compatible with various reference manager tools)
Investigation of Drosophila fruitless neurons that express Dpr/DIP cell adhesion molecules
eLife 10:e63101.
https://doi.org/10.7554/eLife.63101


