High-quality carnivoran genomes from roadkill samples enable comparative species delineation in aardwolf and bat-eared fox
- Institut des Sciences de l’Evolution de Montpellier (ISEM), CNRS, IRD, EPHE, Université de Montpellier, France
- National Museum and Centre for Environmental Management, University of the Free State, South Africa
- Department of Natural Sciences, National Museums Scotland, United Kingdom
- CNRS, Sorbonne Université, CNRS, ABiMS, Station Biologique de Roscoff, France
- Institut Universitaire de France (IUF), France
Figures
Figure 1
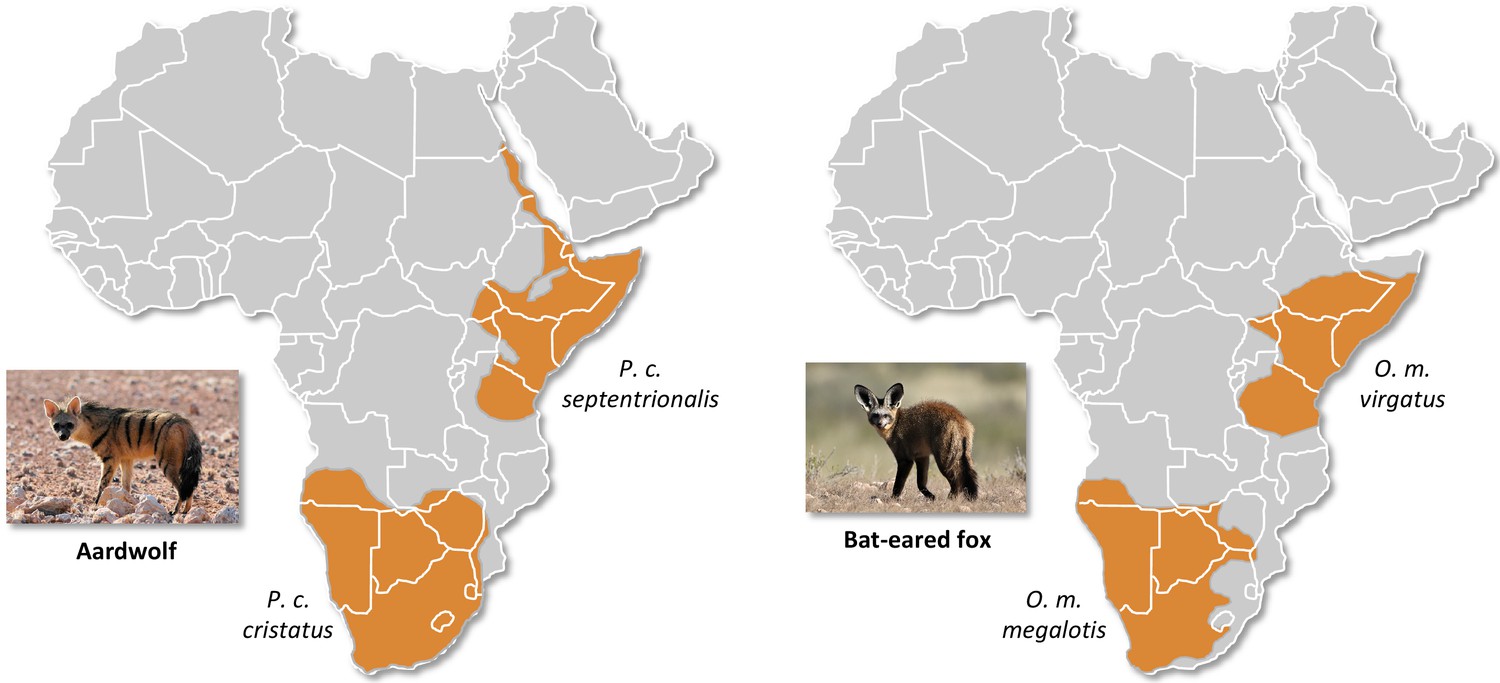
Disjunct distributions of the aardwolf (Proteles cristatus) and the bat-eared fox (Otocyon megalotis) in Eastern and Southern Africa.
Within each species, two subspecies have been recognized based on their distributions and morphological differences (Clark, 2005; Koehler and Richardson, 1990). Picture credits: Southern aardwolf (P. cristatus cristatus) copyright Dominik Käuferle; Southern bat-eared fox (O. megalotis megalotis) copyright Derek Keats.
Figure 2

Representation of the mitochondrial genetic diversity within the Carnivora with (a) the mitogenomic phylogeny inferred from 142 complete Carnivora mitogenomes, including those of the two populations of aardwolf (Proteles cristatus) and bat-eared fox (Otocyon megalotis) and (b) intraspecific (orange) and the interspecific (red) genetic diversities observed for the two mitochondrial markers COX1 and CYTB.
Silhouettes from http://phylopic.org/.
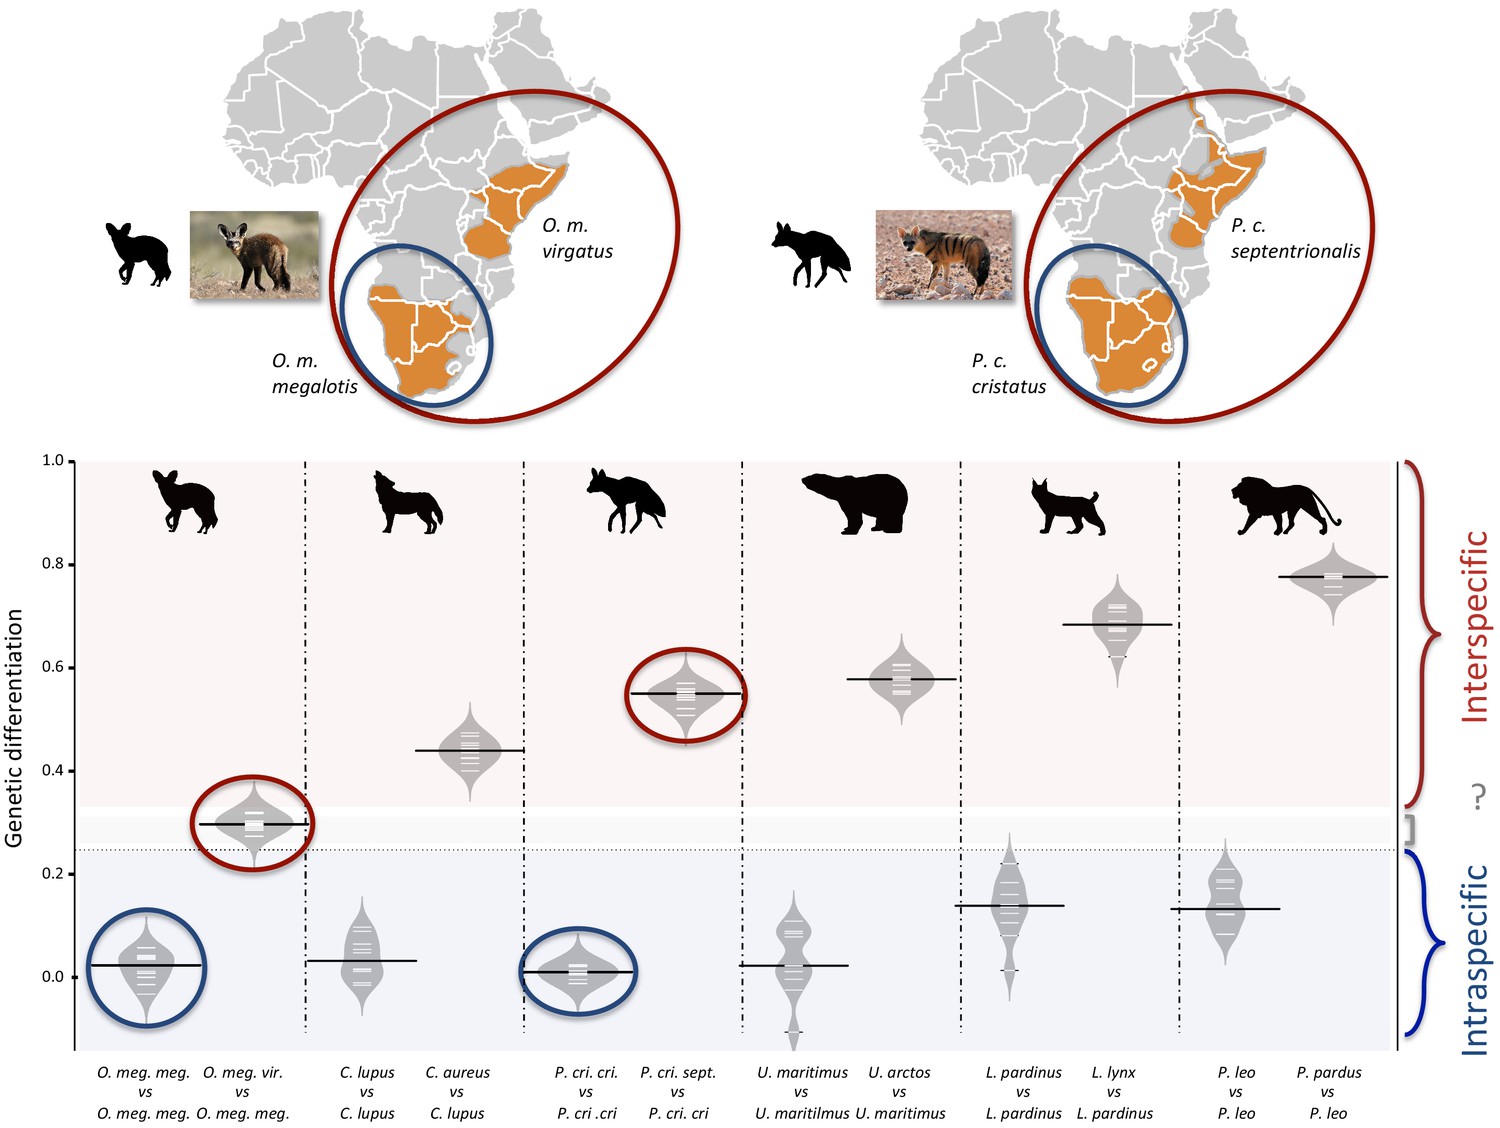
Figure 3 with 2 supplements
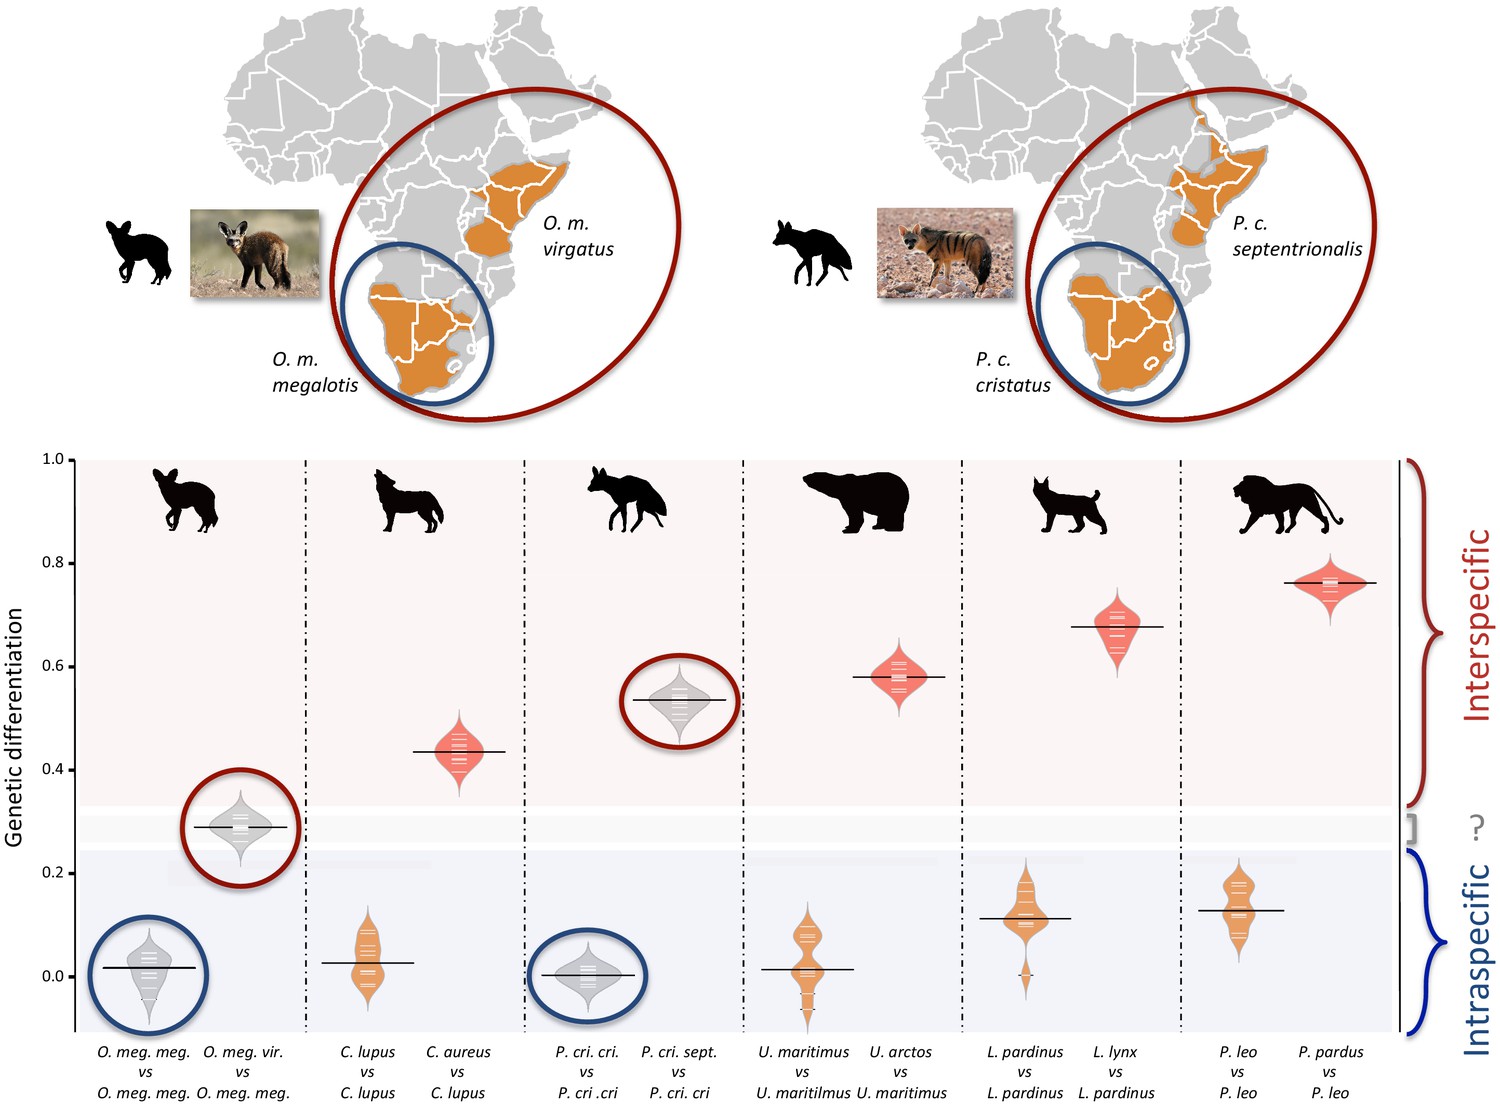
Genetic differentiation indexes obtained from a comparison of intraspecific (orange values) and interspecific (red values) polymorphisms in four pairs of well-defined.
Carnivora species and for the subspecies of aardwolf (Proteles cristatus) and bat-eared fox (Otocyon megalotis) (gray values). Silhouettes from http://phylopic.org/.
Figure 3—figure supplement 1
Genetic differentiation indexes obtained from a comparison of intraspecific and interspecific polymorphisms after having homogenized the depth-of-coverage in all species (at about 15x).
The estimates were calculated for four pairs of well-defined Carnivora species and for the subspecies of aardwolf (Proteles cristatus) and bat-eared fox (Otocyon megalotis). Silhouettes from http://phylopic.org/.
Figure 3—figure supplement 2
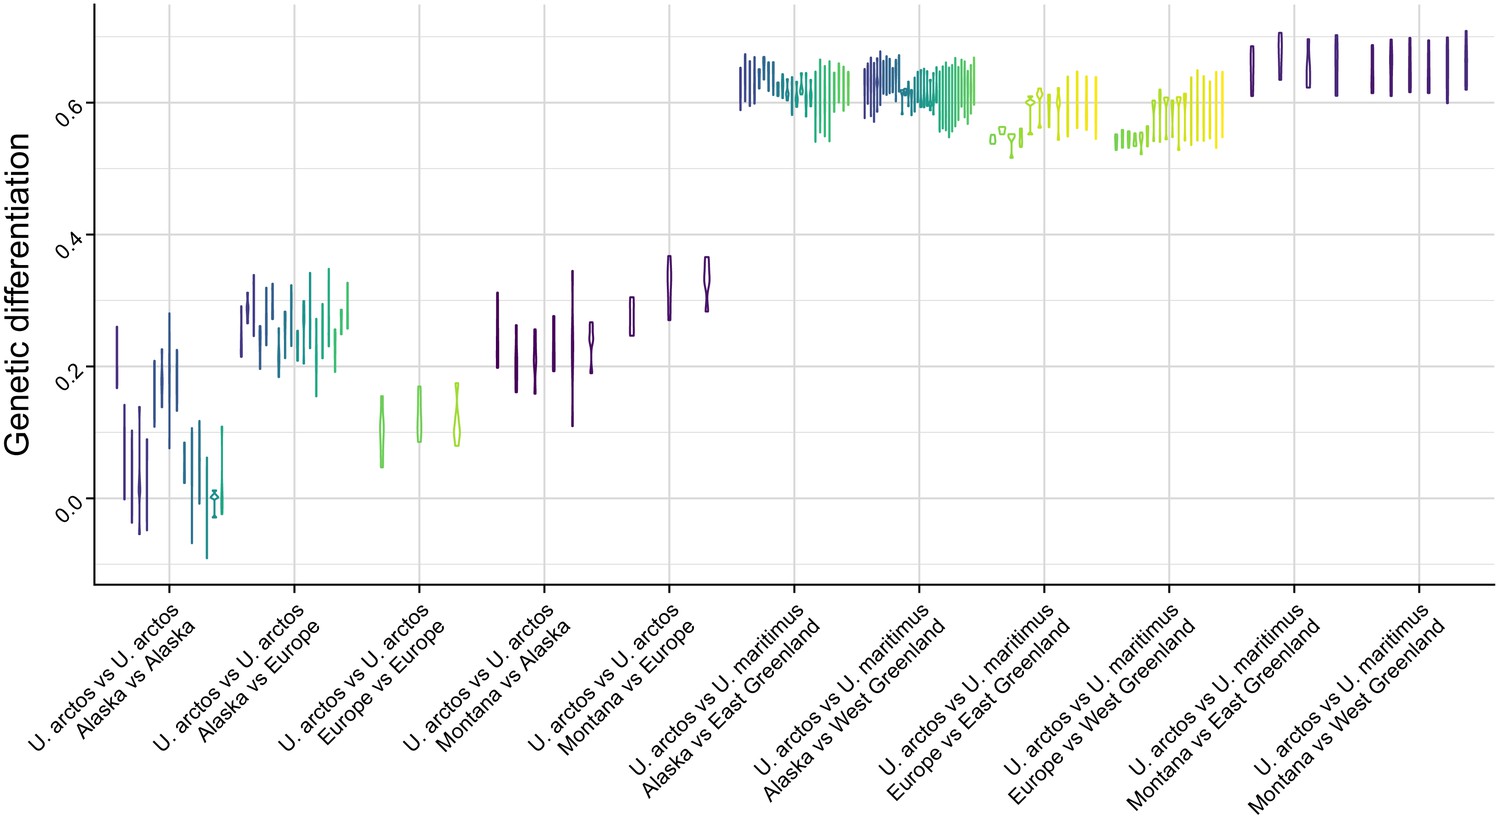
Genetic differentiation indexes obtained from the comparison of intraspecific and interspecific polymorphisms for the pair Ursus arctos/Ursus maritimus (~10 replicates per species).
GDI is estimated for each pair of individuals. Each vertical bar represents the variance in GDI obtained (from 10 replicates x 10 regions of 100 kb) by comparing one pair of individuals. This result demonstrates that randomly picking only three individuals (out of 10) is sufficient to accurately estimate the level of genetic differentiation between the two species.
Figure 4
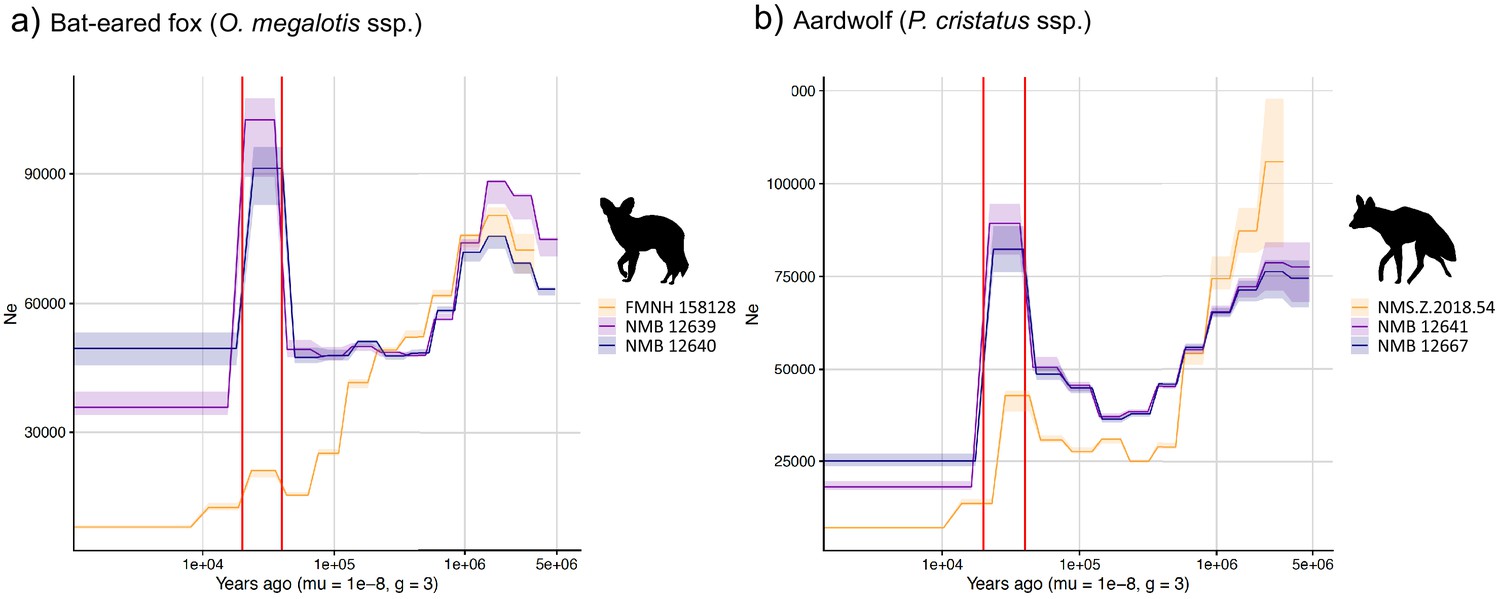
PSMC estimates of changes in effective population size over time for the Eastern (orange) and Southern (blue and purple) populations of (a) bat-eared fox and (b) aardwolf.
mu = mutation rate of 10−8 mutations per site per generation and g = generation time of 2 years. Vertical red lines indicate 20 kyrs and 40 kyrs. Silhouettes from http://phylopic.org/.
Figure 5
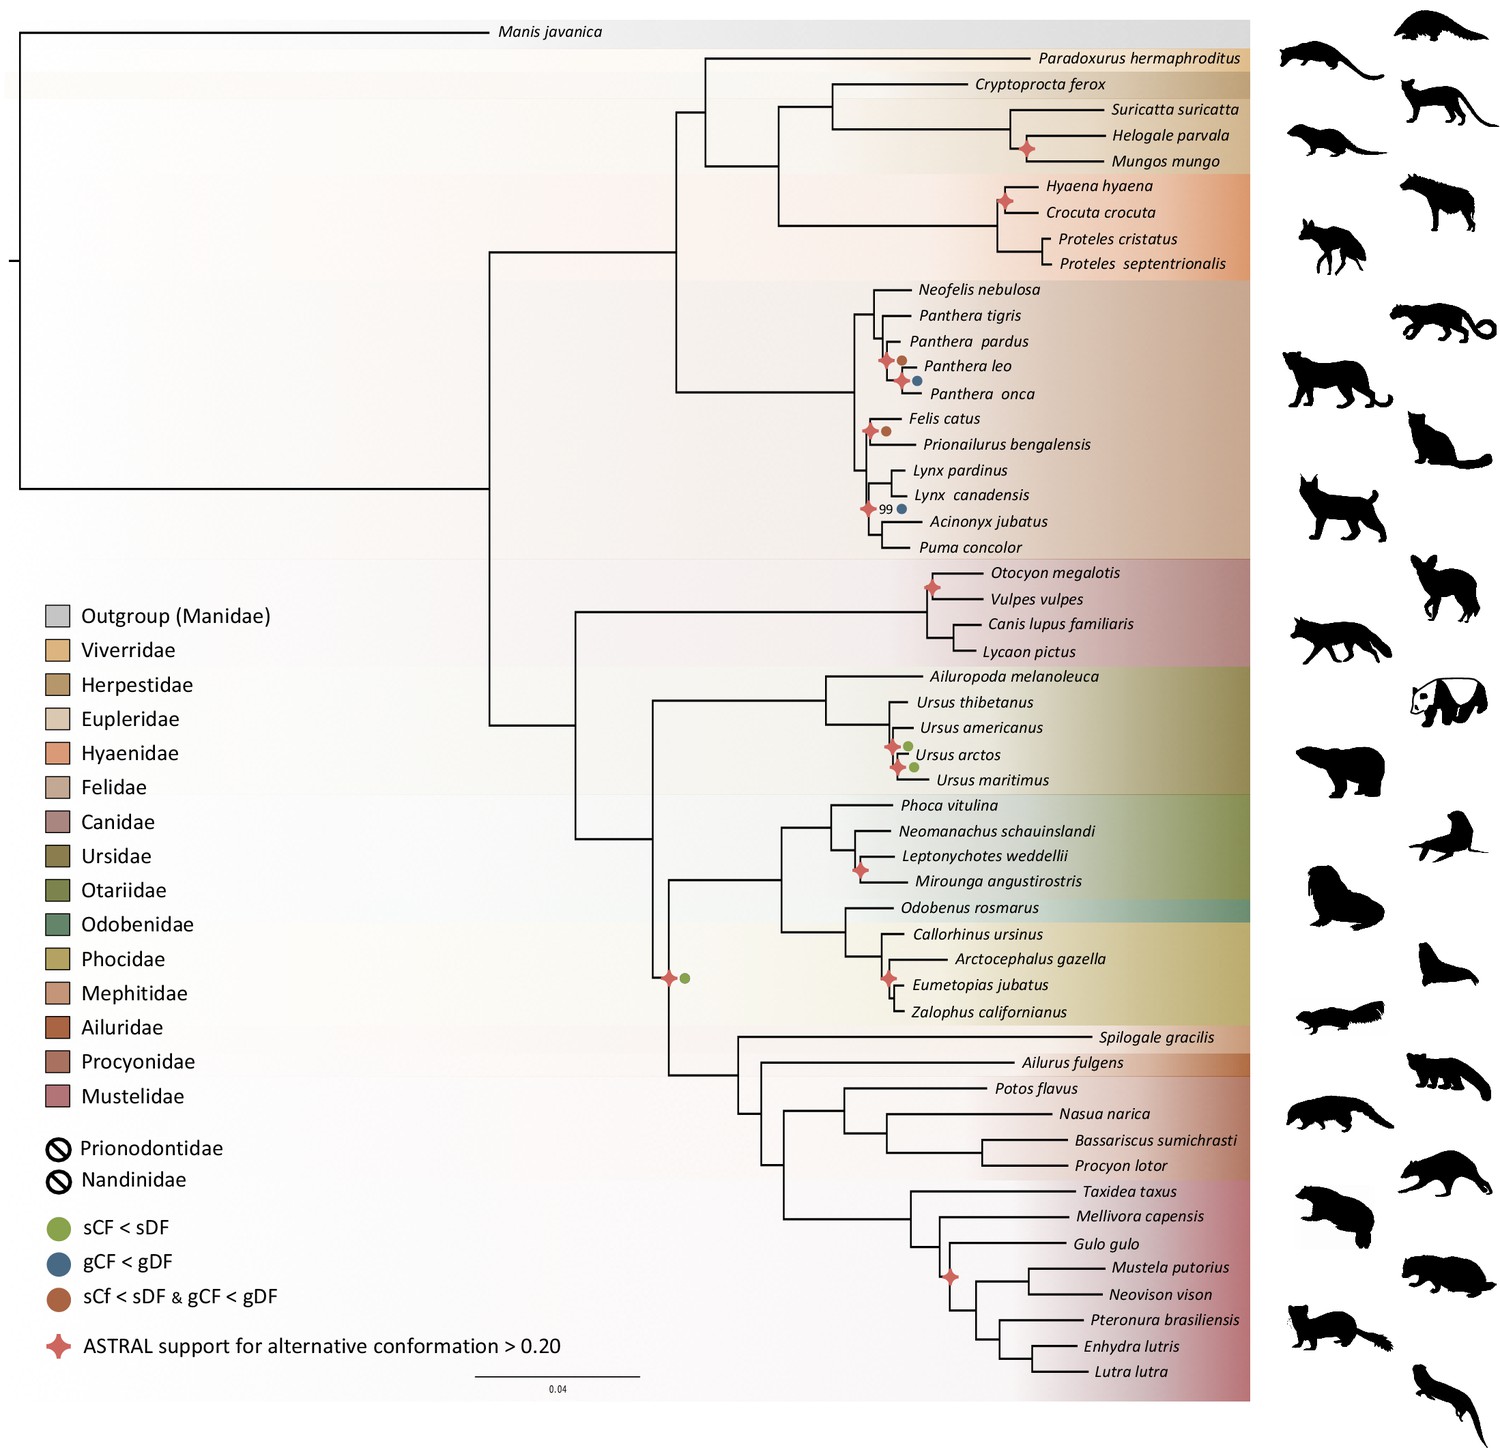
Phylogenomic tree reconstructed from the nucleotide supermatrix composed of 14,307 single-copy orthologous genes for 52 species of Carnivora plus one outgroup (Manis javanica).
The family names in the legend are ordered as in the phylogeny. Silhouettes from http://phylopic.org/.
Figure 6
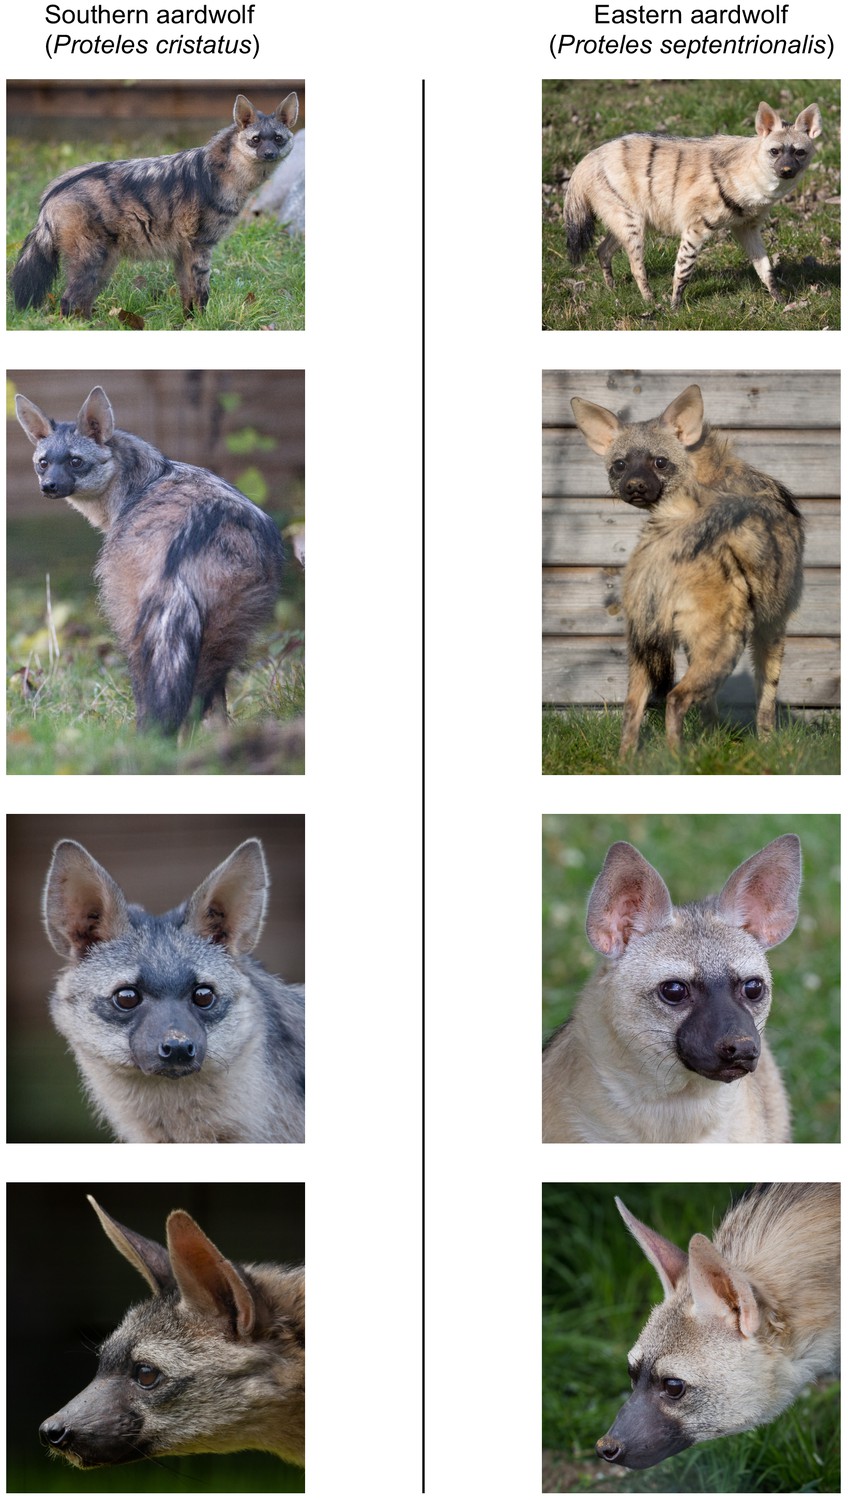
Phenotypic comparisons, highlighting the differences in fur coloration and stripe pattern, between captive individuals of Eastern (P. septentrionalis) and Southern (P. cristatus) aardwolves held at Hamerton Zoo Park (UK).
All pictures copyright and used with permission from Rob Cadd.
Appendix 1—figure 1
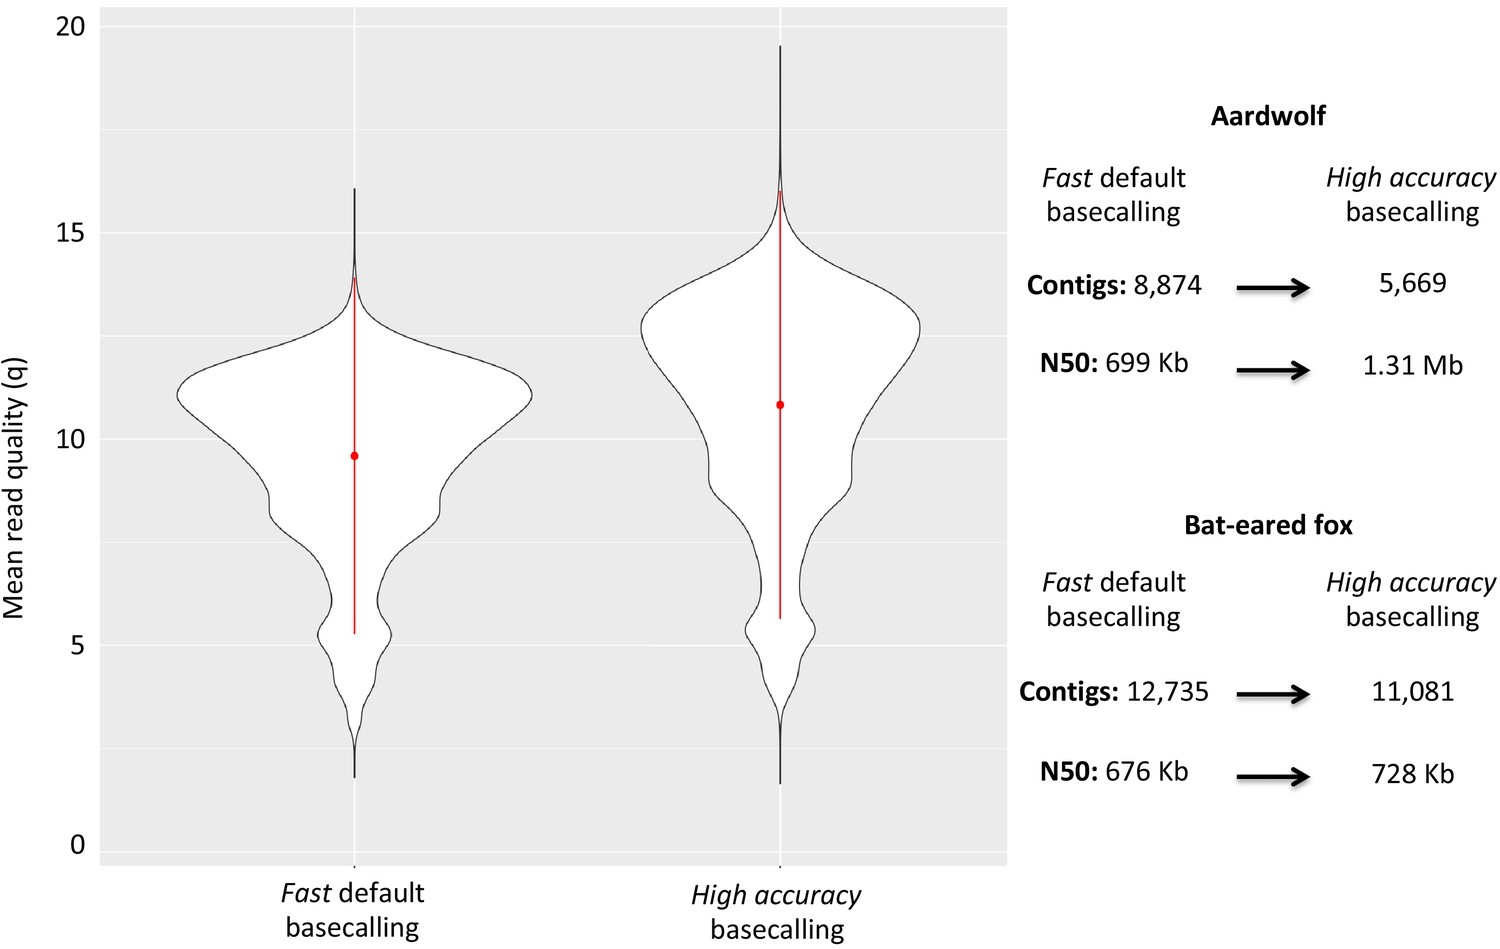
Plot of the quality of Nanopore long reads base-called with either the fast or the high accuracy option of Guppy v3.1.5.
The quality of the base-calling step has a large impact on the final quality of the assemblies by reducing the number of contigs and increasing the N50 value.
Appendix 1—figure 2
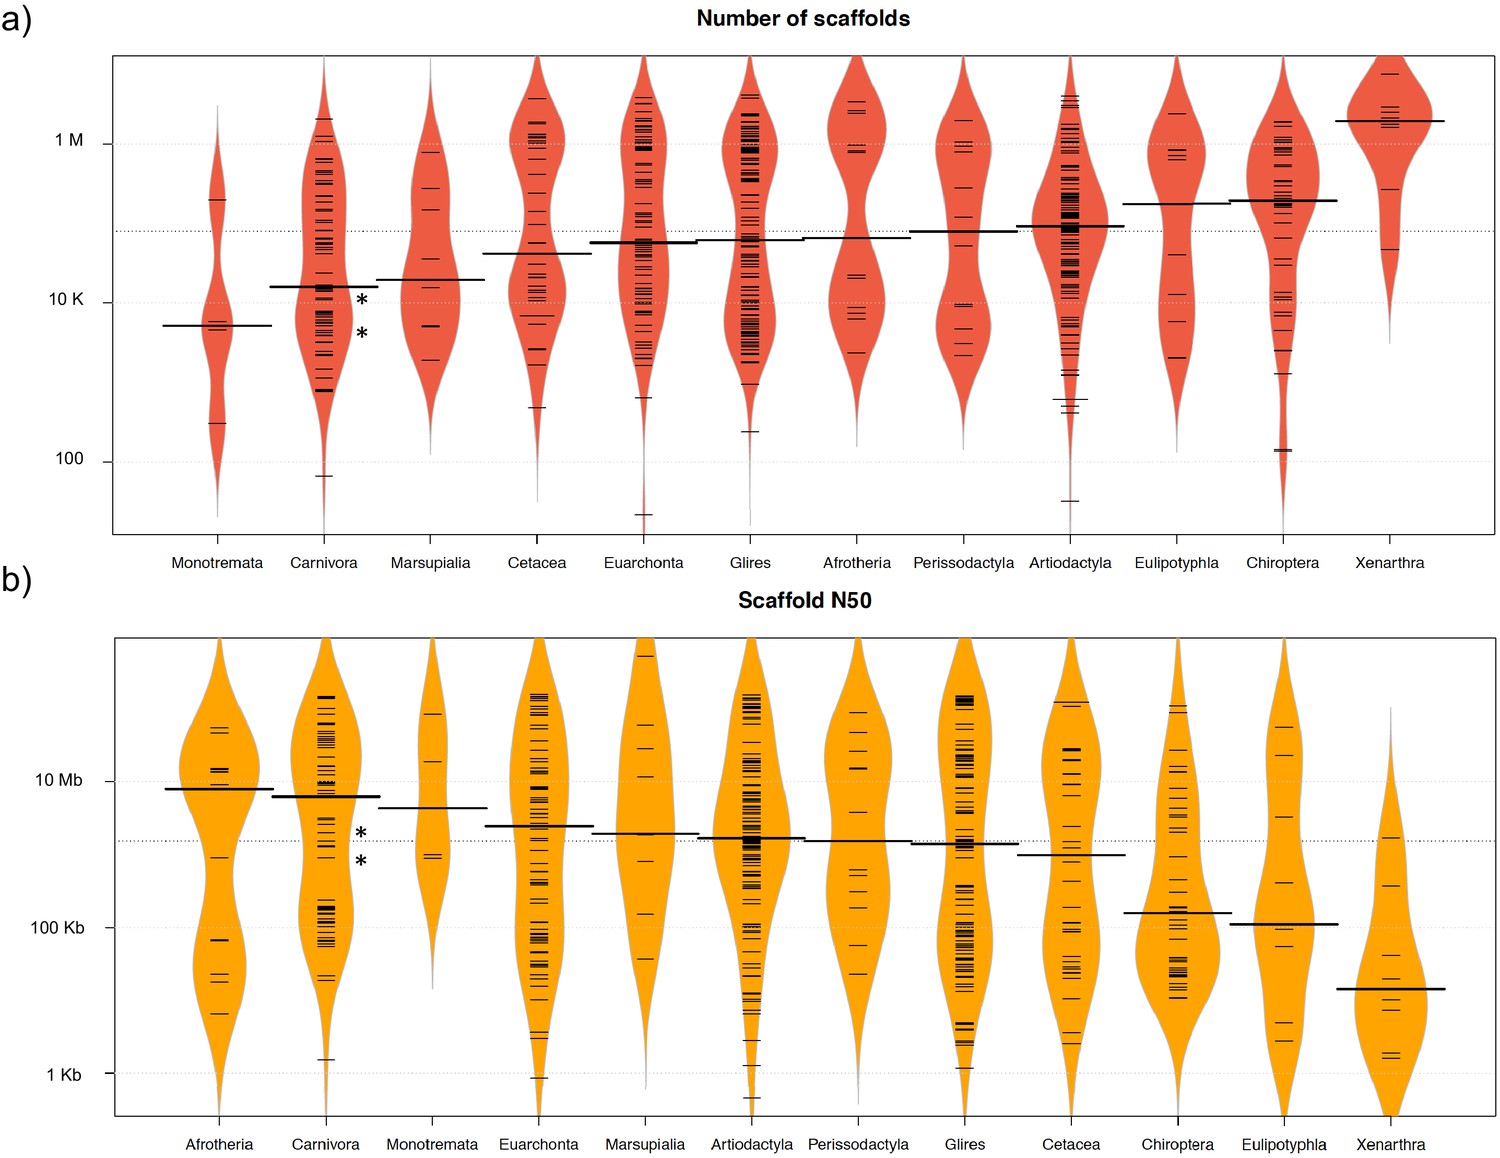
Comparison of 503 mammalian genome assemblies from 12 taxonomic groups using bean plots of the (a) number of scaffolds, and (b) scaffold N50 values ranked by median values.
Thick black lines show the medians, dashed black lines represent individual data points, and polygons represent the estimated density of the data. Note the log scale on the Y axes. The bat-eared fox (Otocyon megalotis megalotis) and aardwolf (Proteles cristatus cristatus) assemblies produced in this study using SOAPdenovo and MaSuRCA are indicated by asterisks. Bean plots were computed using BoxPlotR (Spitzer et al., 2014).
Appendix 1—figure 3
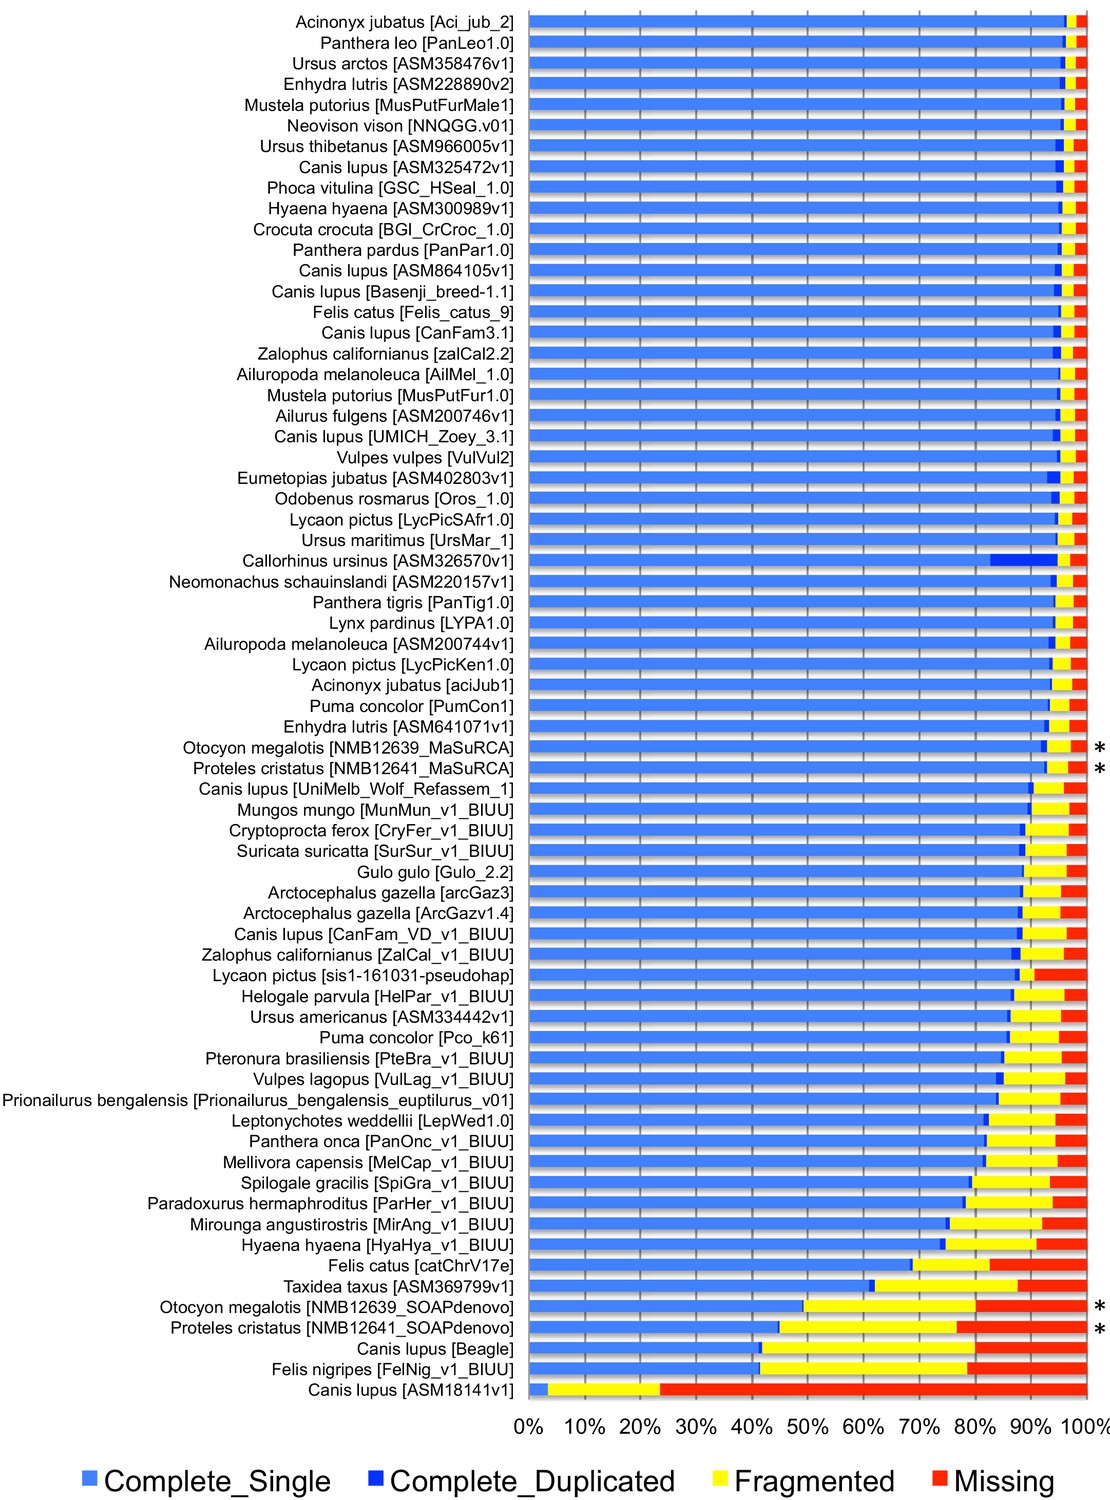
BUSCO completeness assessment of 67 Carnivora genome assemblies visualized as bar charts representing percentages of complete single-copy (light blue), complete duplicated (dark blue), fragmented (yellow), and missing (red) genes ordered by increasing percentage of total complete genes.
The bat-eared fox (Otocyon megalotis megalotis) and aardwolf (Proteles cristatus cristatus) assemblies produced in this study using MaSuRCA and SOAPdenovo are indicated by asterisks.
Appendix 2—figure 1
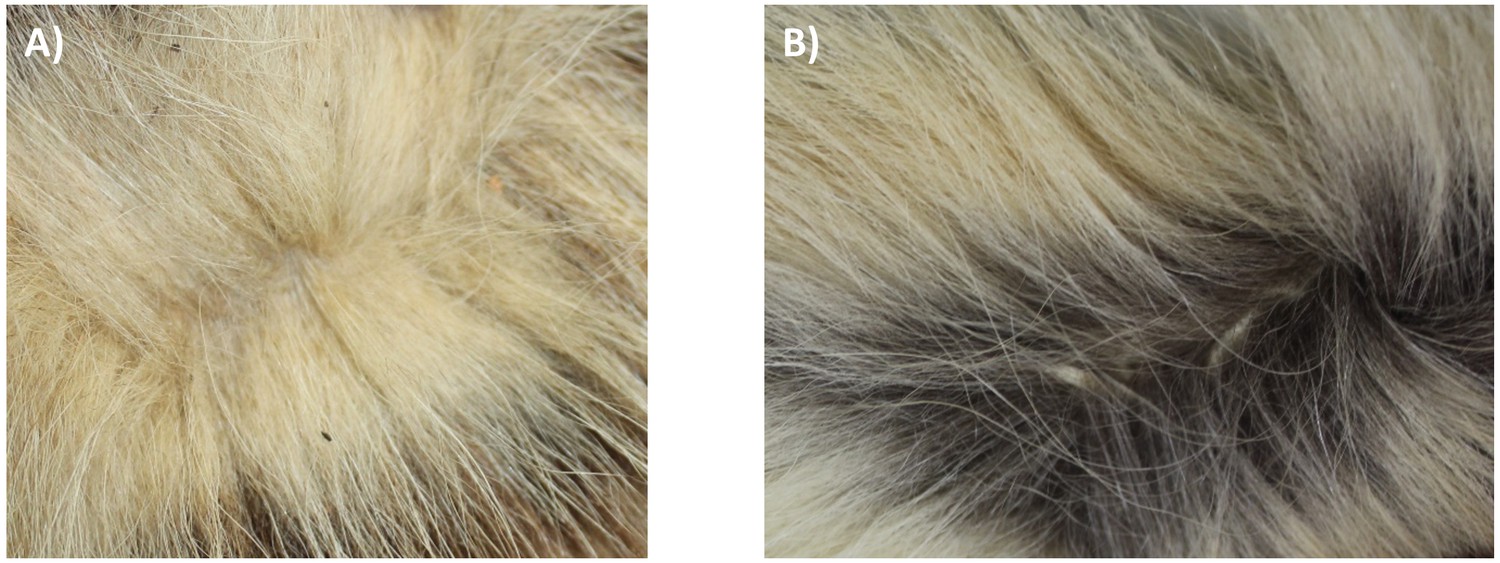
Unicolored fur of an Eastern aardwolf from Ethiopia (NMS.Z.1877.15.5) (A) and bicolored fur of a Southern aardwolf of South African origin (NMS.Z.2020.44) (B).
Appendix 2—figure 2

Box and jitter plot of (A) post-orbital breadths of Proteles taxa: cristatus (left) and septentrionalis (right) and (B) condylobasal lengths of skull of Proteles taxa: cristatus (left) and septentrionalis (right).
Graph generated with BoxPlotR (http://shiny.chemgrid.org/boxplotr/).
Appendix 3—figure 1

Definition of the genetic differentiation index (GDI) based on the F-statistic (FST).
The main difference between these two indexes is the use of heterozygous allele states for GDI rather than real polymorphism for the FST. Green = πwithin, Orange = πbetween, Blue = Population A, Red = Population A+B.
Appendix 4—figure 1
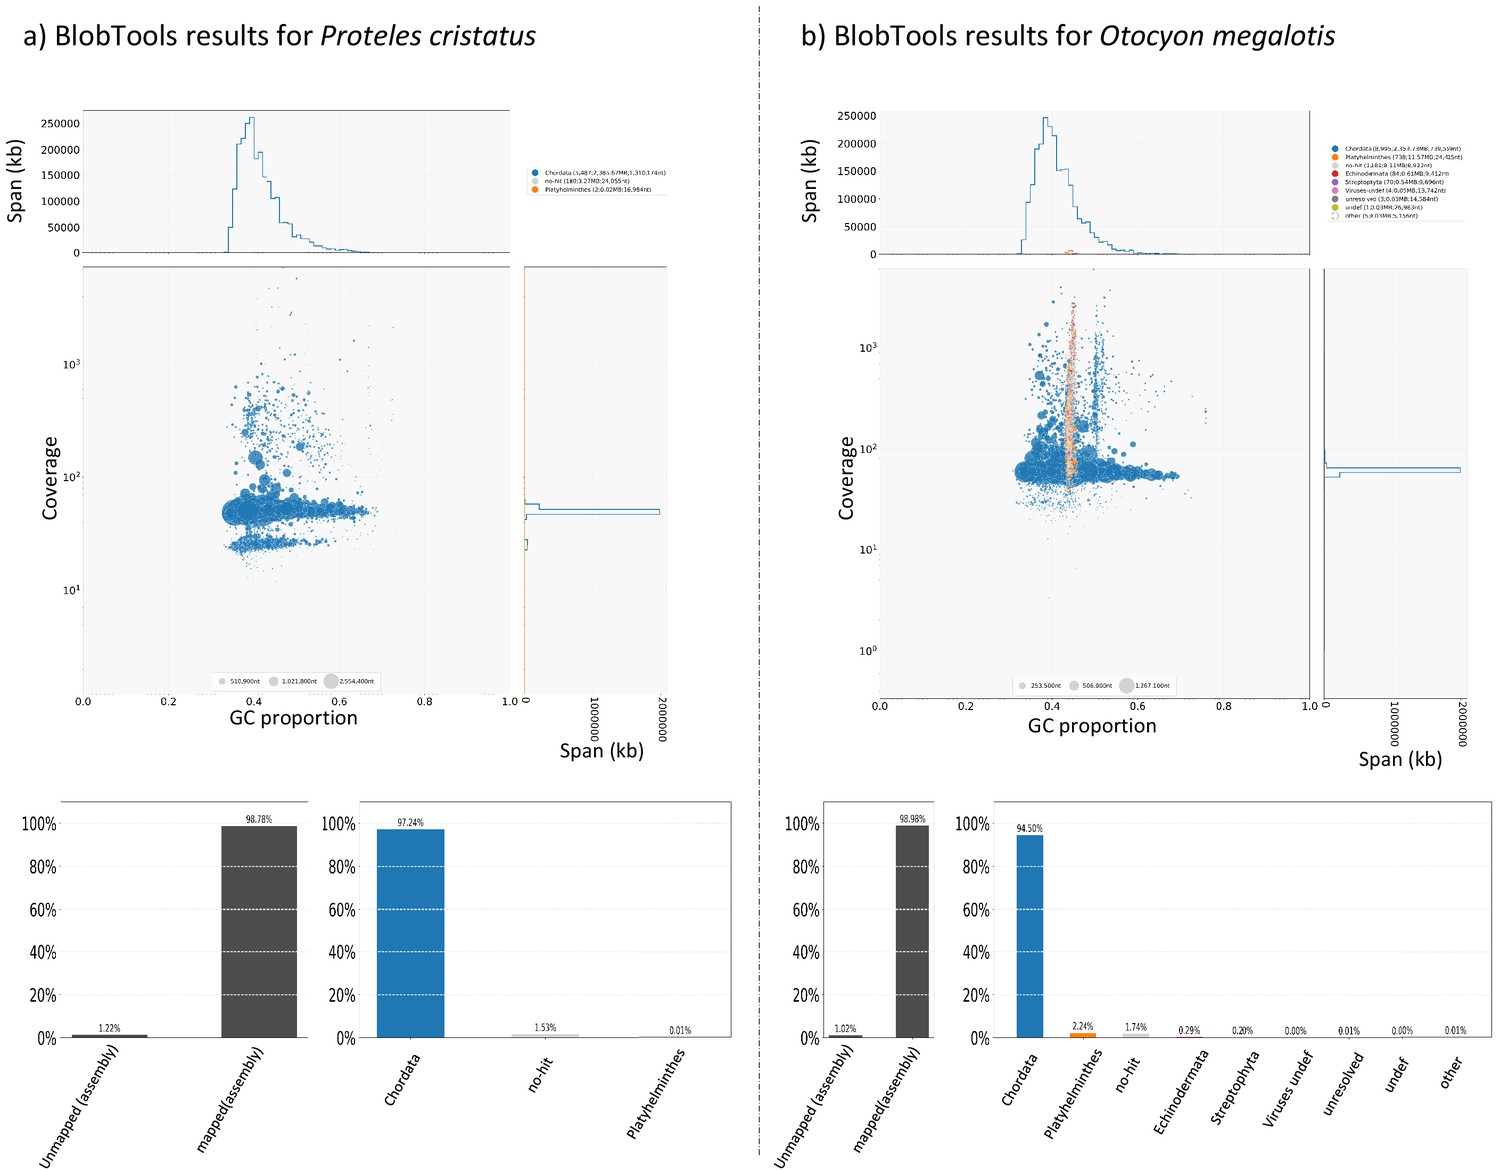
Graphical representation (BlobPlot) of the results of contamination analyses performed with BlobTools for (a) the aardwolf (Proteles cristatus cristatus) and (b) the bat-eared fox (Otocyon megalotis megalotis) genome assemblies.
Tables
Table 1
Summary of sequencing and assembly statistics of the genomes generated in this study.
| Individuals | Illumina | Oxford Nanopore Sequencing | Assembly statistics | ||||||||||||||
|---|---|---|---|---|---|---|---|---|---|---|---|---|---|---|---|---|---|
| Species | Subspecies | Voucher | Raw reads (M) | Cleaned reads (M) | Nbr of gigabases | Estimated coverage | Nbr of flowcells | Nbr of bases (Gb) | N50 | Average size | Estimated coverage | Genome size (Gb) | Nbr of scaff. | N50 (kb) | Busco score | OMM genes | Missing data (%) |
| Proteles cristatus | cristatus | NMB 12641 | 716.7 | 522.8 | 129.50 | 51.8 | 16 | 27.3 | 9,175 | 5,555 | 10.9 | 2.39 | 5,669 | 1.309 | 92.8 | 12,062 | 22.43 |
| Proteles cristatus | cristatus | NMB 12667 | 663.8 | 526.1 | 140.73 | 56.3 | NA | NA | NA | ||||||||
| Proteles cristatus | septentrionalis | NMS.Z.2018.54 | 750.9 | 516.2 | 132.44 | 53.0 | 12,050 | 22.96 | |||||||||
| Otocyon megalotis | megalotis | NMB 12639 | 710.2 | 584.4 | 154.81 | 61.6 | 13 | 33 | 4,393 | 3,092 | 13.2 | 2.75 | 11,081 | 728 | 92.9 | 11,981 | 22.02 |
| Otocyon megalotis | megalotis | NMB 12640 | 861.2 | 820 | 240.71 | 96.3 | NA | NA | |||||||||
| Otocyon megalotis | virgatus | FMNH 158128 | 661.7 | 554.1 | 100.30 | 40.1 | |||||||||||
Additional files
-
Supplementary file 1
Pairwise patristic distances estimated for the 142 species based on branch lengths of the phylogenetic tree inferred with the 15 mitochondrial loci (2 rRNAs and 13 protein-coding genes).
- https://cdn.elifesciences.org/articles/63167/elife-63167-supp1-v3.xlsx
-
Supplementary file 2
Results of Bayesian dating for the two nodes leading to the Proteles cristatus sspp. and the Otocyon megalotis sspp.
Divergence time estimates based on UGAM and LN models are reported with associated 95% credibility intervals for each MCMC chain.
- https://cdn.elifesciences.org/articles/63167/elife-63167-supp2-v3.xlsx
-
Supplementary file 3
Sample details and assembly statistics.
(Number of contigs/scaffolds and associated N50 values) for the 503 mammalian assemblies retrieved from NCBI (https://www.ncbi.nlm.nih.gov/assembly) on August 13th, 2019 with filters: ‘Exclude derived from surveillance project’, ‘Exclude anomalous’, ‘Exclude partial’, and using only the RefSeq assembly for Homo sapiens.
- https://cdn.elifesciences.org/articles/63167/elife-63167-supp3-v3.xlsx
-
Supplementary file 4
Genome completeness assessment of MaSuRCA and SOAPdenovo assemblies obtained for Proteles cristatus cristatus and Otocyon megalotis megalotis together with the 63 carnivoran assemblies available at NCBI on August 13th, 2019 using Benchmarking Universal Single-Copy Orthologs (BUSCO) v3 with the Mammalia OrthoDB 9 BUSCO gene set.
- https://cdn.elifesciences.org/articles/63167/elife-63167-supp4-v3.xlsx
-
Supplementary file 5
Annotation summary and supermatrix composition statistics of the 53 species used to infer the genome-scale Carnivora phylogeny.
- https://cdn.elifesciences.org/articles/63167/elife-63167-supp5-v3.xlsx
-
Supplementary file 6
Statistics on morphological mearsures of the current subspecies of Proteles cristatus.
- https://cdn.elifesciences.org/articles/63167/elife-63167-supp6-v3.xlsx
-
Supplementary file 7
Skull measurements of Proteles taxa from museum specimens and the literature (Allen et al., 1909; Heller, 1913; Hollister, 1924; Roberts, 1932; Roberts, 1951).
- https://cdn.elifesciences.org/articles/63167/elife-63167-supp7-v3.docx
-
Supplementary file 8
Sample details and assembly statistics of the 13 newly assembled carnivoran mitochondrial genomes.
- https://cdn.elifesciences.org/articles/63167/elife-63167-supp8-v3.docx
-
Supplementary file 9
Node calibrations used for the Bayesian dating inferences based on mitogenomic data.
- https://cdn.elifesciences.org/articles/63167/elife-63167-supp9-v3.xlsx
-
Supplementary file 10
Results of contamination analyses performed with BlobTools for the aardwolf (Proteles cristatus cristatus).
- https://cdn.elifesciences.org/articles/63167/elife-63167-supp10-v3.xlsx
-
Supplementary file 11
Results of contamination analyses performed with BlobTools for the bat-eared fox (Otocyon megalotis megalotis).
- https://cdn.elifesciences.org/articles/63167/elife-63167-supp11-v3.xlsx
-
Supplementary file 12
Summary information for the Carnivora genomes available either on GenBank, DNA Zoo and the OrthoMaM database as of February 11th, 2020.
The ‘OMM’ column indicates if the genome was available on OMM (yes) or not (no). The ‘Annotation’ column indicates whether the genome was already annotated (yes) or not (no).
- https://cdn.elifesciences.org/articles/63167/elife-63167-supp12-v3.xlsx
-
Transparent reporting form
- https://cdn.elifesciences.org/articles/63167/elife-63167-transrepform-v3.docx
Download links
A two-part list of links to download the article, or parts of the article, in various formats.
Downloads (link to download the article as PDF)
Open citations (links to open the citations from this article in various online reference manager services)
Cite this article (links to download the citations from this article in formats compatible with various reference manager tools)
High-quality carnivoran genomes from roadkill samples enable comparative species delineation in aardwolf and bat-eared fox
eLife 10:e63167.
https://doi.org/10.7554/eLife.63167


