Mixed cytomegalovirus genotypes in HIV-positive mothers show compartmentalization and distinct patterns of transmission to infants
- Division of Infection and Immunity, University College London, Cruciform Building, United Kingdom
- Departments of Global Health and Epidemiology, University of Washington, United States
- Institute of Immunology and Transplantation, Division of Infection and Immunity, University College London, United Kingdom
- Departments of Global Health, Epidemiology, Medicine (Div. Allergy and Infectious Diseases), University of Washington, United States
- University of Nairobi, Department of Obstetrics and Gynaecology, World Health Organization, Kenya
- Research Centre of the Sainte-Justine University Hospital, Department of Microbiology, Infectious Diseases and Immunology, University of Montréal QC, Canada
- Department of Infection, Immunity and Inflammation, UCL Great Ormond Street Institute of Child Health, University College London, United Kingdom
Figures
Figure 1 with 1 supplement
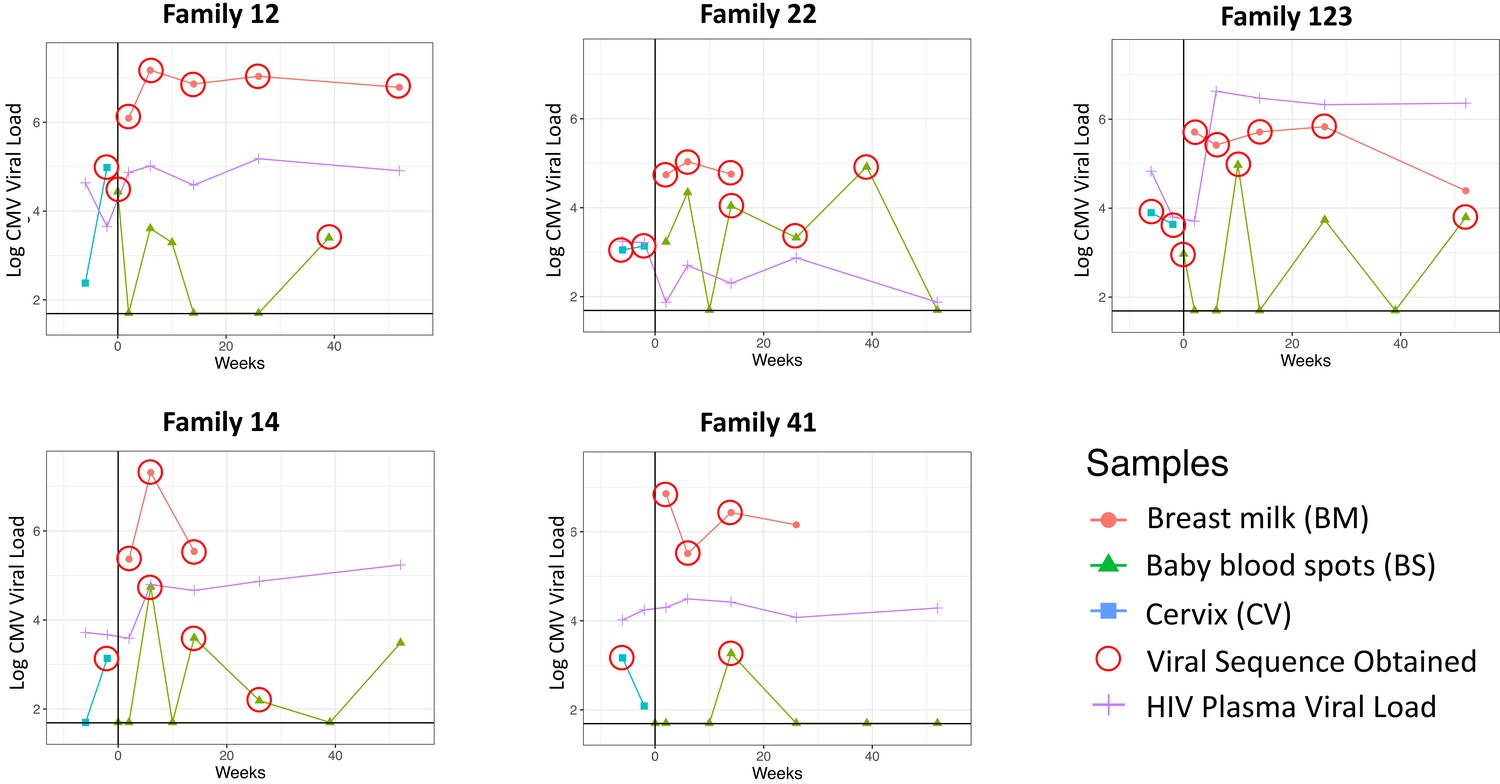
Cytomegalovirus (CMV) viral loads of longitudinal samples for each family from breast milk (red), baby blood spots (green), and cervix (blue), and HIV viral loads from mother’s blood plasma.
Vertical line indicates date of delivery. Horizontal line indicates minimum threshold of detection. Red circles indicate the samples that were submitted for whole-genome sequencing.
Figure 1—figure supplement 1

Scatter plots showing relationship between input viral load and (A) mean read depth and (B) genome coverage, respectively.
Figure 2 with 2 supplements
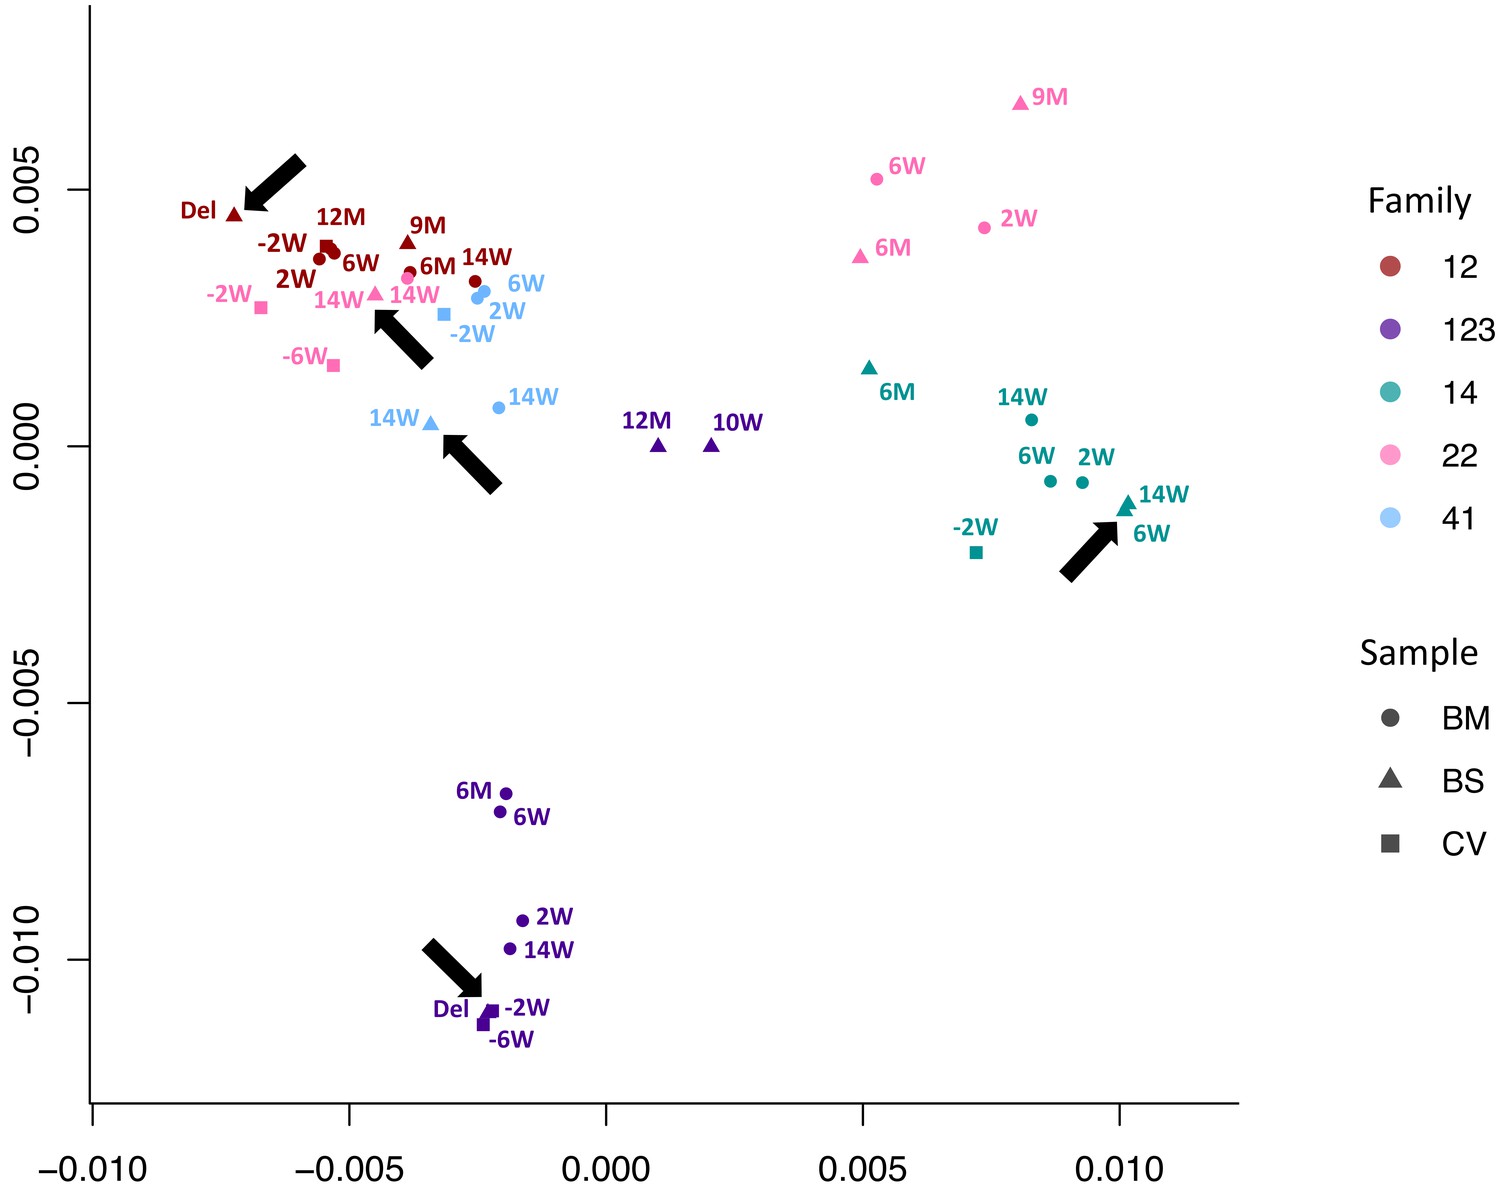
Multidimensional scaling showing clustering of consensus genome sequences for each sample by family.
Arrows indicate that the first baby blood spot clusters with their own maternal sequences in all cases.
Figure 2—figure supplement 1

Within sample nucleotide diversity shown by family (colour) and sample type (symbol).
BM, breast milk; CV, cervix; BS, baby blood spot. The figure shows that most cervical and blood spot samples are of low diversity, while most breast milk samples are of high diversity. Diversity of breast milk versus cervix; p=1.619e-07 versus baby blood spot; p=9.69e-6 (Mann–Whitney test).
Figure 2—figure supplement 2
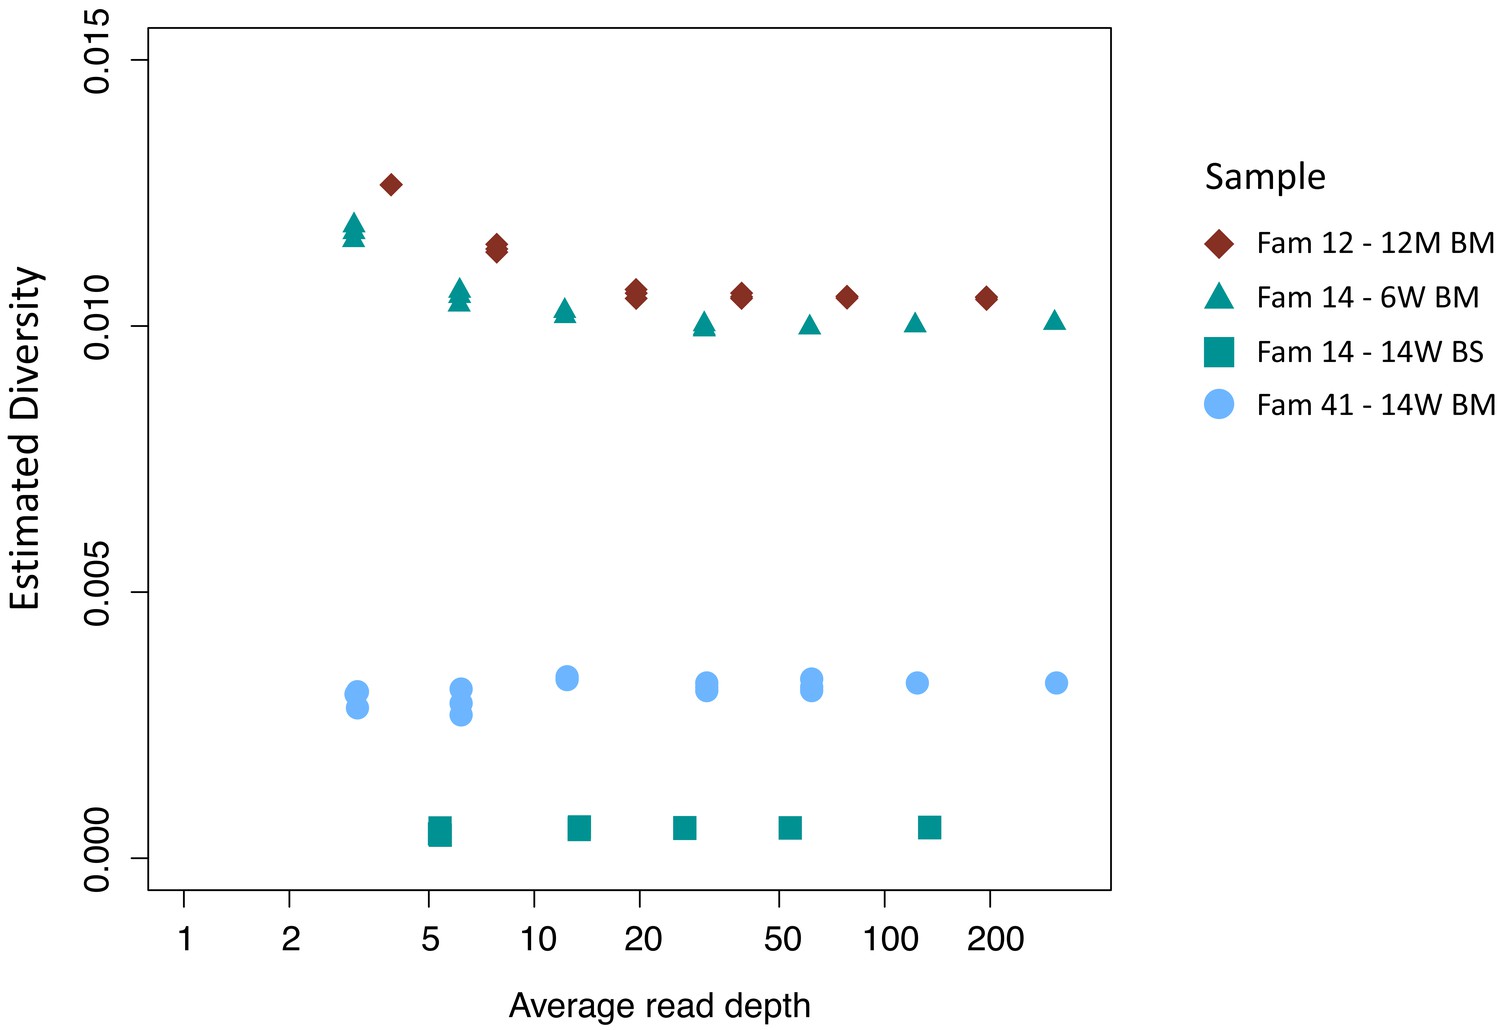
Effect of down-sampling on estimated diversity.
Samples tested include family 14: 14W BS (green squares), family 41: 14W BM (blue dots), family 14: 6W BM (green triangles), family 12: 12M BM (maroon diamonds) all of which had initial read depths of 150 or more. The estimated diversity is relatively insensitive to read depth; in particular, down-sampling of high-read-depth samples shows no tendency of the analysis to underestimate the diversity of low-read-depth samples. This indicates that the low diversity observed in many of the CV and BS samples is not an artefact but is rather consistent with the presence of significant bottlenecks.
Figure 3 with 3 supplements

Multidimensional scaling showing clustering of haplotype sequences by family.
Colours indicate the families; shapes indicate the types of sample.
Figure 3—figure supplement 1
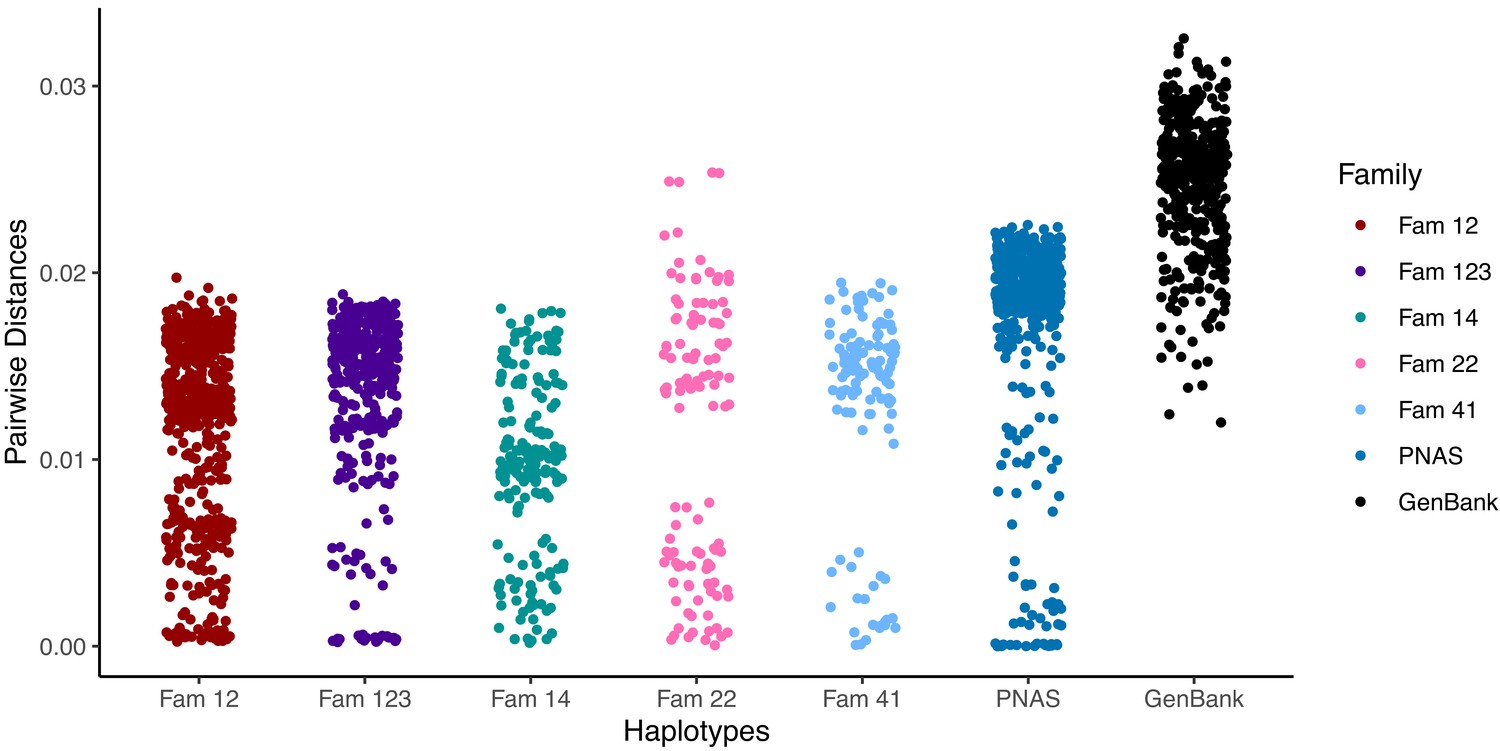
Pairwise differences between haplotypes within a family.
Distances are compared with random GenBank sequences and sequences previously analysed by the same pipeline and reported (Cudini et al., 2019). Higher values are similar to those seen between unrelated database sequences and indicate the presence of distinct strains.
Figure 3—figure supplement 2
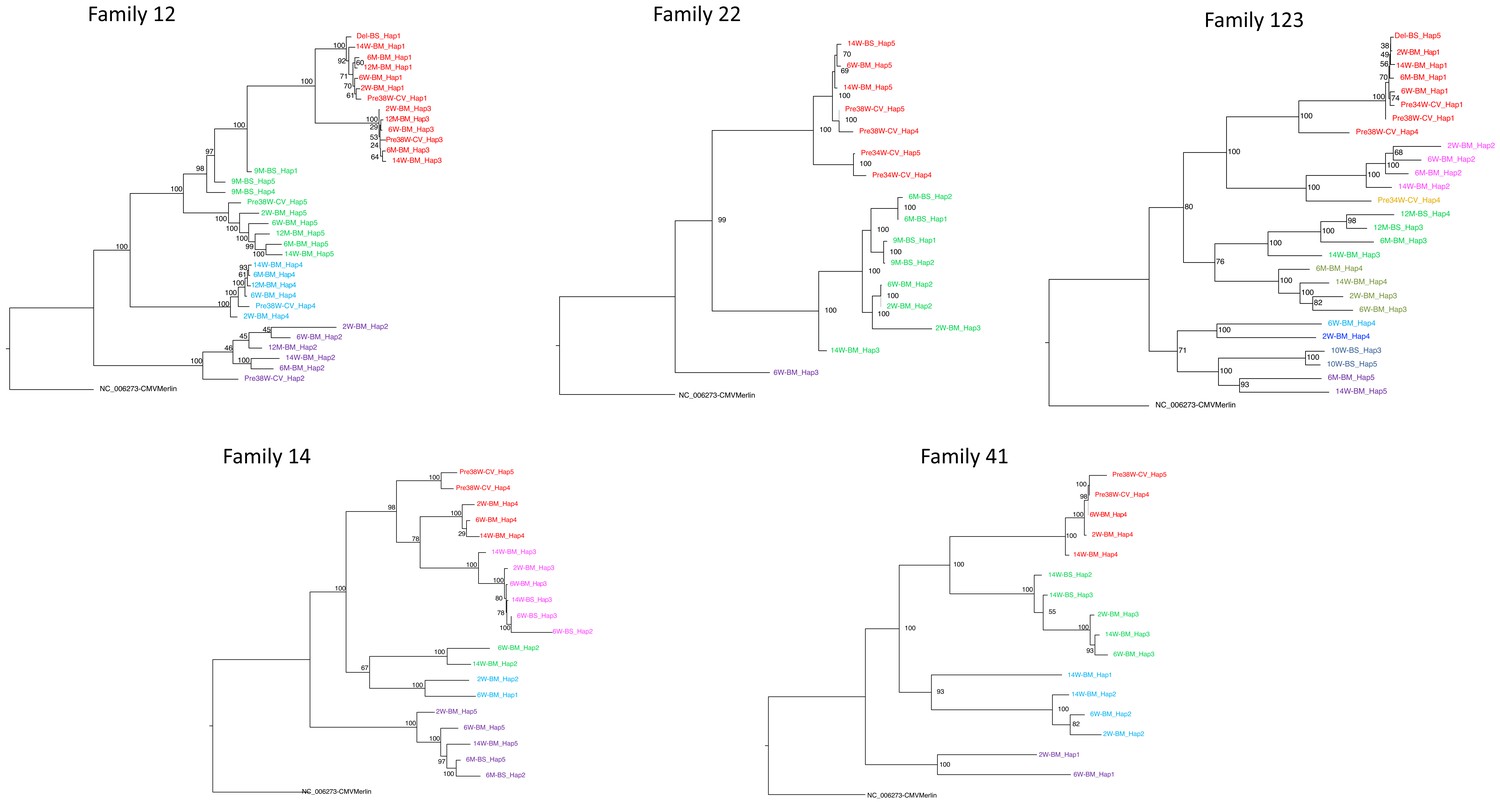
Maximum-likelihood phylogenetic tree to show haplotypes clusters (genotypes).
By convention, the genotype most prevalent in cervix was coloured red for each family. Genotypes were designated where a distinct cluster of related haplotypes (pairwise distance ≤ 0.017) occurred with a bootstrap value of 100 (see Materials and methods and Figure 3—figure supplement 3). The genotype containing the most abundant haplotype present in the cervix is coloured red for each family. Thereafter, sequences that are genetically closest to the red genotype are coloured magenta. Genotypes that are as distant from the cervical genotype as unrelated GenBank sequences are coloured shades of green, blue, and purple. The number of clusters between 18 and 34 did not affect subsequent conclusions about genetic similarity between cervical versus other strains (see Figure 5—figure supplement 2).
Figure 3—figure supplement 3
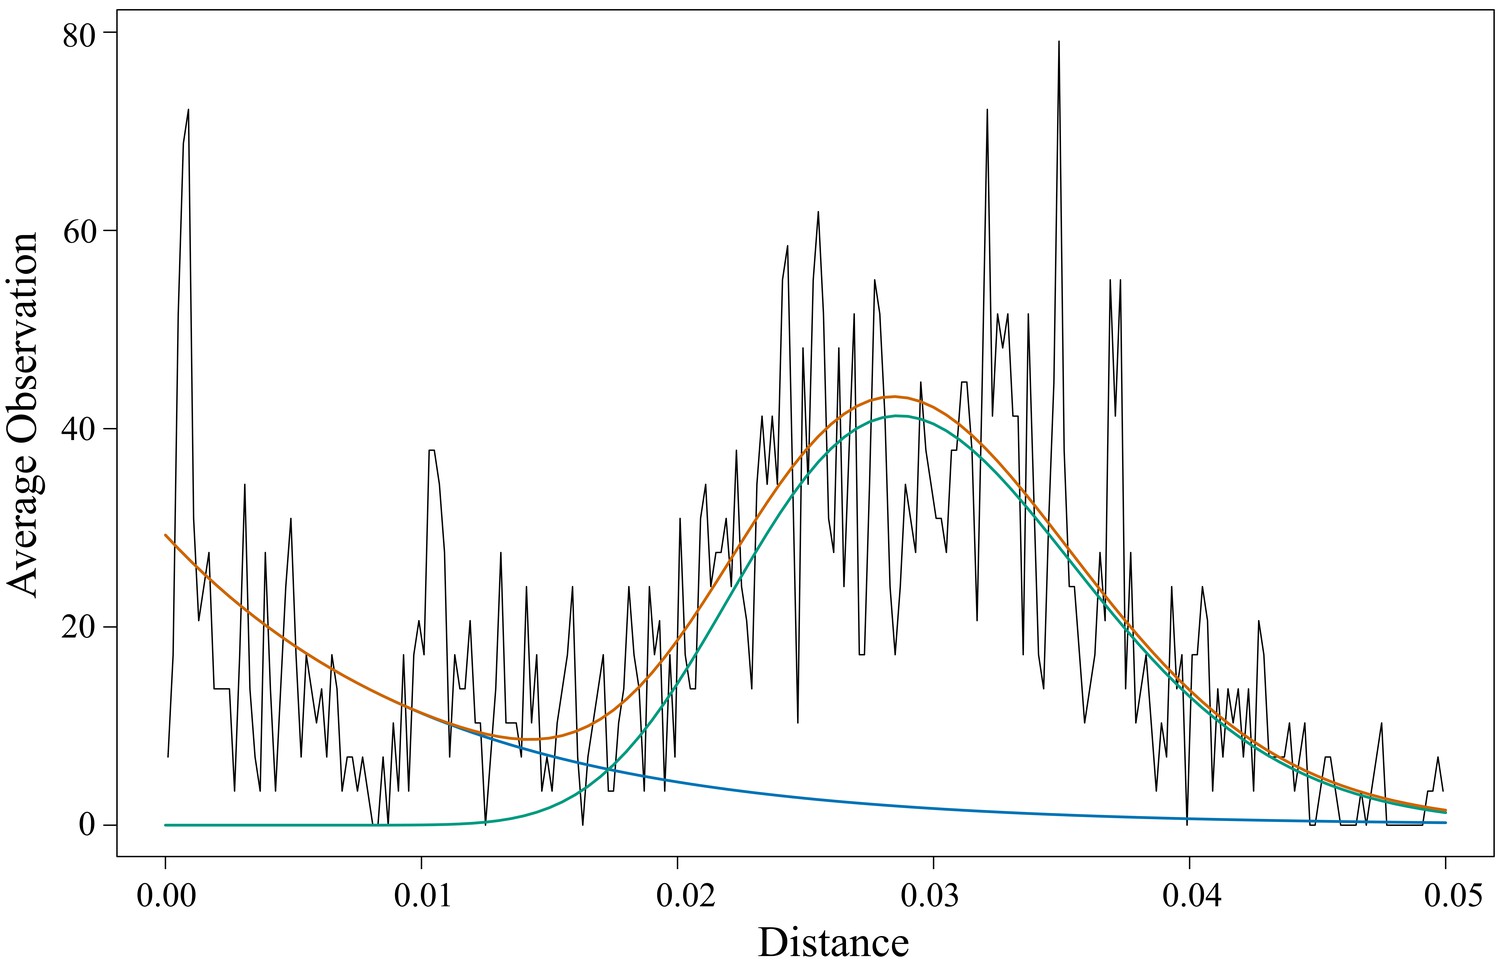
Distribution of pairwise evolutionary distances for haplotypes within families.
Black, observed distribution of pairwise evolutionary distances; green, gamma distribution; blue, exponential distribution; orange, sum of gamma distribution plus exponential distribution. The chosen cut-off distance to differentiate small variations from large differences is the crossing point of the two distributions, at 0.017.
Figure 4 with 1 supplement
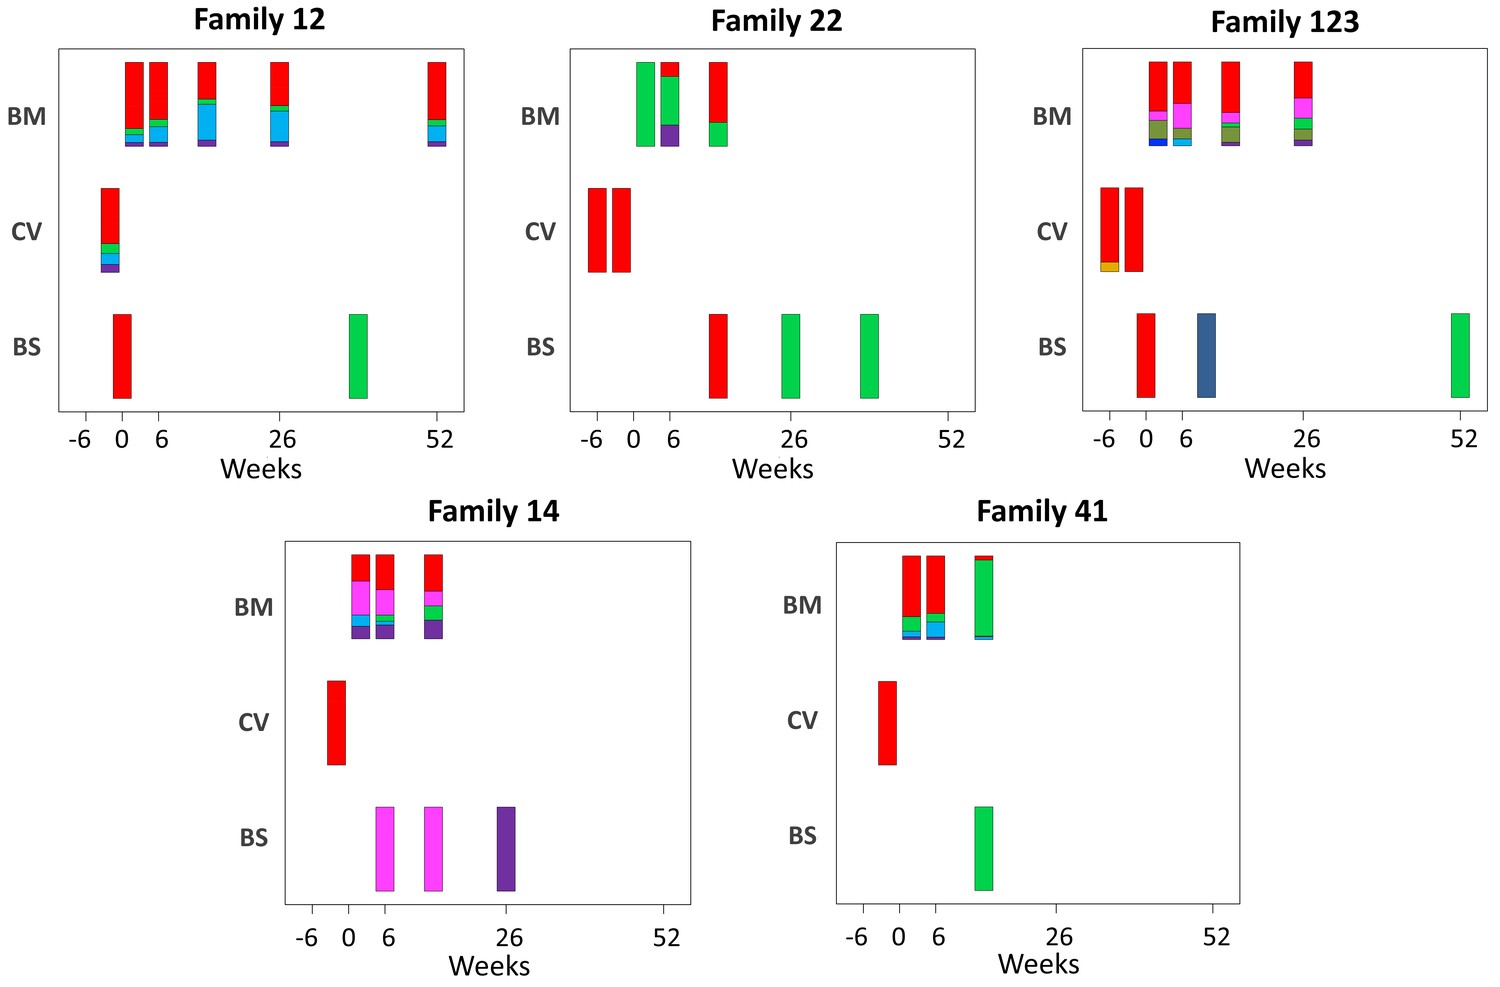
Abundance of haplotypes within each sample plotted for breast milk (BM), cervix (CV), and blood spots (BS).
The timing of sampling is shown along the x axis. For ease of reference, the genotype containing the most abundant haplotype present in the cervix is coloured red for each family. Thereafter sequences that are genetically closest to the red genotype (Figure 3—figure supplement 2) are coloured magenta. Genotypes that are as distant from the cervical genotype as unrelated GenBank sequences are coloured shades of green, blue, and purple. Single variants are coloured in shades of the nearest genotype.
Figure 4—figure supplement 1
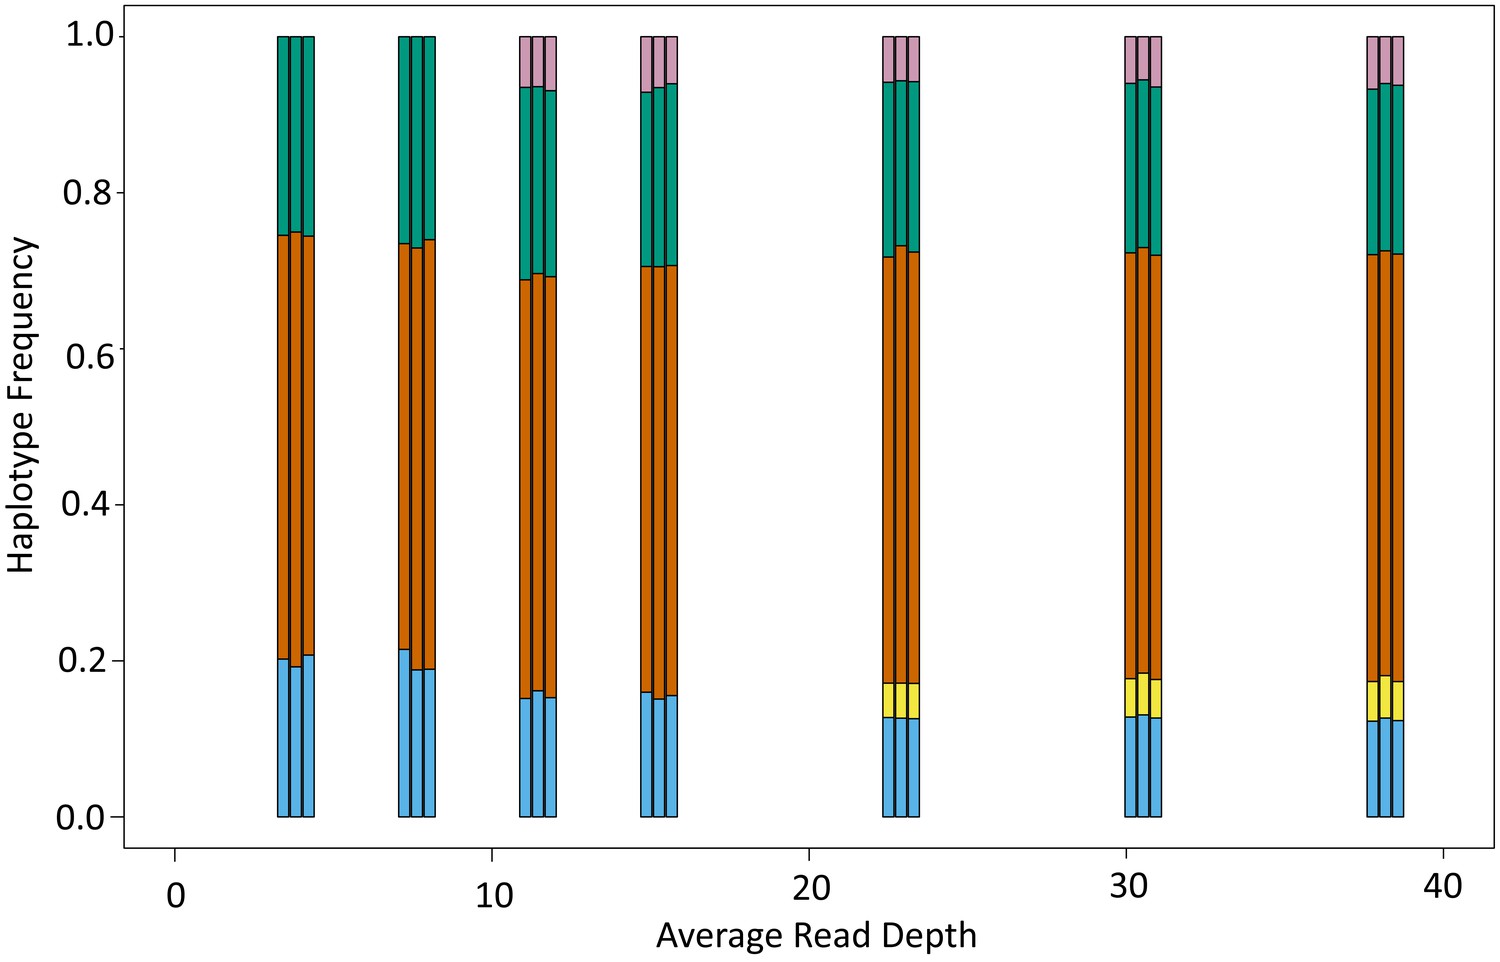
Boxplot showing number of haplotypes reconstructed in relation to read depth.
Analysis was performed on the 12 month breast milk sample from family 12.
Figure 5 with 2 supplements
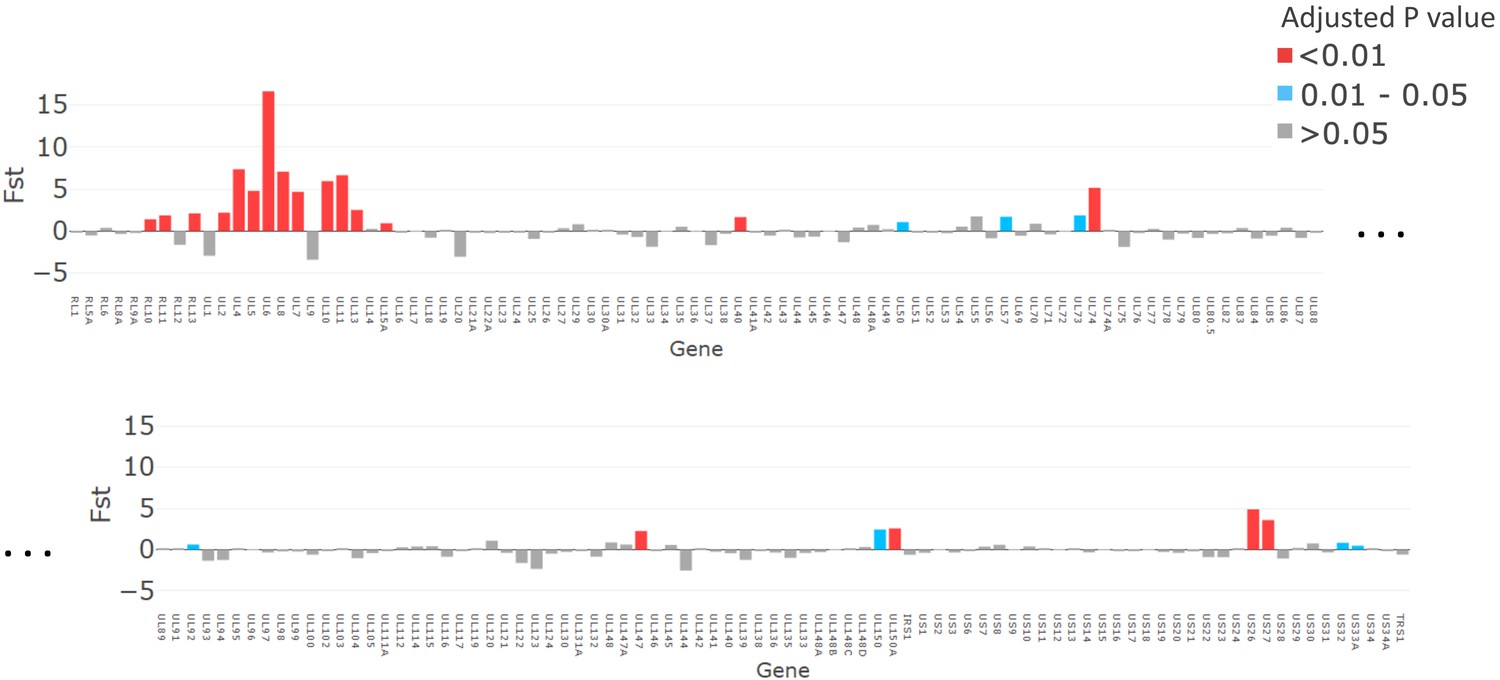
The magnitude of fixation index (FST) values plotted for each gene (x axis).
p-Values, adjusted with false discovery rate, are shown in red for p<0.01, grey for p>0.05, and turquoise for p=0.01–0.05.
Figure 5—figure supplement 1

Distribution of confidence-weighted sums of FST (cwsFST) values for all subsets of two (cyan), three (purple), four (green), and five (magenta) genotypes from different mother–baby pairs.
For comparison, we also show the distribution obtained when the genotype sequences corresponding to each mother–baby pair are scrambled (black line). Arrows mark the values for the five genotypes that predominated in the cervical samples (black), the three predominant genotypes from cervical samples for mother–baby pairs 12, 22, and 123 (blue), and the two predominant genotypes from cervical samples for mother–baby pairs 14 and 41 (red).
Figure 5—figure supplement 2
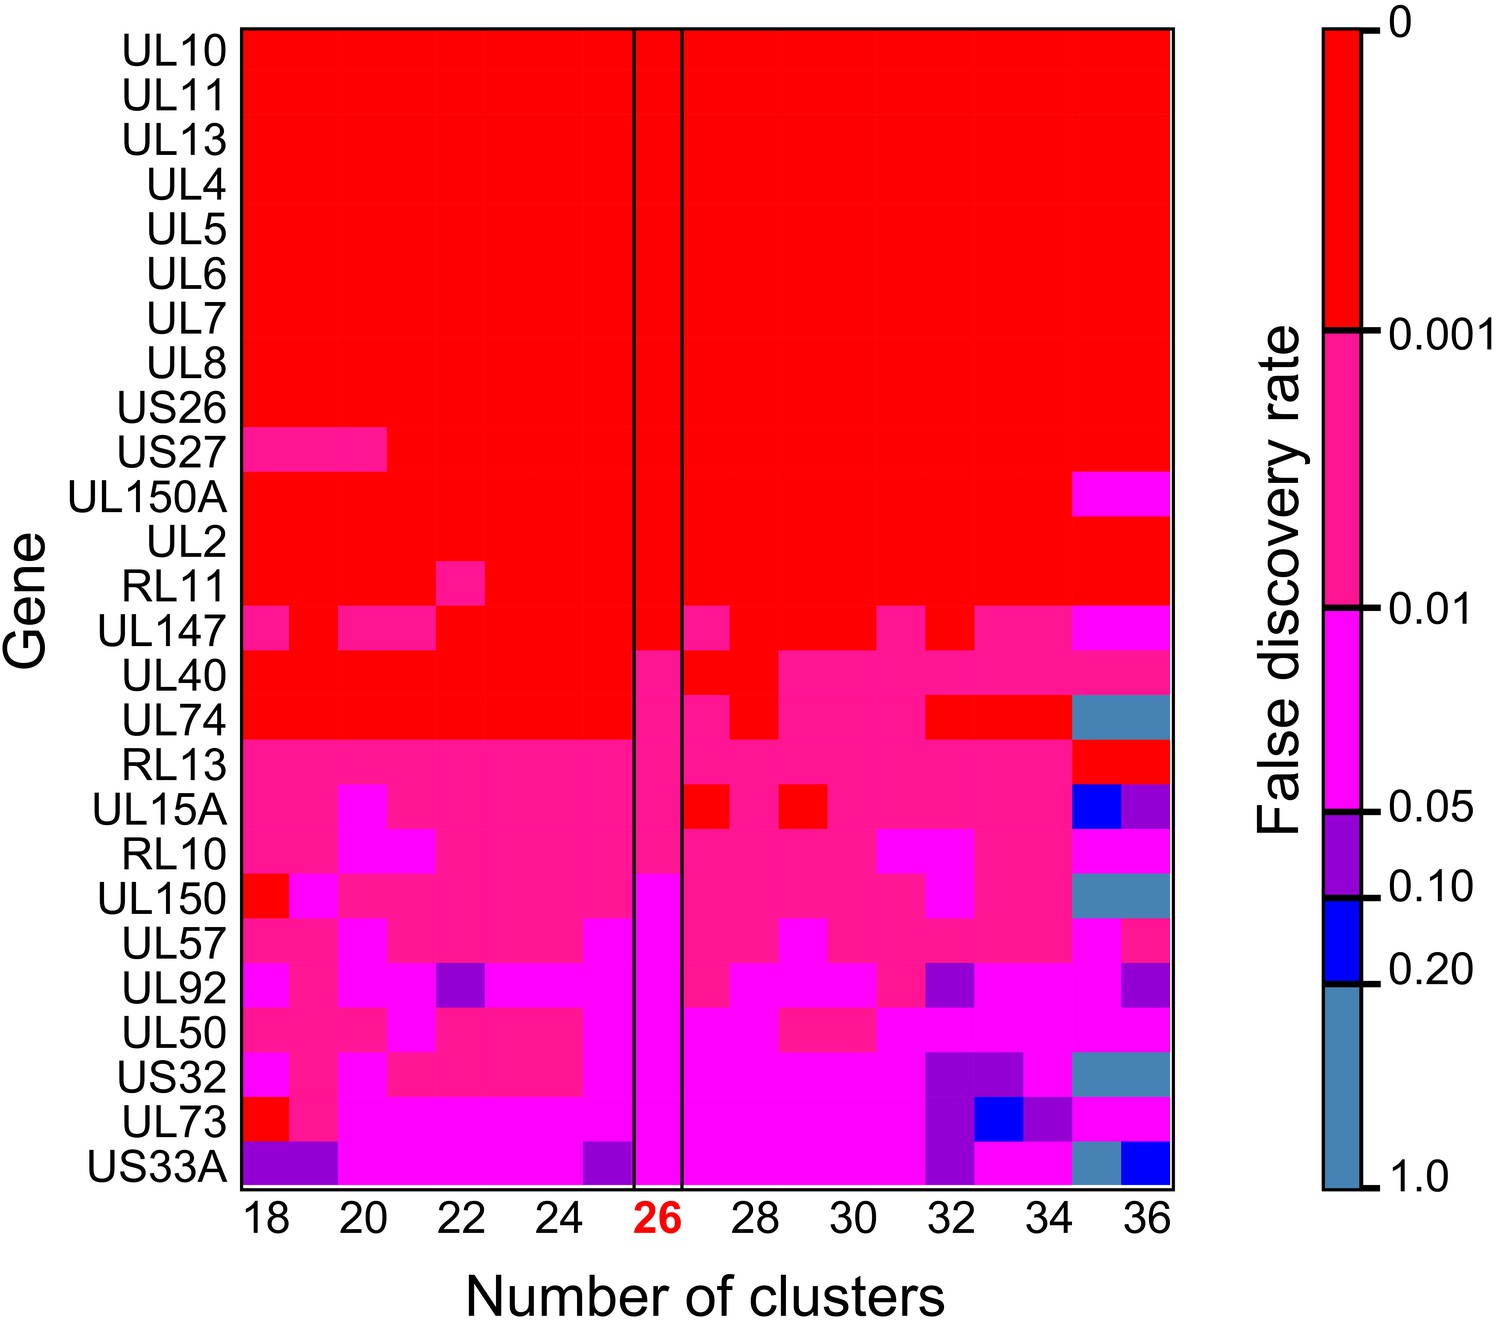
Heatmap showing genes identified as significant in FST analysis are robust to changes in the number of clusters.
Colours indicated the false discovery rate value: red = <0.001; magenta = 0.001–0.01; pink = 0.01–0.05; purple = 0.05–0.1; blue = 0.1–0.2; grey = >0.2.
Tables
Table 1
Sequencing characteristics for samples from each family.
% OTR, % of on target read; % Genome, % of genome coverage; % Dup, % of duplicated reads. Samples with genome coverages too low to be included in any analysis are shaded in grey. Cervical or baby samples with good coverage and read depth are highlighted in yellow.
| Sample | % OTR | % Genome | % Dup | Mean depth | Viral load |
|---|---|---|---|---|---|
| Family 12 | |||||
| Breast milk 2W | 26.41 | 99 | 29.49 | 224.45 | 1,235,136.63 |
| Breast milk 6W | 68.99 | 99 | 13.84 | 578.56 | 14,926,741 |
| Breast milk 14W | 76.4 | 99 | 5.02 | 683.04 | 7,309,960 |
| Breast milk 6M | 77.47 | 99 | 8.07 | 730.04 | 10,876,521 |
| Breast milk 12M | 77.81 | 99 | 7.68 | 779.72 | 6,135,712.5 |
| Cervix 38W pregnant | 14.73 | 99 | 47.56 | 325.97 | 95,842 |
| Baby delivery | 1.35 | 76 | 82.27 | 31.86 | 27,393.9395 |
| Baby 6W | 0.02 | 2 | 81.79 | 0.29 | 4067.86694 |
| Baby 10W | 0.1 | 12 | 77.77 | 2.63 | 1959.9679 |
| Baby 9M | 1.1 | 78 | 79.41 | 28.53 | 2501.75195 |
| Family 14 | |||||
| Breast milk 2W | 13.54 | 98 | 65.41 | 101.66 | 232,442.219 |
| Breast milk 6W | 60.32 | 98 | 49.85 | 656.47 | 20,485,190 |
| Breast milk 14W | 11.15 | 97 | 65.77 | 80.09 | 345,851.781 |
| Cervix 38W pregnant | 0.22 | 63 | 56.04 | 4.34 | 1377 |
| Baby 6W | 1.4 | 91 | 69.35 | 21.35 | 55,400.7148 |
| Baby 14W | 3.33 | 96 | 78.59 | 113.92 | 3960.64233 |
| Baby 6M | 0.34 | 66 | 74.11 | 11.42 | 154.414169 |
| Baby 12M | 0.02 | 7 | 75.97 | 0.75 | 3054.47485 |
| Family 22 | |||||
| Breast milk 2W | 6.08 | 96 | 34.22 | 54.34 | 55,000.2891 |
| Breast milk 6W | 43.18 | 98 | 44.57 | 352.49 | 107,861.141 |
| Breast milk 14W | 6.4 | 97 | 44.41 | 38.3 | 56,883.9805 |
| Cervix 34W pregnant | 0.16 | 46 | 54.95 | 2.97 | 1125 |
| Cervix 38W pregnant | 0.16 | 67 | 47.91 | 4.14 | 1377 |
| Baby 2W | 0.01 | 1 | 46.34 | 0.03 | 1703.49292 |
| Baby 6W | 0.08 | 1 | 43.61 | 0.03 | 22,082.6465 |
| Baby 14W | 2.29 | 92 | 79.42 | 46.53 | 10,962.7197 |
| Baby 6M | 0.3 | 33 | 79.36 | 5.98 | 2124.86548 |
| Baby 9M | 0.22 | 25 | 79.33 | 5.01 | 82,937.5 |
| Family 41 | |||||
| Breast milk 2W | 43.33 | 98 | 60.89 | 224.53 | 7,163,743 |
| Breast milk 6W | 37.05 | 98 | 61.89 | 289.61 | 323,325.531 |
| Breast milk 14W | 48.15 | 98 | 68.02 | 438.05 | 2,697,832.75 |
| Cervix 38W pregnant | 0.61 | 91 | 47.53 | 12.6 | 122 |
| Baby 14W | 0.12 | 32 | 74.47 | 4.67 | 1848.62402 |
| Family 123 | |||||
| Breast milk 2W | 16.11 | 98 | 60.11 | 117.25 | 518,071.875 |
| Breast milk 6W | 16.96 | 98 | 64.77 | 107.35 | 262,400.719 |
| Breast milk 14W | 13.95 | 98 | 64.01 | 122.08 | 518,071.875 |
| Breast milk 6M | 15.81 | 98 | 63.07 | 101.92 | 678,250.313 |
| Cervix 34W pregnant | 2.45 | 97 | 49.46 | 41.91 | 7931 |
| Cervix 38W pregnant | 1.36 | 96 | 49.61 | 28.07 | 4326 |
| Baby delivery | 0.21 | 84 | 10.93 | 6.1 | 939.190735 |
| Baby 10W | 2.19 | 91 | 78.64 | 43.96 | 93,297.3047 |
| Baby 6M | 0.13 | 20 | 77.67 | 3.1 | 5428.83545 |
| Baby 12M | 1.36 | 85 | 80.13 | 40.56 | 6205.88281 |
Table 2
Open reading frames (ORFs) identified by fixation index (FST) as being significantly more similar in strains transmitted prenatally.
LD: Found to contain one of 33 hotspots of genetic linkage disequilibrium (Lassalle et al., 2016).
| ORF | LD | Function |
|---|---|---|
| UL10 | Y | Putative membrane glycoprotein. Immunosuppressive, Impairs T cell function (Bruno et al., 2016) |
| UL11 | Y | Membrane glycoprotein. Modulates T cell signalling/function (Gabaev et al., 2014; Arcangeletti et al., 2015) |
| UL13 | Unknown function | |
| UL4 | Y | Putative membrane glycoprotein (Van Damme and Van Loock, 2014) |
| UL5 | Putative membrane glycoprotein (Van Damme and Van Loock, 2014) | |
| UL6 | Y | Putative membrane glycoprotein (Van Damme and Van Loock, 2014) |
| UL7 | Y | Membrane glycoprotein. Modulates chemo- and/or cytokine-signalling function (Pérez-Carmona et al., 2018) |
| UL8 | Y | Transmembrane glycoprotein. Inhibits proinflammatory cytokines (Pérez-Carmona et al., 2018) |
| US26 | Unknown function | |
| US27 | Y | Membrane glycoprotein. Activates CXCR4 signalling to increase human cytomegalovirus replication (Frank et al., 2019) |
| UL150A | Fibroblast and epithelial cell entry (Houldcroft et al., 2016) | |
| UL2 | Putative membrane glycoprotein (Van Damme and Van Loock, 2014) | |
| RL11 | Y | Membrane glycoprotein. Binds IgG Fc domain involved in immune regulation (Van Damme and Van Loock, 2014) |
| UL147 | α-Chemokine homologue (Katoh and Standley, 2013; Paradis and Schliep, 2019) | |
| UL40 | Control of NK recognition (Heatley et al., 2013) | |
| RL13 | Y | Glycoprotein, repression of replication, binds IgG domain immune regulation (Stanton et al., 2010; Cortese et al., 2012) |
| RL10 | Membrane glycoprotein | |
| UL57 | Ss DNA binding protein (Van Damme and Van Loock, 2014) | |
| UL50 | Nuclear Egress complex. Reduces interferon-mediated antiviral effect (DeRussy et al., 2016) |
Additional files
Download links
A two-part list of links to download the article, or parts of the article, in various formats.
Downloads (link to download the article as PDF)
Open citations (links to open the citations from this article in various online reference manager services)
Cite this article (links to download the citations from this article in formats compatible with various reference manager tools)
Mixed cytomegalovirus genotypes in HIV-positive mothers show compartmentalization and distinct patterns of transmission to infants
eLife 9:e63199.
https://doi.org/10.7554/eLife.63199


