The interplay between asymmetric and symmetric DNA loop extrusion
- Department of Physics and Institute for Medical Engineering and Science, Massachusetts Institute of Technology, United States
Figures
Figure 1 with 1 supplement
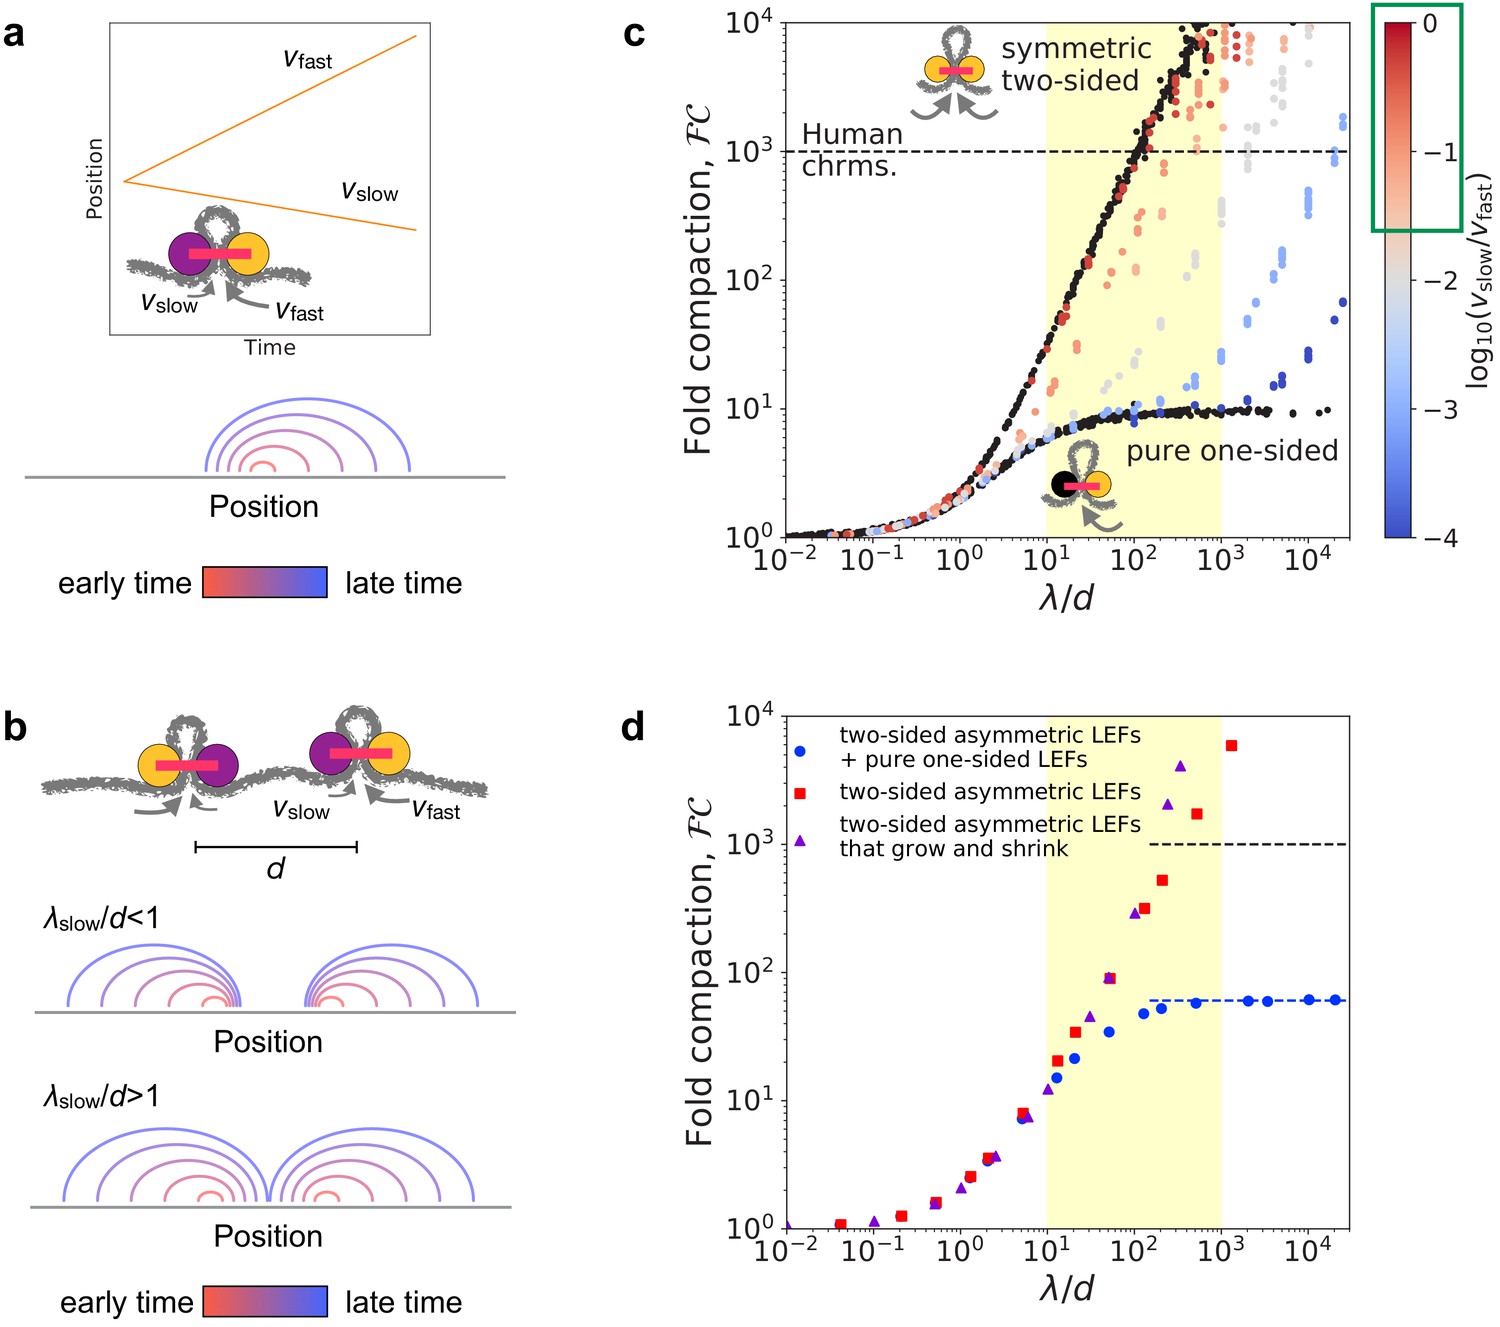
Linear compaction by asymmetric two-sided loop extrusion.
(a) Top: Example position versus time trajectory with inset cartoon of an asymmetric two-sided LEF. Bottom: Arch diagram for a single asymmetric LEF at several times, with early times in red and late times in blue. (b) Top: Cartoon of two asymmetric LEFs, oriented so that both slow subunits extrude the chromatin between the two LEFs. Middle: Arch diagram showing progressive growth of loops from early times (red) to late times (blue) for LEFs with very slowly extruding ‘slow’ subunits. Bottom: Arch diagram showing gap closure by LEFs with ‘slow’ subunits that extrude sufficiently rapidly. (c) Fold compaction, , of asymmetric LEFs, with color indicating the degree of asymmetry, quantified by , from blue (small , high asymmetry) to gray to red (, small asymmetry). For reference, of chromosomes with symmetric two-sided LEFs and one-sided LEFs (i.e. completely asymmetric) are shown in black. Yellow shading indicates expected physiological range for (see text). Green box on the color bar indicates range of asymmetries of 2/3 of metaphase (condensin) loop-extrusion events observed by Golfier et al., 2020. Black dashed line indicates 1000-fold linear compaction expected for human mitotic chromosomes. (d) Fold compaction, , versus for chromosomes with LEF populations with distributions of asymmetries, modeling experimental observations by Golfier et al., 2020. Blue circles correspond to 50% asymmetric two-sided LEFs and 50% one-sided LEFs (scenario 1 in the text). Red squares correspond to 100% asymmetric two-sided LEFs with a distribution of asymmetries (scenario 2). Purple triangles correspond to asymmetric two-sided LEFs that can both grow and shrink loops (scenario 3). Blue dashed line indicates theoretical prediction of for a 50/50 mix of one- and two-sided LEFs (Banigan and Mirny, 2019). Yellow shading indicates expected physiological range for . Standard error for all displayed data points is of the mean value.
Figure 1—figure supplement 1
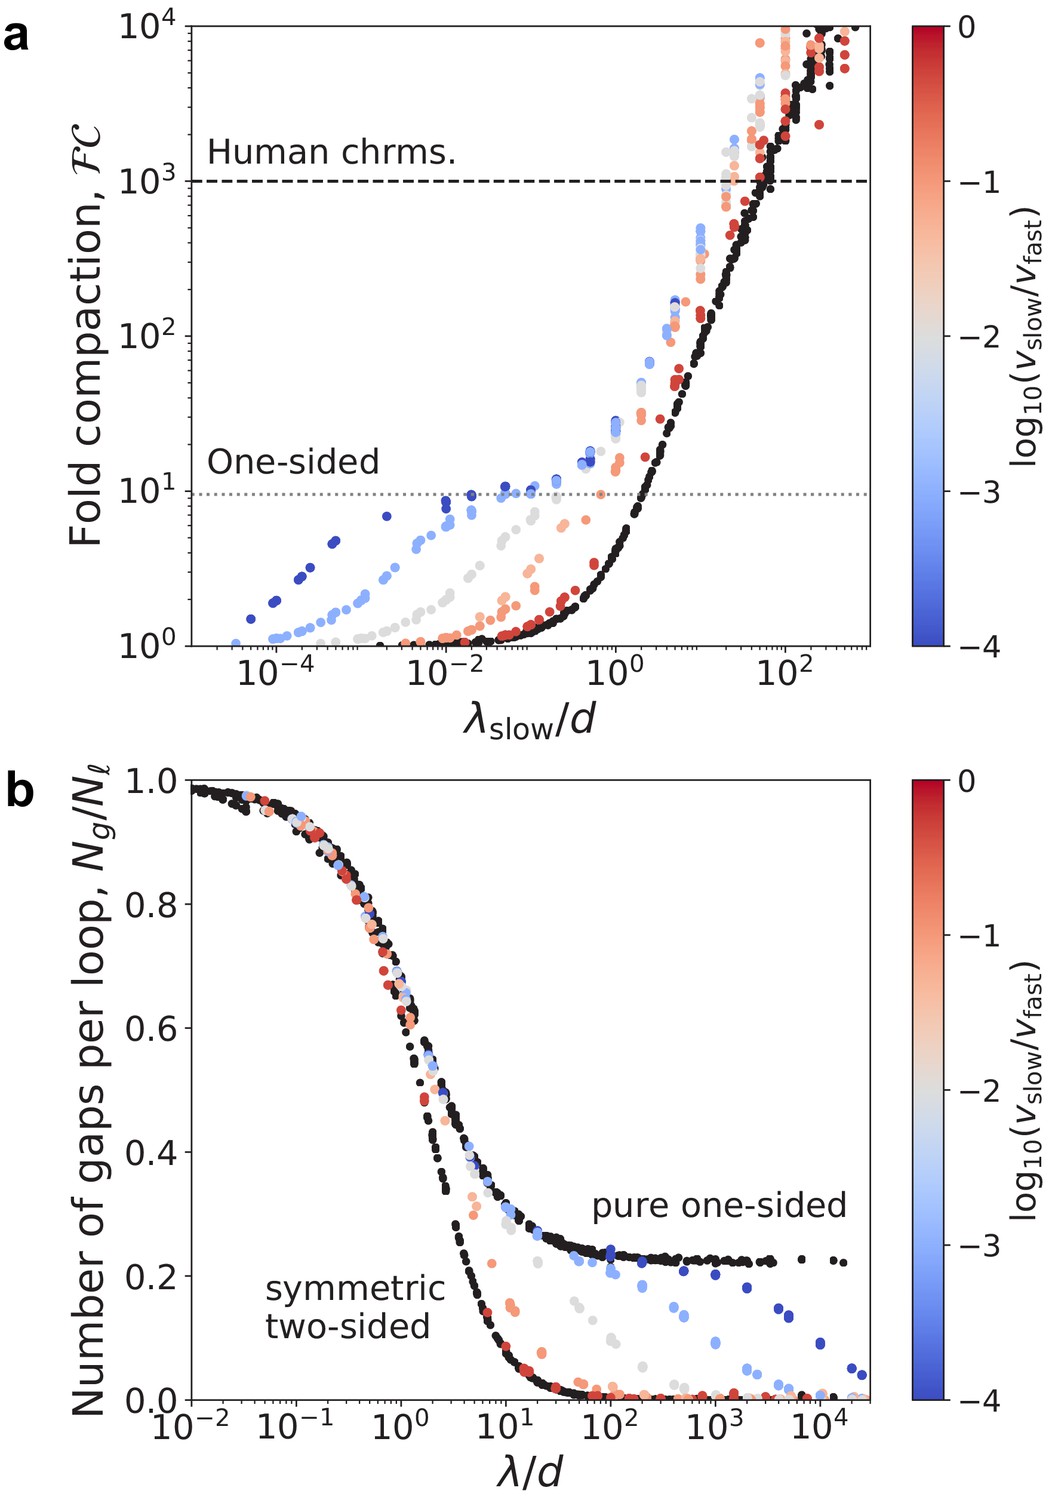
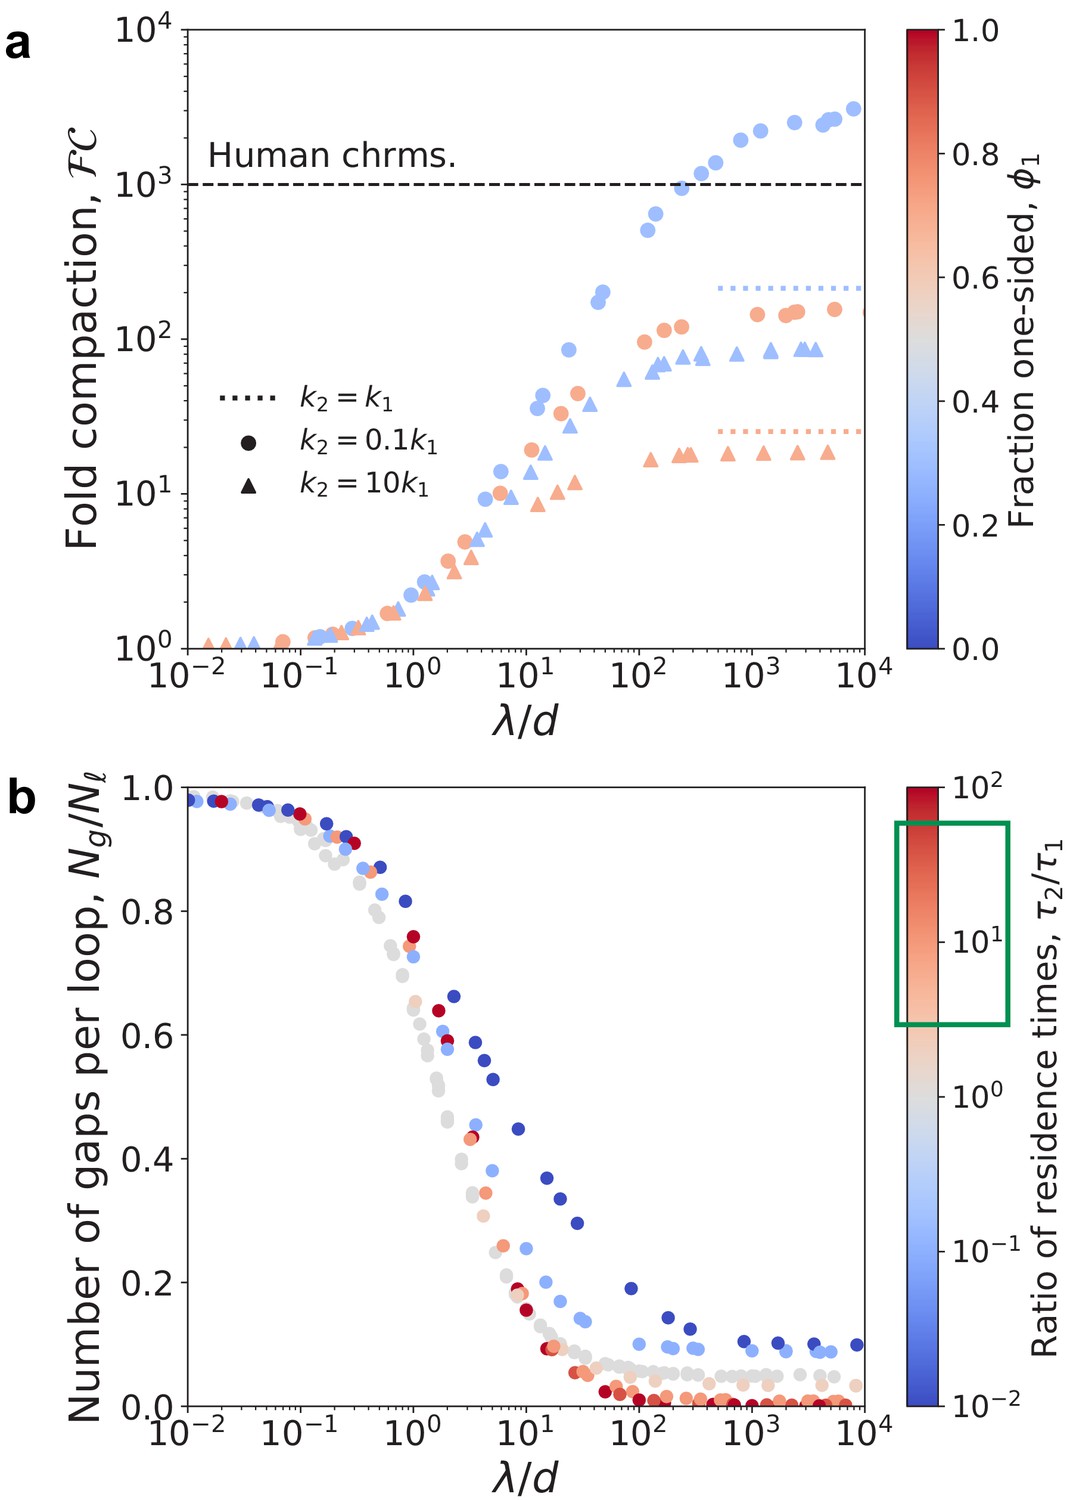
Compaction and elimination of gaps by asymmetric LEFs.
(a) Fold compaction, , of asymmetric LEFs, plotted as a function of to show increase in when . Color indicates the degree of asymmetry, quantified by for symmetric two-sided LEFs is shown in black. Dashed line shows . Dotted line shows compaction limit for one-sided extrusion. (b) The number of of gaps per loop, , versus for systems in which two-sided LEFs extrude loops asymmetrically. for one-sided and symmetric two-sided extrusion are shown by black data points and asymmetry is indicated by color, ranging from high asymmetry (small ) in blue to low asymmetry () in red.
Figure 2 with 4 supplements
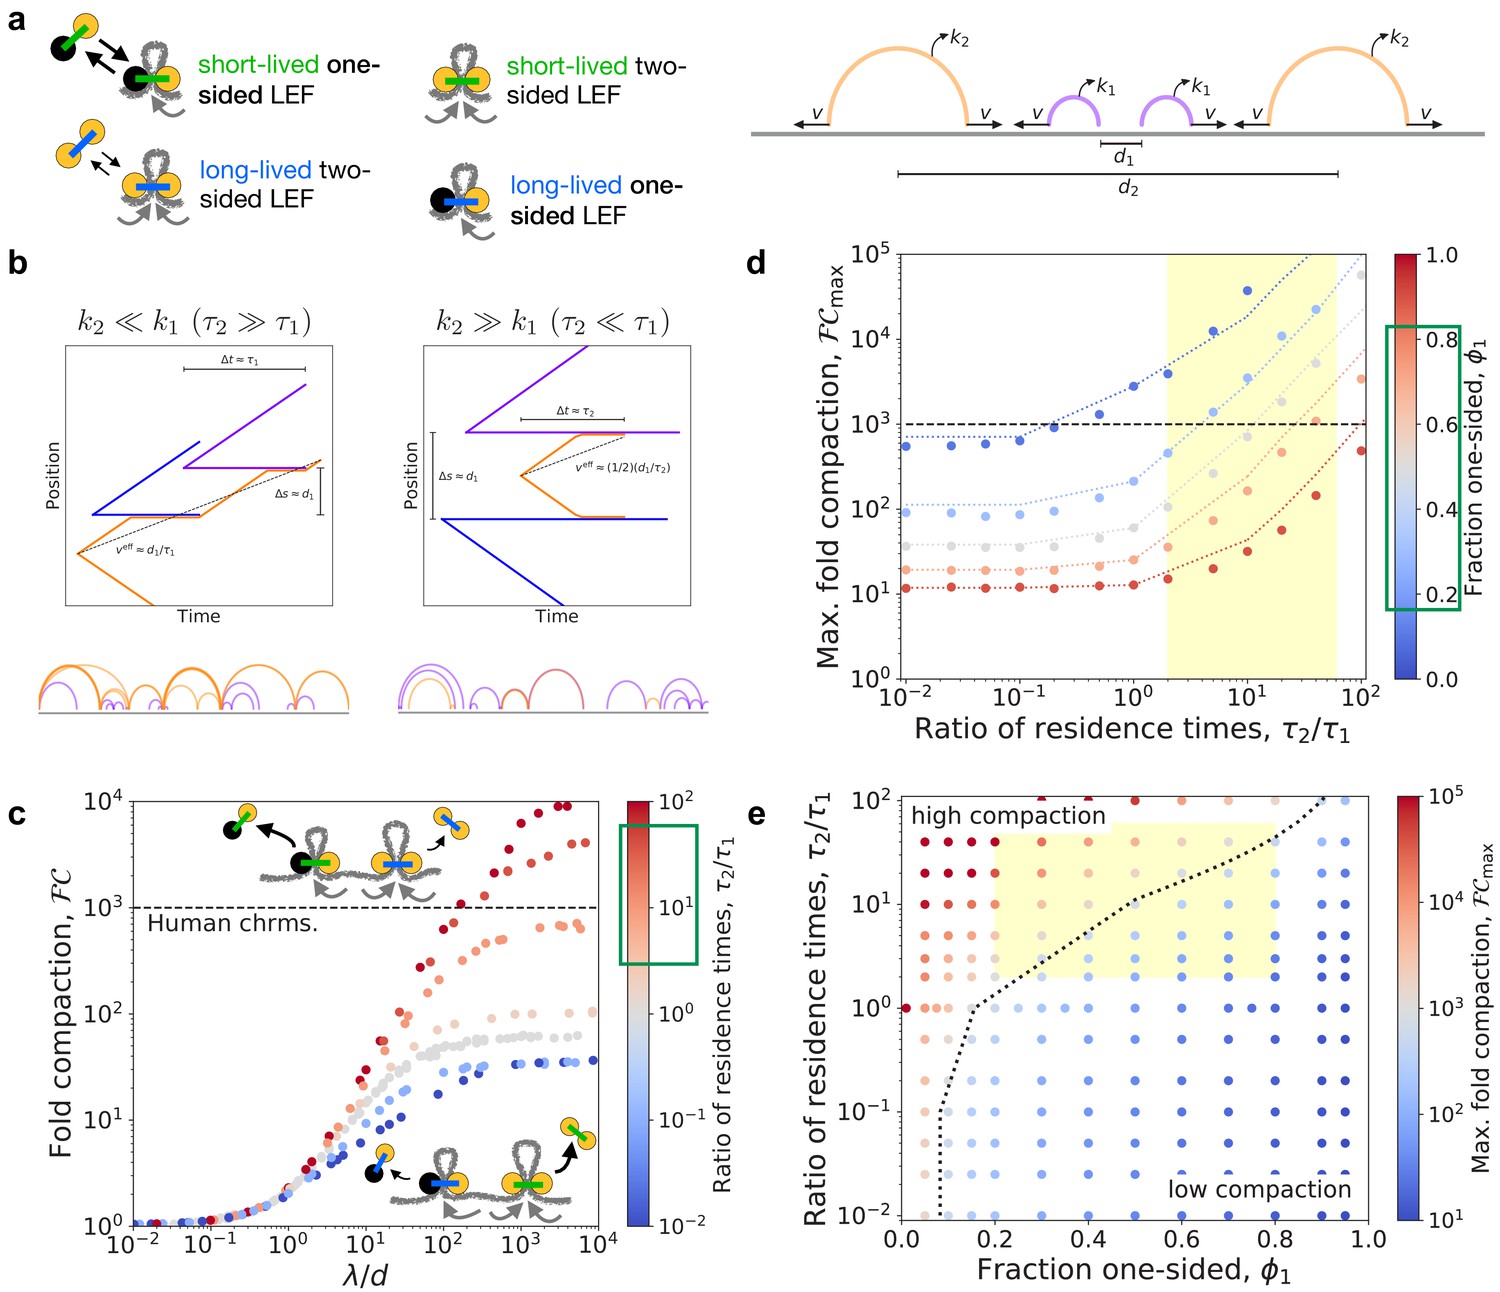
Linear compaction by mixtures of one- and two-sided LEFs with different residence times.
(a) Arch diagram schematically showing two-sided LEFs (orange) and one-sided LEFs (purple) with different unbinding rates (and residence times), and , respectively. (b) Top: Example trajectories for mixtures of one- and two-sided LEFs illustrating the theoretical limits of very long-lived two-sided LEFs (left) and very short-lived two-sided LEFs (right). In both scenarios, a two-sided LEF (orange) extrudes at speed until encountering a one-sided LEF (blue or purple), which acts as a barrier. Encounters with barriers reduce the effective mean speed, , indicated by black dashed lines. Bottom: Arch diagrams from simulation snapshots for the two scenarios. Two-sided LEFs are orange and one-sided LEFs are purple. (c) Fold-compaction, , as a function of the ratio, , for 50/50 mixes of one- and two-sided LEFs in which each species has a different residence time. Color from blue to gray to red indicates increasing ratio, , of residence times. Green box on the color bar indicates estimated range of residence time ratios for condensin II as compared to condensin I (Gerlich et al., 2006a; Gibcus et al., 2018; Walther et al., 2018). Gray points are data for . Black dashed line indicates 1000-fold compaction. (d) Maximum fold compaction, , as a function of the ratio of residence times, . Colors from blue to gray to red indicate increasing fractions, , of one-sided LEFs. Dotted lines indicate theory, with results for shown for , results for shown for , and the mean-field () result shown with straight lines interpolating to other theoretical results. Yellow region indicates estimated range of residence time ratios for condensin II as compared to condensin I. Green box indicates approximate range of observed in experiments with metazoan condensins (Golfier et al., 2020; Kong et al., 2020). (e) Phase diagram colored by fold linear compaction, , for various fractions, , of one-sided LEFs and ratios, of residence times (red: high compaction, blue: low compaction, gray: ). Yellow region indicates range of residence time ratios for condensin II as compared to condensin I and experimentally observed fractions of one-sided extruders. Black dotted line is the theoretically predicted boundary () between high and low compaction regimes. Standard error for all displayed data points is .
Figure 2—figure supplement 1
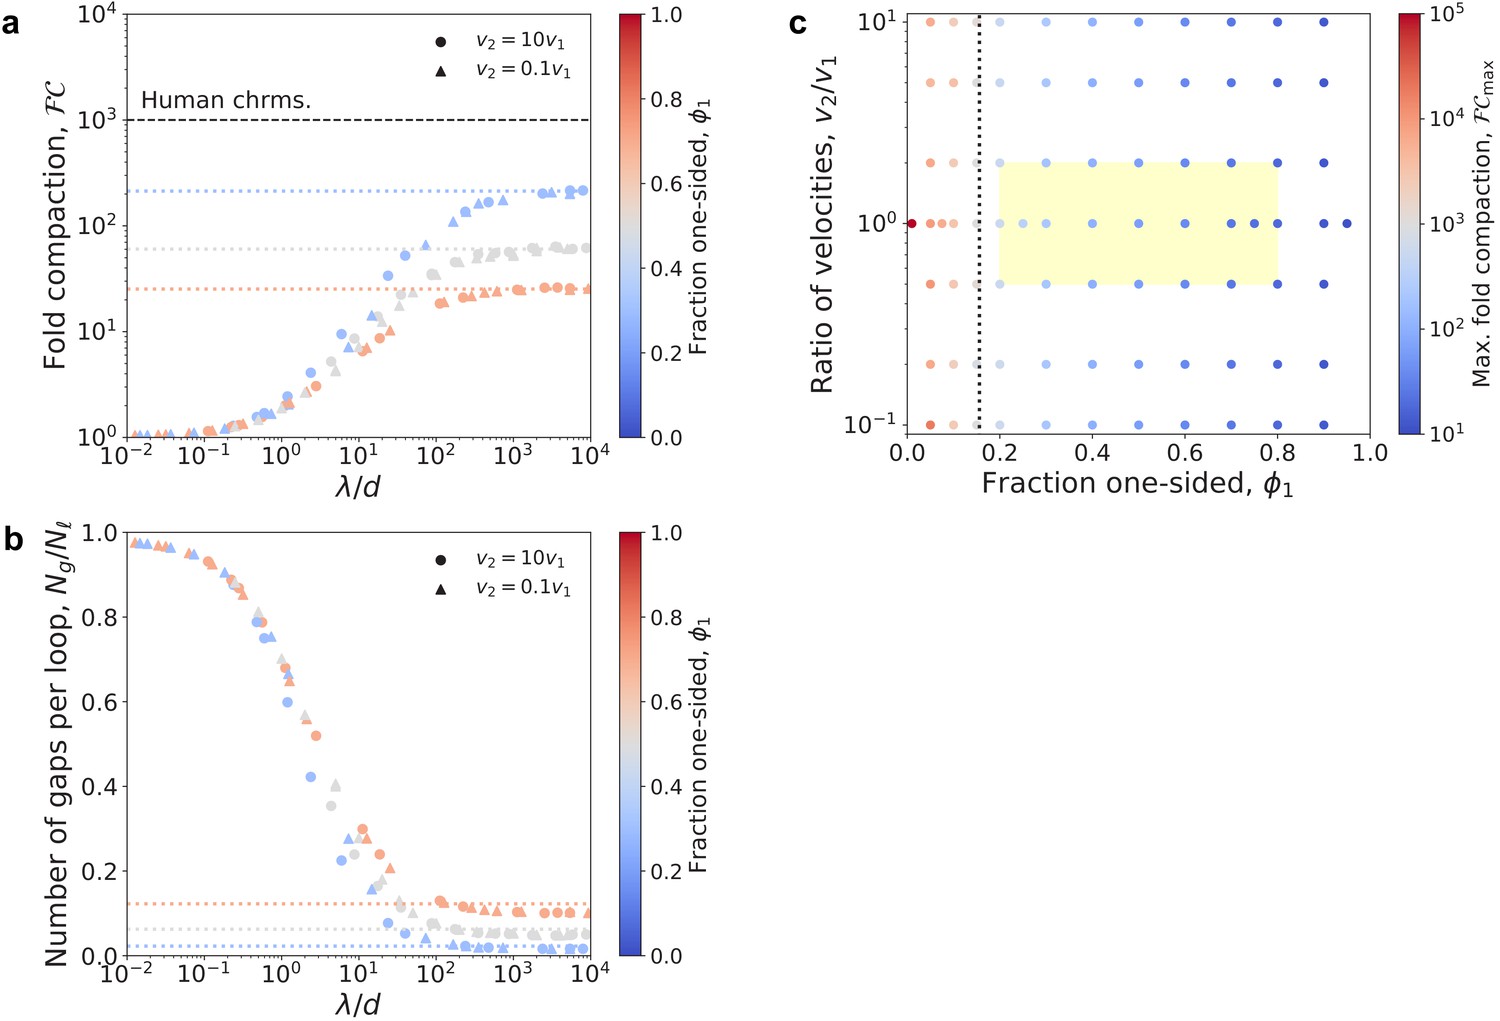
Compaction by mixtures of one- and two-sided LEFs with different extrusion velocities.
(a) Fold compaction, , as a function of the ratio for mixtures of LEFs in which two-sided extrusion proceeds either 10 times more rapidly (circles) or slowly (triangles) than one-sided extrusion. Colors from blue to gray to red indicate the fraction, , of one-sided LEFs. Dotted lines show theoretical predictions for maximum fold compaction from theory with a single mean velocity (Banigan and Mirny, 2019). (b) The number of of gaps per loop, , decreases with and depends on the fraction, , of one-sided LEFs, but the limiting value is independent of the relative velocities, (indicated by symbols). Dotted lines indicate theoretical predictions from previous theory. (c) Phase diagram colored by fold linear compaction, (red: high, blue: low, gray: ), for various fractions, , of one-sided LEFs and ratios, , of velocities. Yellow region indicates estimate of velocity ratios and fractions of one-sided extruders. Black dotted line is the theoretically predicted boundary () between high and low compaction regimes.
Figure 2—figure supplement 2
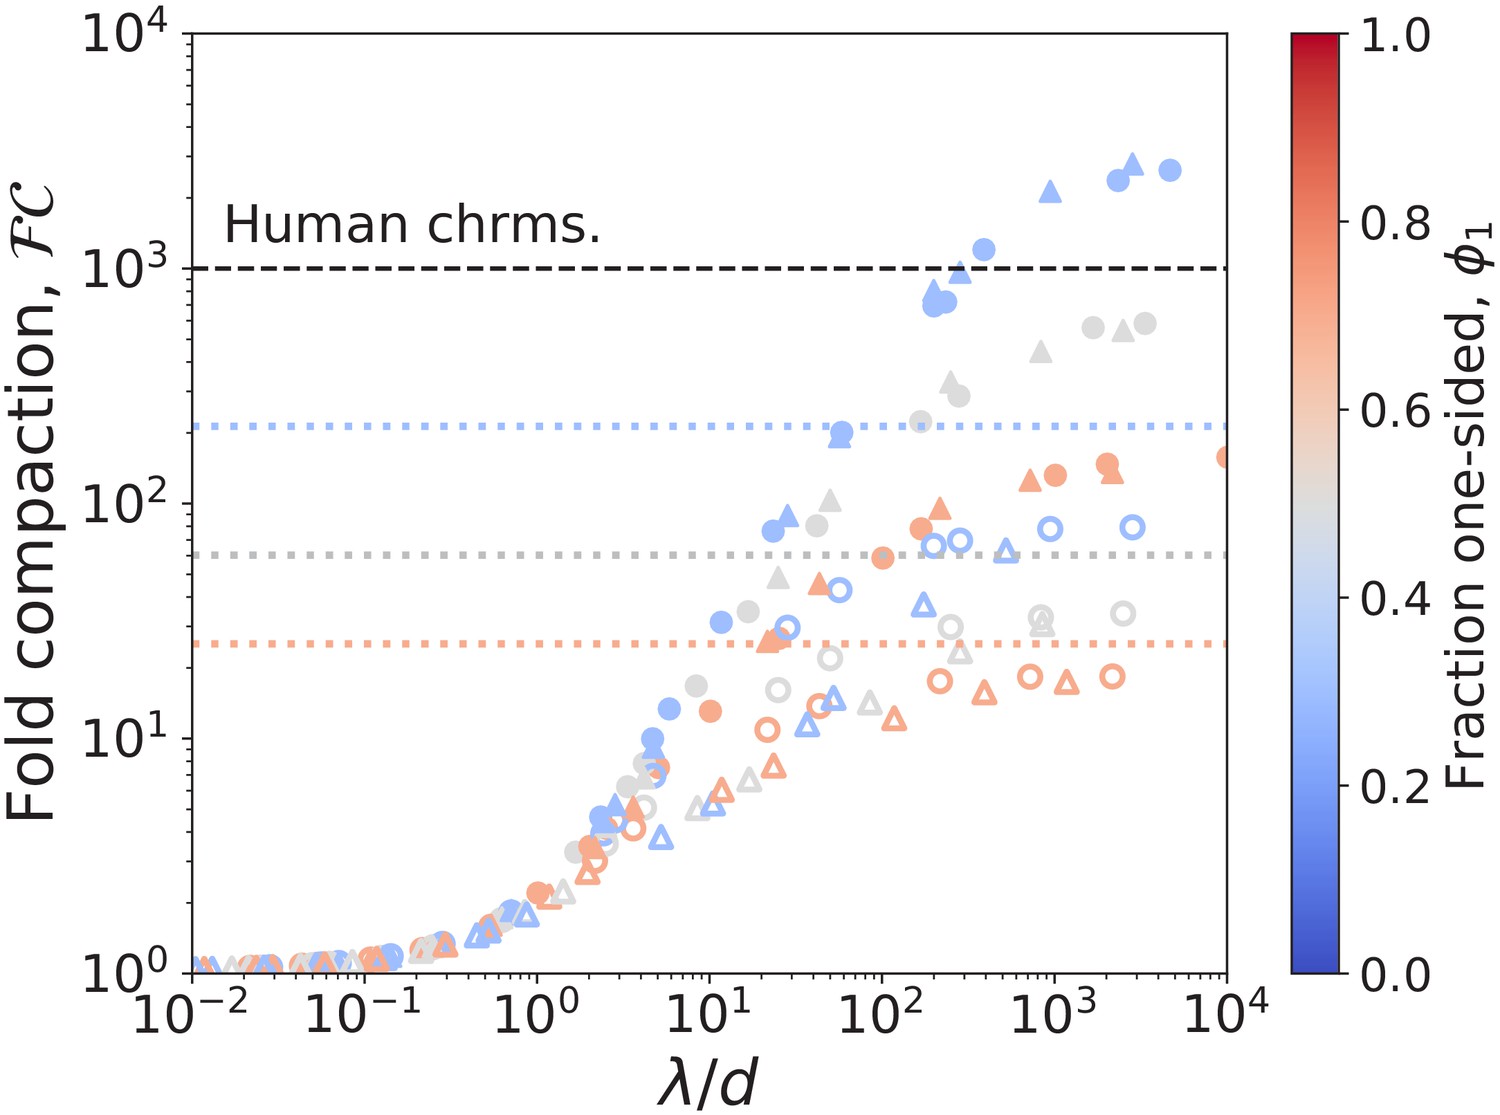
Compaction by mixtures of one- and two-sided LEFs with different residence times.
(a) Fold compaction by mixtures of one- and two-sided LEFs in which each species has a different unbinding rate, or (and residence time, ). Color from blue to red indicates increasing fractions, , of LEFs that are one-sided. Triangles indicate short-lived two-sided LEFs () and circles indicate long-lived two-sided LEFs (). Colored dotted lines indicate the theoretical prediction for maximum compaction in systems in which all LEFs unbind at the same rate, (Banigan and Mirny, 2019). Black dashed line indicates 1000-fold compaction. (b) The number of of gaps per loop, , versus for mixtures in which 50% of LEFs are one-sided and 50% of LEFs are two-sided (i.e., ). The limiting value of decreases with increasing ratios of residence times, . The green box on the color bar indicates the expected physiological range of .
Figure 2—figure supplement 3
Compaction by mixtures of one- and two-sided LEFs with different extrusion speeds and residence times.
Fold compaction, , by mixtures of LEFs in which speeds and residence times of one- and two-sided LEFs differ by a factor of 10. Solid symbols: ; open symbols: ; circles: ; triangles: . Dotted lines indicate theoretical predictions for .
Figure 2—figure supplement 4
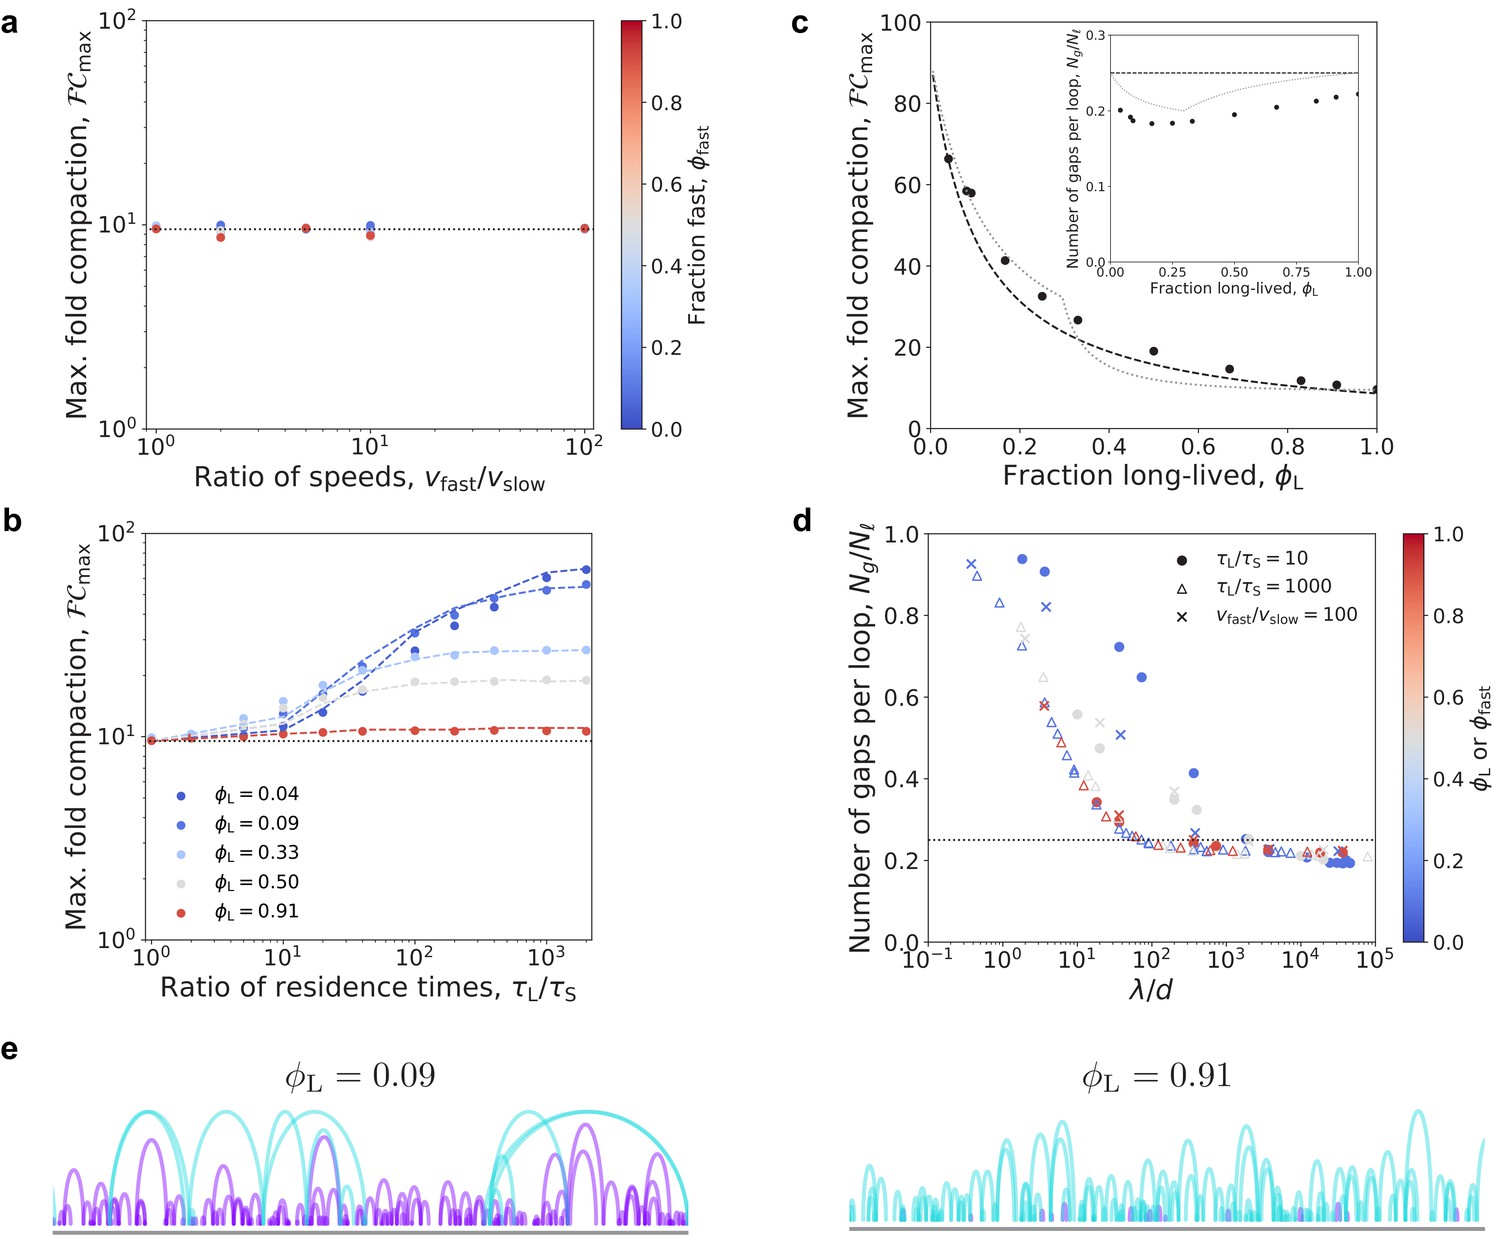
Maximum fold compaction by mixtures one-sided LEFs with different residence times.
(a) Maximum fold compaction, , plotted versus the ratio of velocities, , in a system with two populations of one-sided LEFs. The fraction, , of fast LEFs is indicated by color from blue to red (small to large fractions). (b) With two different residence times, and , mixtures of one-sided LEFs can exceed the theoretical -fold compaction limit (dotted line) predicted for . Colors indicate fraction of LEFs that have a long residence time. Dashed lines show theoretical results. Dotted line shows predicted by theory (Banigan and Mirny, 2019). (c) Maximum fold compaction across all ratios of residence times as a function of the fraction, , of long-lived one-sided LEFs. Points are simulation data. The black dashed line is the result of the gap counting theory using the mean-field assumption of one gap per four loops (Equation 20 in Appendix 1). The gray dotted line is the theoretical result with more precise counting of gaps (Equation 26 in Appendix 1). Inset: Number of gaps per loop, , for maximal compaction plotted versus . Points are simulation data and the gray dotted line is the result of the precise gap-counting theory. Black dashed line shows assumed for the effective processivity theory (see Appendix 1). (d) Simulation data showing that the number of gaps per loop, , as a function of approaches a limiting value of (dotted line), irrespective of the fraction of long-lived LEFs, the ratio, , of long and short residence times, and the ratio, , of fast and slow extrusion speeds. Color denotes either the fraction, , of long-lived LEFs (for circles and triangles) or the fraction, of fast LEFs (for ‘x’ symbols). (e) Arch diagrams for systems with small and large quantities of long-lived one-sided LEFs. Purple arches represent short-lived LEFs while blue arches represent long-lived LEFs. and for left and right, respectively.
Figure 3 with 2 supplements
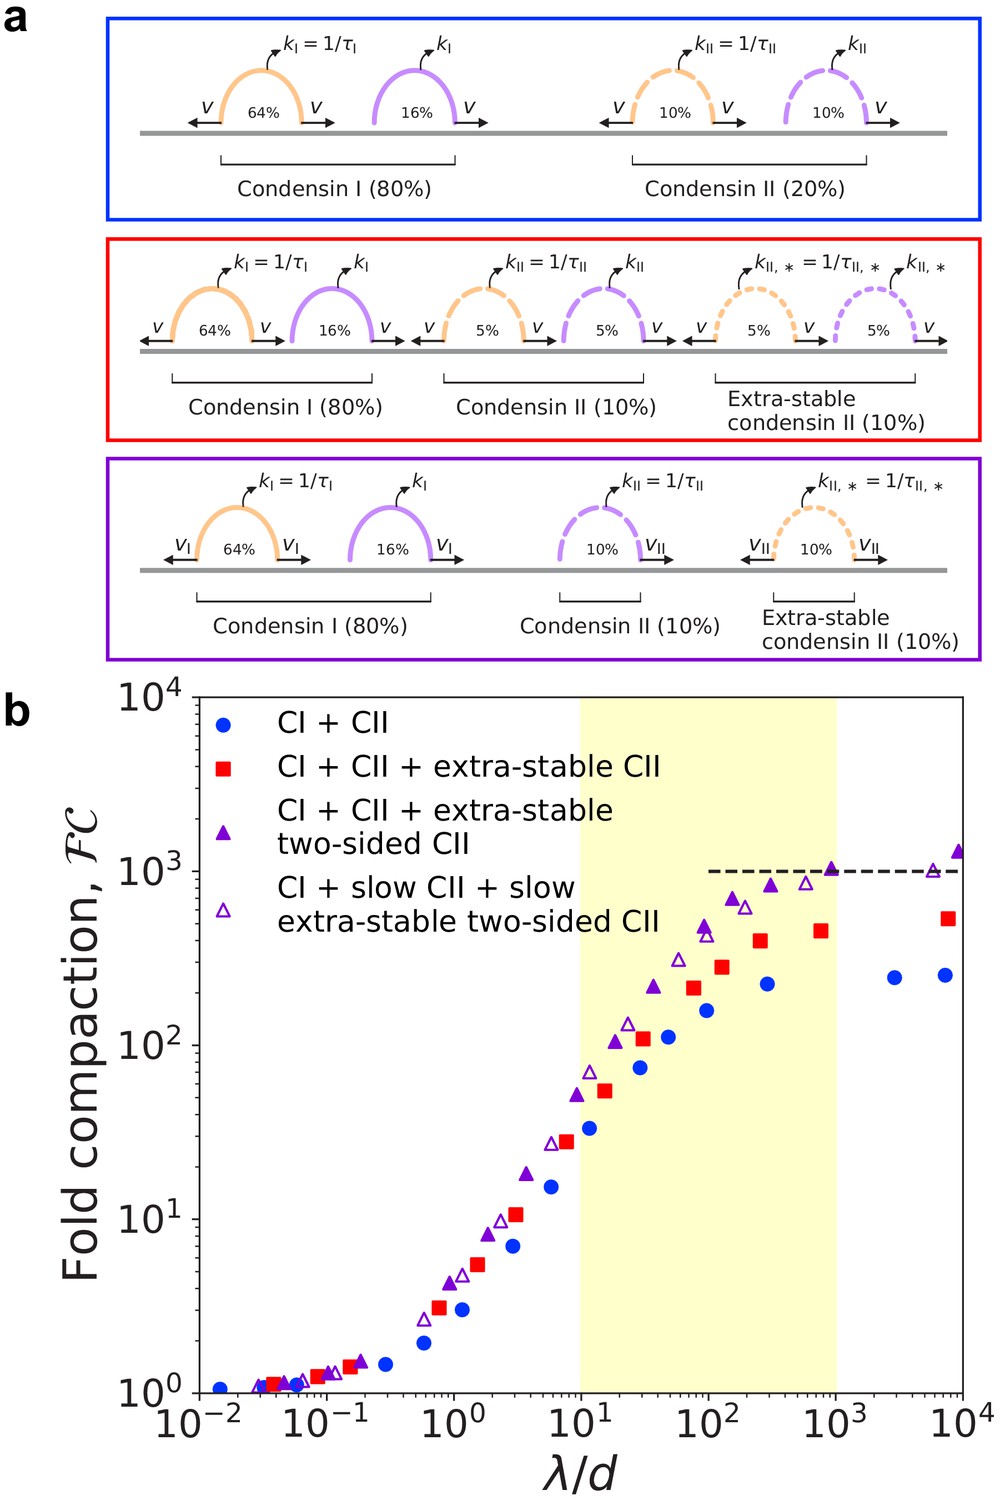
Simulations of LEFs with properties of condensins I and II.
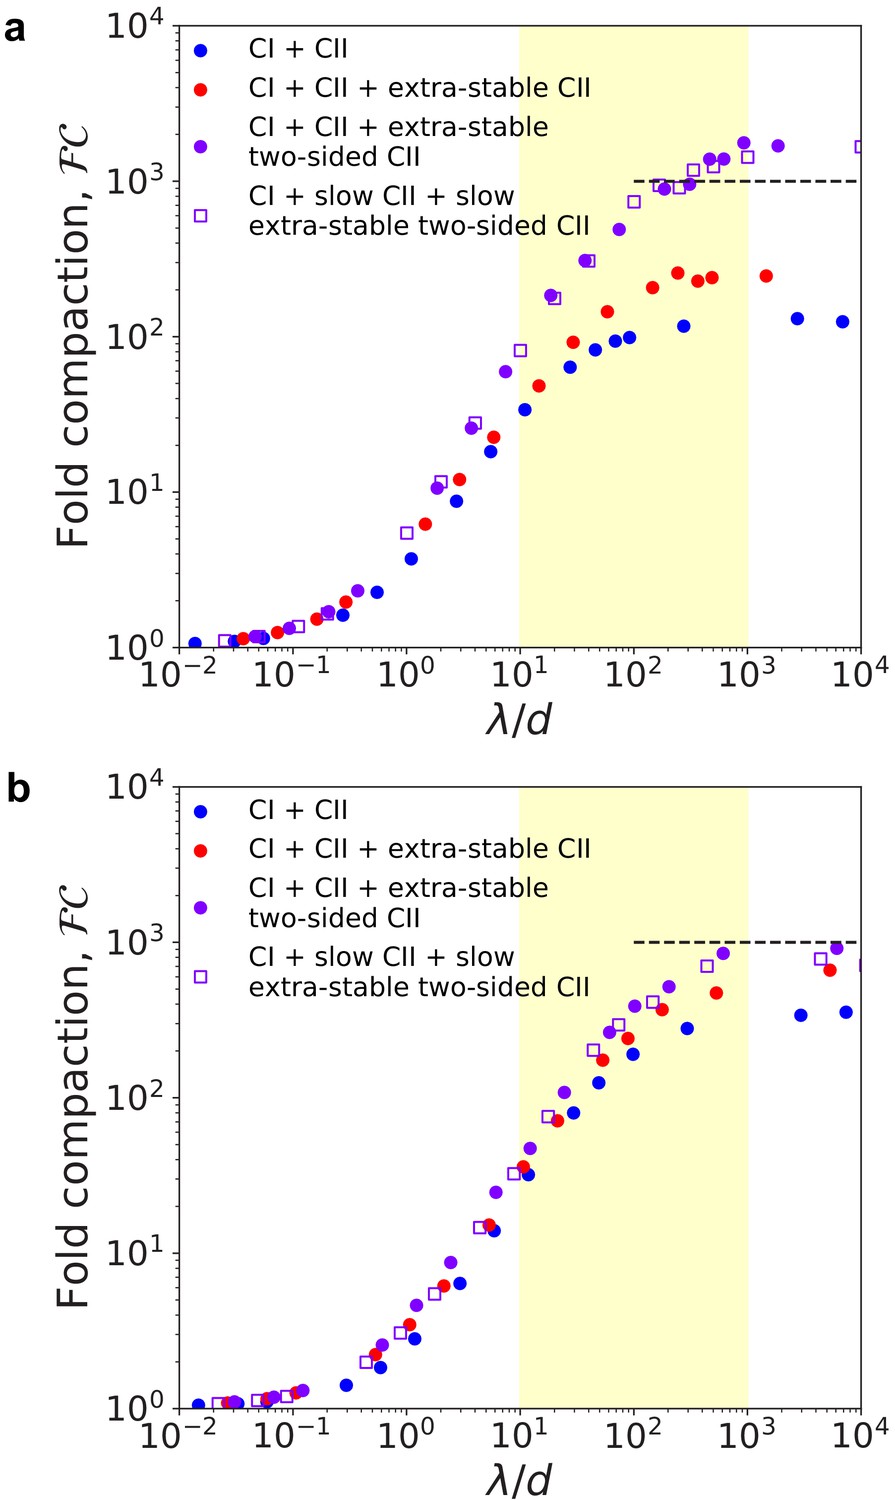
(a) Arch diagrams schematically illustrating three different scenarios for extrusion by mixtures of condensins I and II. Condensins I and II may be one- or two-sided in all scenarios (purple or orange, respectively). The ratio of condensin I to condensin II is 4:1. Top (blue box): Schematic cartoon of a mixture of condensins I and II in which condensin II has residence time . Middle (red box): Cartoon of scenario with two populations of condensin II. The ‘extra-stable’ population has residence time . In this scenario, both types of condensin II may be one-sided or two-sided. Bottom (purple box): Scenario in which extra-stable condensin II complexes are two-sided, while the more dynamic condensin II subpopulation is one-sided. Colors of boxes indicate color of corresponding data points in panel (b). (b) Fold linear compaction, , versus for the scenarios described above (blue circles, red squares, and purple triangles, respectively). Open triangles denote the third scenario, but with condensin II complexes extruding with speed . Black dashed line denotes 1000-fold compaction. Yellow shading indicates expected physiological range of . Standard error for all displayed data points is .
Figure 3—figure supplement 1
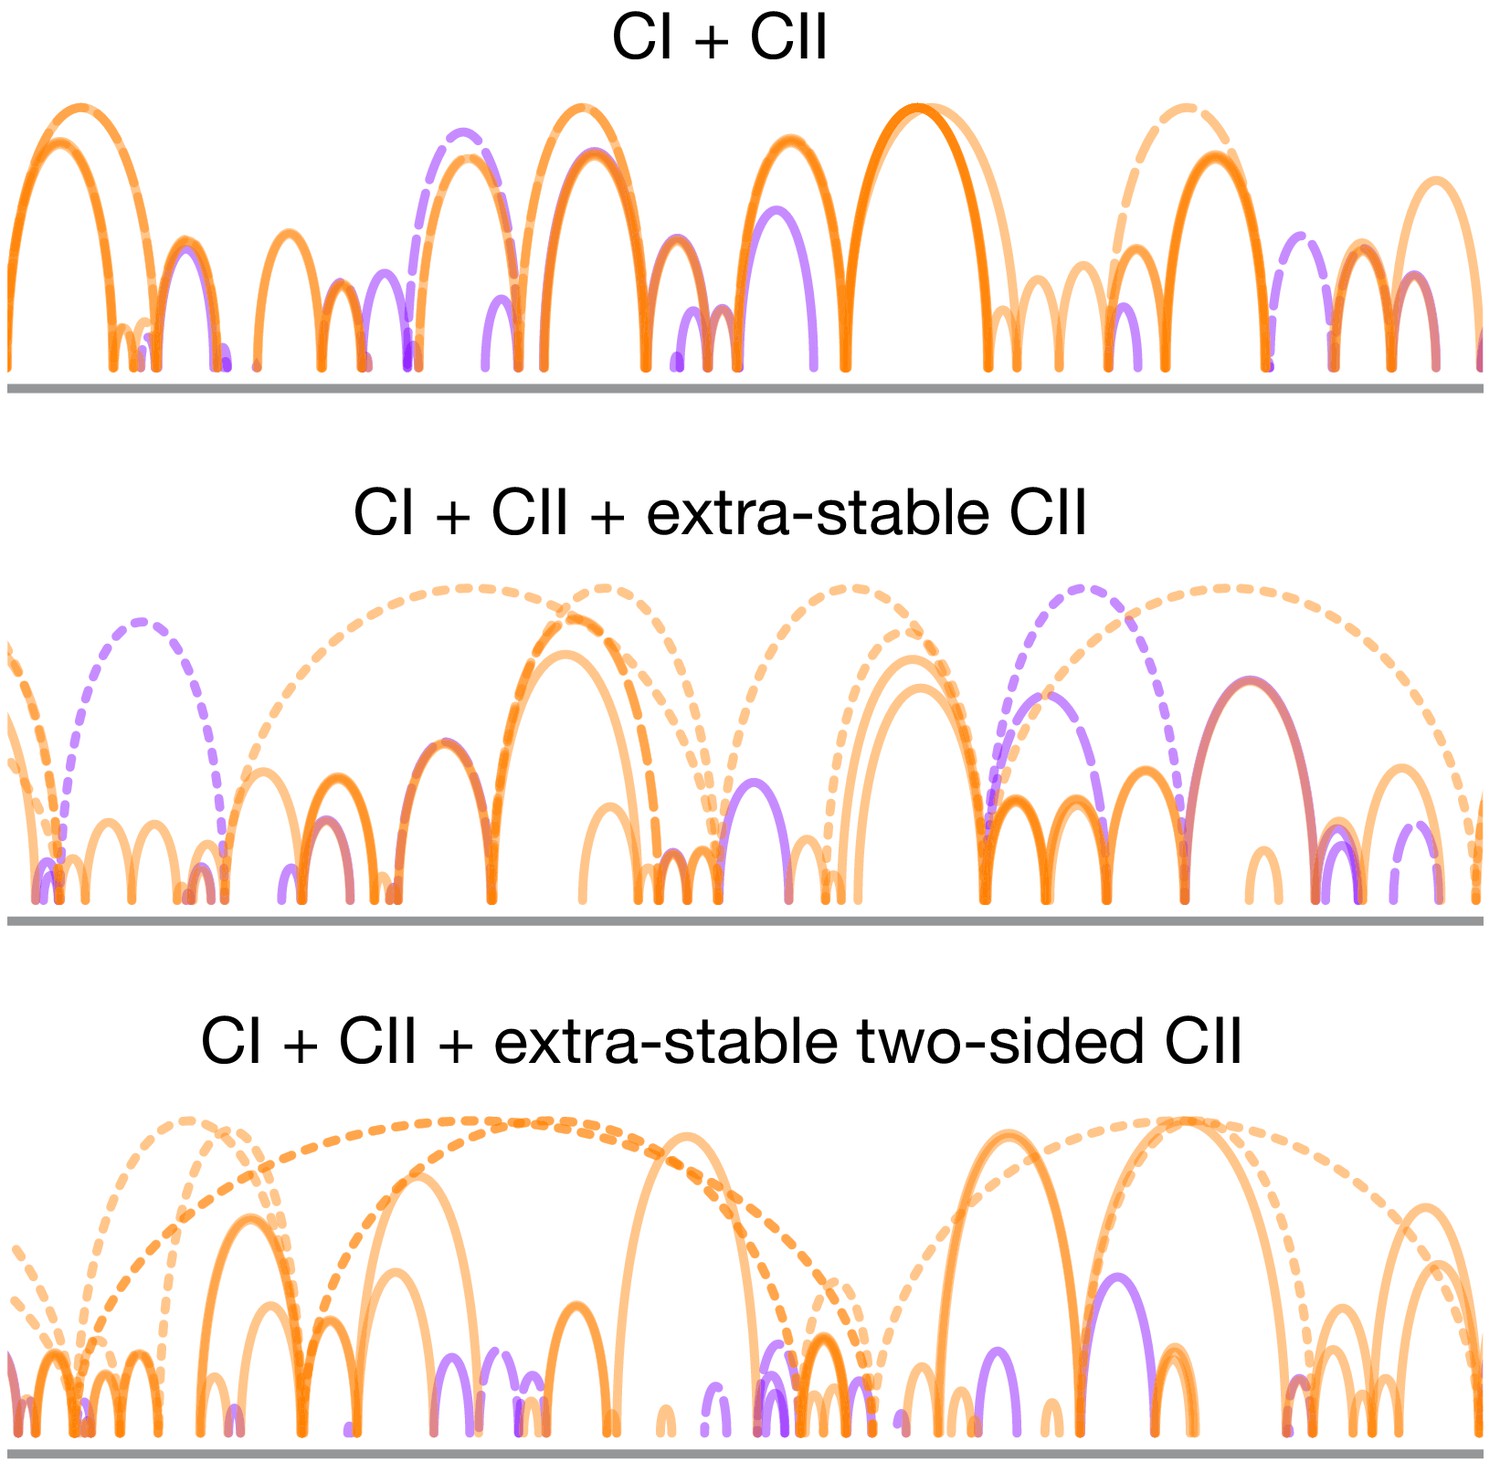
Arch diagrams for simulations with LEFs with the properties of condensins I and II.
Orange arches indicate two-sided LEFs, while purple arches indicate one-sided LEFs. Solid lines indicate condensin I, dashed lines indicate condensin II, and dotted lines indicate extra-stable condensin II.
Figure 3—figure supplement 2
Condensins I and II simulations with different ratios of condensin I to condensin II.
Fold linear compaction, , versus for the scenarios described in Figure 3 (blue circles, red squares, and purple triangles, respectively) for condensin I to condensin II ratios of (a) 1:1 as measured for HeLa cells by Ono et al., 2003 and (b) 9:1 as in DT40 (chicken) cells (Ohta et al., 2010).
Figure 4
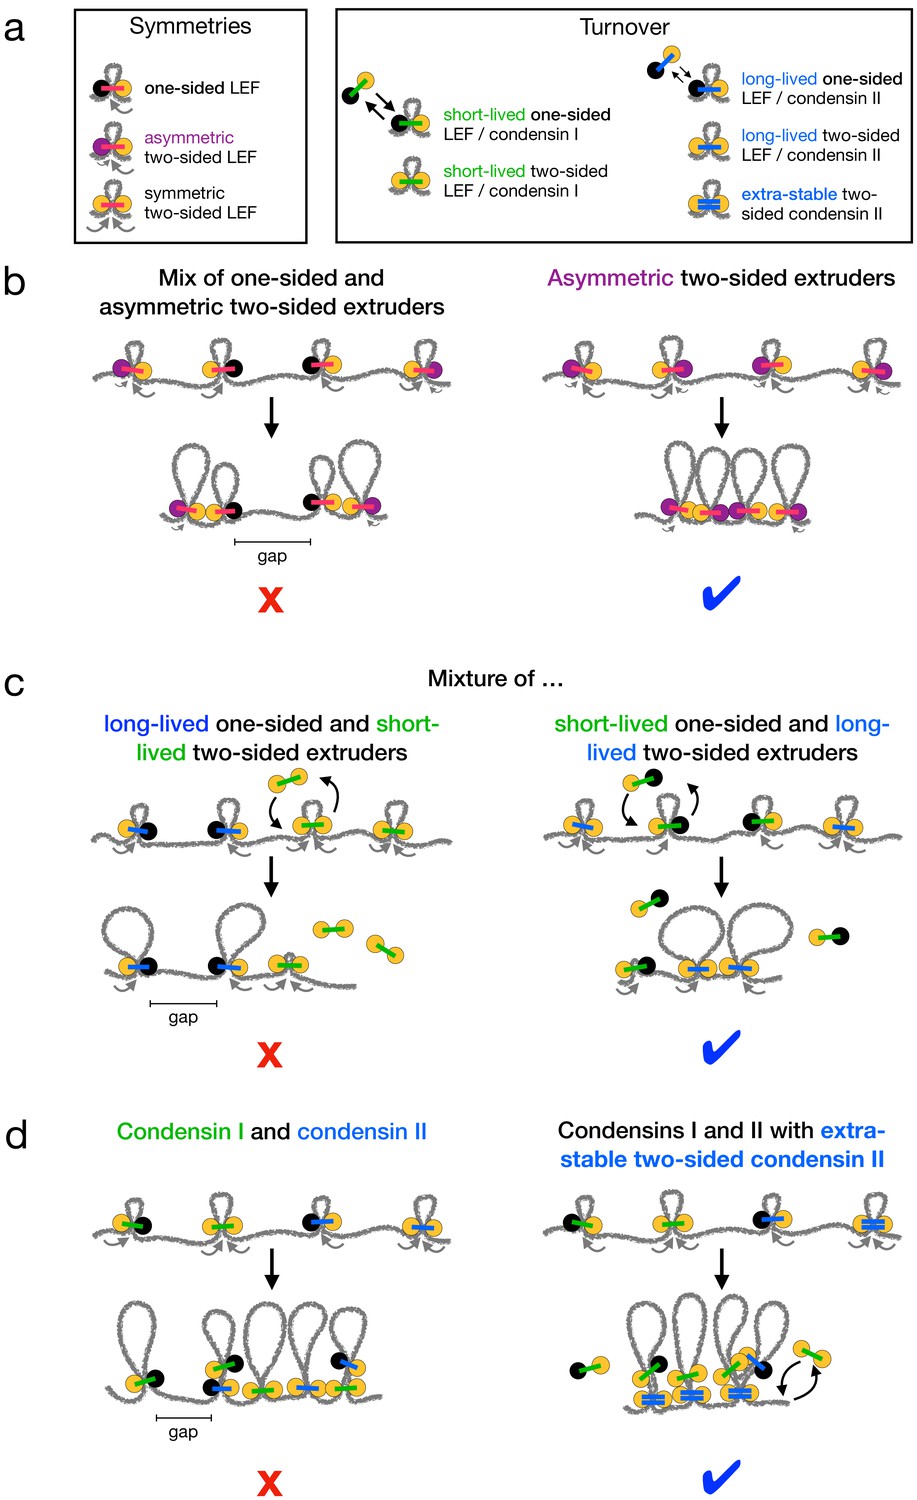
Summary of chromosome compaction abilities of LEF mixtures with different asymmetries and dynamics.
(a) Legend for illustrations of LEFs with different symmetries (left) and/or different dynamics (right). (b) Illustrations of systems with asymmetric LEFs. Systems with both one-sided and asymmetric two-sided LEFs do not fully compact mitotic chromosomes due to the unavoidable presence of unlooped gaps (left). However, asymmetric two-sided LEFs can fully compact chromosomes if the processivity of the slow side (purple) is sufficiently large (right). (c) Illustrations of one- and two-sided LEFs with different dynamics. Mixtures in which one-sided LEFs are long-lived (slowly turn over) and two-sided LEFs are short-lived (rapidly turn over) cannot fully compact mitotic chromosomes (left). Mixtures with long-lived two-sided LEFs and short-lived one-sided LEFs compact chromosomes (right). (d) Illustrations of mixtures of condensins I and II. Mixtures of condensins I and II in which turnover is independent of extrusion symmetry cannot fully compact chromosomes (left). Mixtures in which two-sided condensin II complexes are very long-lived (LEFs with double blue bars) can fully compact chromosomes (right). Note that each LEF represents a molecular complex that performs either one-sided or two-sided extrusion; a two-sided LEF may represent either a single two-sided condensin or a dimer of two one-sided condensins.
Additional files
Download links
A two-part list of links to download the article, or parts of the article, in various formats.
Downloads (link to download the article as PDF)
Open citations (links to open the citations from this article in various online reference manager services)
Cite this article (links to download the citations from this article in formats compatible with various reference manager tools)
The interplay between asymmetric and symmetric DNA loop extrusion
eLife 9:e63528.
https://doi.org/10.7554/eLife.63528


