Evolutionary stasis of the pseudoautosomal boundary in strepsirrhine primates
- Laboratoire Biométrie et Biologie Evolutive, CNRS / Univ. Lyon 1, France
- Department of Animal and Plant Sciences, University of Sheffield, United Kingdom
- Faculty of Mathematics, University of Vienna, Austria
- Zoo de Lyon, France
- Laboratoire Evolution et Diversité Biologique, CNRS / Univ. Toulouse, France
- LEAF-Linking Landscape, Environment, Agriculture and Food Dept, Instituto Superior de Agronomia, Universidade de Lisboa, Portugal
Figures
Figure 1 with 2 supplements
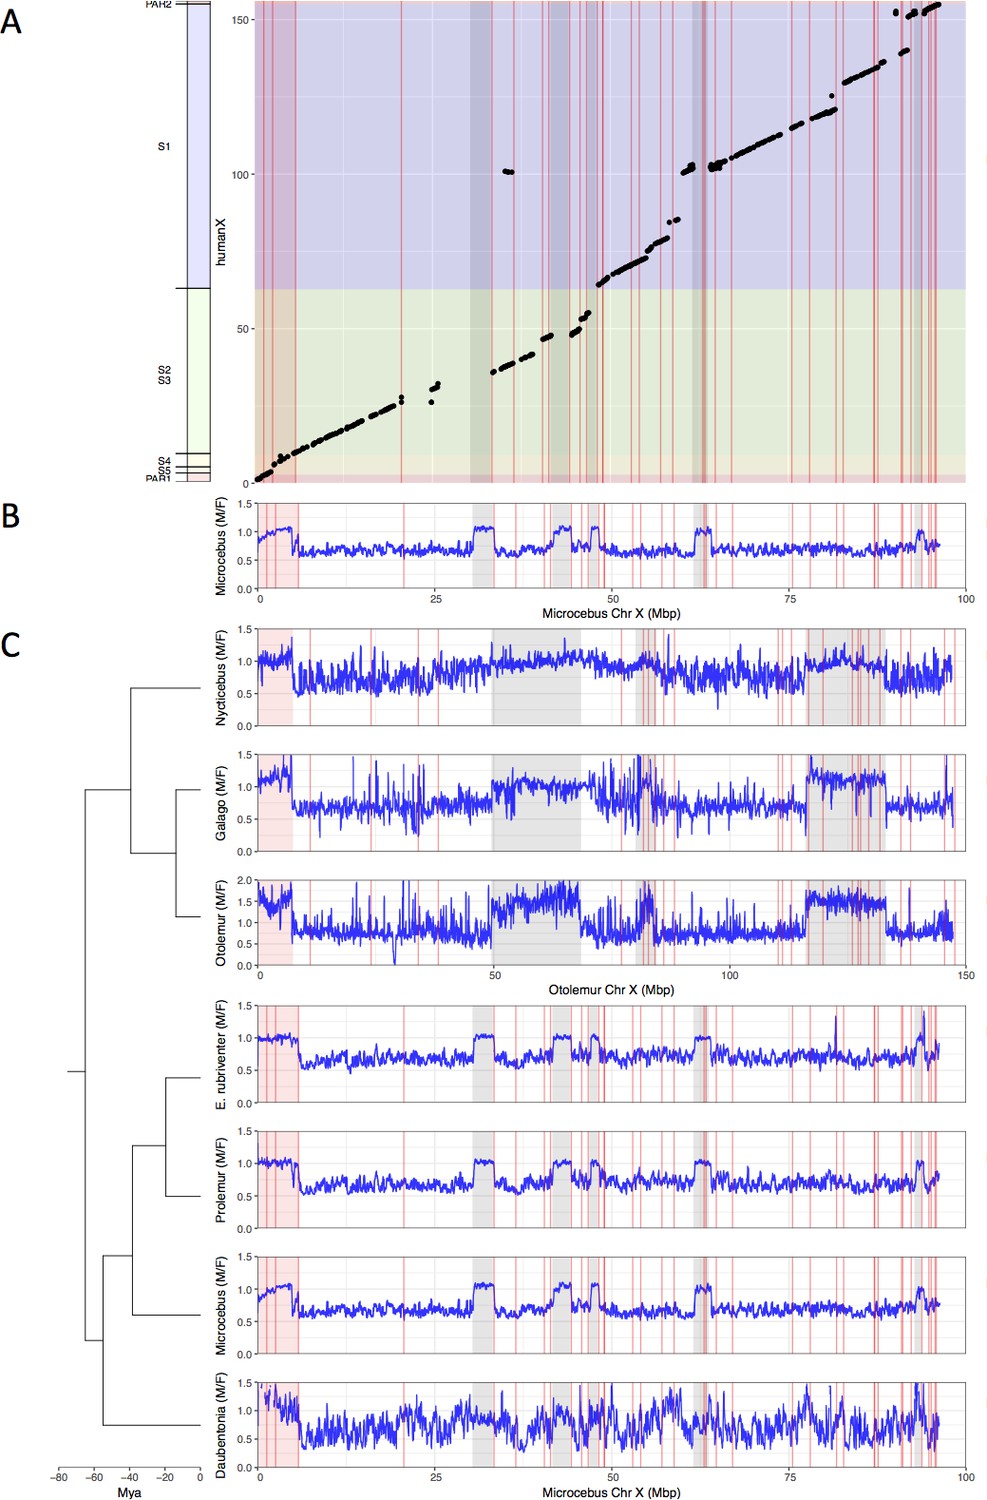
Identification the PAB in seven strepsirrhine species.
(A) Synteny plot of the human and grey mouse lemur X chromosomes. The human X was used to order the grey mouse lemur scaffolds (see Materials and methods). Black dots represent orthologous genes between the human and grey mouse lemur X chromosomes. Human strata number and boundaries follow Skaletsky et al., 2003 and Hughes and Rozen, 2012. Note that old strata have been split into smaller strata in Pandey et al., 2013. Human strata are indicated by different colours. S4 and S5 are in yellow. PARs are in red.(B) M:F read depth ratio along the grey mouse lemur X chromosome. Inferred PAR is shown in red. Regions of elevated M:F coverage ratio (inferred PAR plus other regions in grey) are indicated on panel A plot. (C) M:F read depth ratio for all seven strepsirrhine species. Inferred PARs for both the lemurs and the lorises are shown in red. Details on the PAR and the grey regions of the lorises can be found in Figure 1—figure supplement 1. In all panels, red lines indicate scaffold boundaries. See Materials and methods and Supplementary file 1B for the detailed analysis of the regions with elevated M:F coverage ratio shown in grey.
Figure 1—figure supplement 1
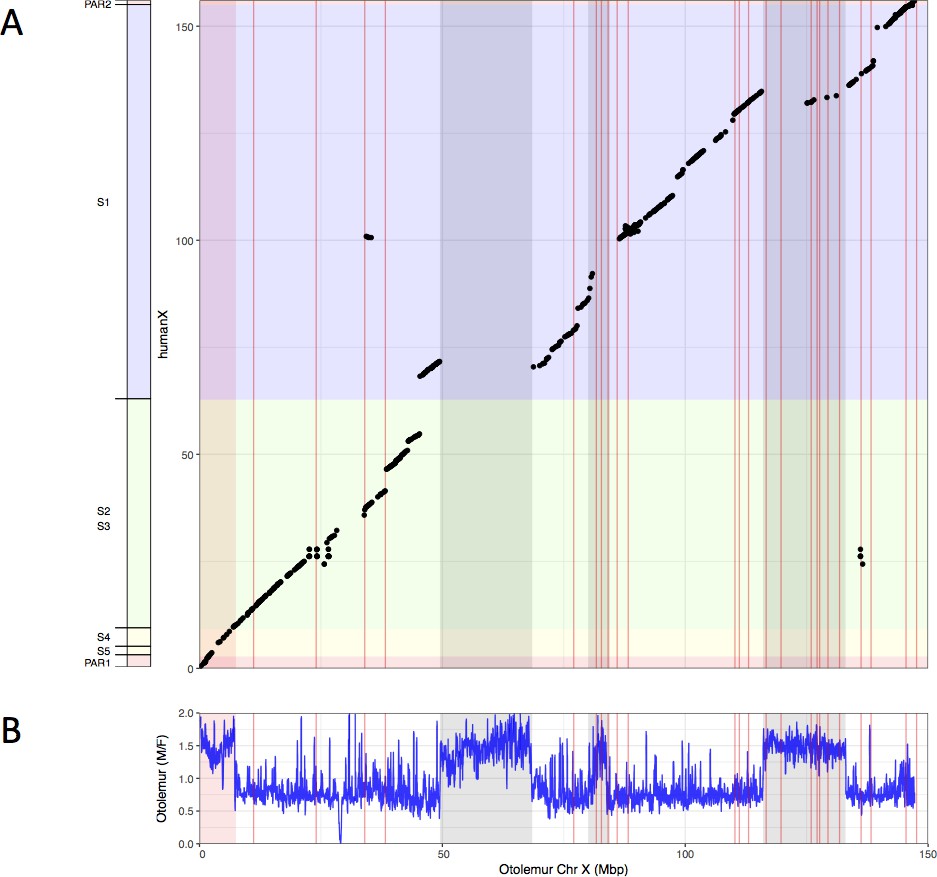
Synteny analysis of northern greater galago and human X chromosomes.
(A) Synteny plot of the human and northern greater galago X chromosomes. (B) M:F read depth ratio along the northern greater galago X chromosome. See legend of Figure 1 for more details.
Figure 1—figure supplement 2
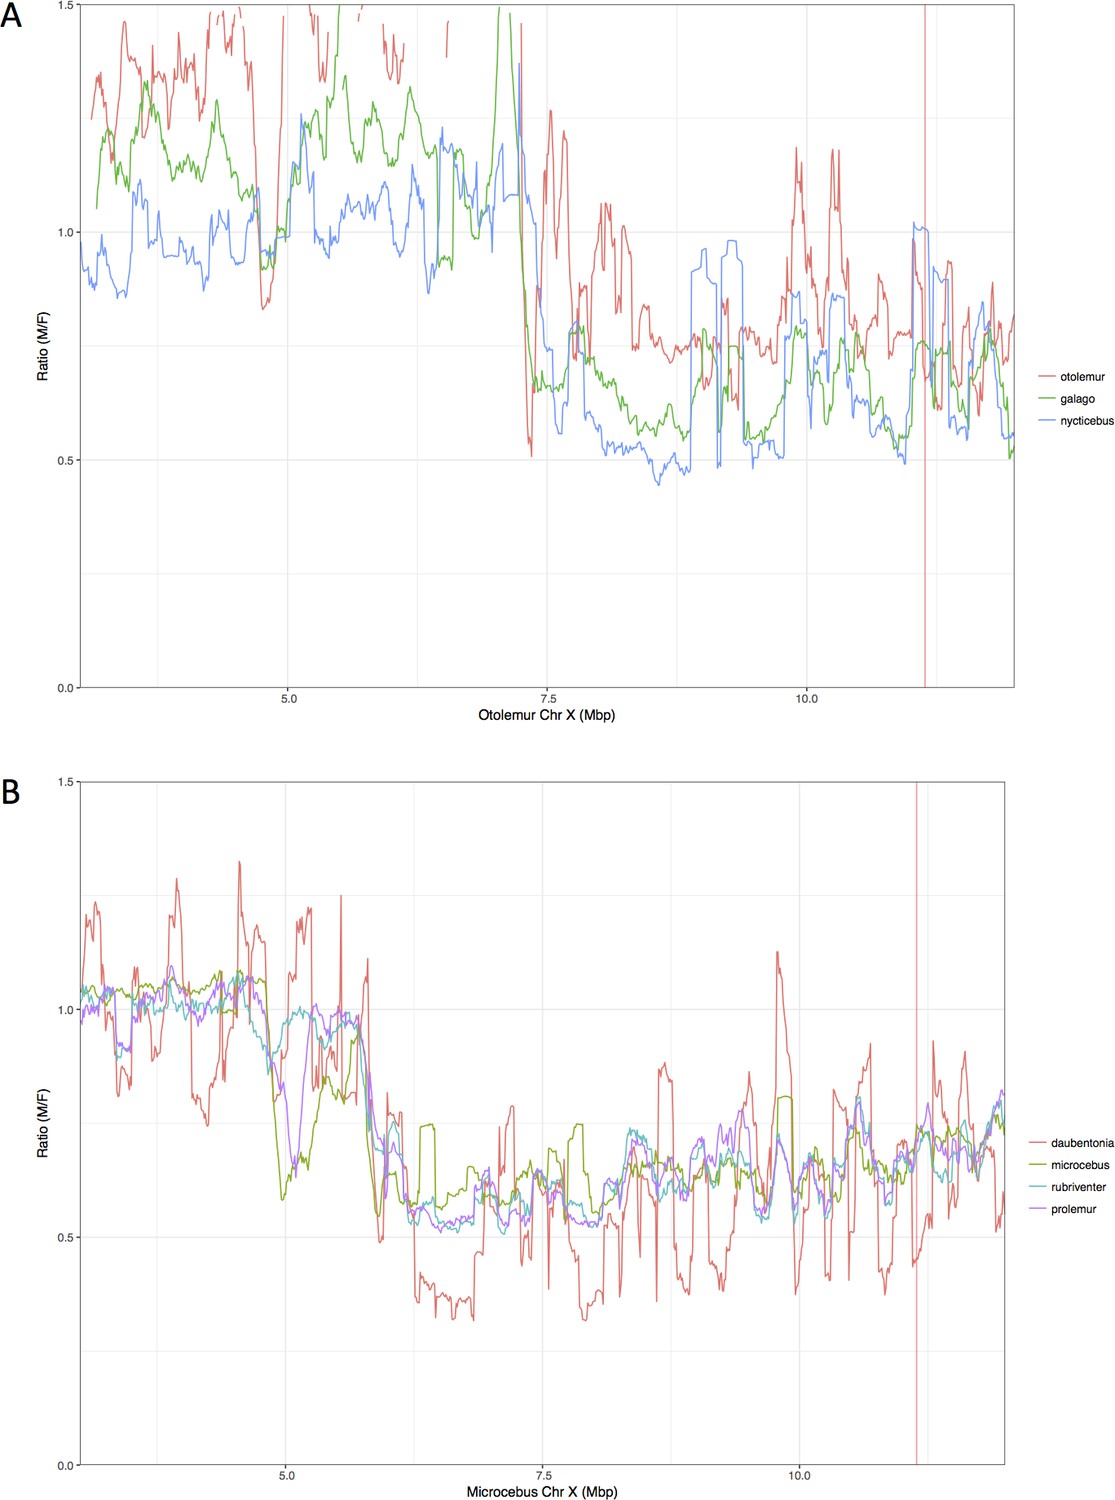
Zoom-in on the inferred PABs.
(A) Combined M:F read depth ratio for northern greater galago (red), senegal bushbaby (green), slow loris (blue). (B) Combined M:F M:F read depth ratio for aye-ayes (red), grey mouse lemur (blue), red-bellied lemur (light blue), greater bamboo lemur (purple). Position of the PABs in lemurs and lorises is the same (see legend of Figure 1 for more details). Positions of the PABs in Mb shown here differ because of differences in the X chromosome assembly between M. murinus and O. garnetti.
Figure 2
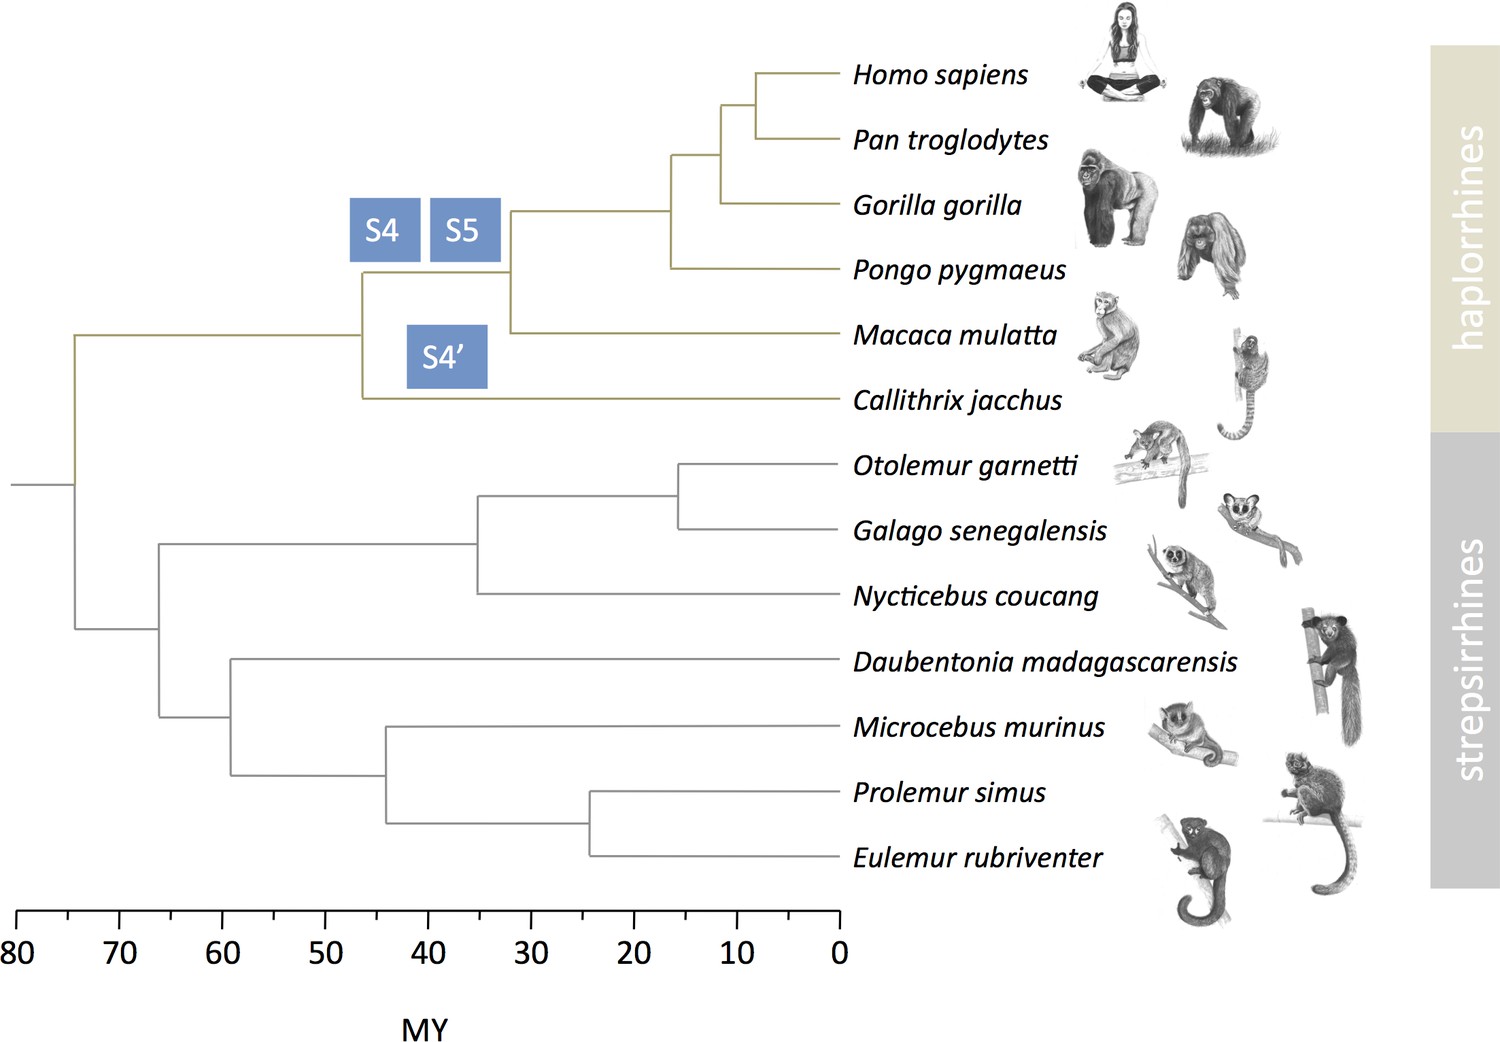
Strata formation in primates.
Data on strata in haplorrhines are from Lahn and Page, 1999, Skaletsky et al., 2003, Ross et al., 2005, Hughes and Rozen, 2012, Hughes et al., 2012, Cortez et al., 2014. Data on strepsirrhines are from this study. The phylogenetic tree and divergence times are from Horvath et al., 2008, Pozzi et al., 2014. Drawings of primates were prepared by Philippe Faivre.
Figure 3
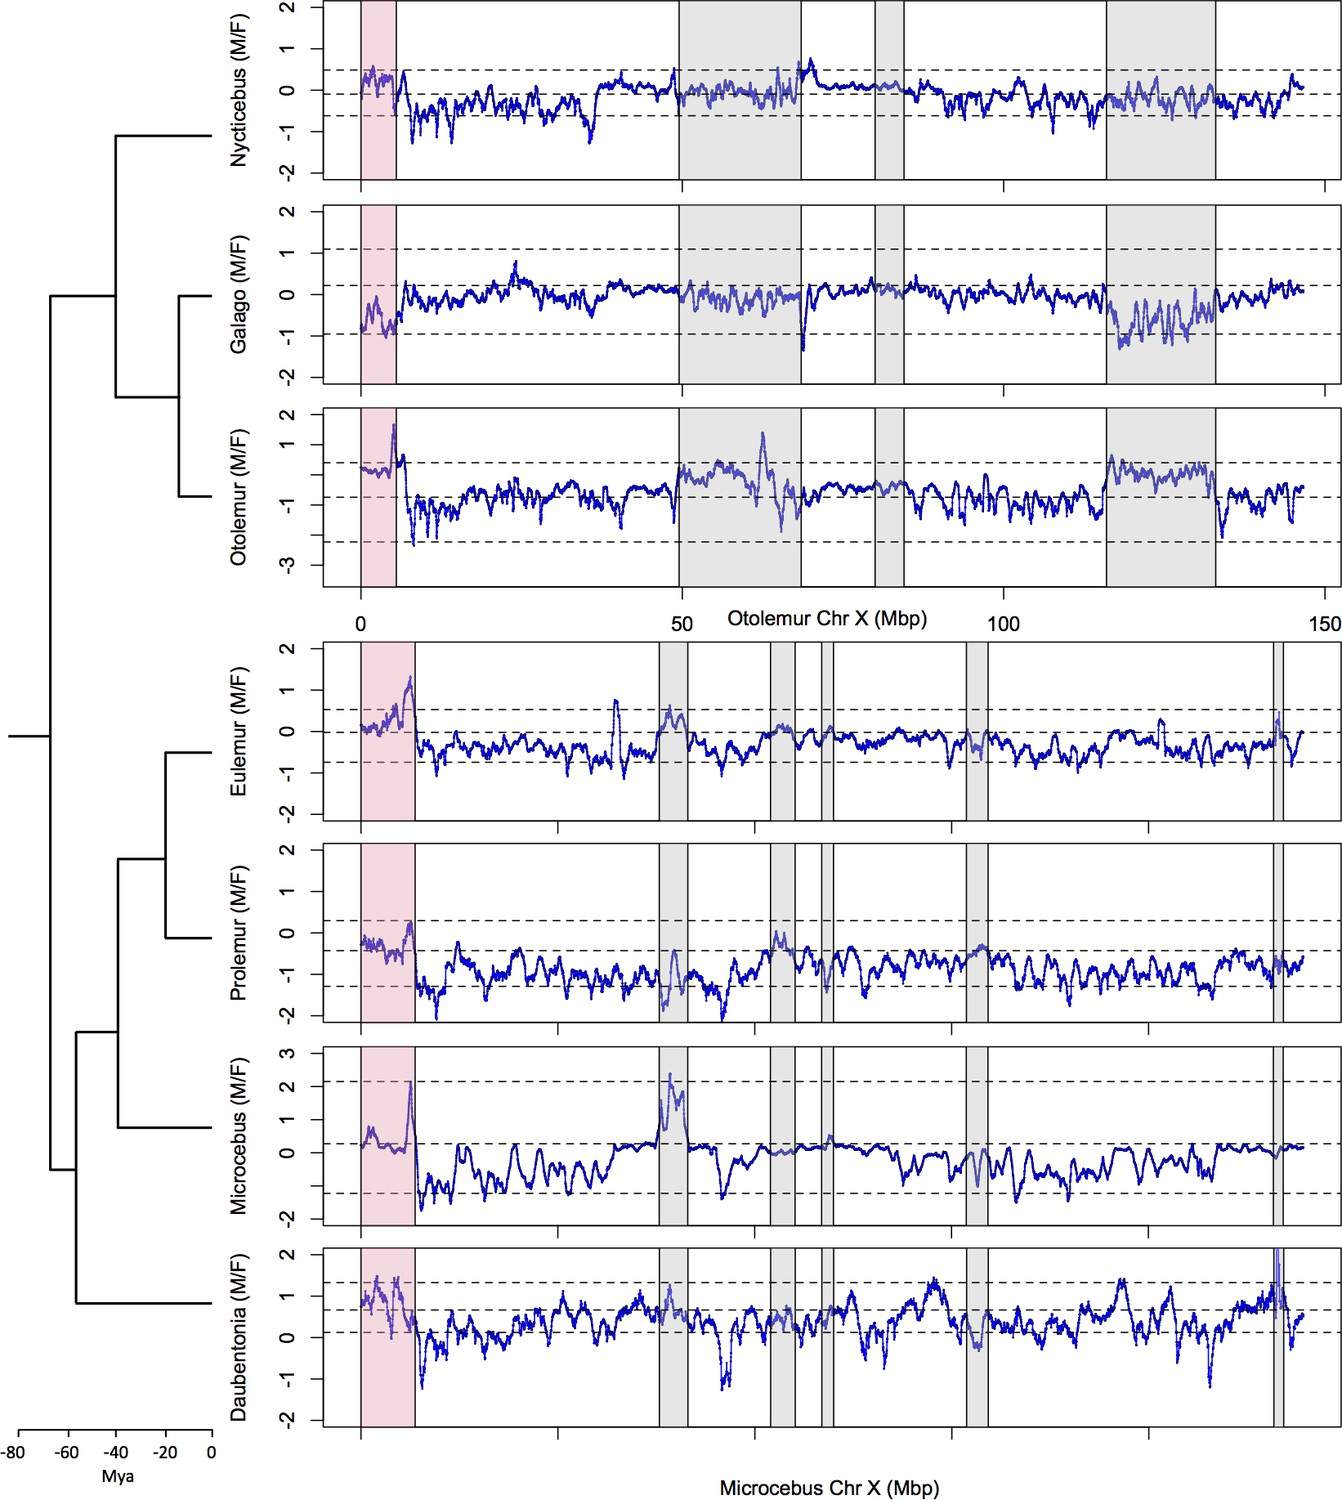
SNP density analysis.
M:F SNP density ratio (ln scale) for all seven strepsirrhine species (see Materials and methods for details). Dashed lines indicate the mean M:F SNP density across sliding windows of the same size on chromosome 4, the 97.5 and 2.5% quantiles, to show the variation across the autosomes. See legend of Figure 1 for more details.
Tables
Table 1
Measures of sexual dimorphism and other features in the set of studied haplorrhine and strepsirrhine species.
| Species | Male canine height in mm (sexual selection) | Female canine height in mm (sexual selection) | Refs* | Combined testes mass in g (sperm competition) | Male body mass in g (sperm competition) | Refs* | Male body mass in g (sexual selection) | Female body mass in g (sexual selection) | Refs* | Social and mating system | Refs* |
|---|---|---|---|---|---|---|---|---|---|---|---|
| Callithrix jacchus | 5.08 | 4.81 | [1] | 1.3 | 320 | [1] | 317 | 324 | [1] | Multimale | [1] |
| D. madagascariensis | NA | NA | NA | NA | NA | NA | 2621 | 2446 | [8] | Multimale | [9] |
| E. rubriventer | 10.49 | 9.98 | [2] | 1.76 | 2512 | [1] | 1980 | 1940 | [1] | Monogamous | [1] |
| G. senegalensis | 4.01 | 3.61 | [2] | 1.66 | 210 | [3] | 227 | 199 | [2] | Unimale/Polygynous | [2] |
| Gorilla gorilla | 30.26 | 17.4 | [2] | 29.6 | 169000 | [1] | 170400 | 71500 | [1] | Polygynous | [1] |
| Homo sapiens | 10.85 | 9.97 | [2] | 40.5 | 66825 | [1] | 72100 | 62100 | [1] | Monogamous/Unimale/ Polygynous | [2] |
| Macaca mulatta | 16.97 | 8.13 | [2] | 46 | 9200 | [4] | 11000 | 8800 | [1] | Multimale | [1] |
| M. murinus | 2.07 | 2.08 | [2] | 2.49 | 60 | [5] | 59 | 63 | [2] | Unimale/Polygynous*** | [2] |
| N. coucang | 7.05 | 6.8 | [2] | 1.2 | 1058 | [6] | 679 | 626 | [2] | Unimale/Polygynous | [2] |
| O. garnettii | 6.53 | 6.04 | [2] | 8.93 | 320 | [7] | 794 | 734 | [2] | Unimale/Polygynous | [2] |
| Pan troglodytes | 21.72 | 15.26 | [2] | 128.9 | 44670 | [1] | 59700 | 45800 | [1] | Multimale | [1 , 10] |
| Pongo pygmaeus | 27 | 15.95 | [2] | 35.3 | 74640 | [1] | 78500 | 35800 | [1] | Unimale/Multimale | [2] |
| P. simus** | 5.94 | 5.91 | [2] | NA | NA | NA | 2532 | 2248 | [8] | Monogamous | [2] |
-
*References are [1] Lüpold et al., 2019, [2] Thorén et al., 2006, [3] Gomendio et al., 2011, [4] Harcourt et al., 1995, [5] Lüpold, 2013, [6] Anderson et al., 1999, [7] Dixson and Anderson, 2004, [8] Taylor and Schwitzer, 2011, [9] Mittermeier et al., 2013, [10] Soulsbury, 2010.**or Hapalemur griseus or H. alaotrensis ***or multimale, see Soulsbury, 2010. Male body mass values for sperm competition and sexual selection analyses of the same species may differ because they come from different sources (even when a single reference is mentioned).
Additional files
-
Supplementary file 1
Supplemetary Tables.
- https://cdn.elifesciences.org/articles/63650/elife-63650-supp1-v3.docx
-
Transparent reporting form
- https://cdn.elifesciences.org/articles/63650/elife-63650-transrepform-v3.docx
Download links
A two-part list of links to download the article, or parts of the article, in various formats.
Downloads (link to download the article as PDF)
Open citations (links to open the citations from this article in various online reference manager services)
Cite this article (links to download the citations from this article in formats compatible with various reference manager tools)
Evolutionary stasis of the pseudoautosomal boundary in strepsirrhine primates
eLife 9:e63650.
https://doi.org/10.7554/eLife.63650


