Protein-based condensation mechanisms drive the assembly of RNA-rich P granules
- HHMI and Department of Molecular Biology and Genetics, Johns Hopkins University School of Medicine, United States
Figures
Figure 1
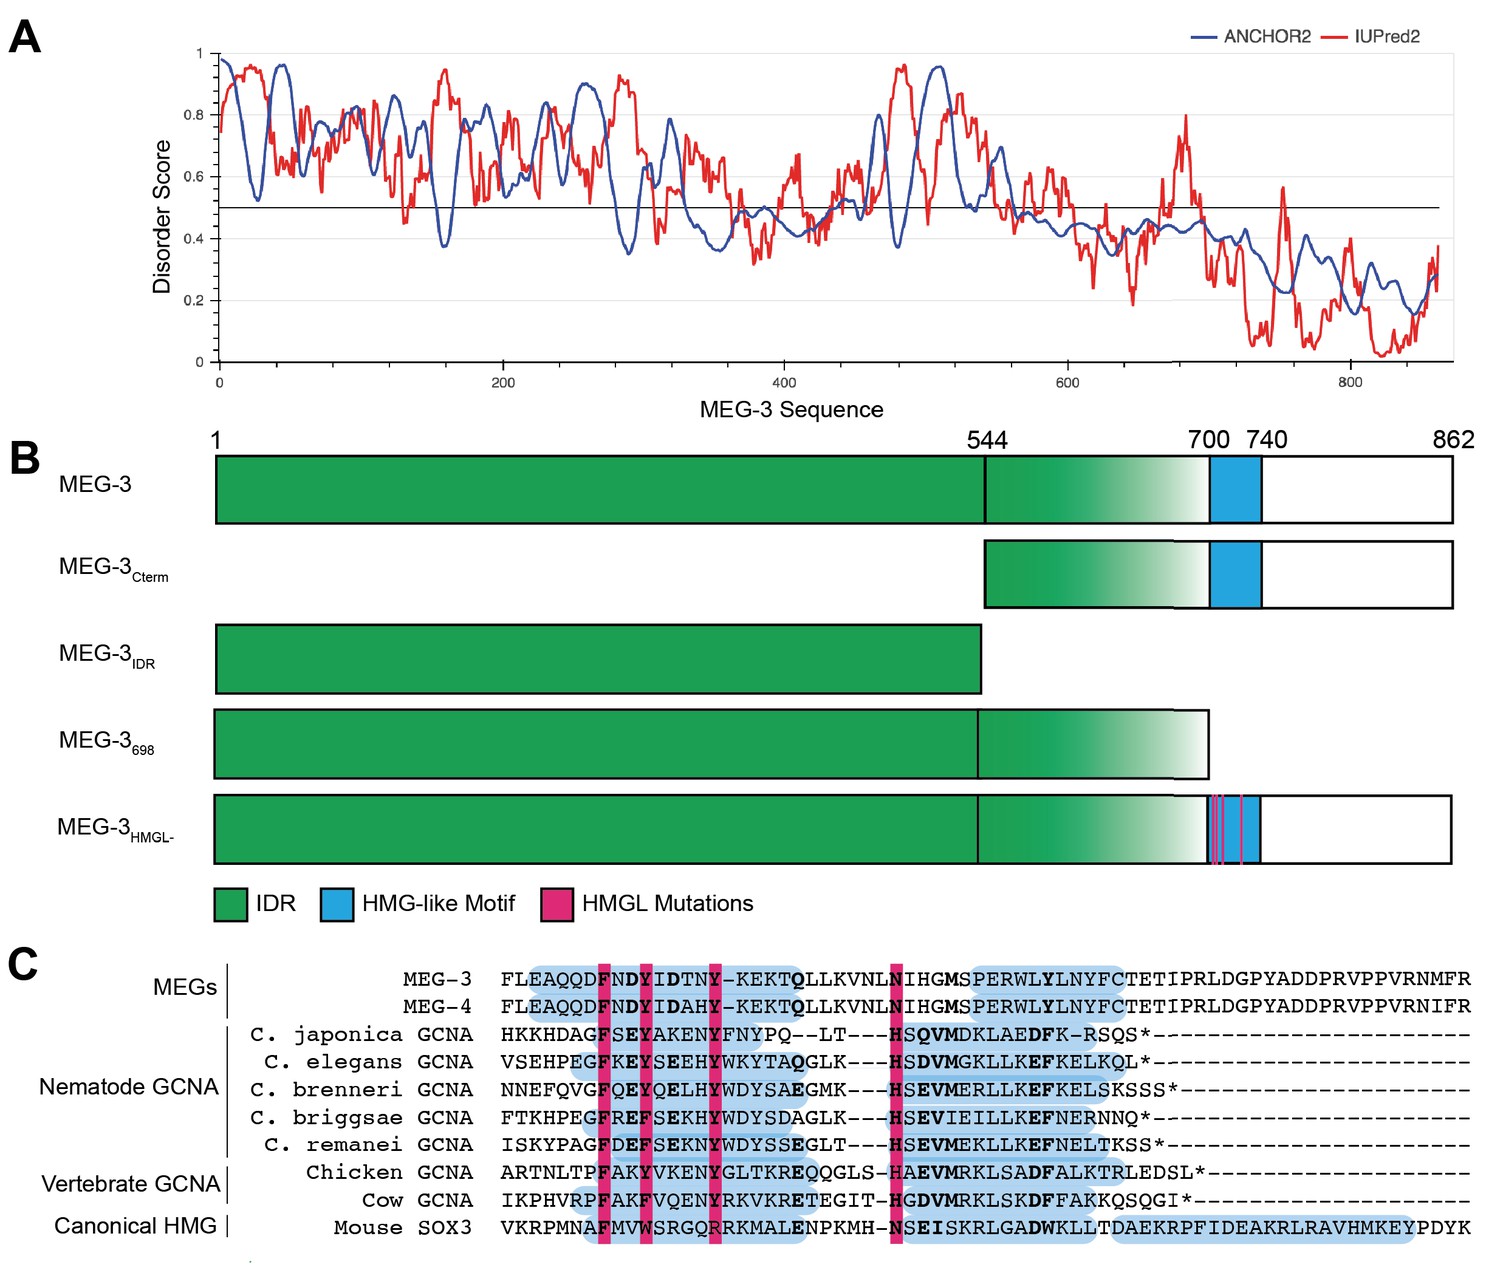
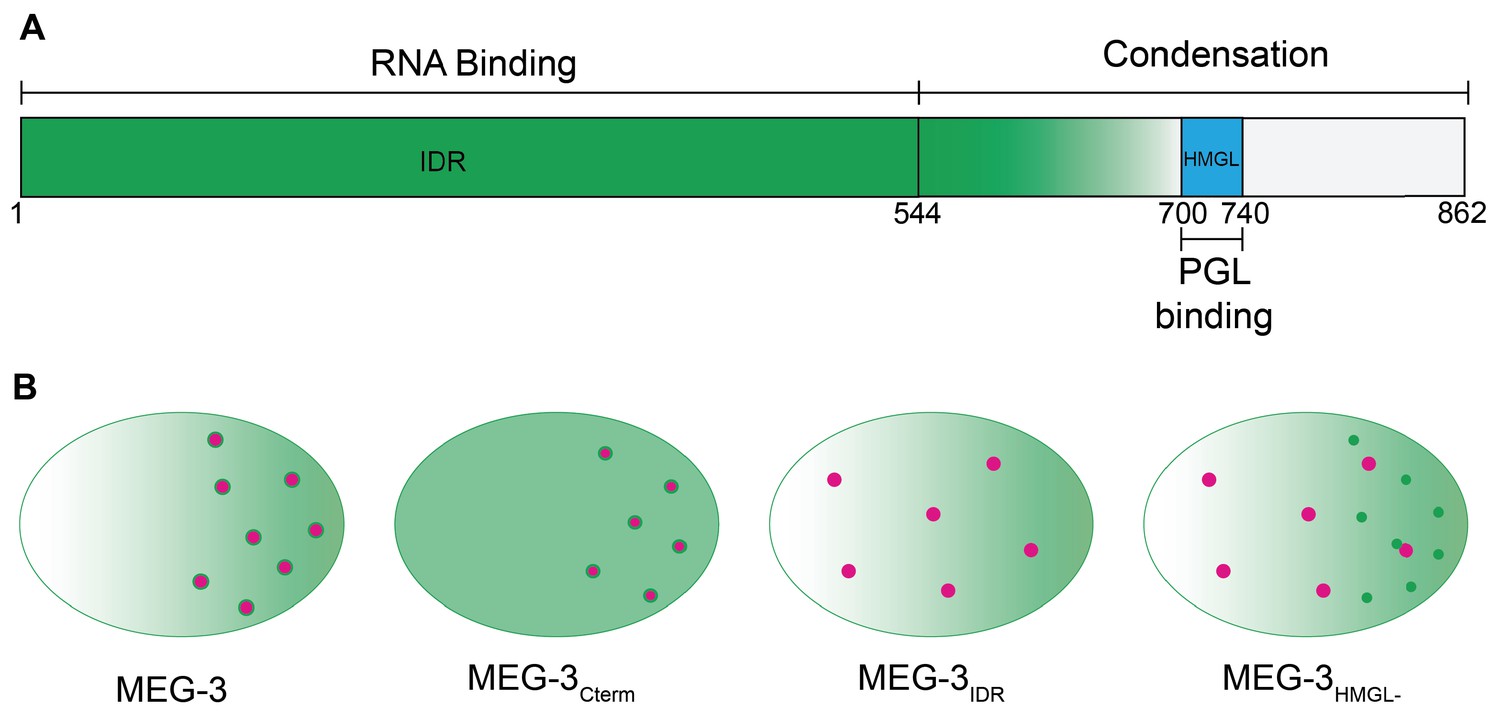
Domain organization of MEG-3.
(A) MEG-3 amino acid sequence (N- to C-terminus) on the X-axis is plotted against disorder score on the Y-axis as predicted by ANCHOR2 (blue) and IUPred2 (red) (Mészáros et al., 2018) with a range from 0 to 1, where 1 is the most disordered. (B) Schematics of wild-type MEG-3 and four MEG-3 variants analyzed in this study. Amino acid positions are aligned with (A). The disordered region (green) and HMG-like motif (blue) are indicated. Magenta bars (alanine substitutions) correspond to four conserved residues in the HMG-like motif shaded in magenta in (C). (C) Alignment of the HMG-like motif in MEG-3 and MEG-4 with the HMG-like motif in GCNA proteins (Carmell et al., 2016) and the canonical HMG box of mouse SOX3. Amino acids predicted to form alpha-helices are highlighted in blue (Drozdetskiy et al., 2015). Bold indicates positions with >70% amino acid similarity. Magenta bars indicate residues mutated to alanine in MEG-3HMGL-.
Figure 2 with 1 supplement
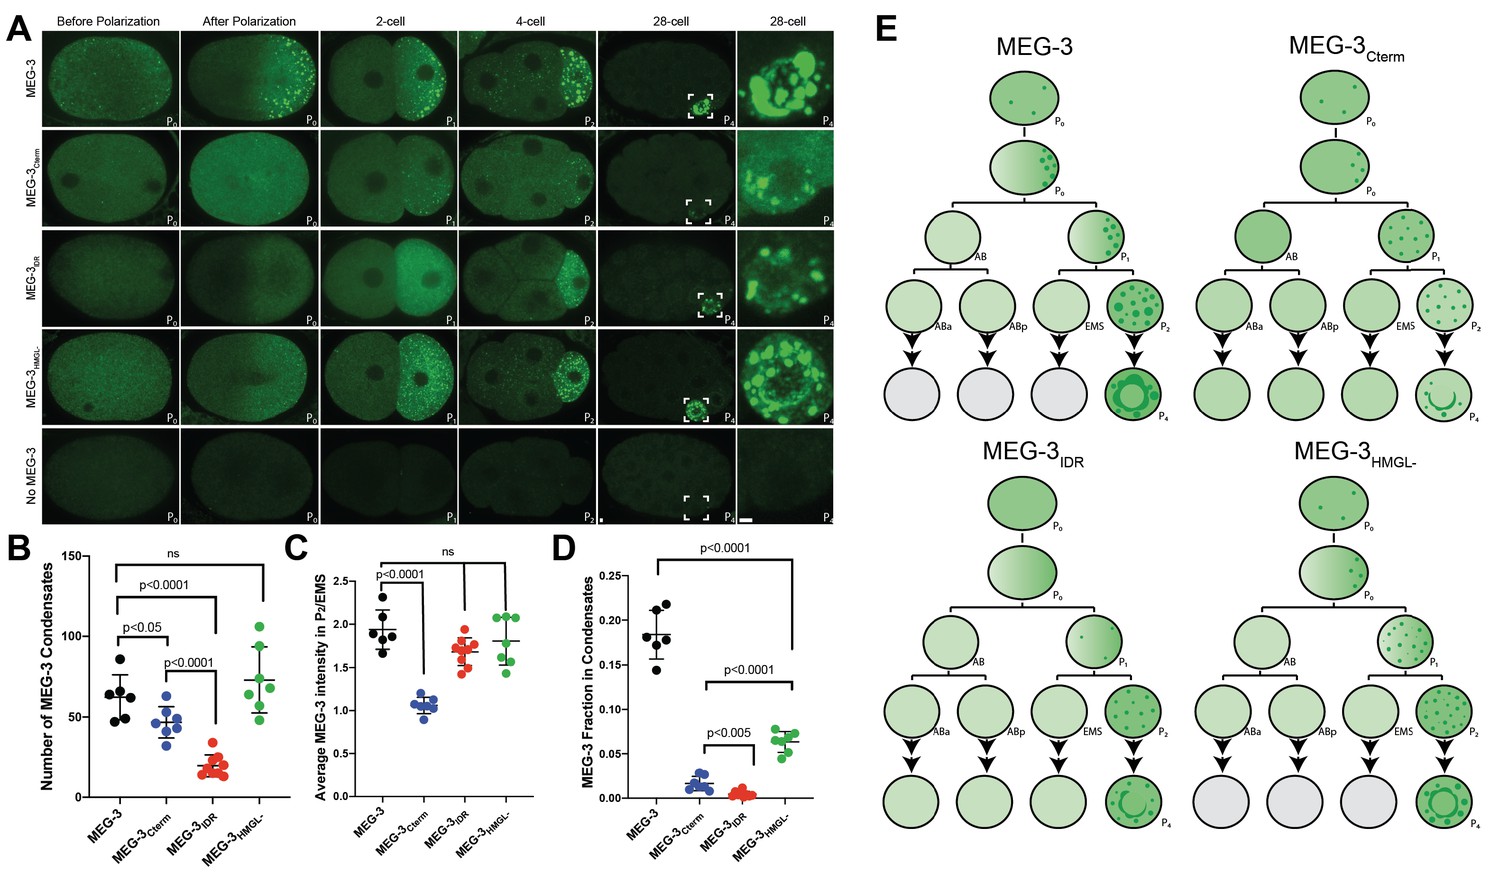
Localization of wild-type MEG-3 and variants in early embryos.
(A) Representative photomicrographs of embryos immunostained for OLLAS and expressing the indicated OLLAS-tagged MEG-3 derivatives. Last row shows meg-3 meg-4 embryos as negative control for OLLAS staining. Images are representative of stages indicated above each column. Before and after polarization are one-cell stage zygotes, other stages are indicated by the total number of cells in each stage. The name of the P (germ) blastomere is indicated in the bottom right of each image. A minimum of three embryos from two independent experiments were analyzed for each stage. Scale bars are 1 μm. All images are maximum projections normalized to same fluorescent intensity range except for the last column showing high-magnification views of P4 from the 28-cell stage image adjusted to highlight MEG-3 granules. (B) Scatterplot showing the number of MEG-3 condensates in the P2 blastomere in embryos expressing the indicated MEG-3 derivatives. Each dot represents an embryo. (C) Scatterplot showing enrichment of MEG-3 in the P2 blastomere over the somatic blastomere (EMS), calculated by dividing the average intensity in P2 by the average intensity in EMS. Each dot represents an embryo also included in the analysis shown in (B). (D) Scatterplot showing the fraction of the MEG-3 signal localized to condensates over total signal in P2. Each dot represents an embryo also included in the analysis in (B). (E) Summary of MEG-3 (green) distribution derived from data presented in (A). Each row corresponds to a different stage as in (A), starting with unpolarized zygote, polarized zygote, 2-cell, 4-cell, and 28-cell stage. Horizontal lines denote one-cell division, arrows indicate multiple divisions. Note that wild-type MEG-3 and MEG-3HMGL- are rapidly turned over in somatic cells after the four-cell stage (gray cells) as shown in Figure 2—figure supplement 1B, C.
-
Figure 2—source data 1
Condensation and enrichment of MEG-3 in four-cell embryos.
- https://cdn.elifesciences.org/articles/63698/elife-63698-fig2-data1-v3.xlsx
Figure 2—figure supplement 1
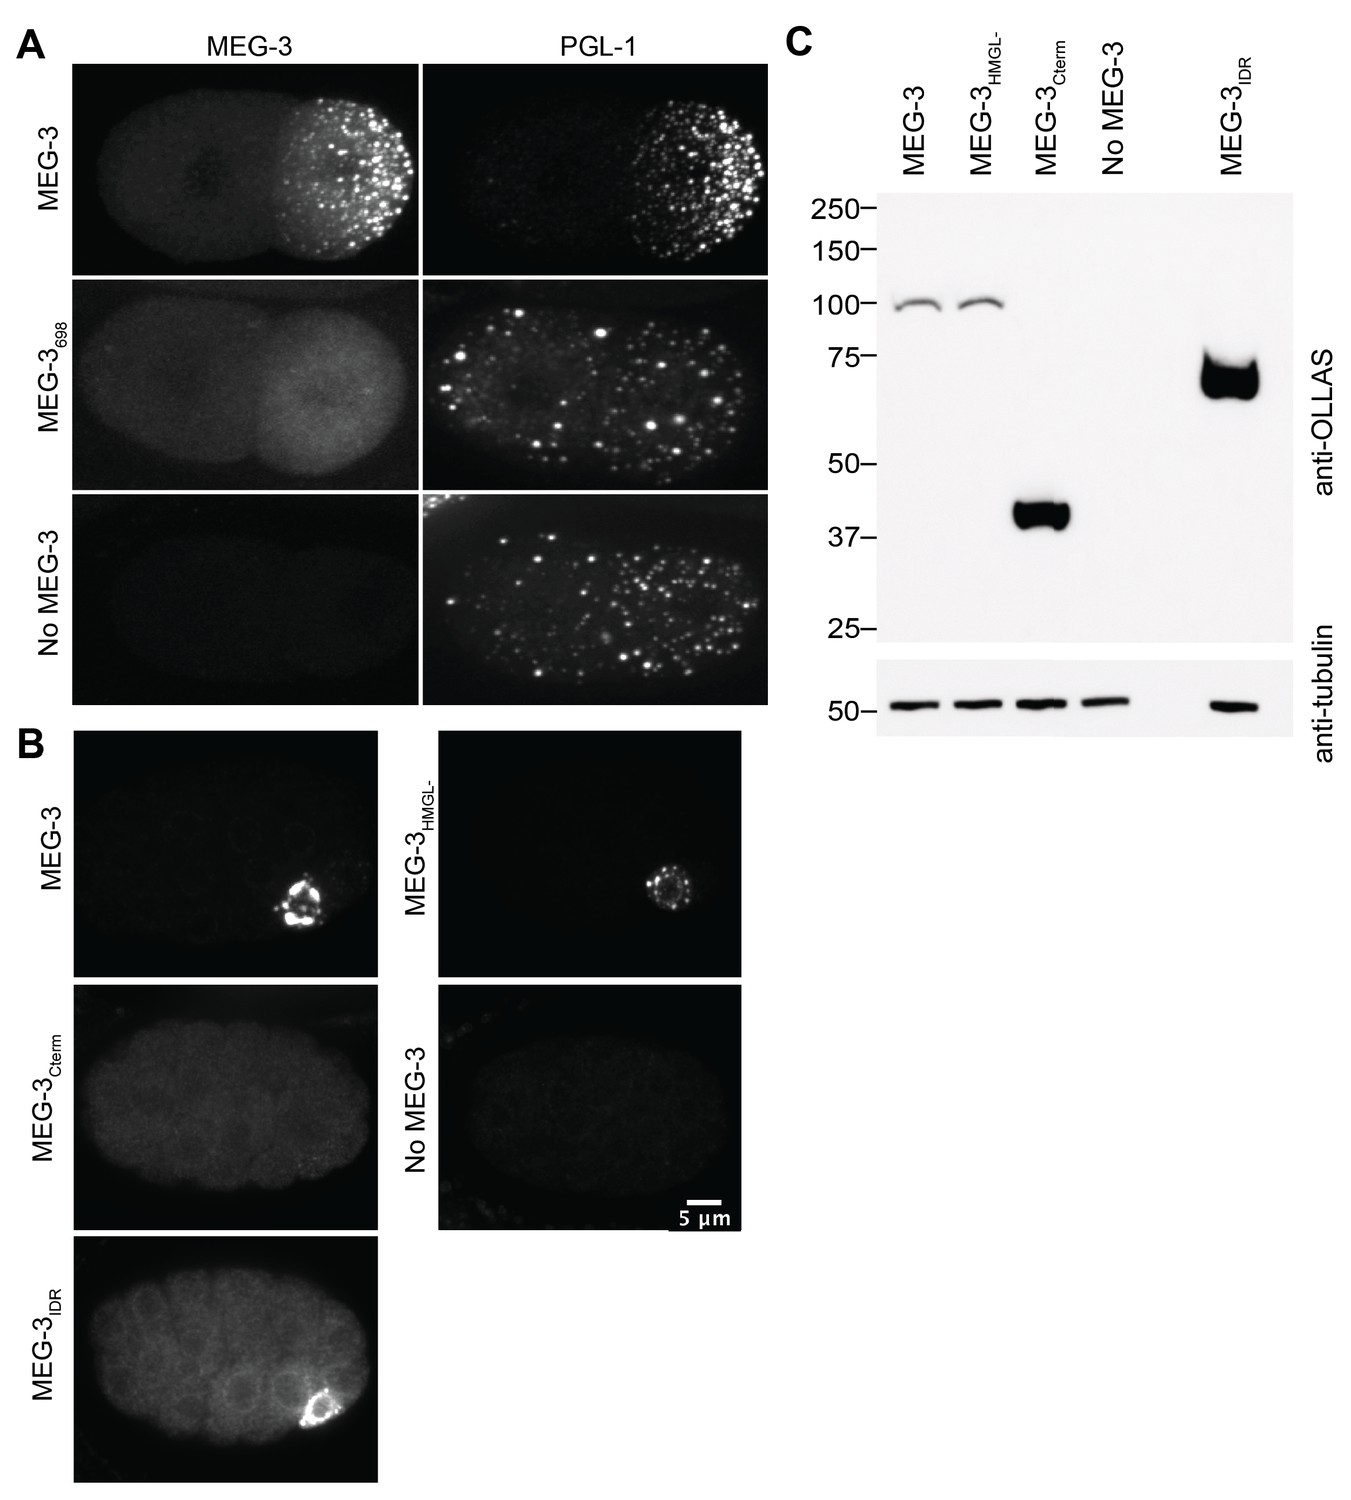
Additional characterization of wild-type MEG-3 and variants in embryos.
(A) Representative photomicrographs of two-cell embryos expressing the indicated MEG-3 derivatives and immunostained for MEG-3 (anti-OLLAS antibody) and PGL-1 (anti-PGL-1 antibody). (B) Representative photomicrographs of sum projections of 28-cell stage embryos expressing the indicated MEG-3 derivatives and immunostained for MEG-3. (C) Westerns of mixed-stage embryos (1–100 cell stage) harvested from synchronized worms expressing the indicated OLLAS-tagged MEG-3 derivatives.
Figure 3 with 1 supplement

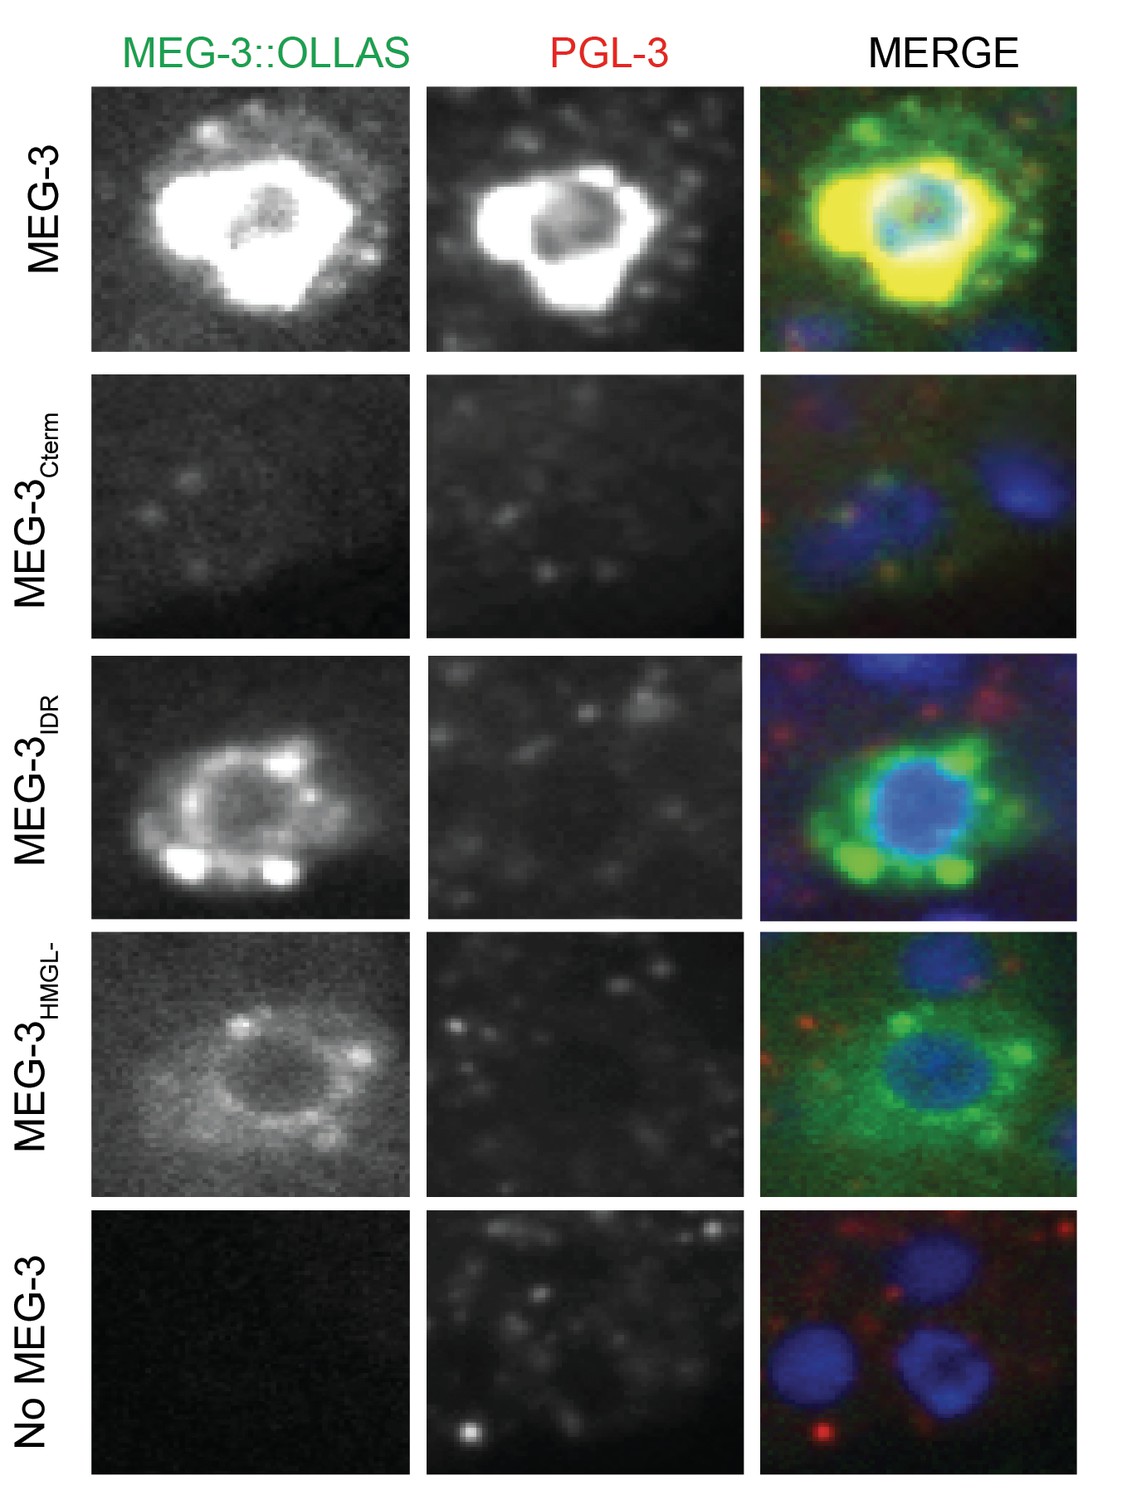
Localization of PGL-3 relative to wild-type MEG-3 and variants in two-cell embryos.
(A) Representative photomicrographs of two-cell embryos expressing the indicated MEG-3 mutants and immunostained for MEG-3 (anti-OLLAS antibody) and PGL-3 (anti-PGL-3 antibody). Scale bar is 5 μm. (B) High-magnification photomicrographs of individual MEG-3/PGL-3 assemblies in embryos expressing the indicated MEG-3 derivatives. White color in the merge indicates overlap. Scale bar is 1 μm. (C) Scatterplot of the enrichment of PGL-3 in P1 calculated by dividing the average intensity in P1 by the average intensity in the somatic blastomere (AB). Each dot represents an embryo.
-
Figure 3—source data 1
Enrichment of PGL-3 in P1 in embryos expressing wild-type MEG-3 and variants.
- https://cdn.elifesciences.org/articles/63698/elife-63698-fig3-data1-v3.xlsx
Figure 3—figure supplement 1
Localization of PGL-3 relative to wild-type MEG-3 and variants in P4 blastomeres.
Representative photomicrographs of a single confocal slice centered on the P4 blastomere nucleus of embryos expressing the indicated MEG-3 mutants and immunostained for MEG-3 (anti-OLLAS antibody) and PGL-3 (anti-PGL-3 antibody). Note co-localization of MEG-3Cterm and PGL-3. MEG-3Cterm is present at lower level in P4 compared to other MEG-3 derivatives, consistent with lack of enrichment in germ plasm starting in the one-cell stage (Figure 1).
Figure 4 with 3 supplements
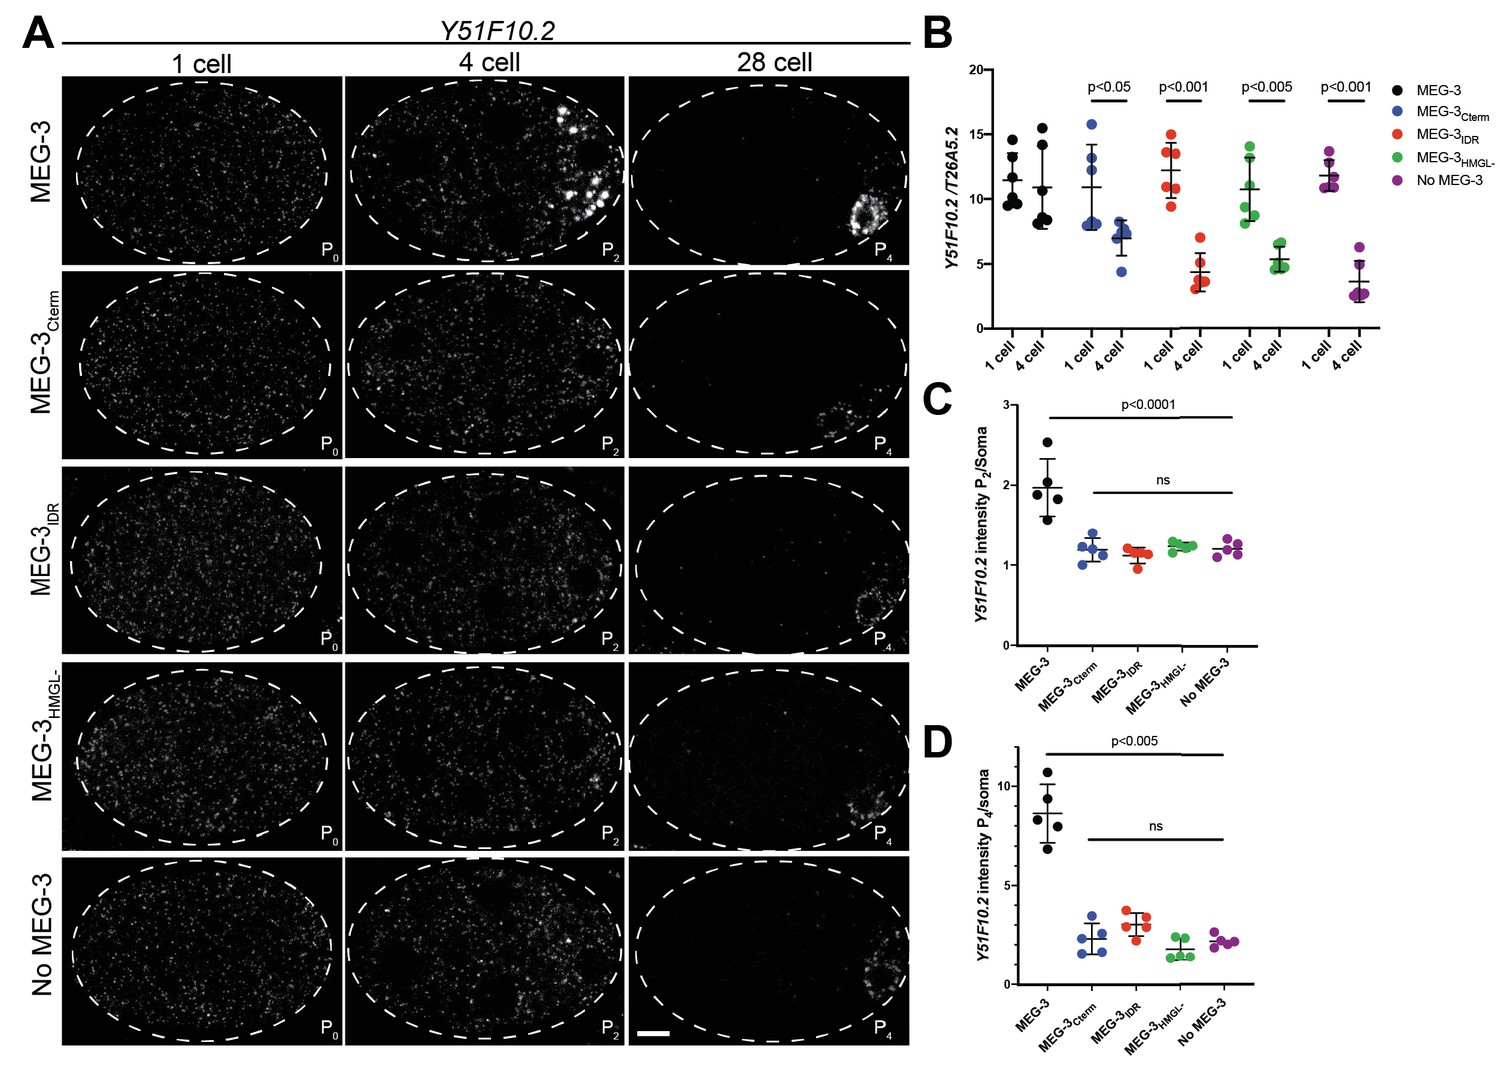
Distribution of Y51F10.2 mRNA in embryos expressing wild-type MEG-3 and variants.
(A) Representative photomicrographs of single confocal slices of fixed embryos expressing the indicated MEG-3 variants and hybridized to fluorescent probes complementary to the P granule-enriched mRNA Y51F10.2 (white signal). (B) Scatterplot showing the ratio of Y51F10.2 to T26A5.2 mRNA signal in P0 and P2 embryos expressing the indicated MEG-3 derivatives. Each dot represents an embryo. See Figure 4—figure supplement 1 for T26A5.2 mRNA localization and levels. (C) Scatterplot showing enrichment of Y51F10.2 mRNA in P2 relative to somatic blastomeres in embryos expressing the indicated MEG-3 derivatives. Each dot represents an embryo (Materials and methods). (D) Scatterplot showing enrichment of Y51F10.2 mRNA in P4 relative to somatic blastomeres in embryos expressing the indicated MEG-3 derivatives. Each dot represents an embryo (Materials and methods).
-
Figure 4—source data 1
Y51F10.2 mRNA levels in embryos expressing wild-type MEG-3 and variants.
- https://cdn.elifesciences.org/articles/63698/elife-63698-fig4-data1-v3.xlsx
Figure 4—figure supplement 1
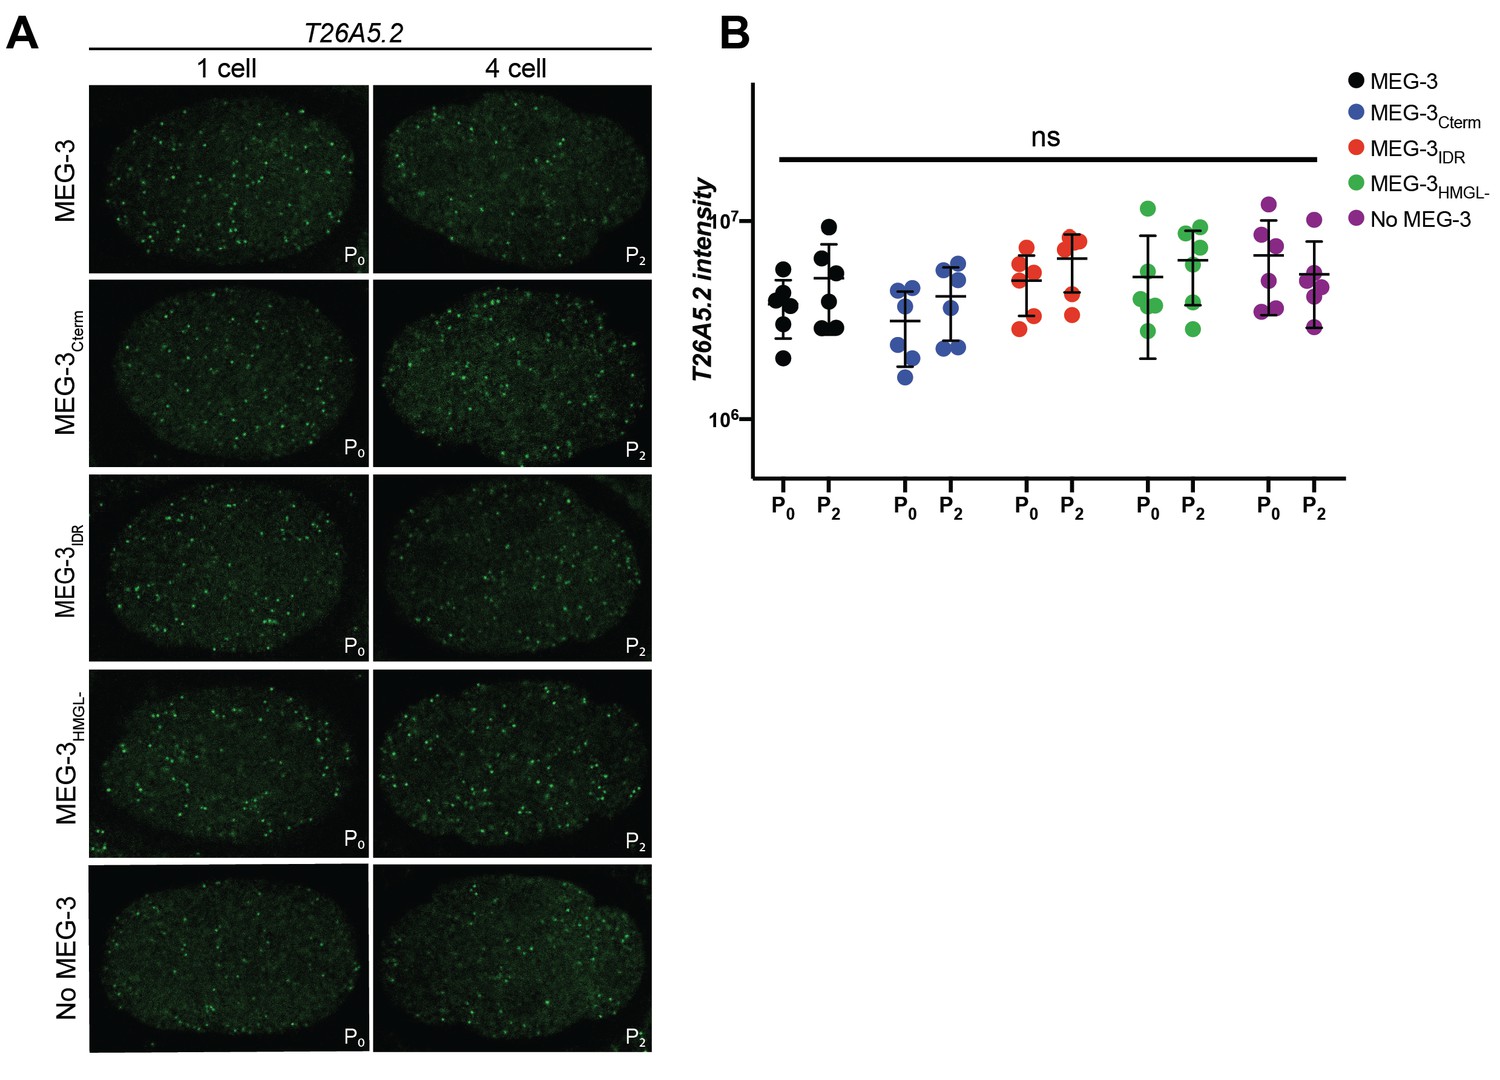
Distribution of T26A5.2 in embryos expressing wild-type MEG-3 and variants.
(A) Representative photomicrographs of single confocal slices of fixed embryos expressing the indicated MEG-3 variants and hybridized to fluorescent probes complementary to the mRNA T26A5.2. Images are of the same embryo and confocal slice as Figure 4A. (B) Scatterplot of the intensity of the T26A5.2 mRNA signal in P0 and P2 embryos expressing the indicated MEG-3 derivatives. Each dot represents an embryo analyzed in Figure 4B.
Figure 4—figure supplement 2
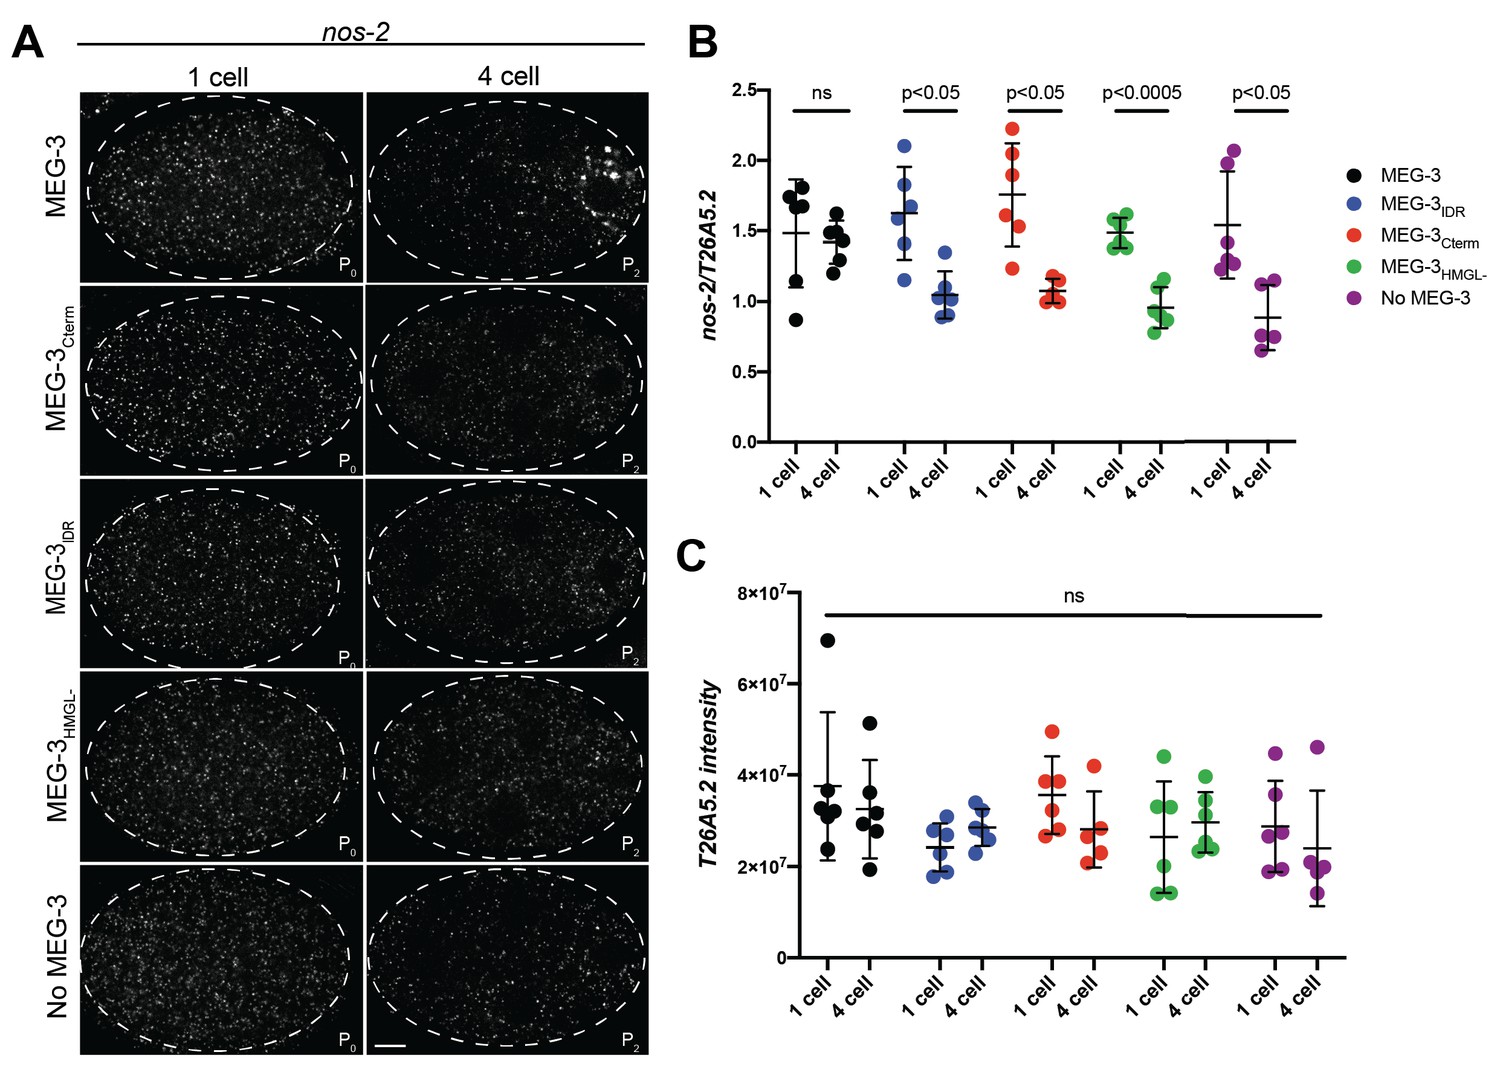
Distribution of nos-2 mRNA in embryos expressing wild-type MEG-3 and variants.
(A) Representative photomicrographs of single confocal slices of fixed embryos expressing the indicated MEG-3 variants and hybridized to fluorescent probes complementary to the P granule-enriched mRNA nos-2 (white signal). (B) Scatterplot showing the ratio of nos-2 to T26A5.2 mRNA signal in P0 and P2 embryos expressing the indicated MEG-3 derivatives. Each dot represents an embryo. (C) Scatterplot of the intensity of the T26A5.2 mRNA signal in P0 and P2 embryos expressing the indicated MEG-3 derivatives. Each dot represents an embryo analyzed in (B).
Figure 4—figure supplement 3
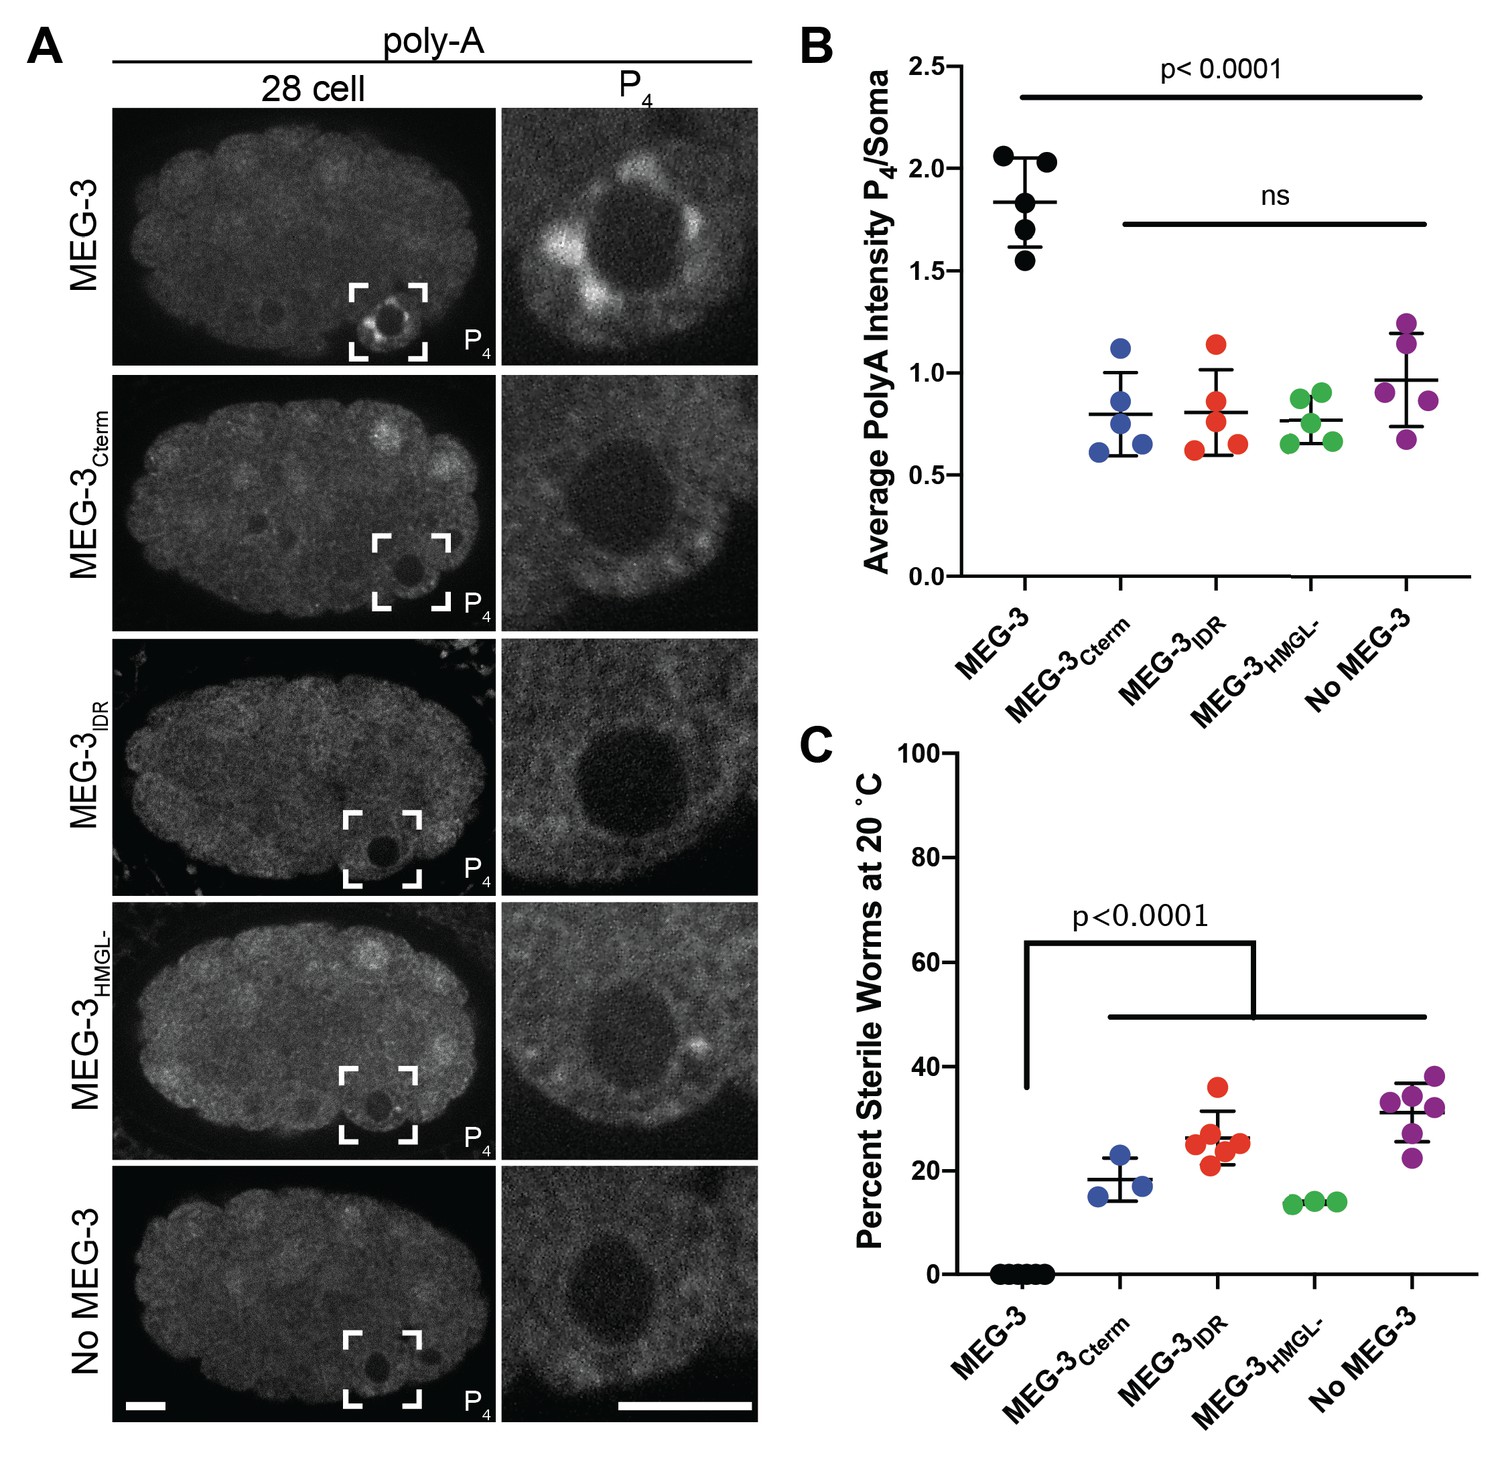
Distribution of polyadenylated mRNA in embryos expressing wild-type MEG-3 and variants.
(A) Representative photomicrographs of single confocal slices of fixed embryos expressing the indicated MEG-3 variants and hybridized to oligo-dT fluorescent probes to detect polyadenylated mRNAs. (B) Scatterplot showing enrichment of polyadenylated mRNA in P4 relative to somatic blastomeres in embryos expressing the indicated MEG-3 derivatives. Each dot represents an embryo (Materials and methods). (C) Plot of the percentage of sterile worms from mothers expressing the indicated MEG-3 derivatives raised at 20°. Each dot represents the 2 hr brood of 10 mothers (Materials and methods). Total number of worms scored is shown above.
Figure 5 with 1 supplement
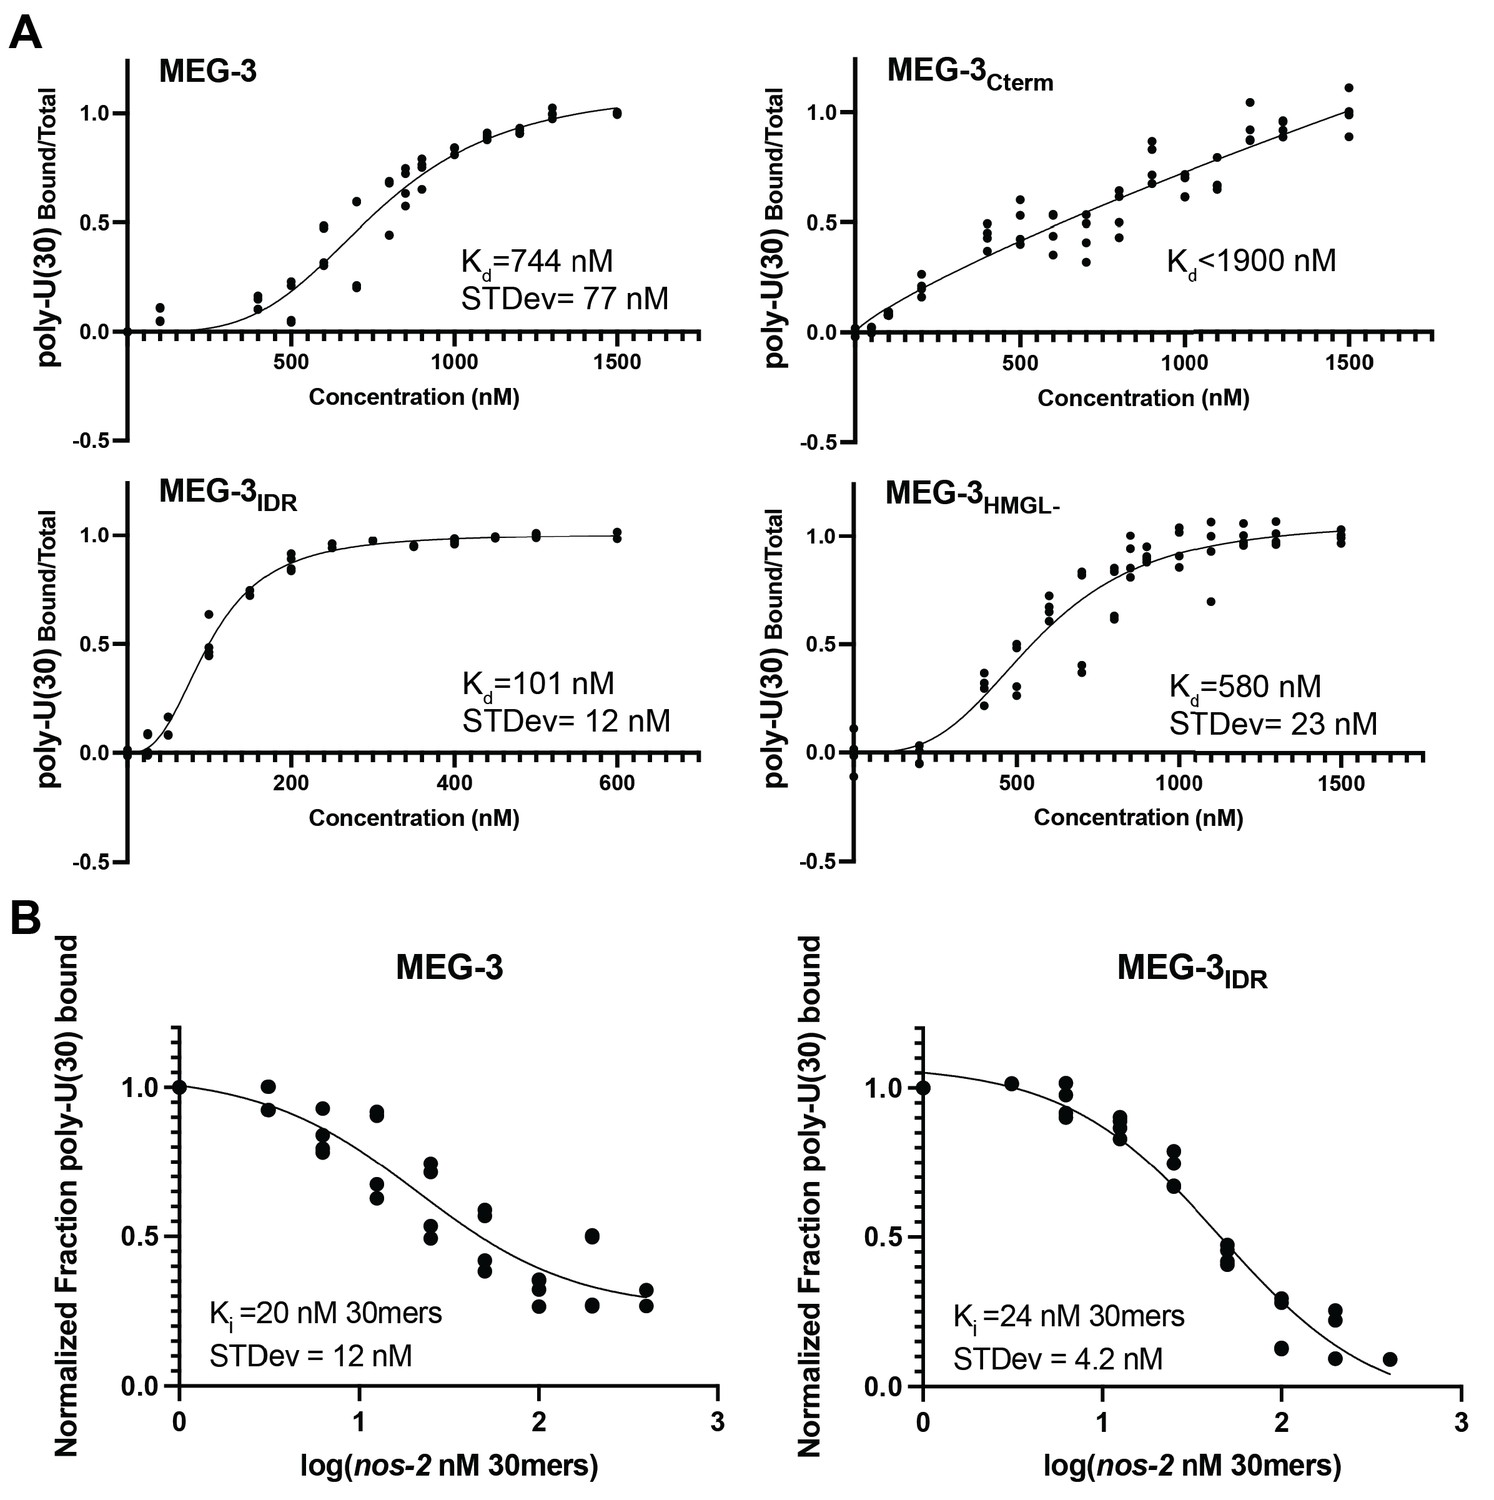
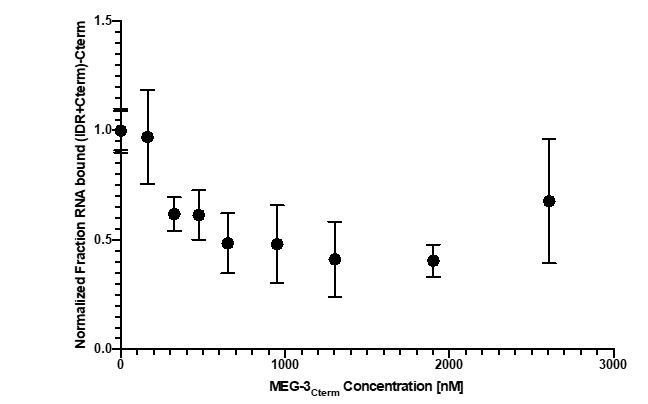
In vitro RNA binding of wild-type MEG-3 and variants.
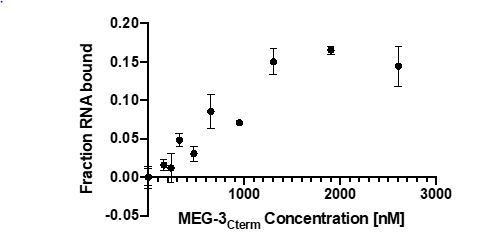
See Figure 5—figure supplement 1 for an SDS-PAGE gel of the purified proteins used in Figures 5, 6, 7. (A) 30U RNA-binding curves for MEG-3, MEG-3Cterm, MEG-3IDR, and MEG-3HMGL-. Protein concentration is plotted on the X-axis. The ratio of bound poly-U(30) RNA to total, normalized to the ratio at the maximum concentration, is plotted on the Y-axis. Each dot represents a replicate at a given concentration. The average Kd and standard deviation were calculated from four replicate curves fit independently to a specific binding with Hill slope model (Materials and methods). (B) Competitive nos-2 RNA-binding curves for MEG-3 and MEG-3IDR. The log of nos-2 RNA concentration is plotted on the X-axis. The ratio of bound poly-U(30) to total RNA, normalized to the ratio in the absence of nos-2, is plotted on the Y-axis. Each dot represents a replicate at a given concentration. The average Ki and standard deviation were calculated from four replicate curves fit independently to a one-site competitive binding model (Materials and methods).
-
Figure 5—source data 1
RNA binding of MEG-3 and variants in vitro.
- https://cdn.elifesciences.org/articles/63698/elife-63698-fig5-data1-v3.xlsx
Figure 5—figure supplement 1
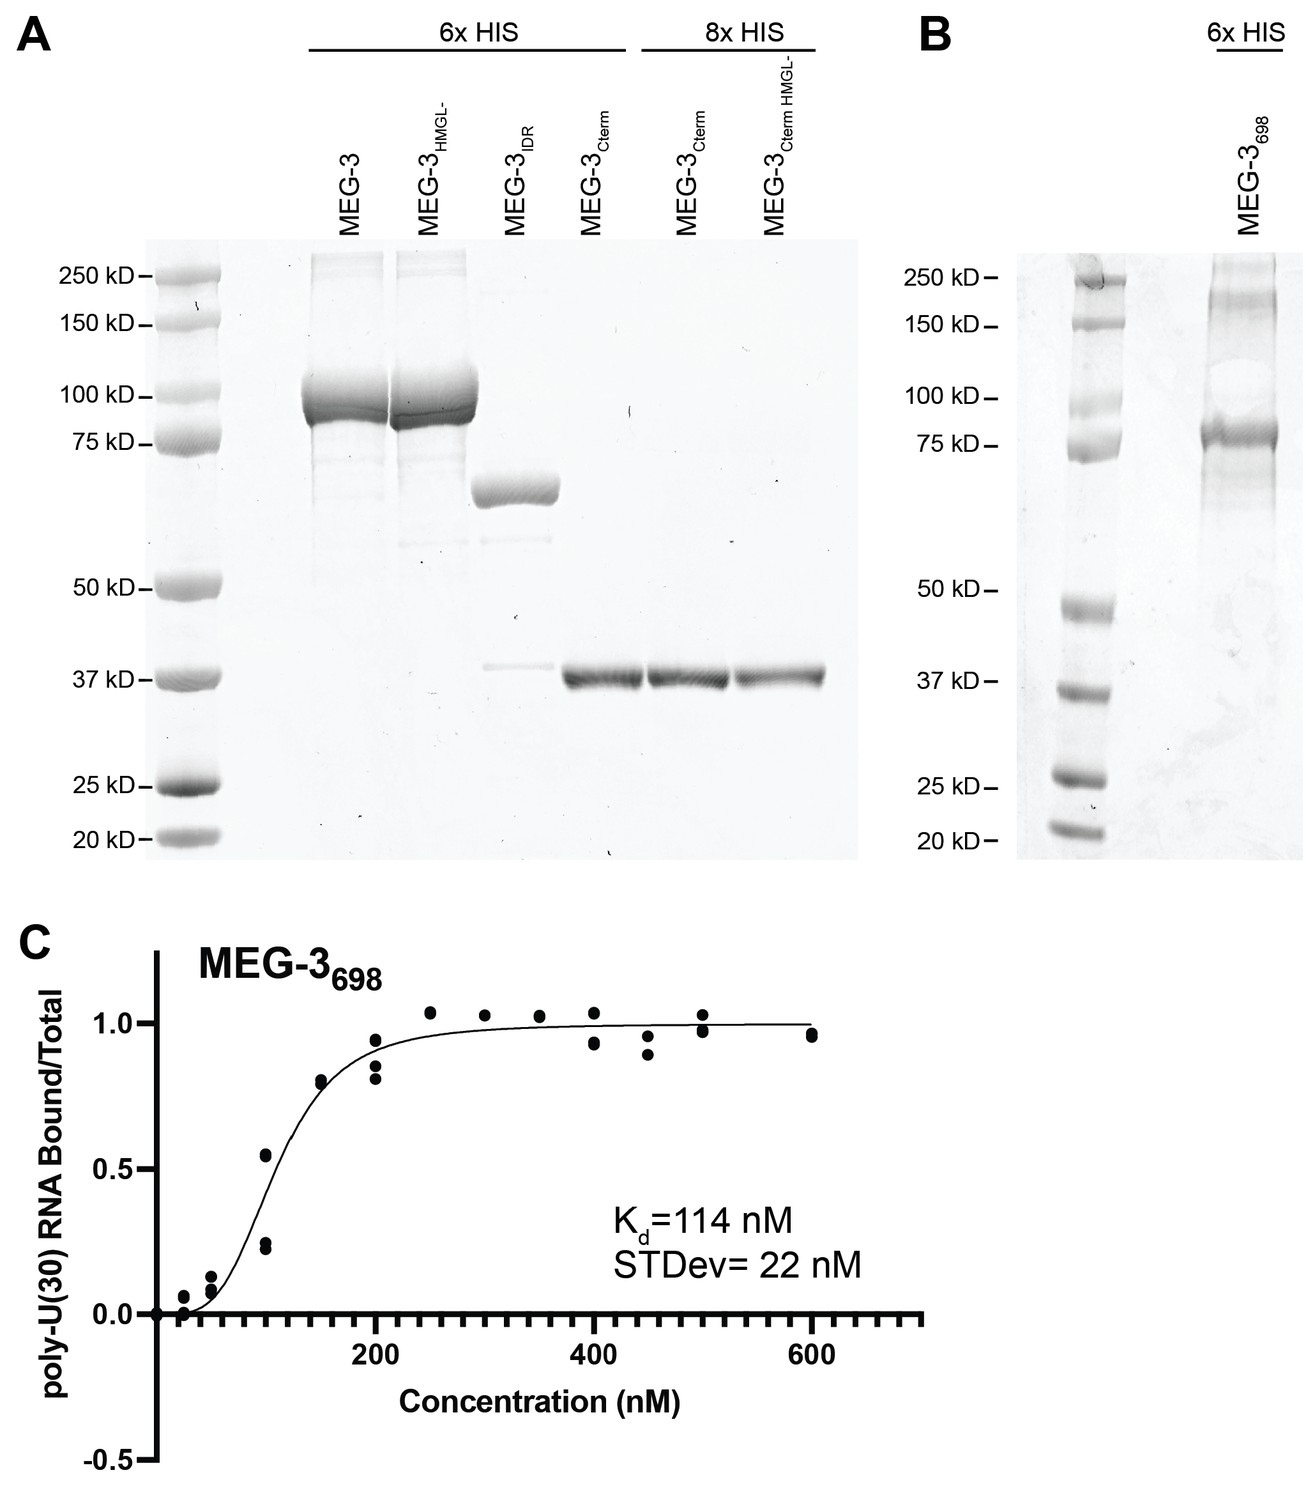
In vitro purified MEG-3 and variants.
(A, B) SDS-PAGE gels of the indicated purified MEG-3 variant proteins. (C) 30U RNA binding curve for MEG-3698. Protein concentration is plotted on the X-axis. The ratio of bound RNA to total RNA, normalized to the ratio at the maximum concentration, is plotted on the Y-axis. Each dot represents a replicate at a given concentration. The average Kd and standard deviation were calculated from four replicate curves fit independently to a specific binding with Hill slope model (Materials and methods).
Figure 6 with 3 supplements

In vitro condensation of wild-type MEG-3 and variants.
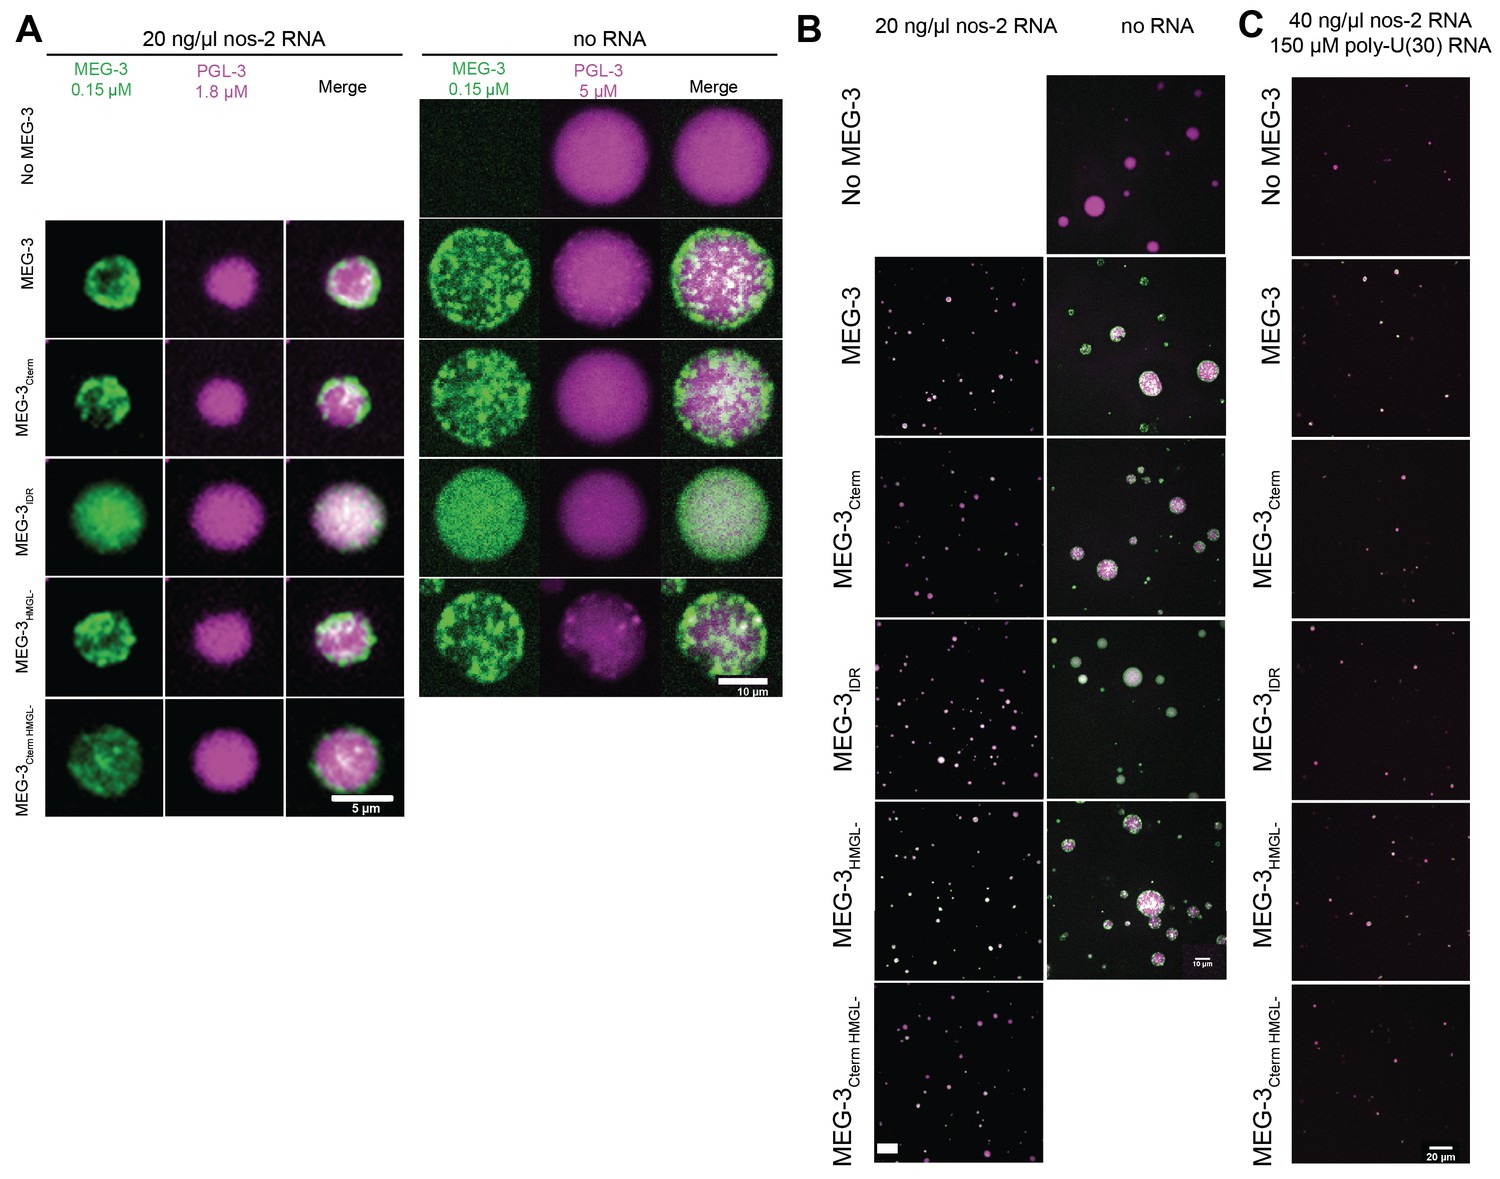
(A) Plot of the condensation of MEG-3 and MEG-3 derivatives incubated with 20 ng/μL nos-2 mRNA and 150 nM salt. MEG-3 condensates were identified in ImageJ (Materials and methods). The total fluorescence intensity in condensates normalized to the total image intensity is plotted on the X-axis. The total intensity of RNA in condensates divided by the intensity of MEG-3 in condensates is plotted on the Y-axis. Each dot represents the mean of three replicates, and bars represent the standard deviation; three images from the same slide were quantified in each replicate. Representative photomicrographs and values at additional NaCl and RNA conditions are shown in Figure 6—figure supplement 1. (B) Representative photomicrographs of 150 nM MEG-3 and MEG-3 derivatives (trace-labeled with Alexa647) incubated for 30 min with 2.5 μM PGL-3 (trace-labeled with Dylight488), 40 ng/μL nos-2 RNA (trace-labeled with Alexa555), and 150 μM poly-U(30) RNA. Full-field photomicrographs and photomicrographs of MEG-3/PGL-3 co-condensates with either 20 ng/μL nos-2 RNA or no RNA in Figure 6—figure supplement 3. (C) Scatterplot of nos-2 RNA enrichment in PGL-3 condensates with and without MEG-3 or MEG-3 variants in the presence of 150 μM poly-U30 RNA. The intensity of nos-2 fluorescence in condensates divided by the total image intensity and normalized to the No MEG-3 condition is plotted on the Y-axis. Each dot represents a replicate; three images from the same slide were quantified in each replicate. (D) Scatterplot of MEG-3 and MEG-3 variants enrichment in PGL-3 condensates in the presence of 40 ng/μL nos-2 RNA and 150 μM 30U RNA. The intensity of MEG-3 fluorescence in condensates divided by the total image intensity and normalized to the wild-type MEG-3 condition is plotted on the Y-axis. Each dot represents a replicate; three images from the same slide were quantified in each replicate.
-
Figure 6—source data 1
MEG-3 and variants condensation with and without PGL-3 in vitro.
- https://cdn.elifesciences.org/articles/63698/elife-63698-fig6-data1-v3.xlsx
Figure 6—figure supplement 1
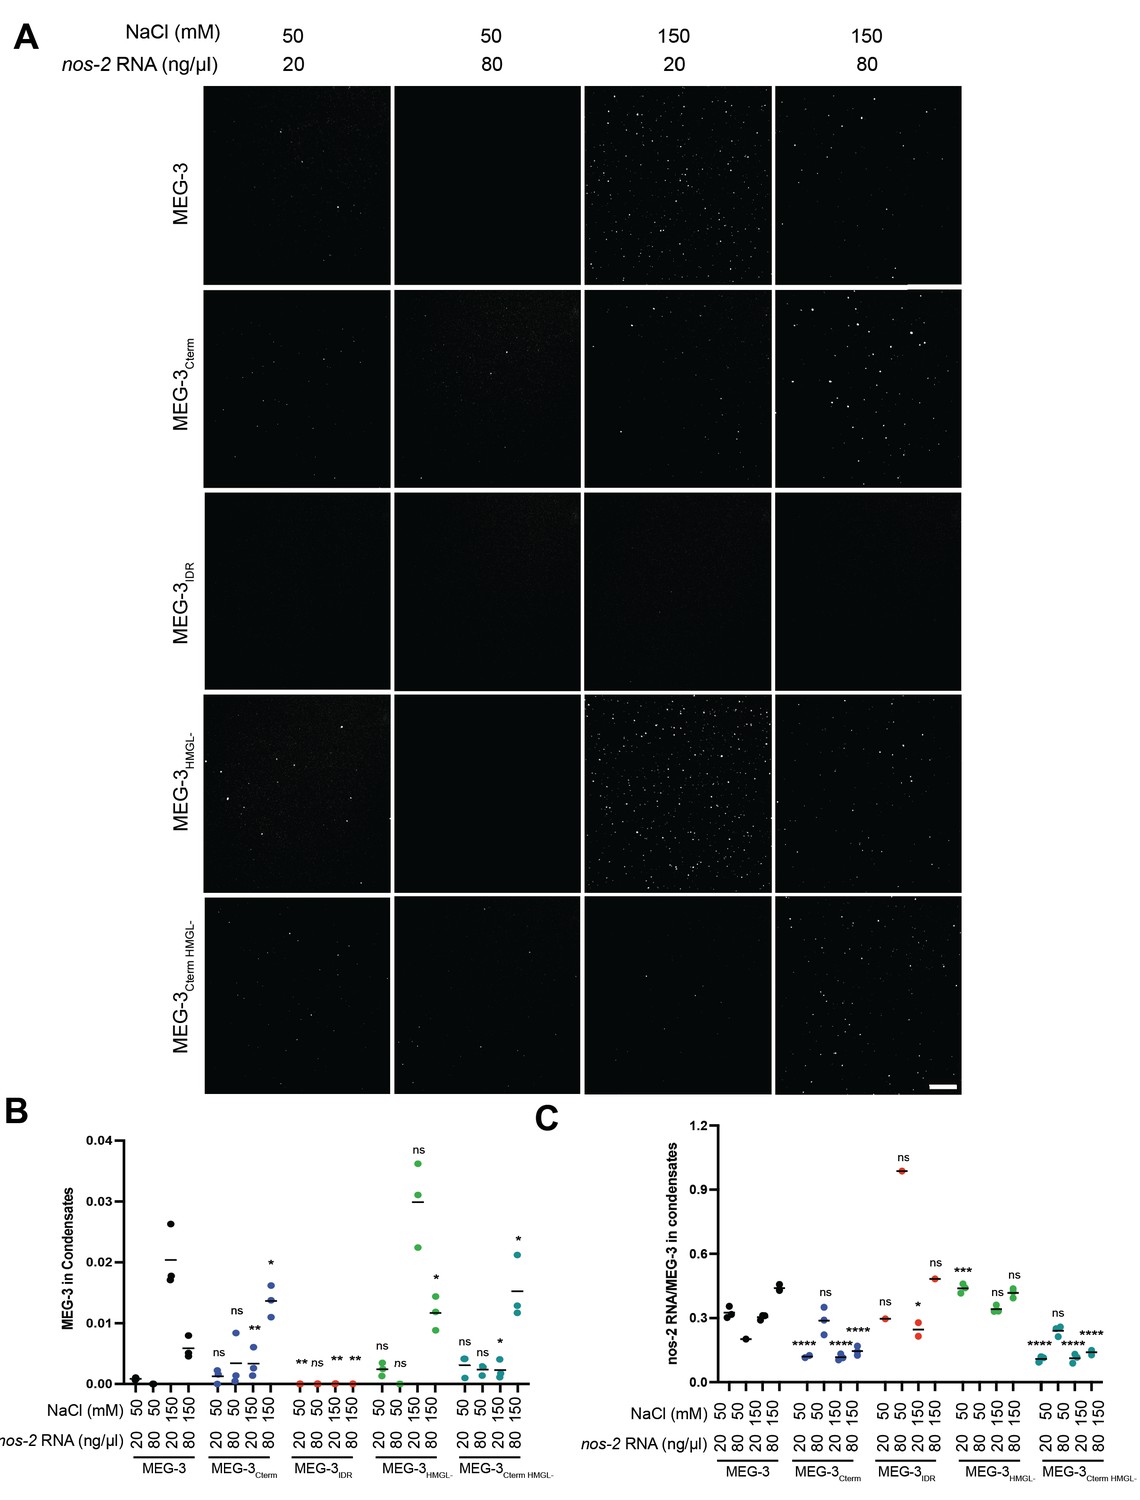
In vitro condensation of MEG-3 and variants at different RNA and salt concentrations.
(A) Representative photomicrographs of 150 nM. MEG-3 and MEG-3 derivatives (trace-labeled with Alexa647) incubated with the indicated concentrations of nos-2 RNA (trace-labeled with Dylight488) at the indicated NaCl concentrations. Scale bar is 25 μm. (B) Scatterplot of the condensation of MEG-3 and MEG-3 derivatives under varying RNA and salt concentrations. MEG-3 derivative and NaCl and nos-2 RNA concentration is indicated on the X-axis. MEG-3 condensates were identified in ImageJ, each dot represents an experimental replicate (Materials and methods). The total fluorescence intensity of protein in condensates, normalized to the total image intensity, is plotted on the Y-axis. Indicated p-values are relative to wild-type MEG-3 under the same conditions. (C) Scatterplot of the enrichment of nos-2 RNA in condensates formed by MEG-3 and MEG-3 derivatives under varying RNA and salt concentrations. MEG-3 derivative and NaCl and nos-2 RNA concentration is indicated on the X-axis. MEG-3 condensates were identified in ImageJ, each dot represents an experimental replicate also in (B) (Materials and methods). The total fluorescence intensity of nos-2 RNA in condensates, normalized to the total image intensity, is plotted on the Y-axis. Indicated p-values are relative to wild-type MEG-3 under the same conditions.
Figure 6—figure supplement 2
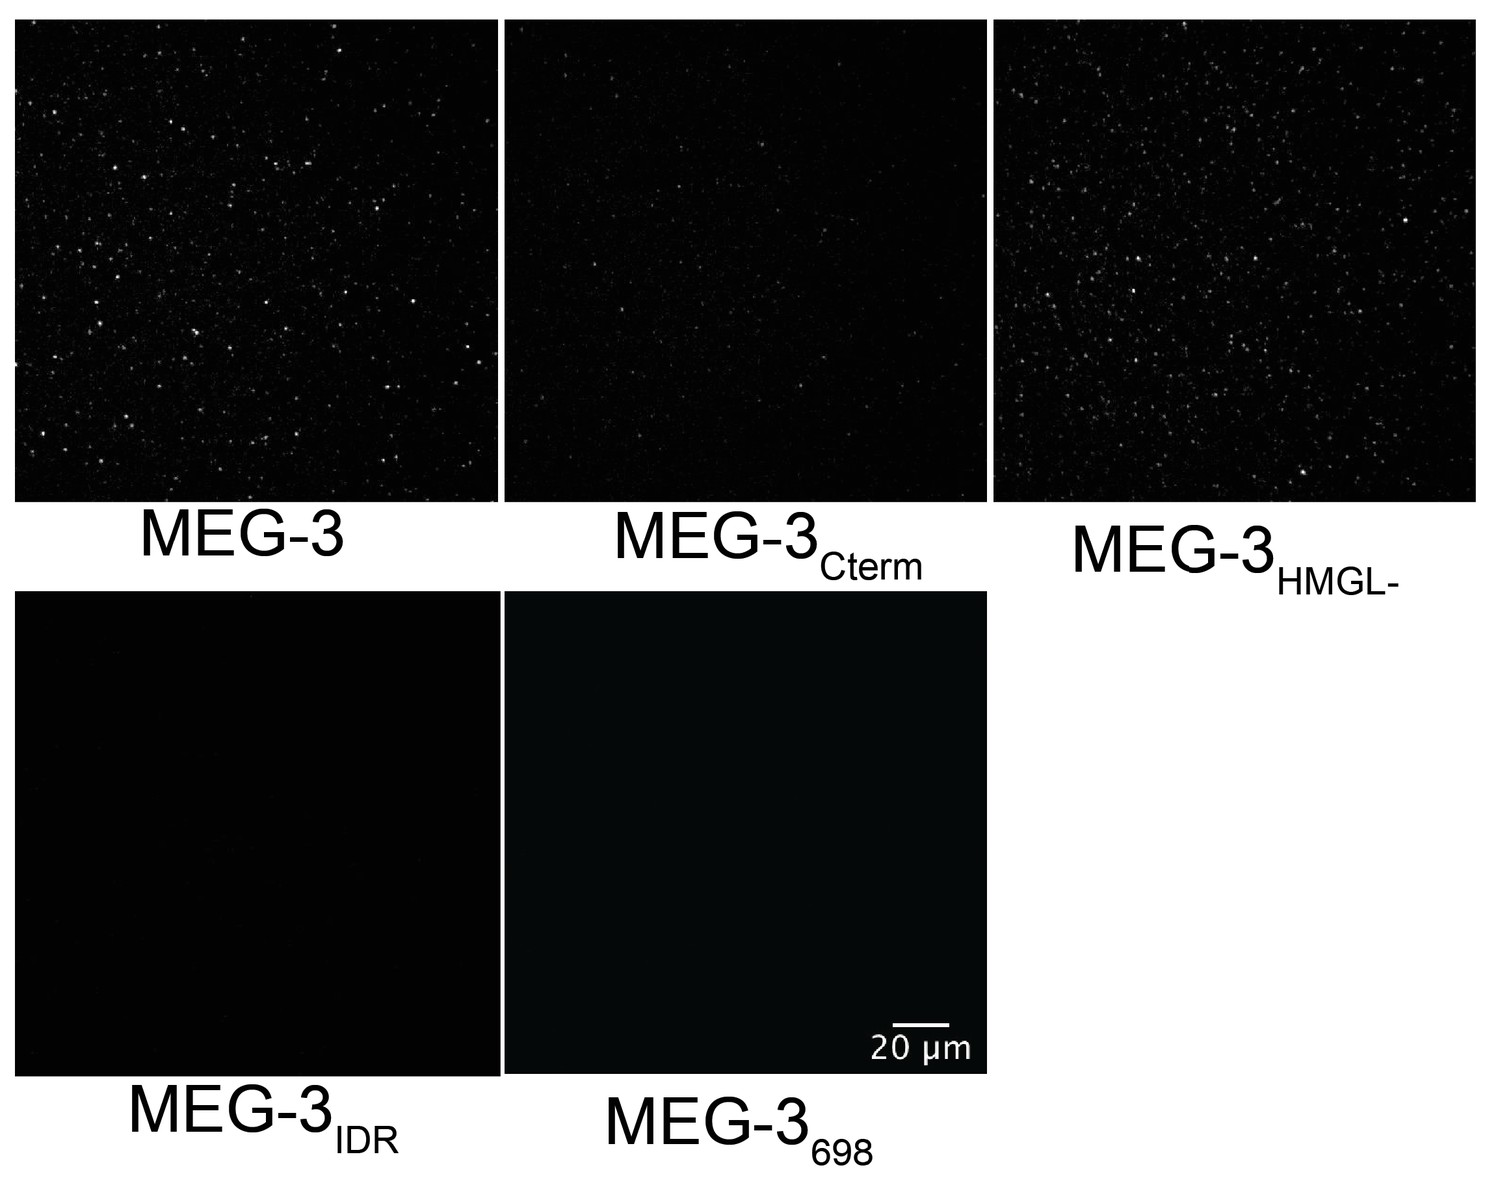
MEG-3698 condensation in vitro.
Representative photomicrographs of Alexa488 trace-labeled MEG-3 and MEG-3 derivatives in condensation buffer with 20 ng/µL unlabeled Y51F10.2 mRNA. Scale bar is 20 μm.
Figure 6—figure supplement 3
Co-condensation of MEG-3 and PGL-3 in vitro.
(A) Representative photomicrographs of MEG-3 and MEG-3 derivatives (trace-labeled with Alexa647 [RNA] or Dylight488 [no RNA]) incubated for 30 min with PGL-3 (trace-labeled with Dylight488 [RNA] or Alexa647 [no RNA]) in the presence or absence of RNA. (B) Full-field representative photomicrographs of MEG-3 (green)/PGL-3 (magenta) co-condensates shown at higher magnification in (A). Scale bar is 10 μm. (C) Full-field representative photomicrographs of MEG-3/PGL-3 co-condensates shown at higher magnification in Figure 6B. Scale bar is 20 μm.
Figure 7 with 1 supplement

The HMGL motif is required for MEG-3 binding to PGL-3.
(A) Analysis of GST::MEG-3Cterm and MBP::PGL-1 and MBP::PGL-3 interactions by GST-pull-down assay with MBP and MBP::PAA-1 as negative controls. Western blots of Escherichia coli lysates expressing the indicated MBP-fusions before (input) and after immobilization on magnetic beads with the indicated GST-fusions. Western blot of GST fusions is shown below. (B) Scatterplot of the ratio of the indicated MBP fusions to GST:MEG-3Cterm HMGL- normalized to the ratio of the same MBP fusion to GST:MEG-3Cterm from the same experiment. Each dot represents an independent pull-down experiment. p-values indicated above were calculated by a paired ratio t-test of the GST:MEG-3Cterm and GST:MEG-3Cterm HMGL- ratios before normalization. (C) Scatterplot of the ratio of PGL-3 (trace-labeled with Alexa555) to His-tagged MEG-3 derivatives (trace-labeled with Alexa647) immobilized on Nickel-NTA beads, normalized to the average ratio of MBP to MEG-3 derivatives (Materials and methods). Each dot represents an image containing multiple beads; two independent replicates with three images each were performed. SDS-PAGE gels of the protein inputs and representative photomicrographs of the beads in Figure 7—figure supplement 1.
-
Figure 7—source data 1
MEG-3 and variants binding to PGL-3.
- https://cdn.elifesciences.org/articles/63698/elife-63698-fig7-data1-v3.xlsx
Figure 7—figure supplement 1
Bead halo assay for MEG-3/PGL-3 binding.
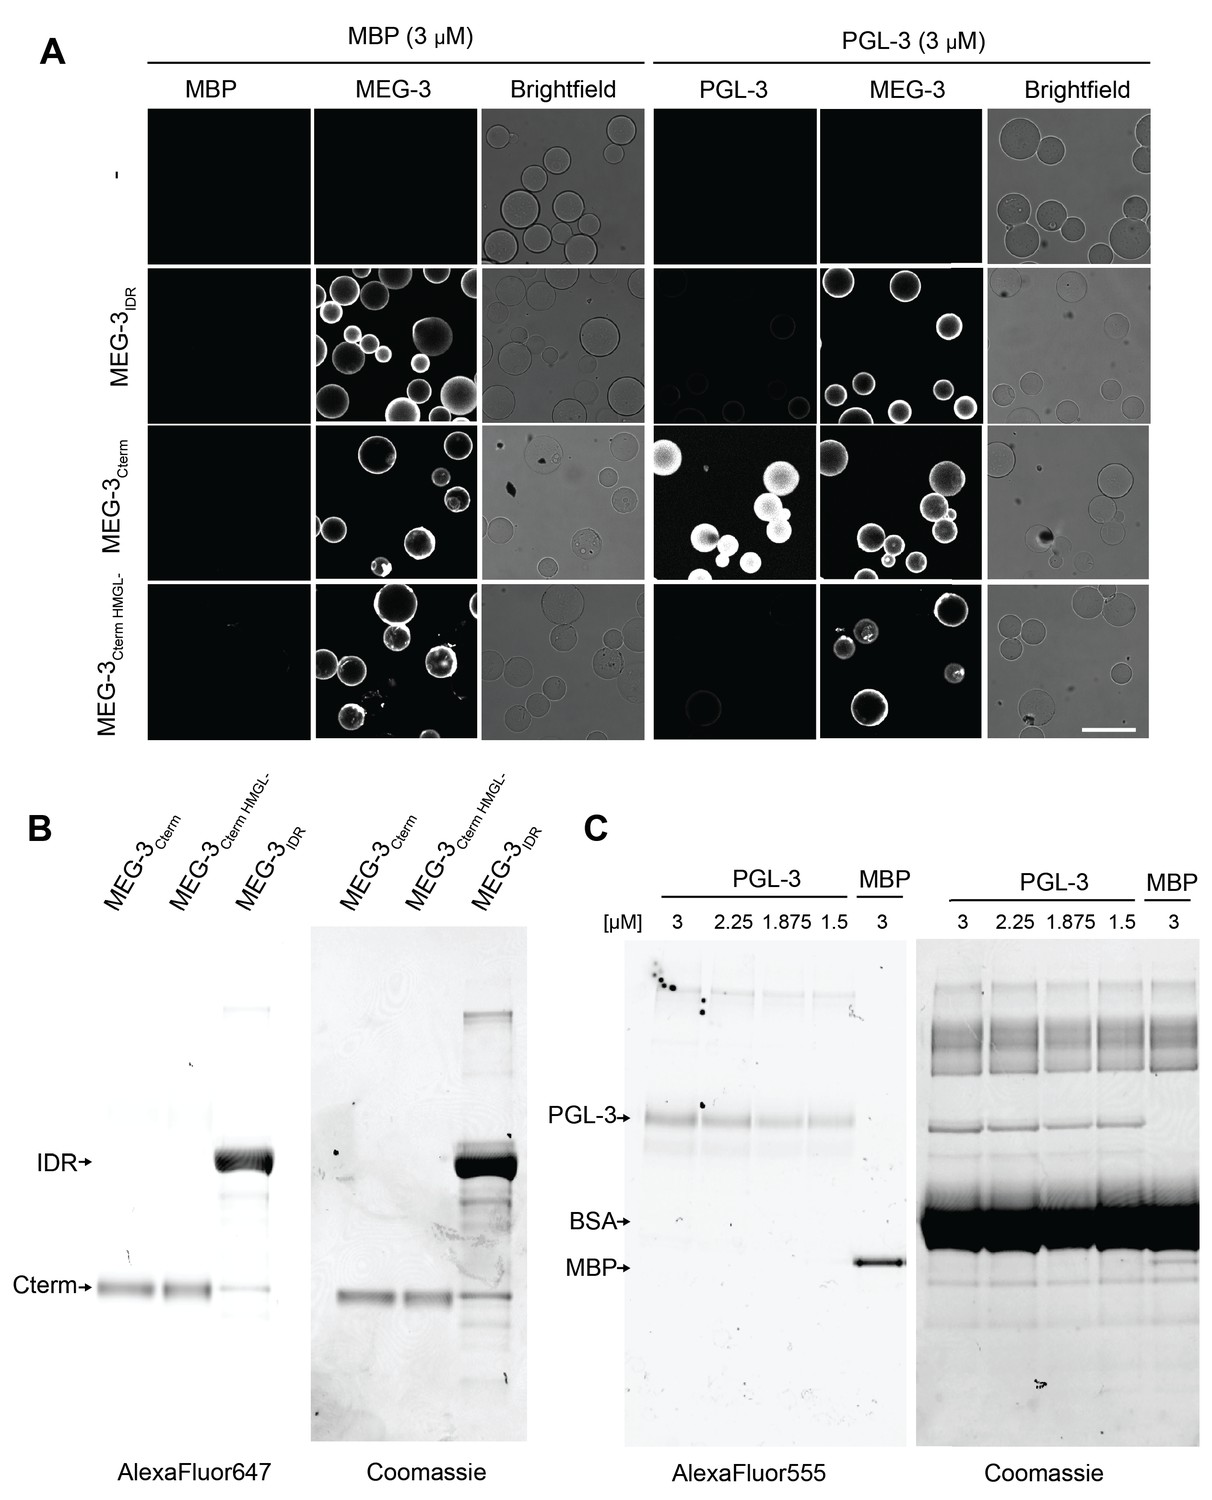
(A) Representative photomicrographs of the indicated MEG-3 derivatives immobilized on Nickel-NTA beads or empty beads (-) binding to 3 μM MBP or PGL-3. The ratio of PGL-3 to MEG-3 normalized to MBP/MEG-3 control is plotted Figure 7C. SDS-PAGE gels of the MEG-3 (B) or PGL and MBP (C) protein inputs for Figure 7C visualized by fluorescent protein labels (left) and Coomassie staining (right).
Figure 8
Model.
(A) Schematic of MEG-3 function by region. The disordered region (green), ordered C-terminus (white), and HMG-like motif (blue) are indicated. (B) Schematics of one-cell zygotes showing distribution of MEG-3 (green) and PGL-3 (magenta). Wild-type MEG-3 forms robust condensates that recruit RNA and interact with, and enrich, PGL-3 condensates in posterior cytoplasm. MEG-3Cterm forms condensates that do not recruit RNA but still interact with, and enrich, PGL-3 condensates in posterior. MEG-3IDR localizes in posterior-rich cytoplasm but does not form condensates, and does not localize PGL-3. MEG-3HMGL- assembles condensates in posterior cytoplasm that do not recruit RNA and do not interact efficiently with, nor localize, PGL-3 condensates.
Author response image 1
Author response image 2

Author response image 3
Tables
Key resources table
| Reagent type (species) or resource | Designation | Source or reference | Identifiers | Additional information |
|---|---|---|---|---|
| Strain, strain background (Caenorhabditis elegans) | JH3477 | Smith et al., 2016 | MEG-3::OLLAS meg-4 deletion | meg-3(ax3051) meg-4(ax3052) |
| Strain, strain background (C. elegans) | JH3479 | Smith et al., 2016 | MEG-3IDR::OLLAS meg-4 deletion | meg-3(ax3056) meg-4(ax3052) |
| Strain, strain background (C. elegans) | JH3517 | This study | MEG-3698::OLLAS MEG-4::3xFLAG | meg-3(ax4500) meg-4(ax2080) |
| Strain, strain background (C. elegans) | JH3630 | This study | MEG-3698::OLLAS meg-4 deletion | meg-3(ax4500) meg-4(ax3052) |
| Strain, strain background (C. elegans) | JH3632 | This study | MEG-3(HMGL deletion)::OLLAS meg-4 deletion | meg-3(ax4501) meg-4(ax3052) |
| Strain, strain background (C. elegans) | JH3861 | This study | MEG-3HMGL-::OLLAS meg-4 deletion | meg-3(ax4502) meg-4(ax3052) |
| Strain, strain background (C. elegans) | JH3420 | This study | MEG-3Cterm::OLLAS MEG-4::3xFLAG | meg-3(ax4503) meg-4(ax2080) |
| Strain, strain background (C. elegans) | JH3553 | This study | MEG-3Cterm::OLLAS meg-4 deletion | meg-3(ax4503) meg-4(ax4504) |
| Strain, strain background (C. elegans) | JH3475 | Smith et al., 2016 | meg-3 deletion meg-4 deletion | meg-3(ax3055) meg-4(ax3052) |
| Antibody | Anti-OLLAS-L2 | Novus Cat# NBP1-06713 | RRID:AB_1625979 | (1:200 IF, 1:1000 Western) |
| Antibody | Anti-PGL-3 KT3 | DSHB Cat# KT3 | RRID:AB_1556927 | (1:10 IF) |
| Antibody | Goat Anti-Mouse IgA 650 | Abcam Cat# ab97014 | RRID:AB_10680780 | (1:200 IF) |
| Antibody | Goat Anti-Rat IgG (H + L) 488 | Thermo Fisher Scientific Cat# A-11006 | RRID:AB_2534074 | (1:200 IF) |
| Antibody | Anti-α-Tubulin | Sigma-Aldrich Cat# T6199 | RRID:AB_477583 | (1:1000 Western) |
| Antibody | Goat Anti-Rat IgG (H + L) HRP | Thermo Fisher Scientific Cat# 31470 | RRID:AB_228356 | (1:2500 Western) |
| Antibody | Goat Anti-Mouse IgG1 HRP | Jackson ImmunoResearch Labs Cat# 115-035-205 | RRID:AB_2338513 | (1:6000 Western) |
| Sequence-based reagent | dcr12: crRNA to cut meg-3 at 2408 bp | Smith et al., 2016 | tgaaagcttgacagcattcc | |
| Sequence-based reagent | rHS03: cRNA cuts meg-3 5 bp upstream of stop codon | Smith et al., 2016 | tcagtacaatcattgatctc | |
| Sequence-based reagent | rHS20: crRNA to cut meg-3 at 2386 bp | This study | gtcaagctttcagaaatgcg | |
| Sequence-based reagent | rHS20: crRNA to cut meg-3 at 2546 bp | This study | atccaatcttggaattgtct | |
| Sequence-based reagent | rHS26: cRNA to cut MEG-3(HMGL deletion) strain | This study | tccaatcttggaattgtgcg | |
| Sequence-based reagent | rHS01: crRNA to cut meg-3 at 23 bp | Smith et al., 2016 | tcctcaaaaccttacccaag | |
| Sequence-based reagent | rHS01: crRNA to cut meg-3 at 1694 bp | Smith et al., 2016 | tcagatcaatcggaacaatg | |
| Sequence-based reagent | dcr11: crRNA to cut meg-4 3'UTR, 133 bp downstream of stop codon | Smith et al., 2016 | tctgcccaggaacttgtaac | |
| Sequence-based reagent | pk06: crRNA to cut meg-4 at 25 bp | Smith et al., 2016 | catgtgatctgccaaactcc | |
| Sequence-based reagent | dc89: homology template to delete meg-4 and insert a synthetic guide sequence | Smith et al., 2016 | gttgcaggtatgagttcttcaaagctttcctcatgtgggaagtttgtccagagcagaggaacgggtagttttctattgttatcaggactgctgc | |
| Sequence-based reagent | dc257: Homology template to make MEG-3698 | This study | caccacctcgcatttctgaaagcttgacagcattccaatccggattcgccaacgagctcggaccacgtctcatgggaaagtgattgtaccaatttatatctattacttgtagactata | |
| Sequence-based reagent | oHS264: Homology template to delete the HMGL | This study | ctcaagatccagcttcaacctcgccaccacctcgcacaattccaagattggatggtccttatgccgatgg | |
| Sequence-based reagent | oHS270, 272: Homology template to insert MEG-3HMGL- mutations in the HMGL deletion strain | This study | ctcaagatccagcttcaacctcgccaccacctcgcatttctgaaagcttgacagcatttttggaggcgcaacaggatgccaacgacgctattgatactaacgccaaagaaaagacacaactcctgaaagtgaatttggctattcacgggatgtcacctgaaagatggctgtacttgaattatttttgcaccgagacaattccaagattggatggtccttatgccgatgg | |
| Sequence-based reagent | dc198: Homology template to make MEG-3IDR | This study | gatttttgcaggtatgagctcctcaaaaccttacccaaatgtggatgtaaagagaacaccttcctcgtcaatc |
Additional files
-
Supplementary file 1
C. elegans strains used in this study, generated by CRISPR/Cas9 genome editing.
- https://cdn.elifesciences.org/articles/63698/elife-63698-supp1-v3.docx
-
Transparent reporting form
- https://cdn.elifesciences.org/articles/63698/elife-63698-transrepform-v3.docx
Download links
A two-part list of links to download the article, or parts of the article, in various formats.
Downloads (link to download the article as PDF)
Open citations (links to open the citations from this article in various online reference manager services)
Cite this article (links to download the citations from this article in formats compatible with various reference manager tools)
Protein-based condensation mechanisms drive the assembly of RNA-rich P granules
eLife 10:e63698.
https://doi.org/10.7554/eLife.63698


