SARS-CoV-2 suppresses anticoagulant and fibrinolytic gene expression in the lung
- Versiti Blood Research Institute, Department of Cell Biology Neurobiology and Anatomy Medical College of Wisconsin, United States
- Department of Pathology and Laboratory Medicine and UNC Blood Research Center, United States
- Department of Pathology, Microbiology and Immunology, Vanderbilt University Medical Center, United States
- Oak Ridge National Laboratory, Biosciences Division, United States
- University of Tennessee Knoxville, The Bredesen Center for Interdisciplinary Research and Graduate Education, United States
- Biomedical Informatics, Cincinnati Children’s Hospital Research Foundation, United States
- University of Cincinnati, United States
- University of Tennessee Knoxville, Department of Psychology, United States
Figures
Figure 1
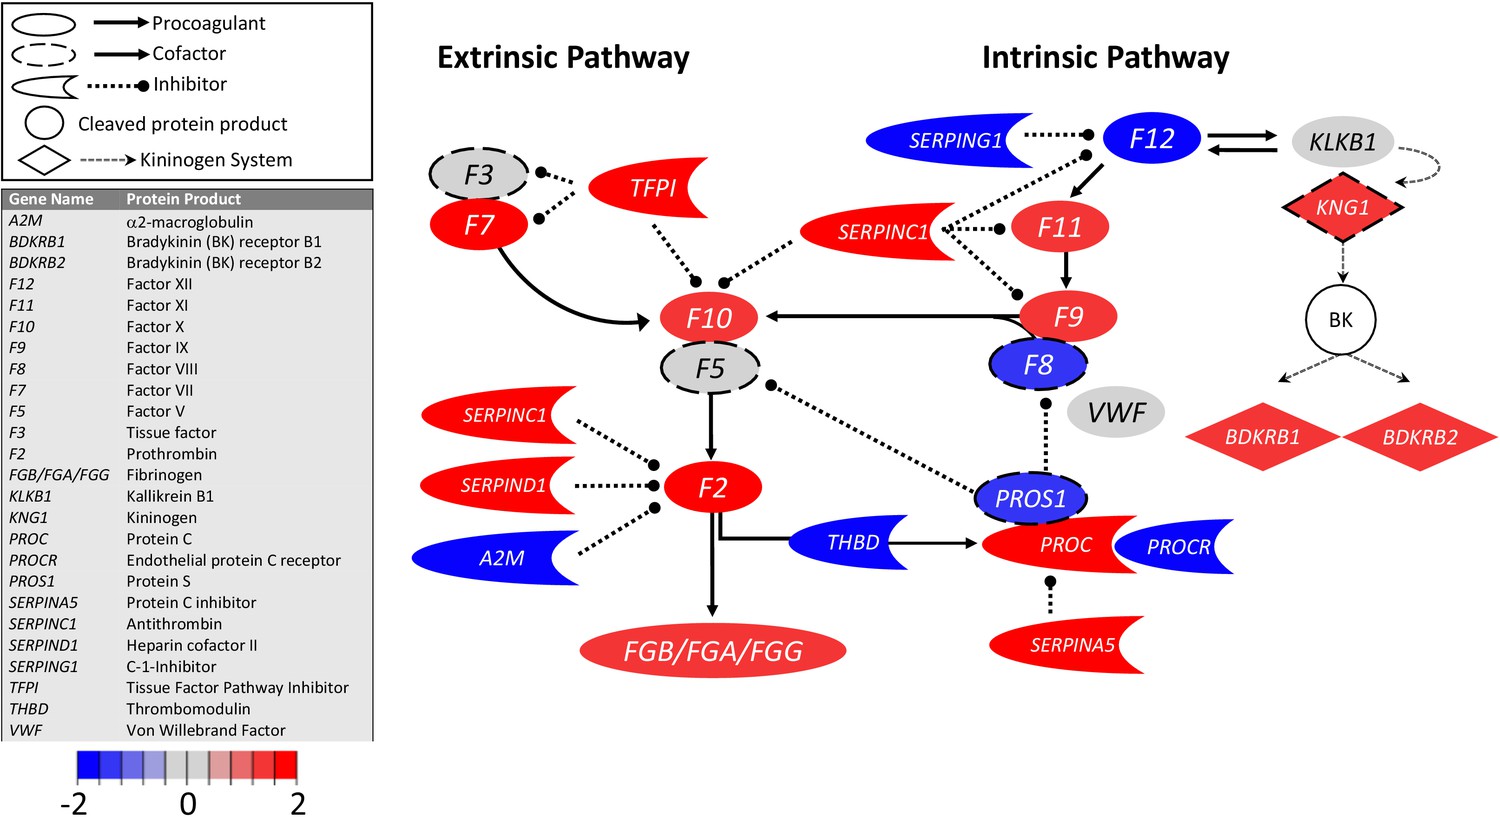
Transcriptional changes in lung induced by COVID-19 infection did not alter F3, but decreased aPC anticoagulant capacity, suggesting decreased inhibition of the propagation phase of coagulation.
Figure shows differential gene expression (log2 fold change) of coagulation pathway transcripts in BALF of COVID-19 patients; the image illustrates mechanistic relationships of the protein products of the identified transcripts during coagulation. Shading indicates relative expression in COVID-19 patients compared to controls: increased (red) or decreased (blue). There was minimal change in F3 (encoding tissue factor ) and increased TFPI (encoding the major inhibitor of tissue factor activity). There was decreased THBD, PROCR, and PROS1 (encoding proteins that enhance anticoagulant activity) and increased SERPINA5 (encoding protein C inhibitor). There was also decreased SERPING1 (encoding C1-Inhibitor). Other transcripts showing changes (e.g., F11, F10, F7, F2) encode proteins typically produced in the liver; local expression of these proteins is unclear.
Figure 2
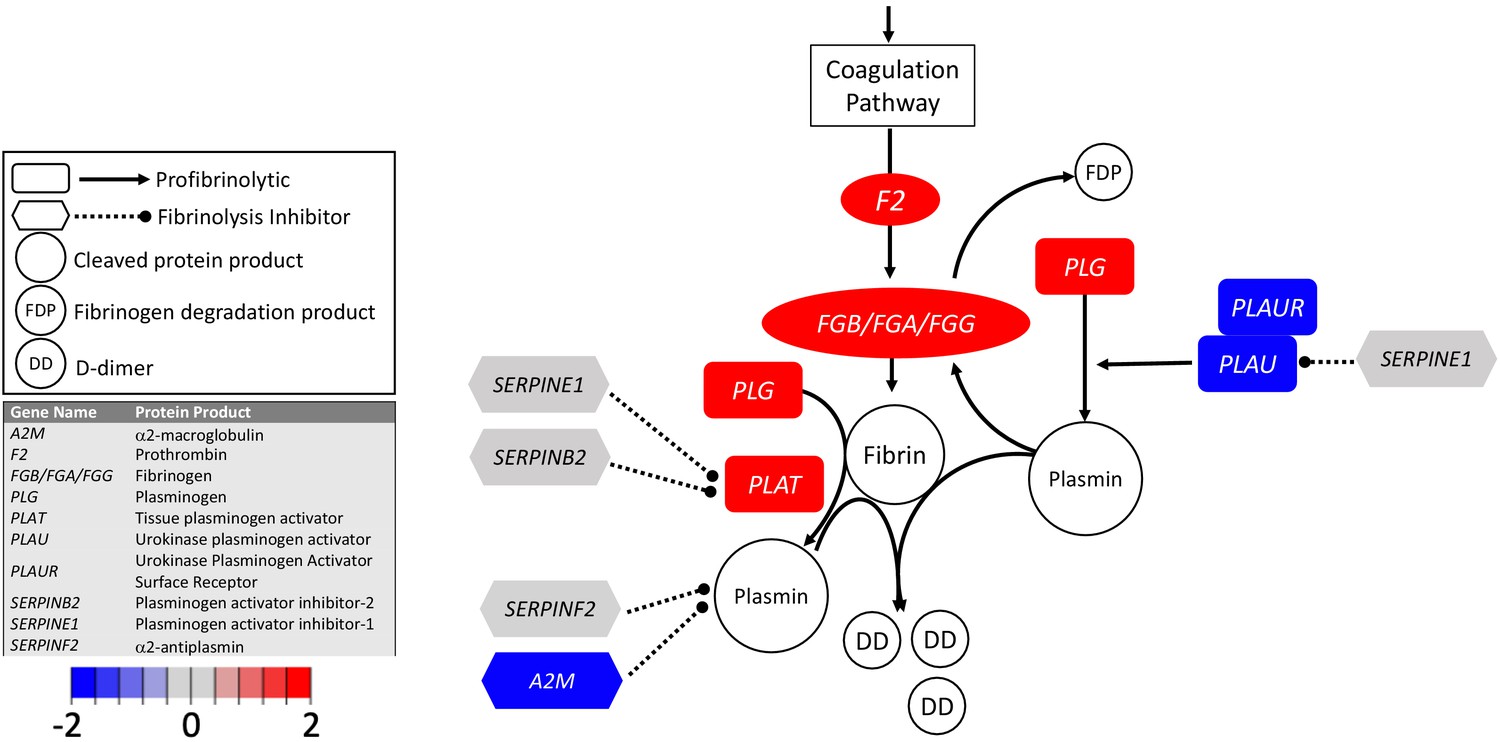
Transcriptional changes in lung induced by COVID-19 infection decreased PLAU and PLAUR, suggesting diminished fibrinolytic activity.
Figure shows differential gene expression (log2 fold change) of fibrinolytic pathway transcripts in BALF of COVID-19 patients; the image illustrates mechanistic relationships of the protein products of the identified transcripts during fibrinolysis. Shading indicates relative expression in COVID-19 patients compared to controls: increased (red) or decreased (blue). There was a moderate increase in PLAT (encoding tPA). There was also enhanced expression of FGB, FGA, and FGG (encoding fibrinogen chains) and decreased expression of PLAU and PLAUR (encoding uPA and uPAR, respectively). Other transcripts showing changes (e.g., F2, PLG) encode proteins typically produced in the liver; local expression of these proteins is unclear.
Tables
Table 1
Differentially expressed coagulation genes.
| Gene | Protein product | Mean COVID-19 | Mean control | Fold change | Log2FC | FDR |
|---|---|---|---|---|---|---|
| A2M | α2-Macroglubulin | 3.9 | 177.6 | −43.5 | −5.4 | 5.2E-15 |
| BDKRB1 | Bradykinin receptor B1 | 3.3 | 0.0 | 258.9 | 8.0 | 4.3E-91 |
| BDKRB2 | Bradykinin receptor B2 | 8.9 | 0.2 | 49.1 | 5.6 | 1.9E-40 |
| F13A1 | Factor XIII-A subunit | 2.5 | 9.2 | −3.6 | −1.8 | 2.6E-05 |
| F13B | Factor XIII-B subunit | 0.6 | 0.0 | 117.8 | 6.9 | 2.7E-31 |
| F12 | Factor XII | 0.5 | 3.2 | −4.4 | −2.1 | 5.7E-10 |
| F11 | Factor XI | 6.6 | 0.1 | 81.2 | 6.3 | 7.9E-79 |
| F10 | Factor X | 3.2 | 0.0 | 169.9 | 7.4 | 7.9E-140 |
| F9 | Factor IX | 0.9 | 0.0 | 189.6 | 7.6 | 2.2E-39 |
| F8 | Factor VIII | 3.9 | 15.8 | −4.6 | −2.2 | 1.6E-40 |
| F7 | Factor VII | 10.1 | 0.0 | 363.5 | 8.5 | 2.9E-73 |
| F5 | Factor V | 9.7 | 6.8 | 1.4 | 0.5 | 0.13 |
| F3 | Tissue Factor | 4.2 | 3.8 | -1.0 | -0.01 | 1 |
| F2 | Prothrombin | 0.9 | 0.0 | 188.8 | 7.6 | 7.8E-67 |
| FGA | Fibrinogen Aα chain | 3.4 | 0.0 | 322.5 | 8.3 | 3.4E-206 |
| FGB | Fibrinogen Bβ chain | 3.7 | 0.0 | 303.9 | 8.2 | 2.4E-151 |
| FGG | Fibrinogen γ chain | 0.7 | 0.0 | 85.4 | 6.4 | 4.8E-17 |
| KLKB1 | Kallikrein B1 | 1.3 | 1.8 | −1.4 | −0.5 | 2.1E-01 |
| KNG1 | Kininogen | 3.3 | 0.0 | 190.7 | 7.6 | 4.2E-163 |
| PLAT | Tissue plasminogen activator | 1.8 | 0.4 | 5.3 | 2.4 | 7.1E-24 |
| PLAU | Urokinase | 3.8 | 158.3 | −37.1 | −5.2 | 8.2E-172 |
| PLAUR | Urokinase receptor | 6.2 | 313.3 | −42.1 | −5.4 | 6.4E-286 |
| PLG | Plasminogen | 2.2 | 0.0 | 75.3 | 6.2 | 7.3E-38 |
| PROC | Protein C | 2.0 | 0.0 | 226.5 | 7.8 | 4.1E-158 |
| PROCR | Endothelial protein C receptor | 1.7 | 57.9 | −33.8 | −5.1 | 1.9E-50 |
| PROS1 | Protein S | 3.2 | 195.3 | −54.2 | −5.8 | 1.1E-174 |
| SERPINA5 | Protein C Inhibitor | 2.7 | 0.0 | 786.8 | 9.6 | 5.4E-145 |
| SERPINB2 | Plasminogen activator inhibitor-2 | 1.0 | 0.5 | 2.3 | 1.2 | 2.1E-01 |
| SERPINC1 | Antithrombin | 1.9 | 0.1 | 13.6 | 3.8 | 3.1E-31 |
| SERPIND1 | Heparin cofactor II | 3.0 | 0.0 | 94.0 | 6.6 | 2.2E-72 |
| SERPINE1 | Plasminogen activator inhibitor-1 | 2.7 | 5.3 | −1.8 | −0.9 | 8.8E-02 |
| SERPINF2 | α2-antiplasmin | 5.4 | 8.2 | −1.4 | −0.5 | 1.1E-02 |
| SERPING1 | C-1 inhibitor | 23.3 | 1923.2 | −80.1 | −6.3 | 5.4E-33 |
| TFPI | Tissue factor pathway inhibitor | 3.4 | 0.4 | 7.7 | 2.9 | 8.7E-19 |
| THBD | Thrombomodulin | 9.6 | 224.0 | −22.2 | −4.5 | 3.2E-48 |
| VWF | Von Willebrand factor | 14.5 | 7.7 | 2.0 | 1.0 | 2.0E-05 |
Table 2
Clinical data for patients from which BALF was extracted and analyzed for this study.
| GISAID accession | Isolate | NCBI accession | SRA accessions | Swab date | Age | Sex | Patient no | Date onset | Symptoms_admission | Status 1/13/20 | Diagnosis history |
|---|---|---|---|---|---|---|---|---|---|---|---|
| EPI_ISL_402127 | WIV02 | MN996527 | SRR11092058, SRR11092063 | 12/30/19 | 32 | Male | ICU-04 | 12/19/19 | Fever, cough, dyspnea | Fever, intermitttent cough | Negative |
| EPI_ISL_402124 | WIV04 | MN996528 | SRR11092057, SRR11092062 | 12/30/19 | 49 | Female | ICU-06 | 12/27/19 | Fever (37.9C), palpitation | Fever, malaise, cough | Coronavirus (nt) |
| EPI_ISL_402128 | WIV05 | MN996529 | SRR11092061 | 12/30/19 | 52 | Female | ICU-08 | 12/22/19 | Fever (38C), expectoration, malaise, dyspnea | Recovered, disharged | Streptococcus pneumoniae (nt) |
| EPI_ISL_402129 | WIV06 | MN996530 | SRR11092056, SRR11092060 | 12/30/19 | 40 | Male | ICU-09 | 12/28/20 | Fever (38C), expectoration | Fever (38C), expectoration, dizziness | Negative |
| EPI_ISL_402130 | WIV07 | MN996531 | SRR11092059, SRR11092064 | 12/30/19 | 56 | Male | ICU-10 | 12/20/19 | Fever, dyspnea, chest tightness | Fever, malaise, cough, dyspnea | Negative |
Additional files
Download links
A two-part list of links to download the article, or parts of the article, in various formats.
Downloads (link to download the article as PDF)
Open citations (links to open the citations from this article in various online reference manager services)
Cite this article (links to download the citations from this article in formats compatible with various reference manager tools)
SARS-CoV-2 suppresses anticoagulant and fibrinolytic gene expression in the lung
eLife 10:e64330.
https://doi.org/10.7554/eLife.64330


