ARL3 activation requires the co-GEF BART and effector-mediated turnover
- CRUK- Beatson Institute, United Kingdom
- Fundación IMDEA-Nanociencia, Campus de Cantoblanco, Spain
- Unidad Asociada de Nanobiotecnologı́a (CNB-CSIC e IMDEA Nanociencia), Campus de Cantoblanco, Spain
- Institute of Cancer Sciences, University of Glasgow, United Kingdom
- Department of Chemistry, KU Leuven, Celestijnenlaan, Belgium
Figures
Figure 1
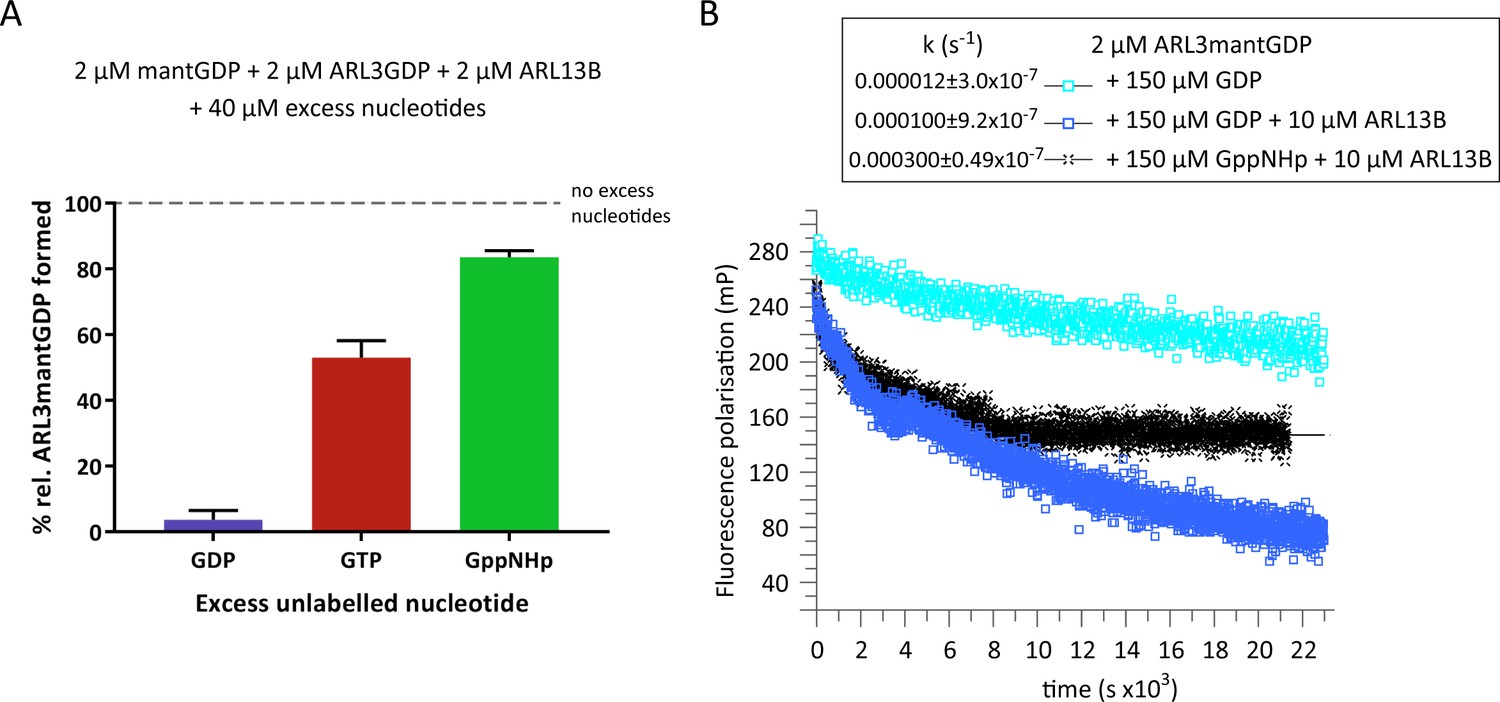
ARL3GDP guanine nucleotide exchange is poorly catalysed by ARL13B.
(A) 2 μM mantGDP was mixed with 2 μM ARL3GDP, 2 μM ARL13B18-278, and 40 μM unlabelled nucleotide (GDP, GTP, or GppNHp, as indicated). Fluorescence polarisation was measured following the addition of mantGDP to monitor the formation of ARL3mantGDP over time until the stabilisation of the measurements. The experiment was repeated three times and the average maximum polarisation obtained for each nucleotide is shown relative to that obtained with no excess unlabelled nucleotides added to the reaction. (B) Fluorescence polarisation measurements were used to monitor the nucleotide exchange of 2 μM ARL3mantGDP in the presence of 150 μM GppNHp (turquoise squares). The exchange was also observed with the addition of 10 μM ARL13B18-278 in the presence of 150 μM GDP (blue squares) and 150 μM GppNHp (black crosses). Excess unlabelled nucleotides were added to initiate the reaction and the measurements immediately started. The data was fitted using GraFit, and the corresponding exchange rates are listed to the left of the key.
-
Figure 1—source data 1
Source data for Figure 1a.
- https://cdn.elifesciences.org/articles/64624/elife-64624-fig1-data1-v2.xlsx
-
Figure 1—source data 2
Source data for Figure 1b.
- https://cdn.elifesciences.org/articles/64624/elife-64624-fig1-data2-v2.xlsx
Figure 2

Inhibition of ARL3 guanine nucleotide exchange exerted by the N-terminal helix is not released in the presence of liposomes.
(A) Structure superimposition of the N-terminal helices and the interswitch regions of ARL3GTP (green, PDB: 4ZI2) and ARL3GDP (grey, PDB: 1FZQ) shown in cartoon form. The conformational shift of the interswitch β-hairpin is indicated by the dashed black arrow. (B) Nucleotide exchange was monitored for 2 μM N-terminally truncated ARL3mantGDP (ARL3ΔN) mixed with 150 μM GppNHp in the presence (solid blue) and absence (dotted green) of 20 μM ARL13B18-278. Polarisation was measured after the addition of excess GppNHp. (C) Liposome-binding assay in which 2 μM GppNHp- and GDP-loaded ARL3 (top and bottom, respectively) was incubated with increasing concentrations of liposomes (200 nm; DOPC:DOPG:DPPC:DPPG:cholesterol). Following ultracentrifugation, samples of the pellet (P) and supernatant (S) were run on SDS-PAGE gels. %ARL3 relative to total was quantified for each band. Cosedimentation with 1 mM liposomes was carried out twice with similar results; a representative image of the get is shown here. (D) Relative fluorescence polarisation measurements of 2 μM ARL3mantGDP and 150 μM GppNHp in the absence (dotted green) and presence of 1 mM (solid red) and 3 mM (solid blue) liposomes(200 nm; DOPC:DOPG:DPPC:DPPG:cholesterol). Excess GppNHp was added to initiate the reaction and the measurements immediately started. (E) The same experiment as (B) was repeated with a mixture of 2 μM full-length ARL3, 150 μM GppNHp, and 3 mM liposomes (200 nm; DOPC:DOPG:DPPC:DPPG:cholesterol) in the presence (solid blue) and absence (dotted green) of 20 μM ARL13B18-278. (F) 2 μM untagged ARL3mantGDP was mixed with 150 μM GppNHp, and fluorescence polarisation was measured in the absence (dotted green) and presence (blue) of 20 μM ARL13B. Nucleotide exchange was also monitored (red) in the presence of 20 μM ARL13B18-278 and 3 mM of Ni-NTA liposomes (200 nm; DOGS-NTA:DOPC:DOPG:DPPC:DPPG:cholesterol). Excess GppNHp was added to initiate all reactions. (G) Liposome-binding assay where 2 μM ARL3GDP was mixed with 150 μM GppNHp and 20 μM 12xHis-ARL13B18-278 in the presence and absence of 3 mM Ni-NTA liposomes (200 nm; DOGS-NTA:DOPC:DOPG:DPPC:DPPG:cholesterol). Following ultracentrifugation, samples of the pellet (P) and supernatant (S) were run on SDS-PAGE gels, along with a sample of 12xHis-ARL13B18-278 for reference. Dashed lines indicate lanes cut for presentation.
-
Figure 2—source data 1
Source data for Figure 2b.
- https://cdn.elifesciences.org/articles/64624/elife-64624-fig2-data1-v2.xlsx
-
Figure 2—source data 2
Source data for Figure 2c.
- https://cdn.elifesciences.org/articles/64624/elife-64624-fig2-data2-v2.xlsx
-
Figure 2—source data 3
Source data for Figure 2d.
- https://cdn.elifesciences.org/articles/64624/elife-64624-fig2-data3-v2.xlsx
-
Figure 2—source data 4
Source data for Figure 2e.
- https://cdn.elifesciences.org/articles/64624/elife-64624-fig2-data4-v2.xlsx
-
Figure 2—source data 5
Source data for Figure 2f.
- https://cdn.elifesciences.org/articles/64624/elife-64624-fig2-data5-v2.xlsx
Figure 3
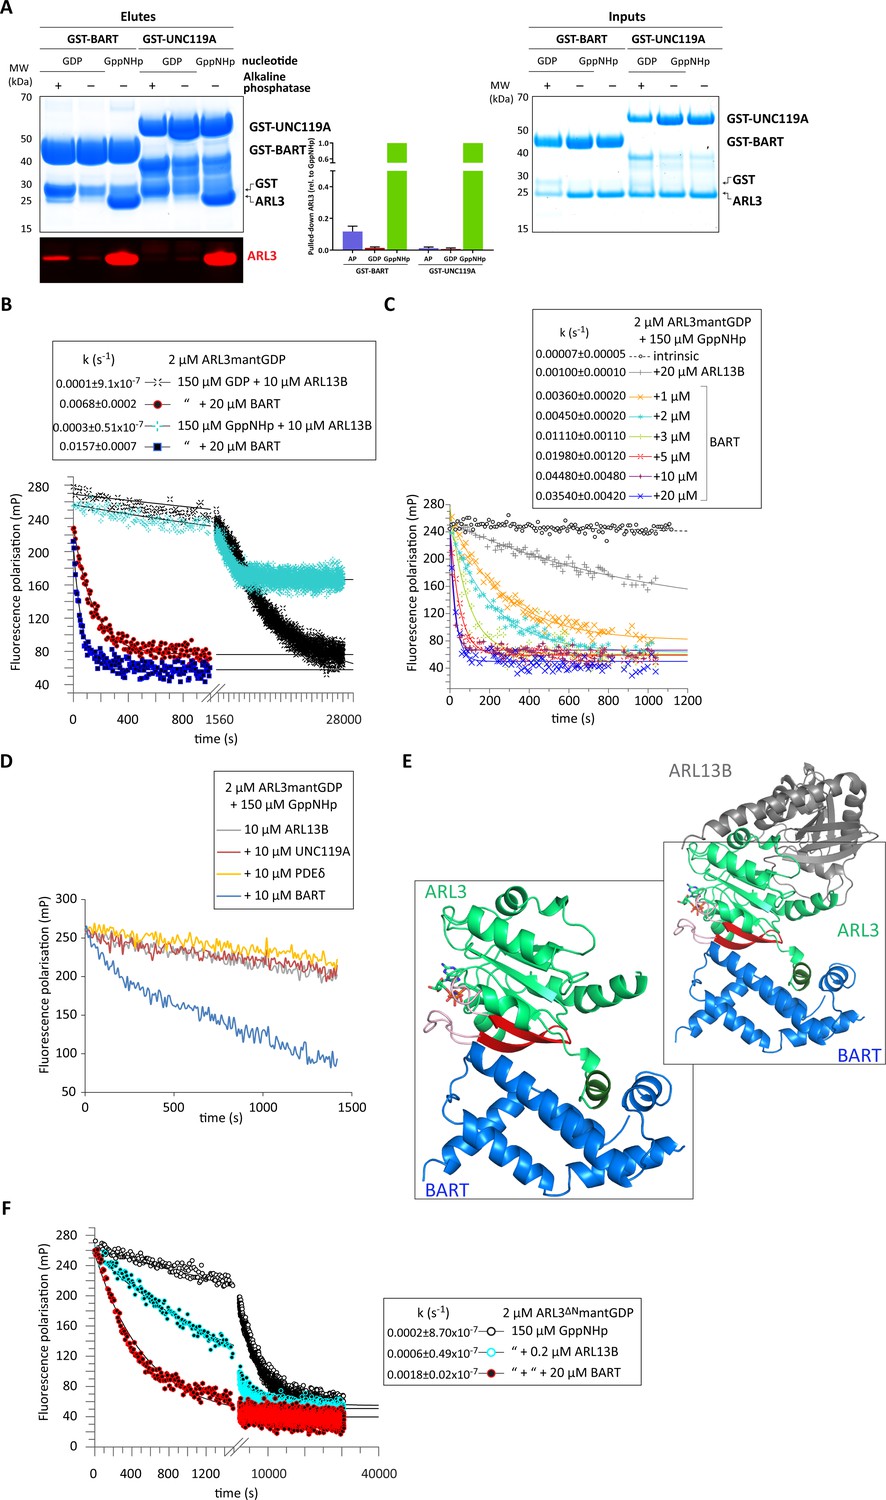
BART acts as a co-GEF in the ARL13B-mediated exchange of ARL3, accelerating and enhancing the efficiency of the reaction.
(A) GST-tagged BART and UNC119A were used to pull down ARL3 (bound to GDP or GppNHp, as indicated) in the presence and absence of alkaline phosphatase (AP). Samples of the elutes and inputs were run on SDS-PAGE gels and visualised using Coomassie blue. Pulled down ARL3 was further confirmed by immunoblotting using anti-ARL3 antibodies (red), and was quantified relative to the respective GST-BART or GST-UNC119A bands (right). The pull-downs were repeated three times; a representative image of the obtained gels and western blots is shown here. (B) 2 μM ARL3mantGDP was mixed with 10 μM ARL13B18-278 and 150 μM GDP or GppNHp, and the nucleotide exchange was monitored in the presence and absence of 20 μM BART, as indicated. The first 1000s of the measurement following nucleotide addition are shown in greater detail. The data was fitted using GraFit, and the corresponding exchange rates are listed to the left of the key. (C) 2 μM ARL3mantGDP was mixed with 150 μM GppNHp, and subsequent nucleotide exchange was monitored with the addition of 20 μM ARL13B18-278 and increasing amounts of BART, as indicated. All reactions were initiated by the addition of excess GppNHp.The data was fitted using GraFit, and the corresponding exchange rates are listed (right). (D) 2 μM ARL3mantGDP was mixed with 150 μM GppNHp and 10 μM ARL13B18-278 and fluorescence polarisation was monitored over time in the absence (grey) and presence of 10 μM UNC119A (red), PDEδ (yellow), or BART (blue). (E) Superimposition of crystal structures of ARL3 (green, with switch regions, interswitch β-hairpin, and the N-terminal helix in light red, red, and dark green, respectively) in complex with ARL13B (grey, PDB: 5DI3), and BART (blue, PDB: 3DOE). As shown in the magnified area denoted by the black squares, only BART can bind both the N-terminal helix and the switch regions. (F) Nucleotide exchange of 2 μM ARL3ΔNmantGDP was monitored in the presence of 150 μM GppNHp (black circles), with the addition of 0.2 μM ARL13B18-278 (turquoise circles), and with the addition of 0.2 μM ARL13B18-278 and 20 μM BART (red circles). The data was fitted using GraFit, and the corresponding exchange rates are listed.
-
Figure 3—source data 1
Source data for Figure 3a.
- https://cdn.elifesciences.org/articles/64624/elife-64624-fig3-data1-v2.xlsx
-
Figure 3—source data 2
Source data for Figure 3b.
- https://cdn.elifesciences.org/articles/64624/elife-64624-fig3-data2-v2.xlsx
-
Figure 3—source data 3
Source data for Figure 3c.
- https://cdn.elifesciences.org/articles/64624/elife-64624-fig3-data3-v2.xlsx
-
Figure 3—source data 4
Source data for Figure 3d.
- https://cdn.elifesciences.org/articles/64624/elife-64624-fig3-data4-v2.xlsx
-
Figure 3—source data 5
Source data for Figure 3f.
- https://cdn.elifesciences.org/articles/64624/elife-64624-fig3-data5-v2.xlsx
Figure 4
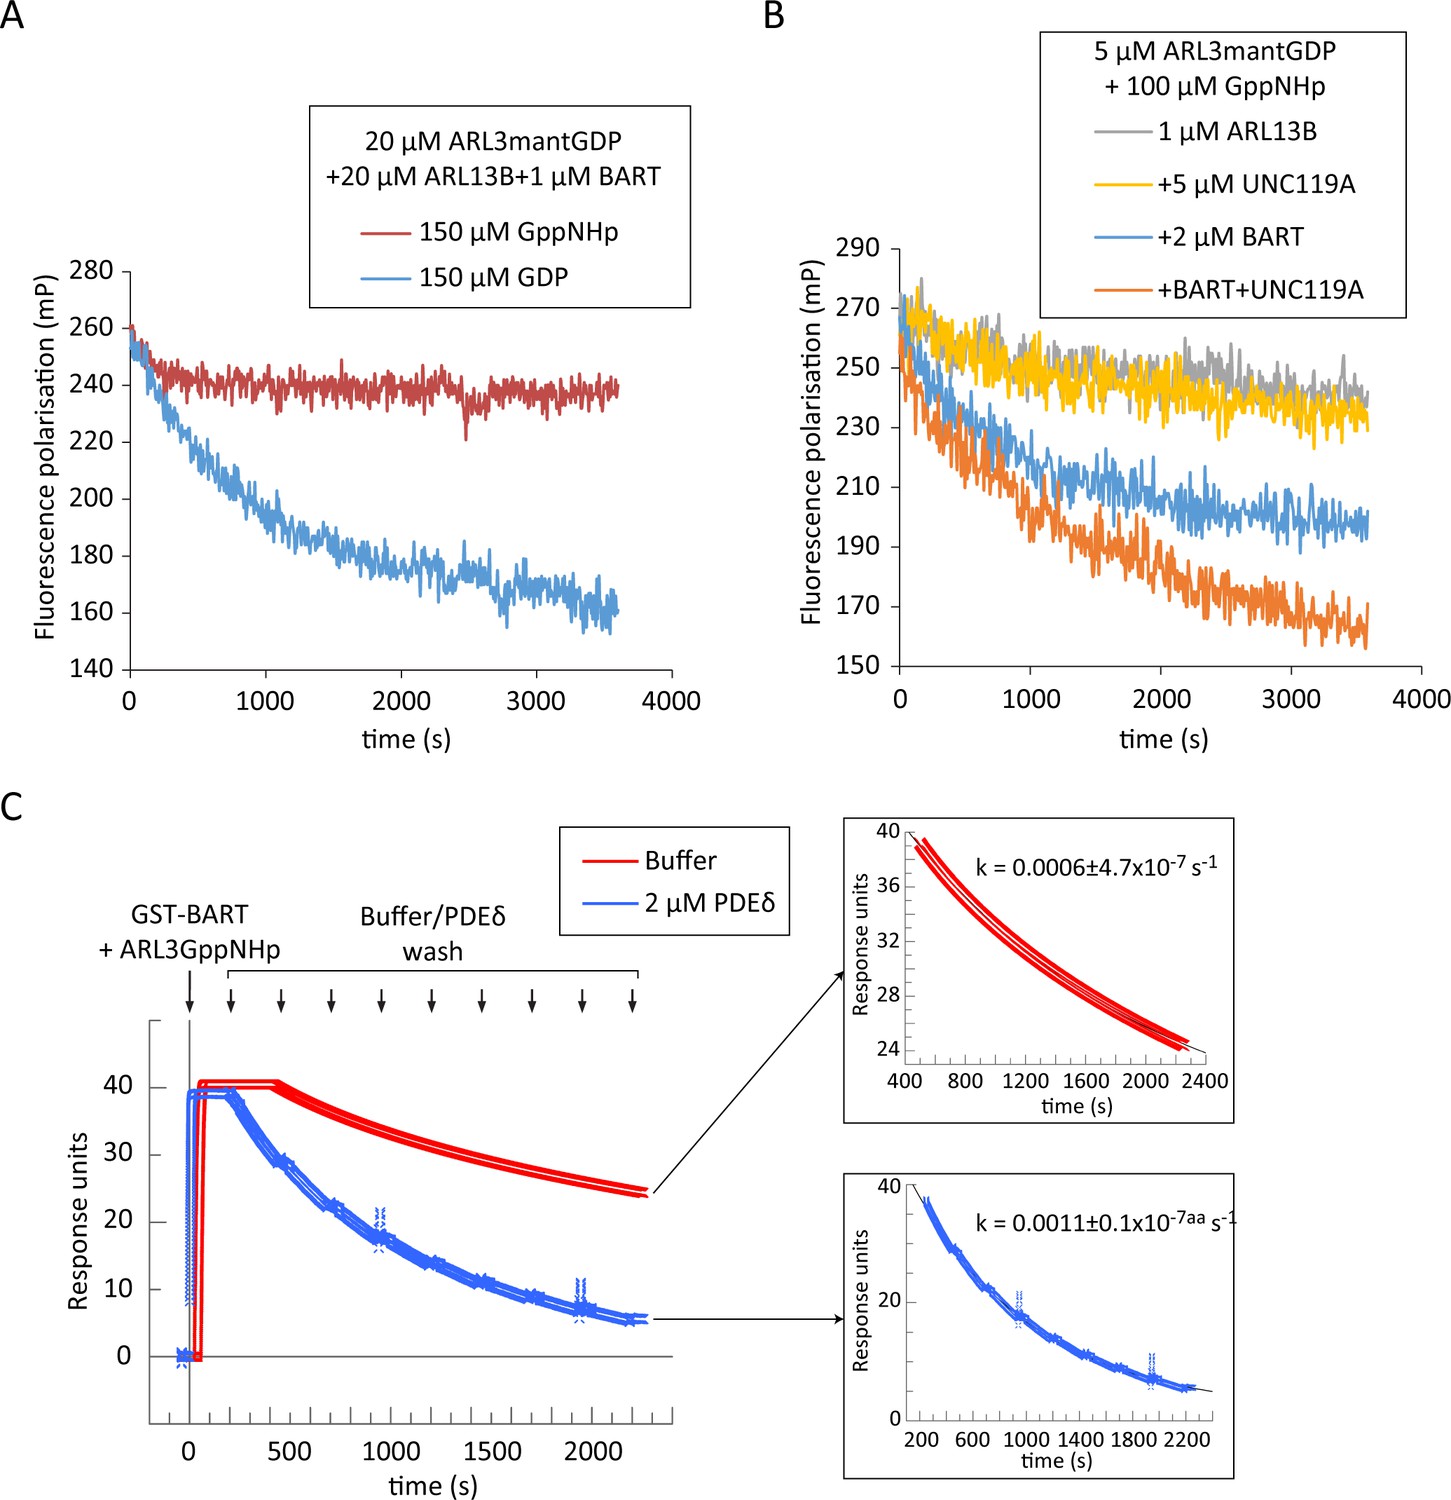
BART product inhibition is relieved by ARL3 effectors which mediate its turnover.
(A) Nucleotide exchange of ARL3 was assayed in a multiple turnover experiment with a limiting addition of BART. Fluorescence polarisation was measured following nucleotide addition for a mixture of 20 μM ARL3mantGDP, 20 μM ARL13B, and 1 μM BART in the presence of either 150 μM GppNHp (red) or 150 μM GDP (blue). (B) Fluorescence polarisation was measured for a mixture of 5 μM ARL3mantGDP, 100 μM GppNHp, and 1 μM ARL13B18-278 (grey). The measurements were repeated in the presence of 5 μM UNC119A (yellow), 2 μM BART (blue), or a mixture of UNC119A and BART at the aforementioned concentrations (orange). All reactions were initiated by the addition of GppNHp. (C) SPR sensorgrams of ARL3GppNHp (640 nM) bound to immobilised GST-BART undergoing nine washing steps (black arrows) with either running buffer (red), or with 2 μM PDEδ (blue). The data was fitted to a single exponential equation using GraFit, and the fitted curves are shown on the right, along with the corresponding rate constants.
-
Figure 4—source data 1
Source data for Figure 4a.
- https://cdn.elifesciences.org/articles/64624/elife-64624-fig4-data1-v2.xlsx
-
Figure 4—source data 2
Source data for Figure 4b.
- https://cdn.elifesciences.org/articles/64624/elife-64624-fig4-data2-v2.xlsx
-
Figure 4—source data 3
Source data for Figure 4c.
- https://cdn.elifesciences.org/articles/64624/elife-64624-fig4-data3-v2.xlsx
Figure 5
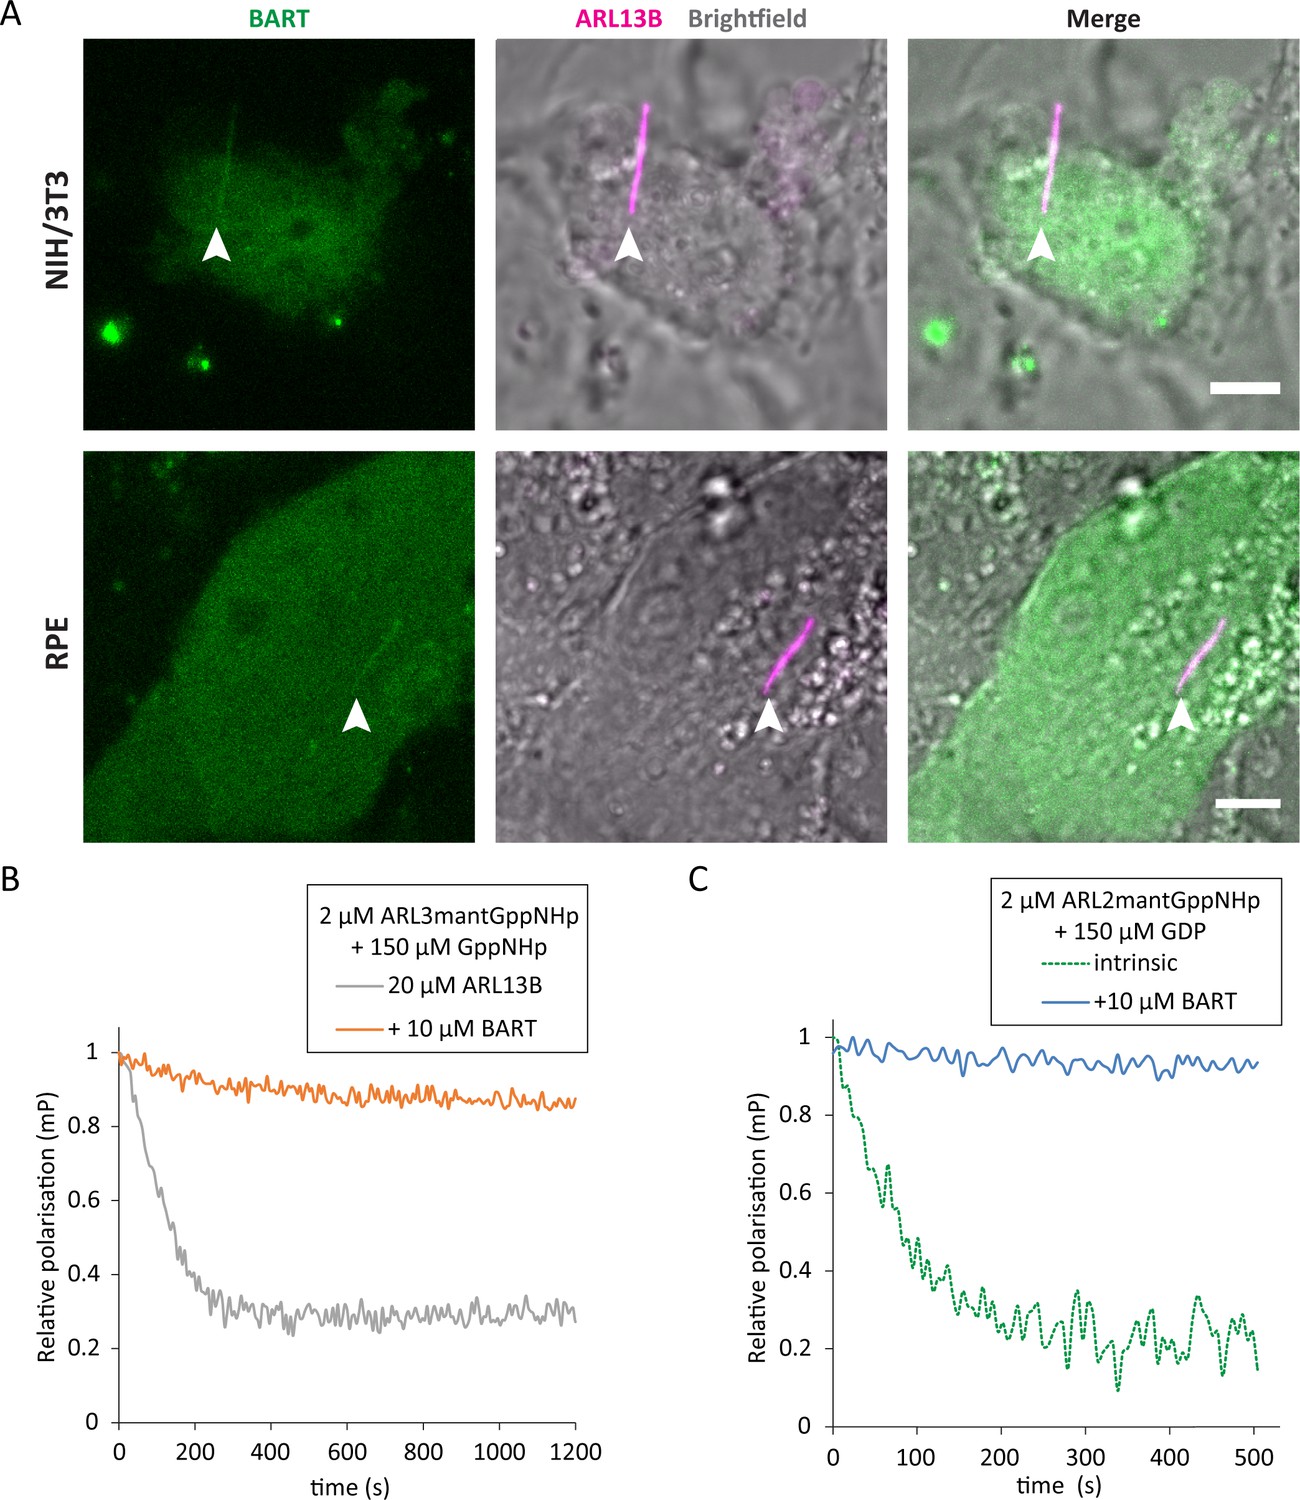
BART localises to the primary cilium and maintains active GTP-bound forms of ARL3 and ARL2.
(A) Representative images of live NIH/3T3 (top) and RPE (bottom) cells transfected with pEGFP-C1(BART) and pmKate2-N(ARL13B) and serum starved for 24 hr. The images are maximum projections of three optical slices. Transfections and subsequent imaging was carried out at least two times. Scale bars, 5 μm; white arrows indicate cilia. (B) Fluorescence polarisation measurements of 2 μM ARL3mantGppNHp, 150 μM GppNHp, and 20 μM ARL13B18-278 in the absence (grey) and presence (orange) of 10 μM BART. GppNHp was added last to both reactions before starting measurements. (C) 2 μM ARL2mantGppNHp was mixed with 150 μM GDP, and the resultant nucleotide exchange following GDP addition was monitored in the absence (dotted green) and presence (blue) of 10 μM BART.
-
Figure 5—source data 1
Source data for Figure 5b.
- https://cdn.elifesciences.org/articles/64624/elife-64624-fig5-data1-v2.xlsx
-
Figure 5—source data 2
Source data for Figure 5c.
- https://cdn.elifesciences.org/articles/64624/elife-64624-fig5-data2-v2.xlsx
Figure 6
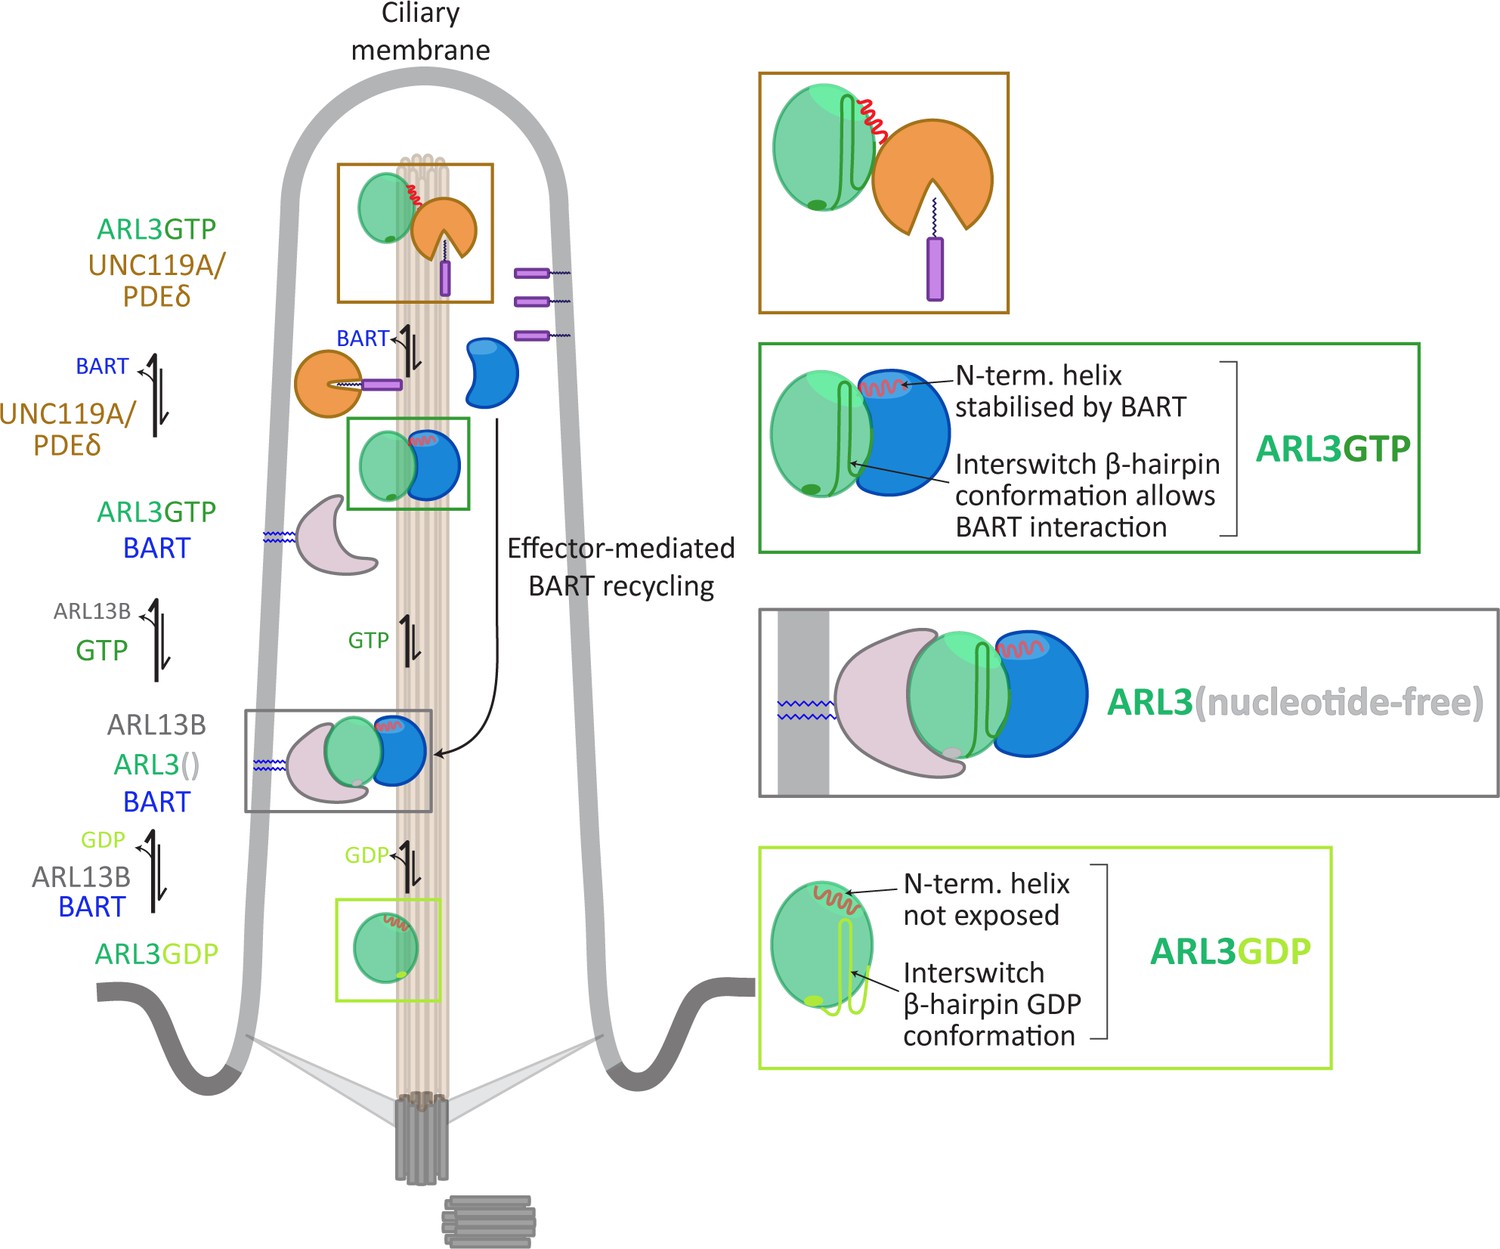
Model for co-GEF functionality in ARL13B-mediated nucleotide exchange of ARL3.
Tables
Key resources table
| Reagent type (species) or resource | Designation | Source or reference | Identifiers | Additional information |
|---|---|---|---|---|
| Strain, strain background (Escherichia coli) | BL21(DE3)CodonPlus (DE3)-RIL | Agilent Technologies | 230245 | Electrocompetent cells |
| Cell line (Homo sapiens) | hTERT-RPE (immortalised retinal pigmented epithelial cells; female) | ATCC | CRL-4000 | |
| Cell line (Mus musculus) | NIH/3T3 (embryonic fibroblasts) | ATCC | CRL-1658 | |
| Antibody | anti-ARL3 (rabbit, polyclonal) | Proteintech | 10961–1-AP | WB (3:5000) |
| Antibody | IRDye 680RD anti-rabbit IgG (donkey) | Li-Cor | 926–68073 | WB(1:5000) |
| Recombinant DNA reagent | pET20b(12-His-ARL13B18-278) | This paper | N-term. His-tagged ARL13B18-278 for bacterial expression | |
| Recombinant DNA reagent | pET20b(ARL317-182) | This paper | C-term. His-tagged ARL3ΔN for bacterial expression | |
| Recombinant DNA reagent | pET20b(ARL3) | This paper | C-term. His-tagged ARL3 for bacterial expression | |
| Recombinant DNA reagent | pET20b(ARL3-thrombin-His-tag) | This paper | Untagged ARL3 for bacterial expression | |
| Recombinant DNA reagent | pET20b(BART) | This paper | C-term. His-tagged BART for bacterial expression; E. coli codon-optimised sequence | |
| Recombinant DNA reagent | pGEX-4T-1(BART) | This paper | N-term. GST-tagged BART for bacterial expression; E. coli codon-optimised | |
| Recombinant DNA reagent | pGEX-4T-1(UNC119A) | This paper | N-term. GST-tagged UNC119A for bacterial expression | |
| Recombinant DNA reagent | pET20b(UNC119A) | This paper | C-term. His-tagged UNC119A for bacterial expression | |
| Recombinant DNA reagent | pET20b(PDEδ) | This paper | C-term. His-tagged PDEδ for bacterial expression | |
| Recombinant DNA reagent | pGFP-C1(BART) | This paper | N-term. GFP-tagged full-length BART for mammalian expression | |
| Recombinant DNA reagent | pmKate2-N(ARL13B) | This paper | C-term. mKate2-tagged full-length ARL13B for mammalian expression | |
| Peptide, recombinant protein | Thrombin | Sigma | T4648 | |
| Commercial assay or kit | GST capture kit | Cytiva | BR100223 | |
| Chemical compound, drug | mantGDP | BioLog Life Science Institute | M041-05 | |
| Chemical compound, drug | mantGppNHp | Jena Bioscience | NU-207 | |
| Chemical compound, drug | GppNHp | Jena Bioscience | NU-401 | |
| Chemical compound, drug | GTP | Sigma | G8877 | |
| Chemical compound, drug | GDP | Sigma | G7127 | |
| Software, algorithm | GraFit | Erathicus software |
-
Sources of all other chemicals/reagents used are listed in the relevant sections below.
Additional files
Download links
A two-part list of links to download the article, or parts of the article, in various formats.
Downloads (link to download the article as PDF)
Open citations (links to open the citations from this article in various online reference manager services)
Cite this article (links to download the citations from this article in formats compatible with various reference manager tools)
ARL3 activation requires the co-GEF BART and effector-mediated turnover
eLife 10:e64624.
https://doi.org/10.7554/eLife.64624


