Defining the ultrastructure of the hematopoietic stem cell niche by correlative light and electron microscopy
- Department of Cell and Regenerative Biology, School of Medicine and Public Health, University of Wisconsin-Madison, United States
- Center for Research in Biological Systems, National Center for Microscopy and Imaging Research, University of California at San Diego, United States
- Department of Neurosciences, University of California at San Diego School of Medicine, United States
Figures
Figure 1 with 7 supplements
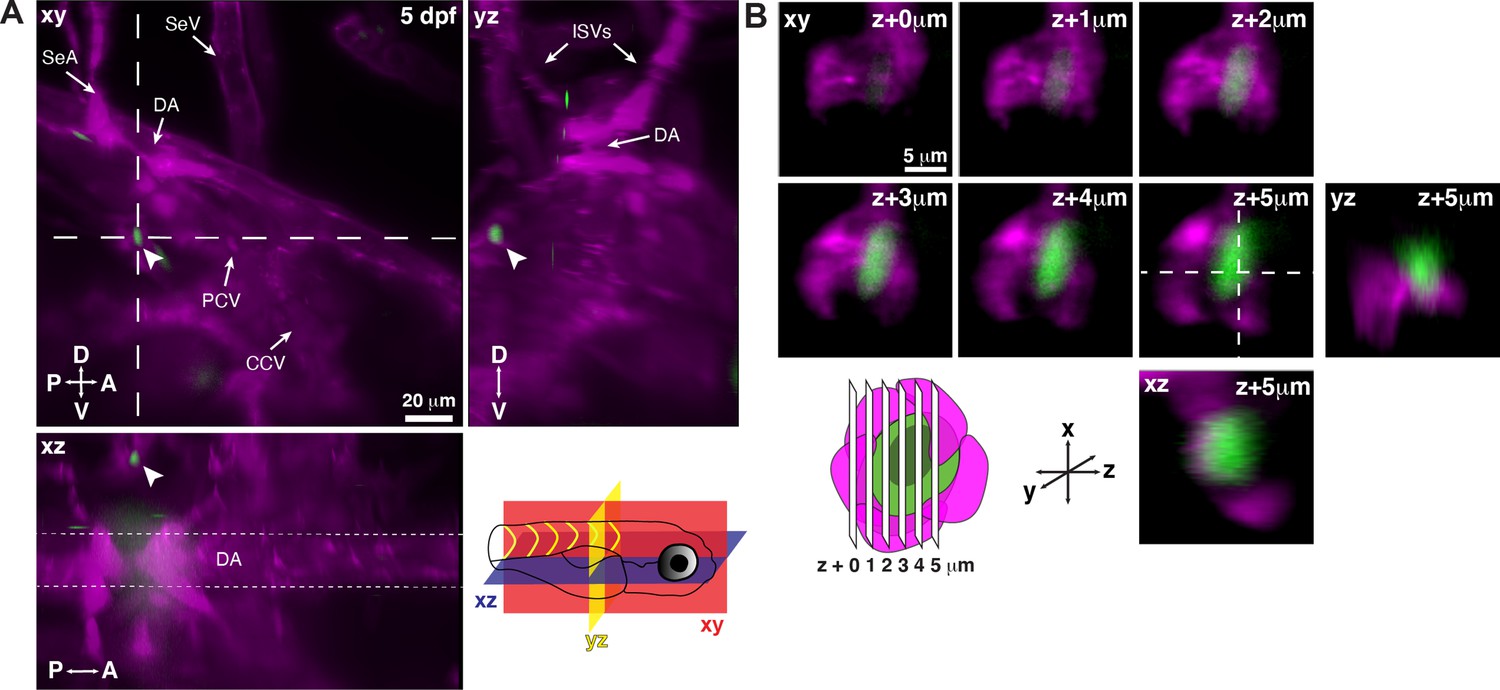
Single hematopoietic stem and progenitor cells (HSPCs) lodge in a perivascular region of the larval kidney niche.
(A) Snapshot of single optical sections (XY, XZ, YZ planes) from light sheet live image of a Runx:GFP;flk:mCherry double transgenic zebrafish larva. A single Runx:GFP+ HSPC (white arrowhead) is lodged in a perivascular region lateral to the dorsal aorta (DA). (B) Detail of optical sections (1 µm steps) through the single lodged Runx:GFP+ HSPC in (A). mCherry+ endothelial cells contact the HSPC and form a surrounding pocket. The +5 µm section is also shown in XZ and YZ planes. Abbreviations: DA, dorsal aorta; SeA, intersegmental artery; SeV, intersegmental vein; PCV, posterior cardinal vein; CCV, common cardinal vein; ISVs, intersegmental vessels; D, dorsal; V, ventral; A, anterior; P, posterior.
Figure 1—figure supplement 1
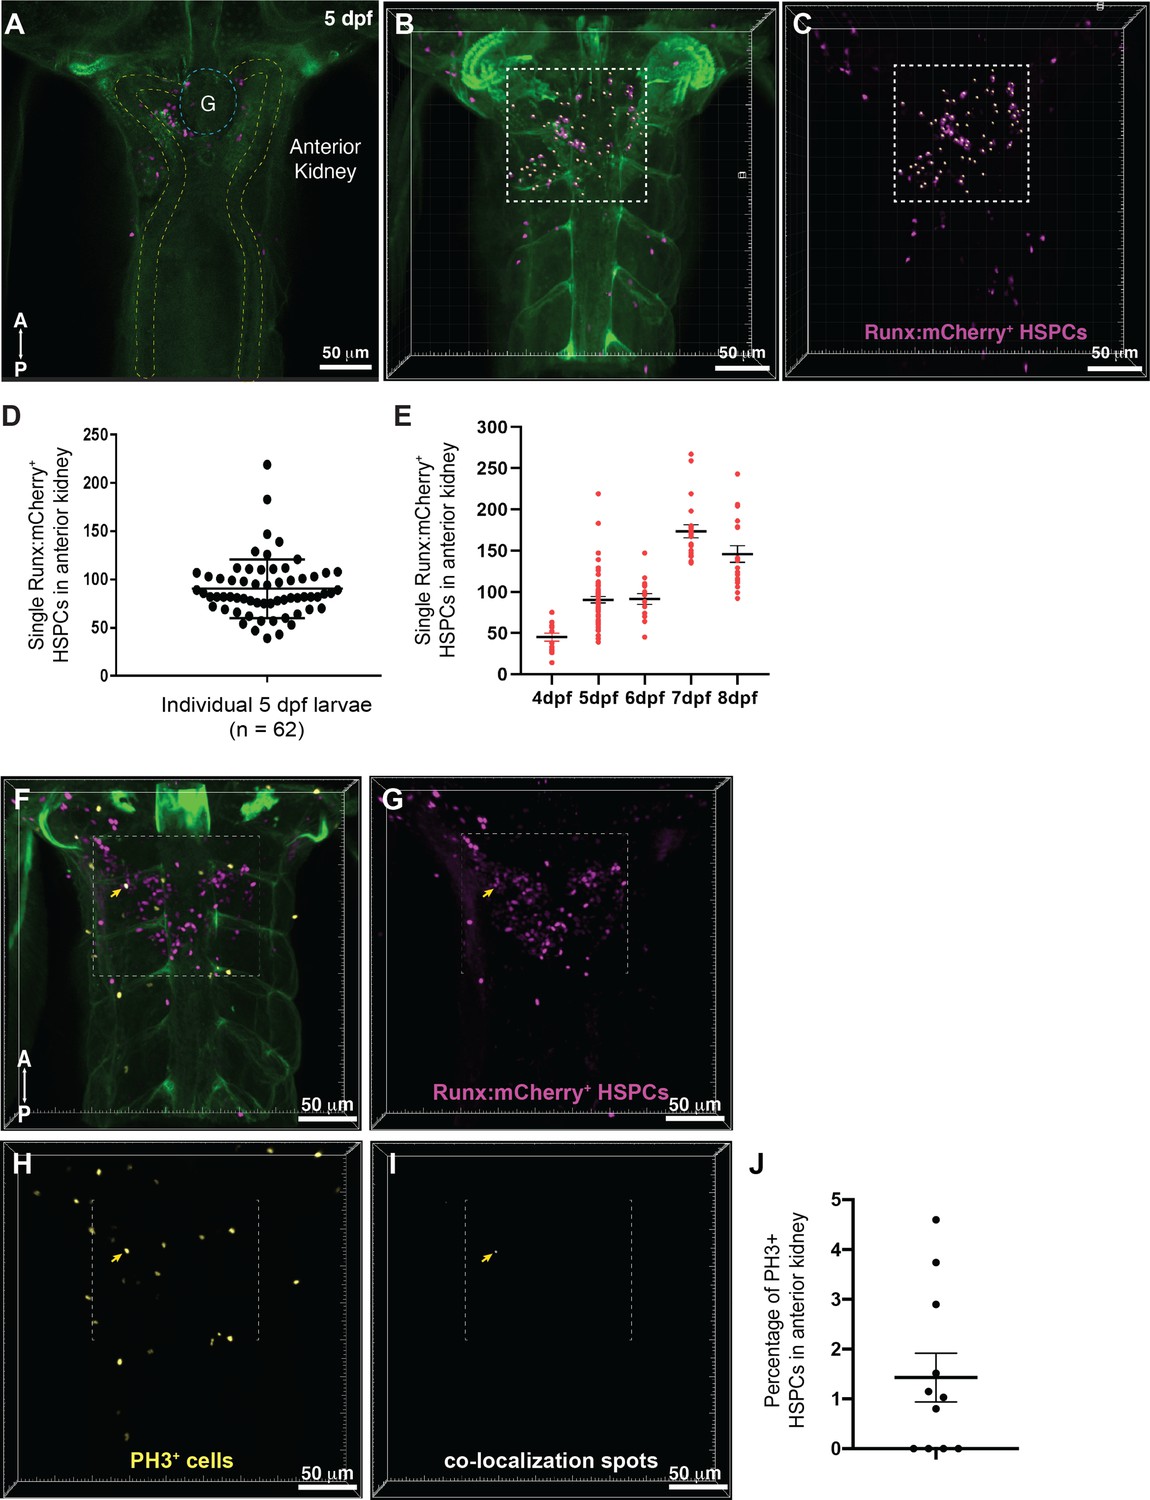
Quantification of Runx:mCherry+ HSPCs in the anterior kidney of the zebrafish larva.
(A) Single Z plane of a confocal stack of fixed 5 dpf Runx:mCherry+ (magenta) transgenic zebrafish larva imaged after optical tissue clearing. The location of glomerulus (G, dotted blue circle) and the pronephric tubules (dotted yellow lines) are shown. The green signal is from injection of Oregon Green dye to label the vasculature. (B) 3D volume rendering of the confocal stack shows the dorsal view with Runx:mCherry+ hematopoietic stem and progenitor cell (HSPC) clusters located in the anterior kidney region (dotted box). (C) Quantification of Runx:mCherry+ HSPCs (white ‘Spots’ in dotted box). (D) Quantification shows a mean of ~100 HSPCs at 5 days post fertilization (dpf). (E) Number of Runx:mCherry+ HSPCs within the niche increases from 4 dpf and peaks at 7 dpf followed by a slight reduction at 8 dpf. Unpaired t test with Welch’s correction. 4 vs. 5, 6, 7, 8 dpf, p<0.0001. 5 vs. 6 dpf, p=0.8987. 5 vs. 7, 8 dpf, p<0.0001. 6 vs. 7, 8 dpf, p<0.0001. 7 vs. 8 dpf, p=0.0392. Sample size (n): 4 dpf, n=13; 5 dpf, n=62; 6 dpf, n=15; 7 dpf, n=21; 8 dpf, n=18. Results combined from three independent experiments. (F–I) Phospho-histone H3 (PH3) staining in fixed 5 dpf Runx:mCherry+ larvae. (F) Overlay of transgenic zebrafish larva, (G) showing Runx:mCherry+ HSPCs, (H) stained with PH3 antibody to label the proliferating cells. (I) Runx:mCherry+ and PH3+ staining co-localize in one HSPC within the niche as seen by co-localization spot (Imaris; yellow arrowhead). (J) Quantification of PH3+ and Runx:mCherry+ double positive cells among Runx:mCherry+ cells shows that ~1.5% of HSPCs proliferate at this stage (n=11). Results combined from three independent experiments. Abbreviations: A, anterior; P, posterior.
Figure 1—figure supplement 2
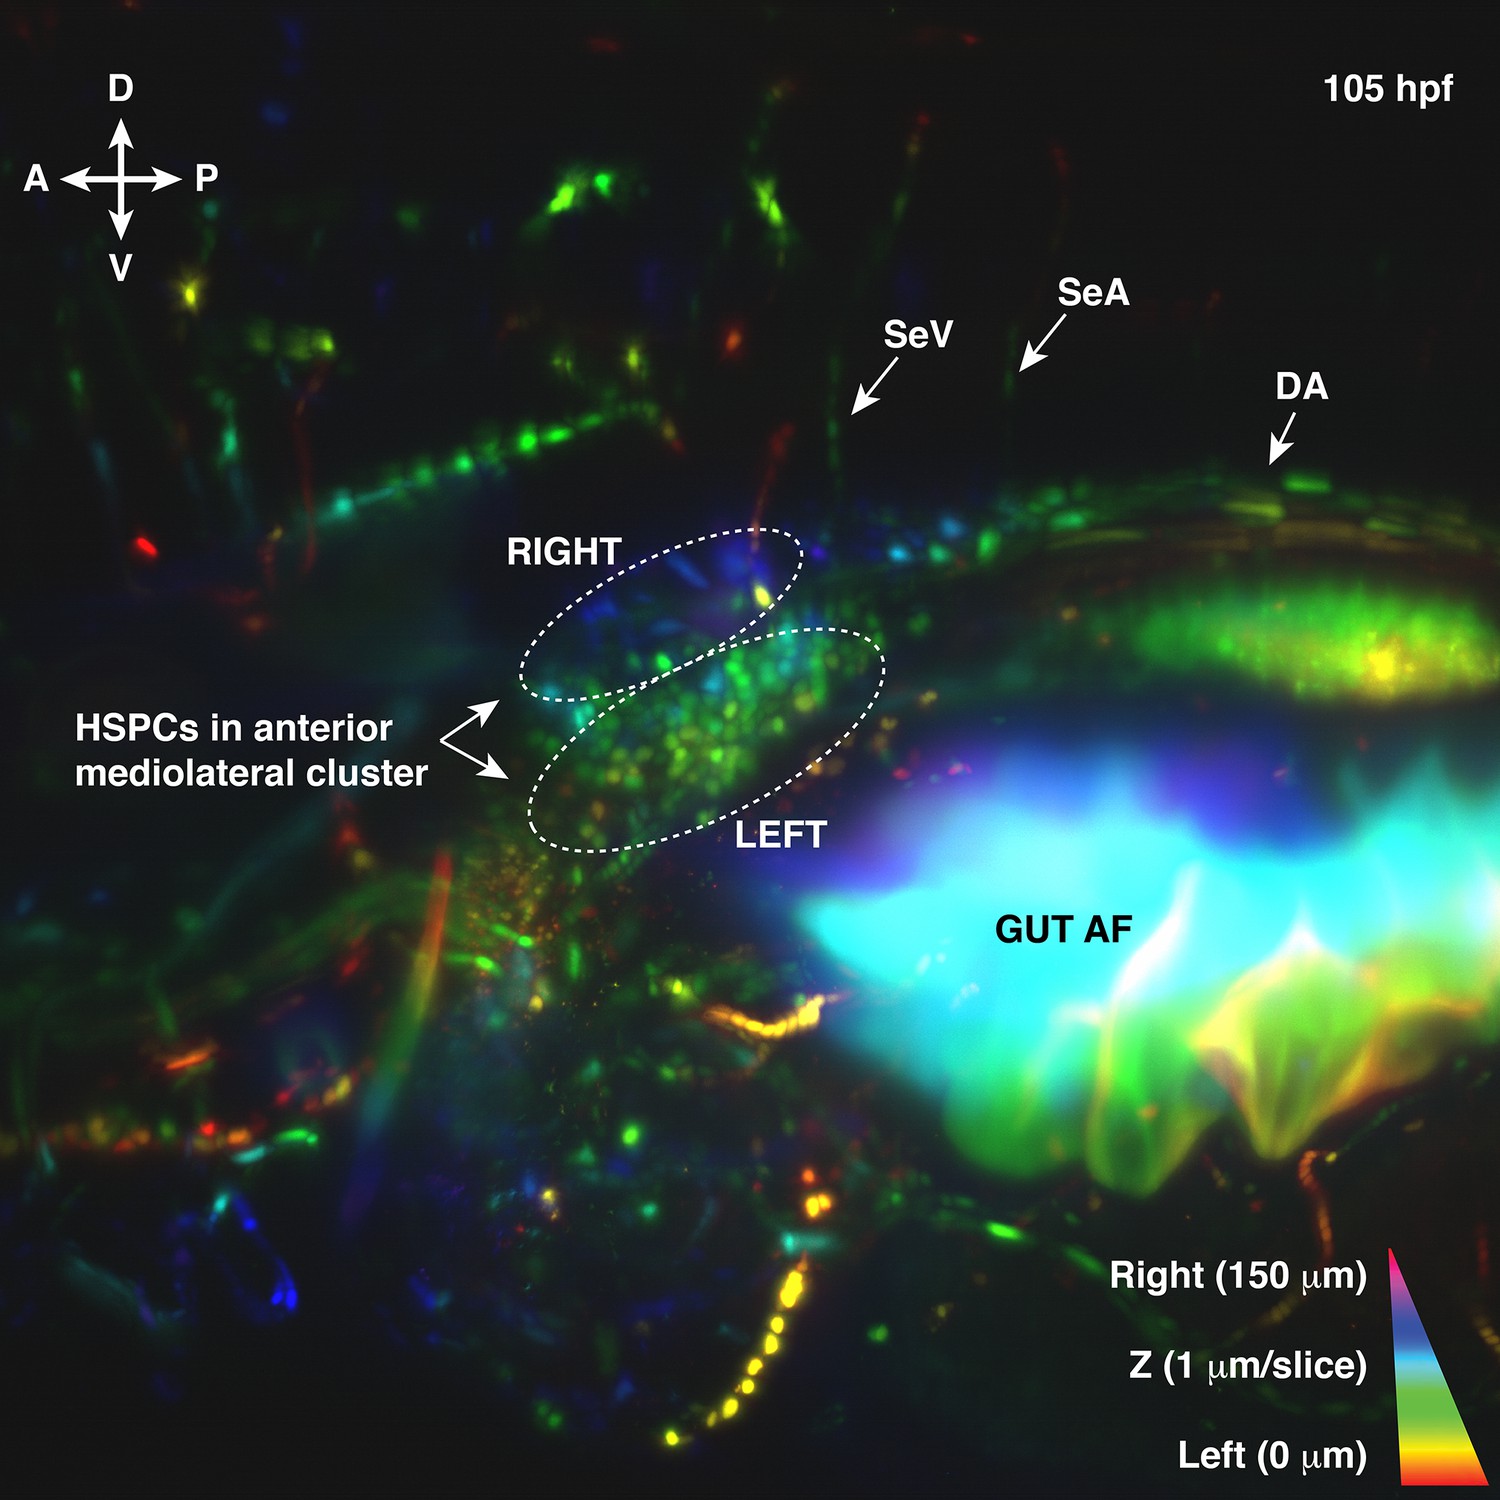
First frame from light sheet live imaging of Runx:mCherry+ 105 hr post fertilization (hpf) larva.
Corresponds to Figure 1—video 1. Depth-coded projection in Z plane from left (0 μm red < orange < yellow <green) to right (blue < indigo < violet 150 μm). Runx:mCherry+ hematopoietic stem and progenitor cells (HSPCs) are found in mediolateral clusters. Abbreviations: DA, dorsal aorta; SeA, intersegmental artery; SeV, intersegmental vein; AF, autofluorescence; D, dorsal; V, ventral; A, anterior; P, posterior.
Figure 1—figure supplement 3
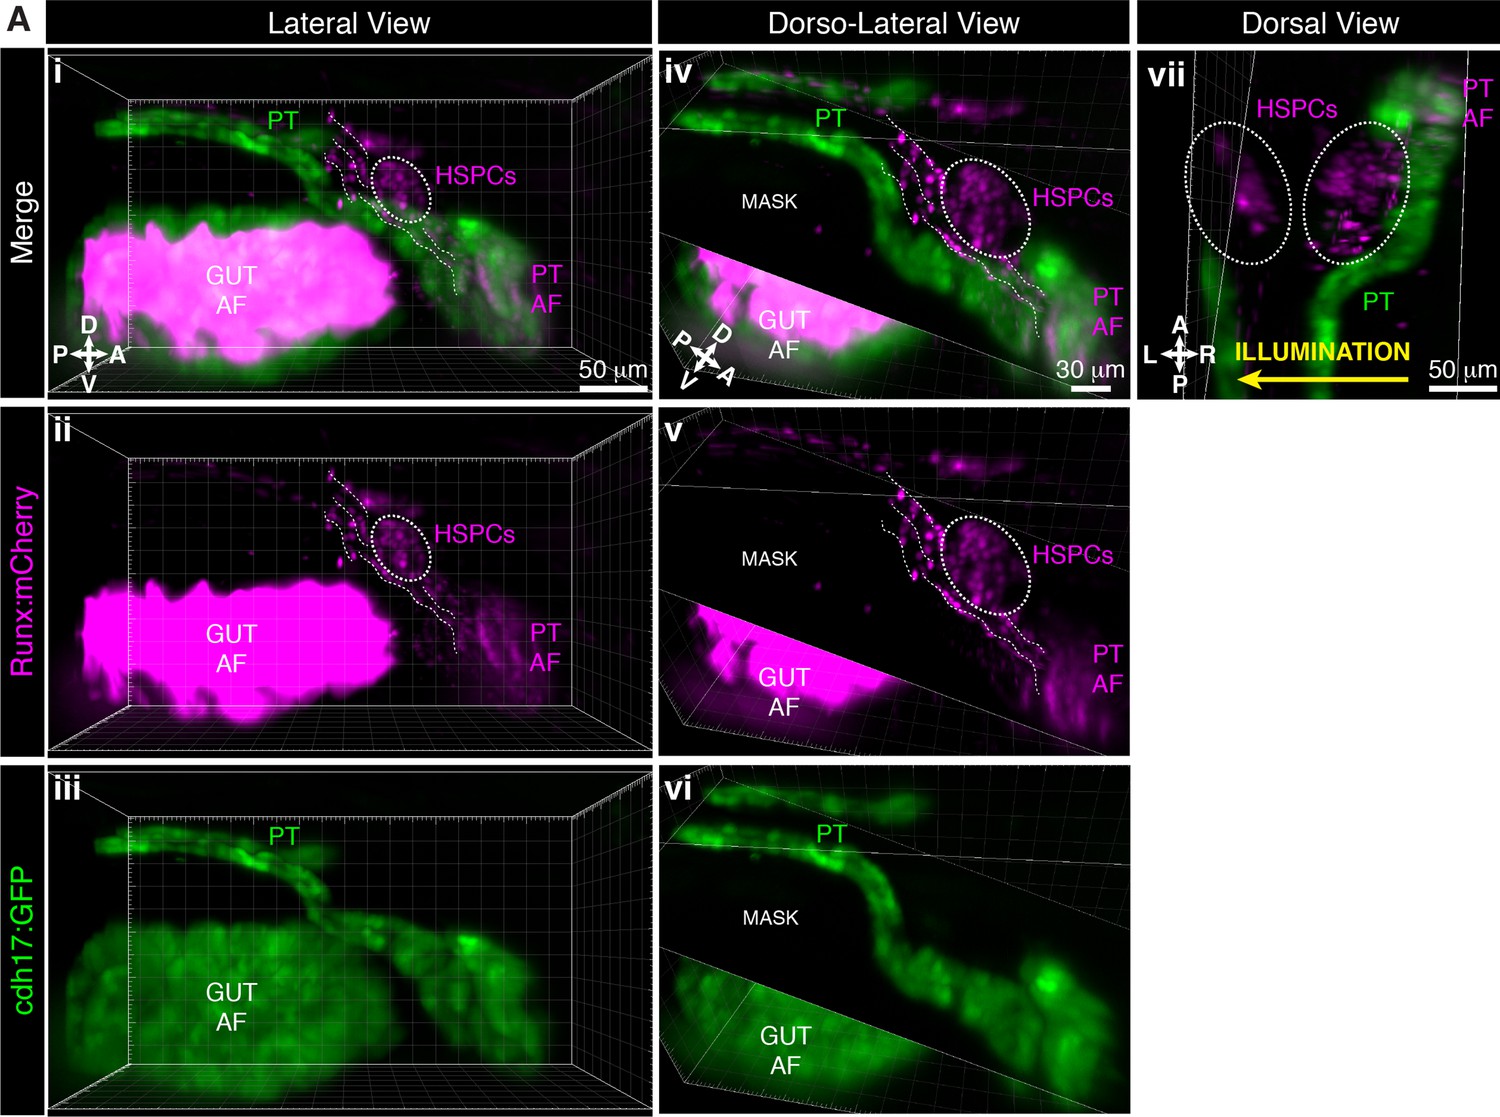
Light sheet live imaging shows hematopoietic stem and progenitor cell (HSPC) clusters are mediolateral to the proximal pronephric tubules (PT).
Larva is 5 days post fertilization (dpf). (Ai–Aiii) Lateral and (Aiv–Avi) dorso-lateral views of Runx:mCherry and cdh17:GFP double transgenics labeling the HSPCs and PT, respectively. HSPC cluster (dotted oval) relative to proximal PT. The dotted lines show cells in circulation. ‘Mask’ is an oblique slice on Imaris to block the background autofluorescence (AF) from the gut. (Avii) Dorsal view of the same larva shows two HSPC clusters located mediolaterally to proximal PT. Light sheet imaging illuminated this sample from the right side, showing how signal and resolution is poorer further from the light source. Abbreviations: D, dorsal; V, ventral; A, anterior; P, posterior; L, left; R, right.
Figure 1—figure supplement 4
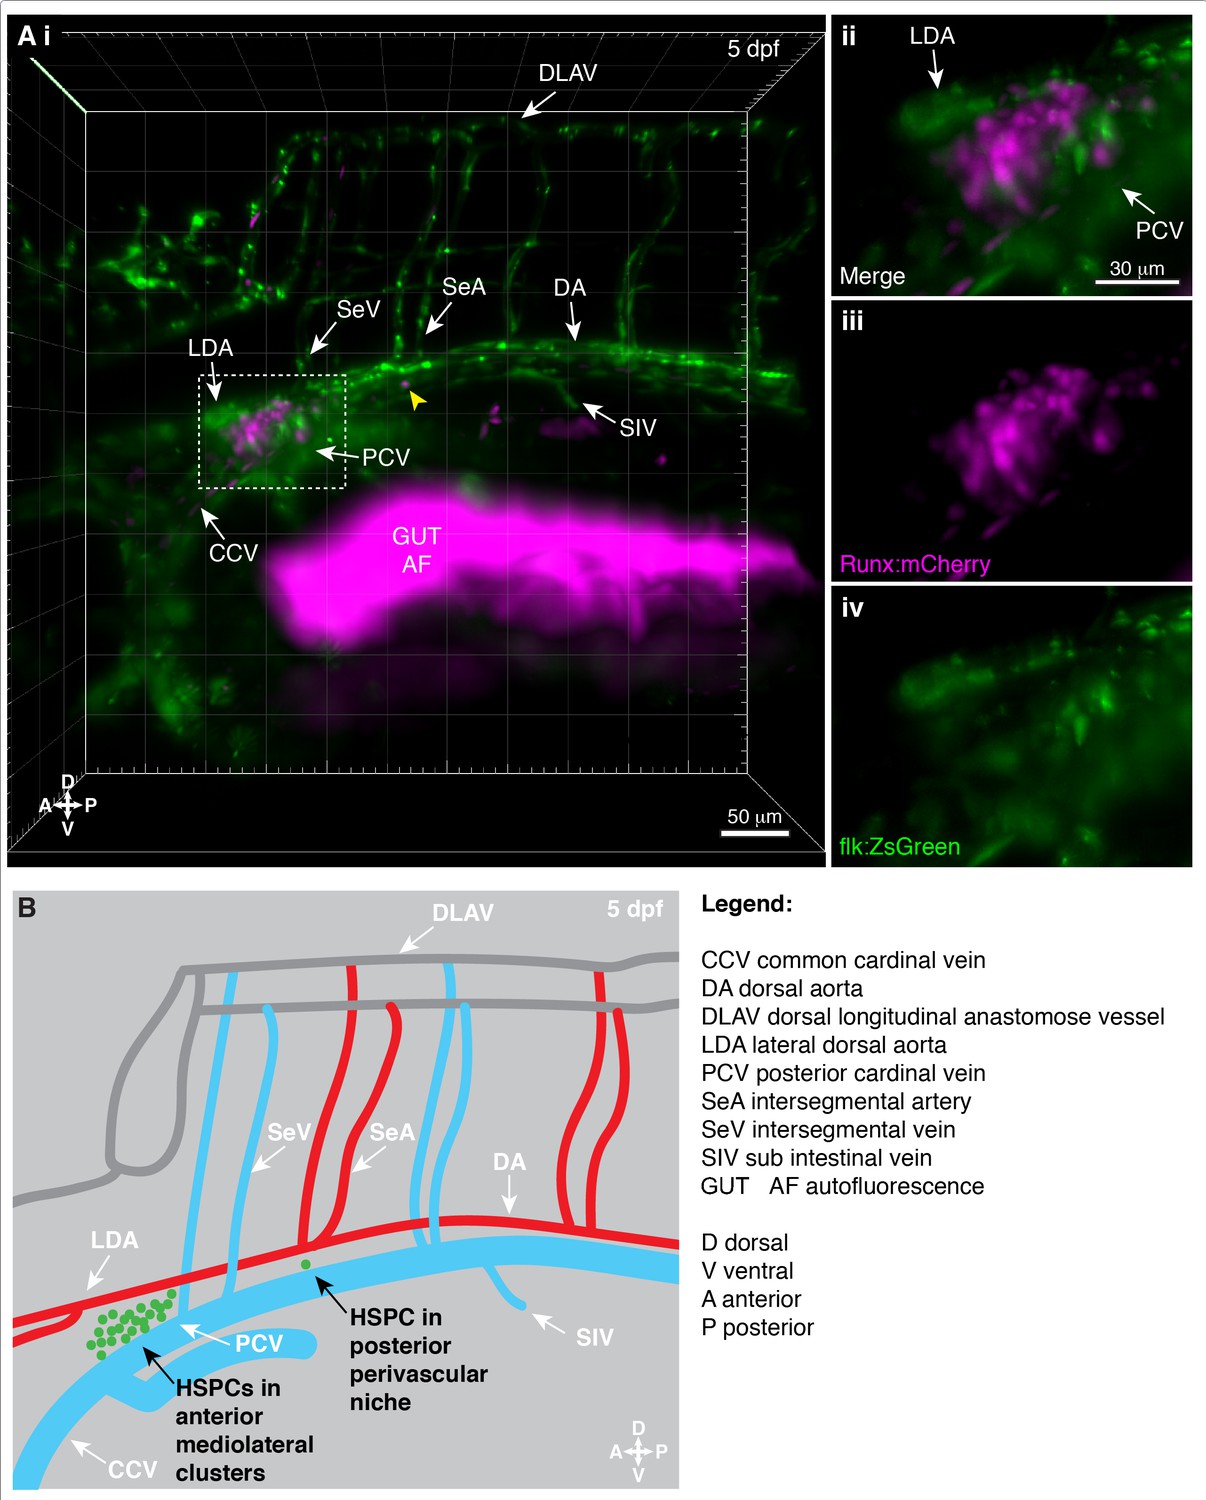
Light sheet live imaging of the anterior kidney reveals hematopoietic stem and progenitor cells (HSPCs) in distinct perivascular regions.
Larva is 5 days post fertilization (dpf). (A) (i) 3D projection of the anterior kidney in Runx:mCherry+ (HSPCs) and flk:ZsGreen+ (ECs) double transgenic larva imaged using light sheet microscope. HSPC cluster (mCherry+) is located between ZsGreen+ LDA and PCV (white dashed box). Single mCherry+ HSPC is in a perivascular niche that is posterior to the HSPC cluster (yellow arrowhead). (Aii) Detail of the mCherry+ HSPC cluster located between ZsGreen+ LDA and PCV (merged), (Aiii) Runx:mCherry+ HSPCs alone, and (Aiv) flk:ZsGreen+ LDA and PCV alone. (B) Schematic showing the location of HSPCs (green dots) relative to the vasculature in the kidney marrow (KM). HSPCs form anterior mediolateral clusters or are located as single cells within the posterior perivascular niche.
Figure 1—figure supplement 5
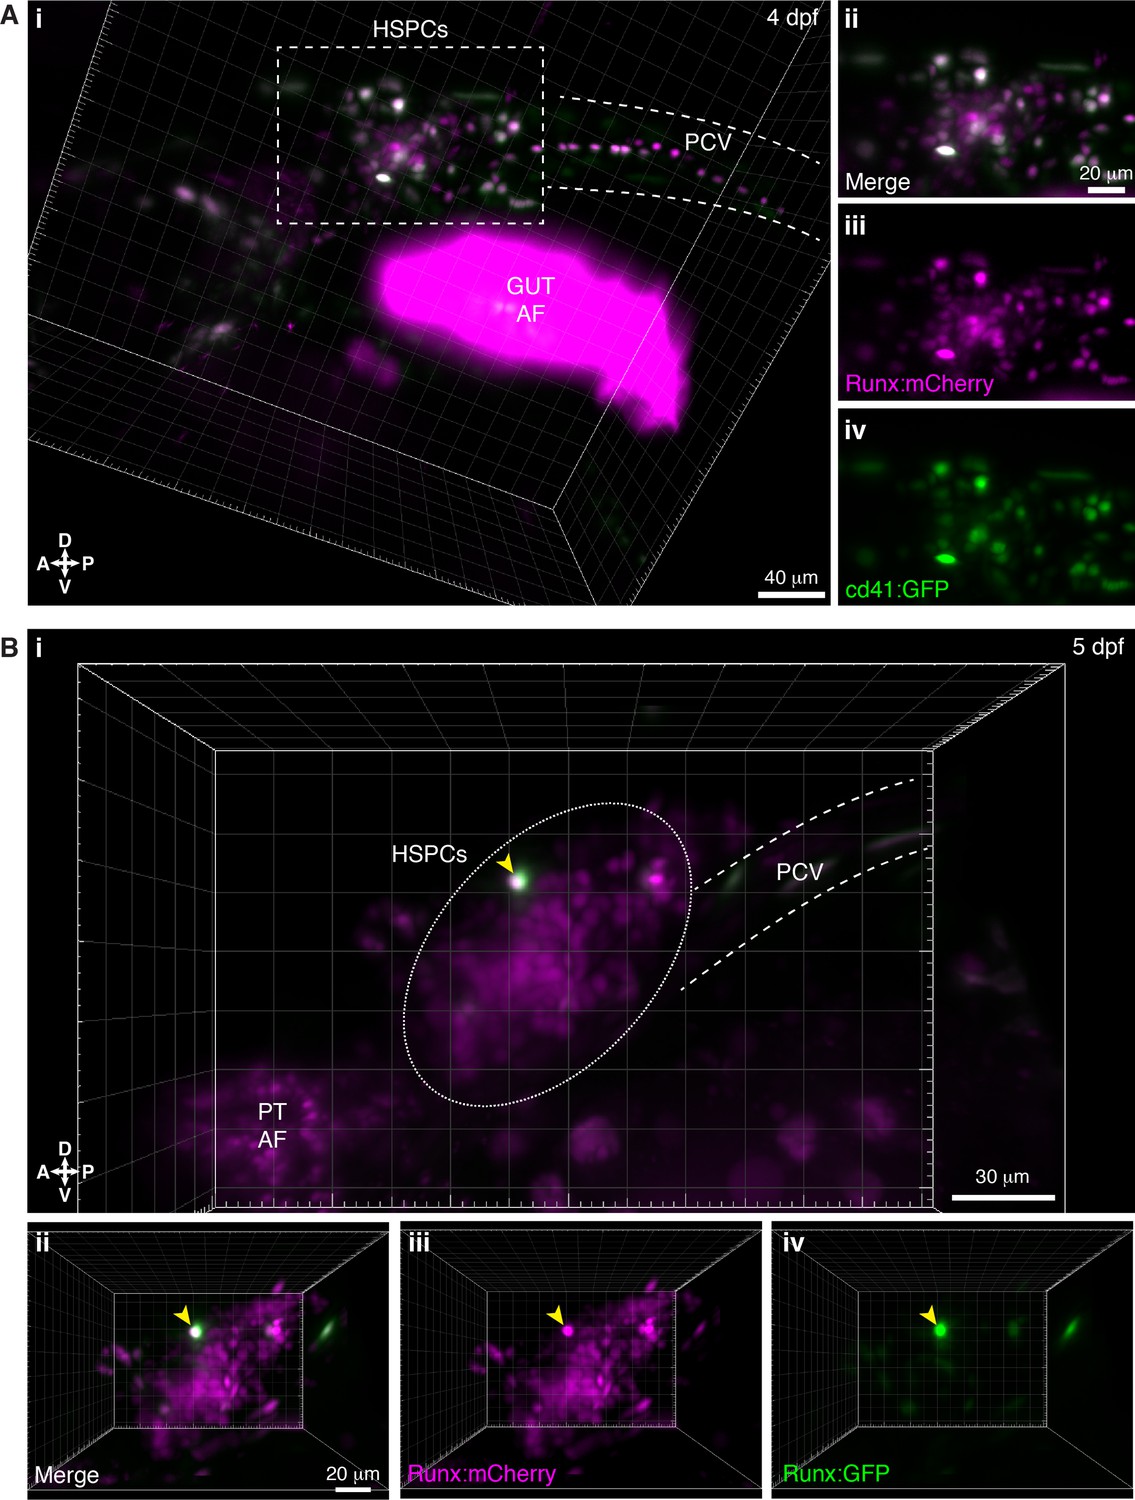
Light sheet live imaging of overlap of hematopoietic stem and progenitor cell (HSPC) transgenic reporter lines.
(A) Runx:mCherry and cd41:GFP double positive larva (4 days post fertilization [dpf]). (i) 3D projection shows overlap between the Runx:mCherry and cd41:GFP positive populations (white dashed rectangle). (ii–iv) Detail of the HSPC cluster. (B) Runx:mCherry and Runx:GFP double positive larva (5 dpf). (i) 3D projection shows overlap between the Runx:mCherry and Runx:GFP positive populations (yellow arrowhead), with Runx:mCherry more broadly expressed in HSPCs, as previously published (Tamplin et al., 2015). (ii–iv) Detail of the HSPC cluster. Abbreviations: PT, pronephric tubules; AF, autofluorescence; PCV, posterior cardinal vein; D, dorsal; V, ventral; A, anterior; P, posterior.
Figure 1—video 1
Depth-coded projection of a time-lapse video shows migrating mCherry+ hematopoietic stem and progenitor cells (HSPCs) occupying the kidney marrow (KM) niche.
Corresponds to Figure 1—figure supplement 2. Runx:mCherry+ zebrafish larva embedded in low melting agarose was aligned to the laser path from the left side to illuminate the KM, which results in a distinctly visible mediolateral HSPC cluster on the left compared to the right side. Depth-coding is along a rainbow spectrum, with red-orange-yellow on the left side, green-blue in the midline, and violet on the right side. We observed HSPCs that were rapidly moving in circulation, as well as those that were mostly static in the mediolateral clusters. Larva is 105 hr post fertilization (hpf) at the start of imaging. Frames were captured every 2 min. The video was rendered at 2 frames per second (fps). Timestamp is hours:minutes after start of imaging. Abbreviations: SeA, intersegmental artery; SeV, intersegmental vein; DA, dorsal aorta; Gut AF, autofluorescence; D, dorsal; V, ventral; A, anterior; P, posterior.
Figure 1—video 2
Single circulating hematopoietic stem and progenitor cells (HSPCs) interact with the posterior perivascular niche region.
Corresponds to Figure 1. Time-lapse video shows Runx:GFP+ HSPCs (green) in circulation through flk:mCherry+ vessels (magenta). Occasionally, HSPCs slow and attach to vessels in the perivascular region of the larval kidney marrow (KM) niche. Larva is 5 days post fertilization (dpf) at the start of imaging. Frames were captured every 12.5 s. The video was rendered at 15 frames per second (fps). Timestamp is minutes:seconds after start of imaging. Abbreviations: LDA, lateral dorsal aorta; SeA, intersegmental artery; SeV, intersegmental vein; DA, dorsal aorta; PCV, posterior cardinal vein; D, dorsal; V, ventral; A, anterior; P, posterior.
Figure 2

Hematopoietic stem and progenitor cells (HSPCs) lodged in the larval kidney niche make direct contacts with endothelial cells (ECs) and mesenchymal stromal cells (MSCs).
(A) Single optical section from confocal image of larval kidney (fixed) shows Runx:mCherry+ HSPCs (magenta) lodged in the perivascular niche. Oregon Green dye labels the vessel lumen. Blue dotted lines surround the dorsal aorta (DA) and red dotted lines surround the glomerulus (G). Tight junction protein is marked by zonula occludens-1 (ZO-1) (white). (B) High-resolution optical sections (0.5 µm steps) through the boxed regions in (A) show ZO-1+ contact points between mCherry+ HSPCs and the niche (yellow arrowheads). (C) Orthogonal slices (XY and YZ planes) from live light sheet 3D volume of larval kidney niche. Single cd41:GFP+ HSPCs (green) is in contact or in close proximity (yellow arrowhead) to cxcl12:DsRed2+ MSCs (magenta). The white dotted line represents the DA. (D) Quantification of distances measured between GFP+ HSPC and DsRed2+ MSCs shows ~60% of HSPCs are in contact with MSCs, and the remaining are within 9 µm. Numbers above the columns indicate the cell numbers counted in each group (from n=8 embryos). Abbreviations: D, dorsal; V, ventral; A, anterior; P, posterior.
Figure 3 with 4 supplements
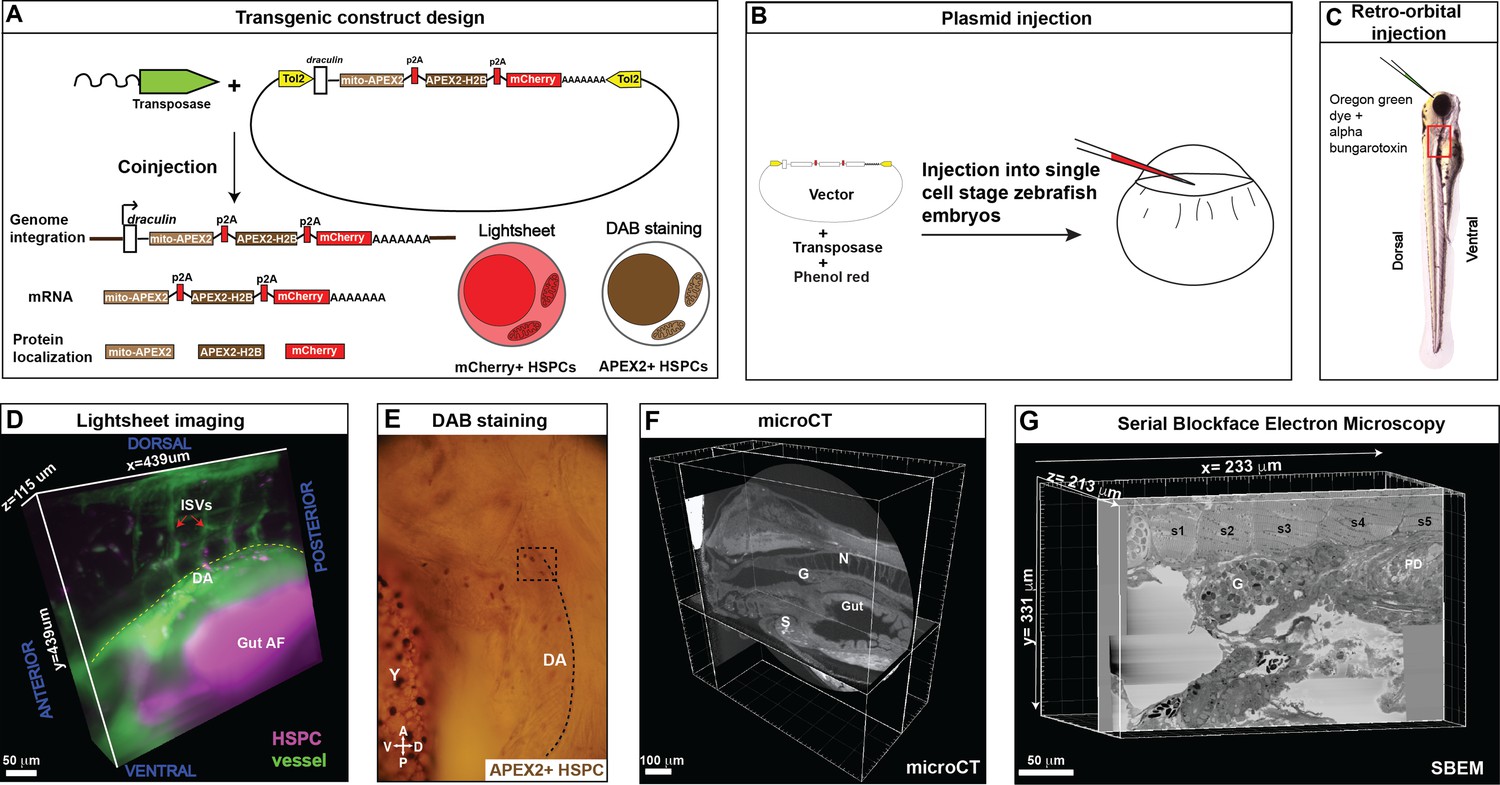
Correlative light and electron microscopy (CLEM) Workflow #1 to genetically encode a label in endogenous hematopoietic stem and progenitor cells (HSPCs) for live tracking by light microscopy and high-contrast resolution in serial block-face scanning electron microscopy (SBEM) sections.
(A) Fusion construct encoding p2A-linked proteins mito-APEX2, APEX2-H2B, and mCherry that localize to the mitochondria, nucleus, and cytoplasm, respectively. The draculin promoter was used to transiently drive strong mosaic expression in HSPCs. Random insertion in the genome was by Tol2-mediated transgenesis. (B) Tol2 draculin:mito-APEX2_p2A_APEX2-H2B_p2A_mCherry (drl:APEX2-mCherry) fusion construct was injected together with tol2 mRNA in one cell wild type zebrafish embryos. (C) At 5 days post fertilization (dpf), embryos with circulating mCherry+ HSPCs were visually screened and retro-orbitally injected with alpha bungarotoxin to paralyze the embryo, and Oregon Green dye to label the vasculature. (D) Dye-injected mCherry+ double positive embryos were visually screened and used for light sheet microscopy (example shows a 439 × 439 × 115 µm3 volume of the anterior kidney marrow (KM); ISVs, intersegmental vessels; yellow dotted line, DA, dorsal aorta; gut AF, gut autofluorescence). (E) Brightfield example of a single embryo after fixation and DAB (3,3'-diaminobenzidine) staining to label APEX2+ HSPCs that are located within the dotted box (dotted line marks DA, dorsal aorta; Y, yolk; D, dorsal; V, ventral; A, anterior; P, posterior). (F) After embedding, the sample was oriented and trimmed based on images acquired using micro-computed tomography (microCT) (example shows orthogonal sections in three planes, N; notochord, G; glomerulus, S; swim bladder). (G) Single plane from ~3000 sections of SBEM data (example shows a 233 × 331 × 213 µm3 volume; s1-s5, somites 1–5; G, glomerulus; PD, pneumatic duct).
Figure 3—figure supplement 1
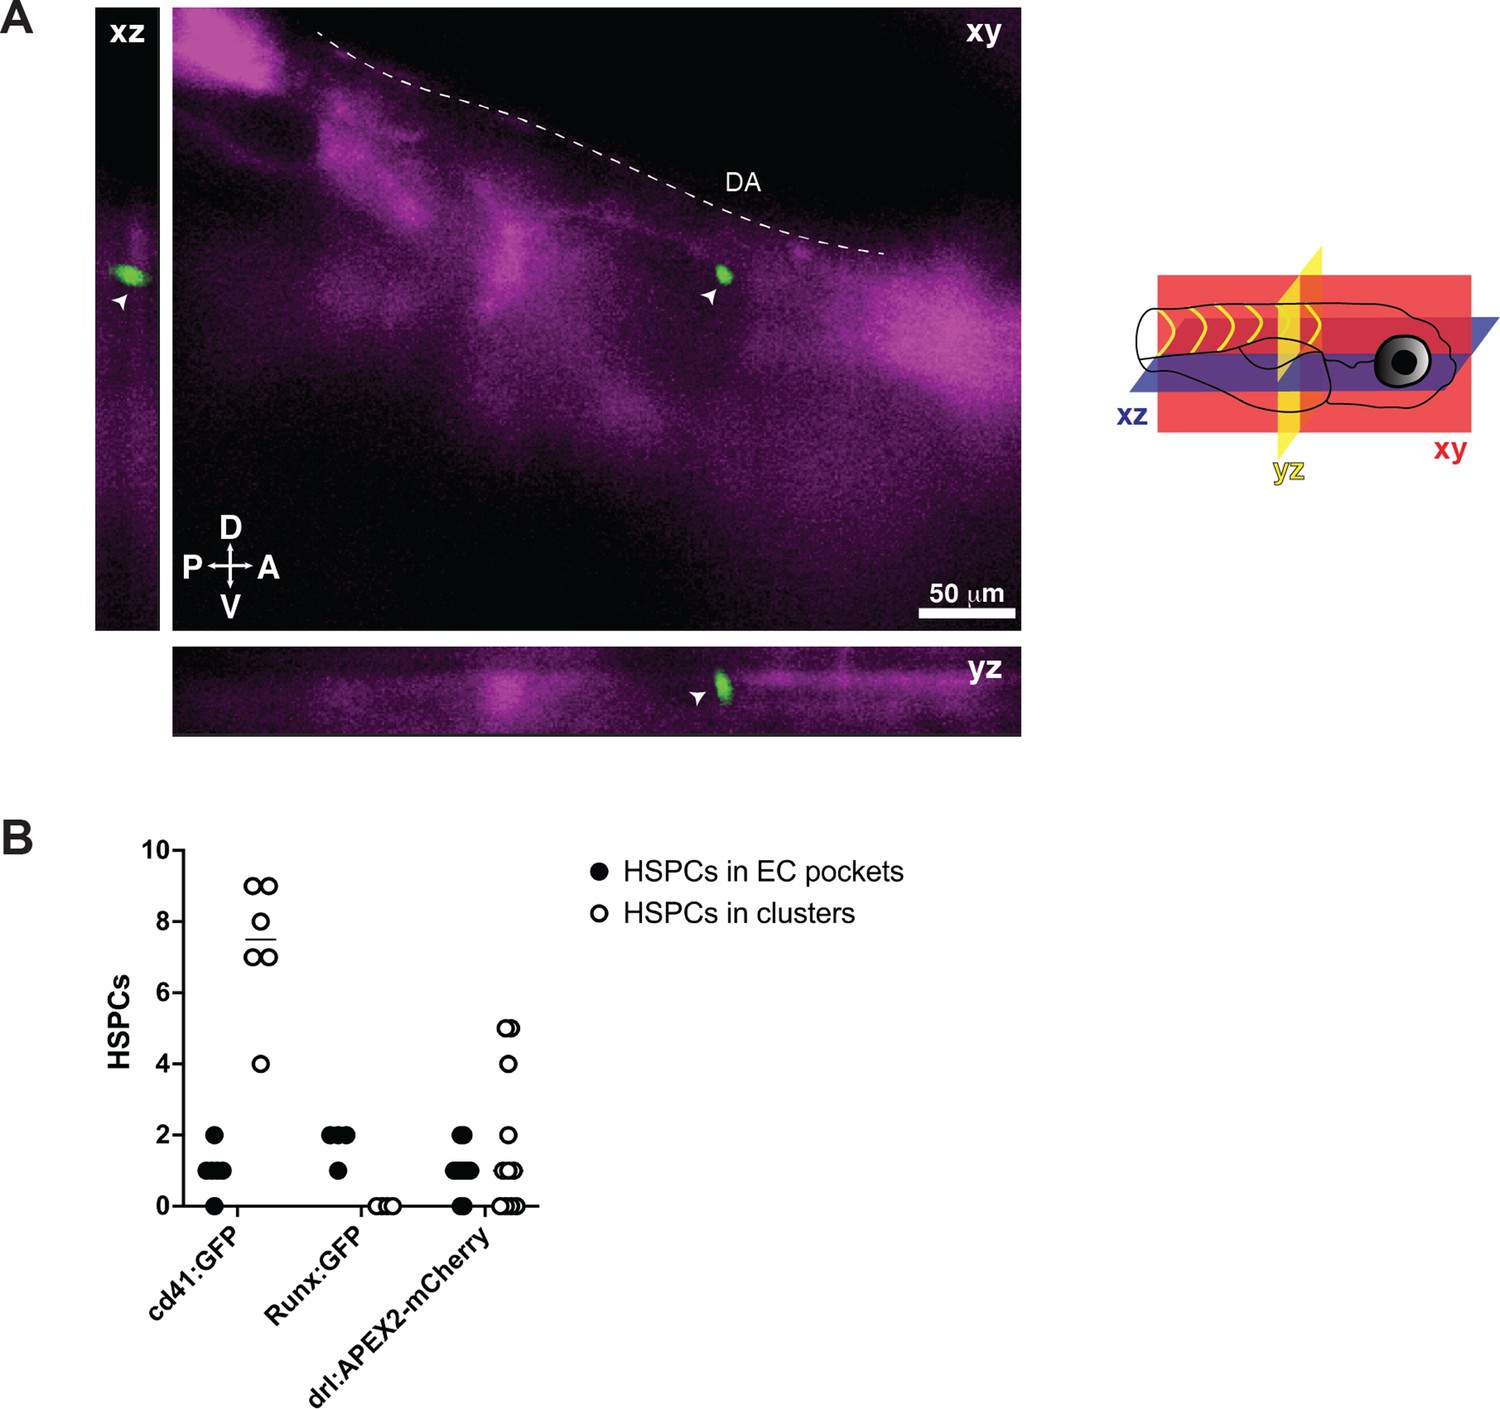
Single cd41:GFP+ hematopoietic stem and progenitor cell (HSPC) lodged in the perivascular niche.
(A) Snapshot of single optical sections (XY, XZ, YZ planes) from light sheet live image of a 5 days post fertilization (dpf) cd41:GFP;flk:mCherry double transgenic zebrafish larva. A single cd41:GFP+ HSPC (white arrowhead) is lodged in the perivascular region lateral to the dorsal aorta. DA, dorsal aorta; D, dorsal; V, ventral; A, anterior; P, posterior. Diagram shown to right. (B) Graph showing number of putative HSPCs lodged in either perivascular endothelial cell (EC) pockets (black circles), or in clusters (white circles). HSPCs counted in cd41:GFP+, Runx:GFP+, and drl:APEX2-mCherry+ transgenic larvae.
Figure 3—figure supplement 2
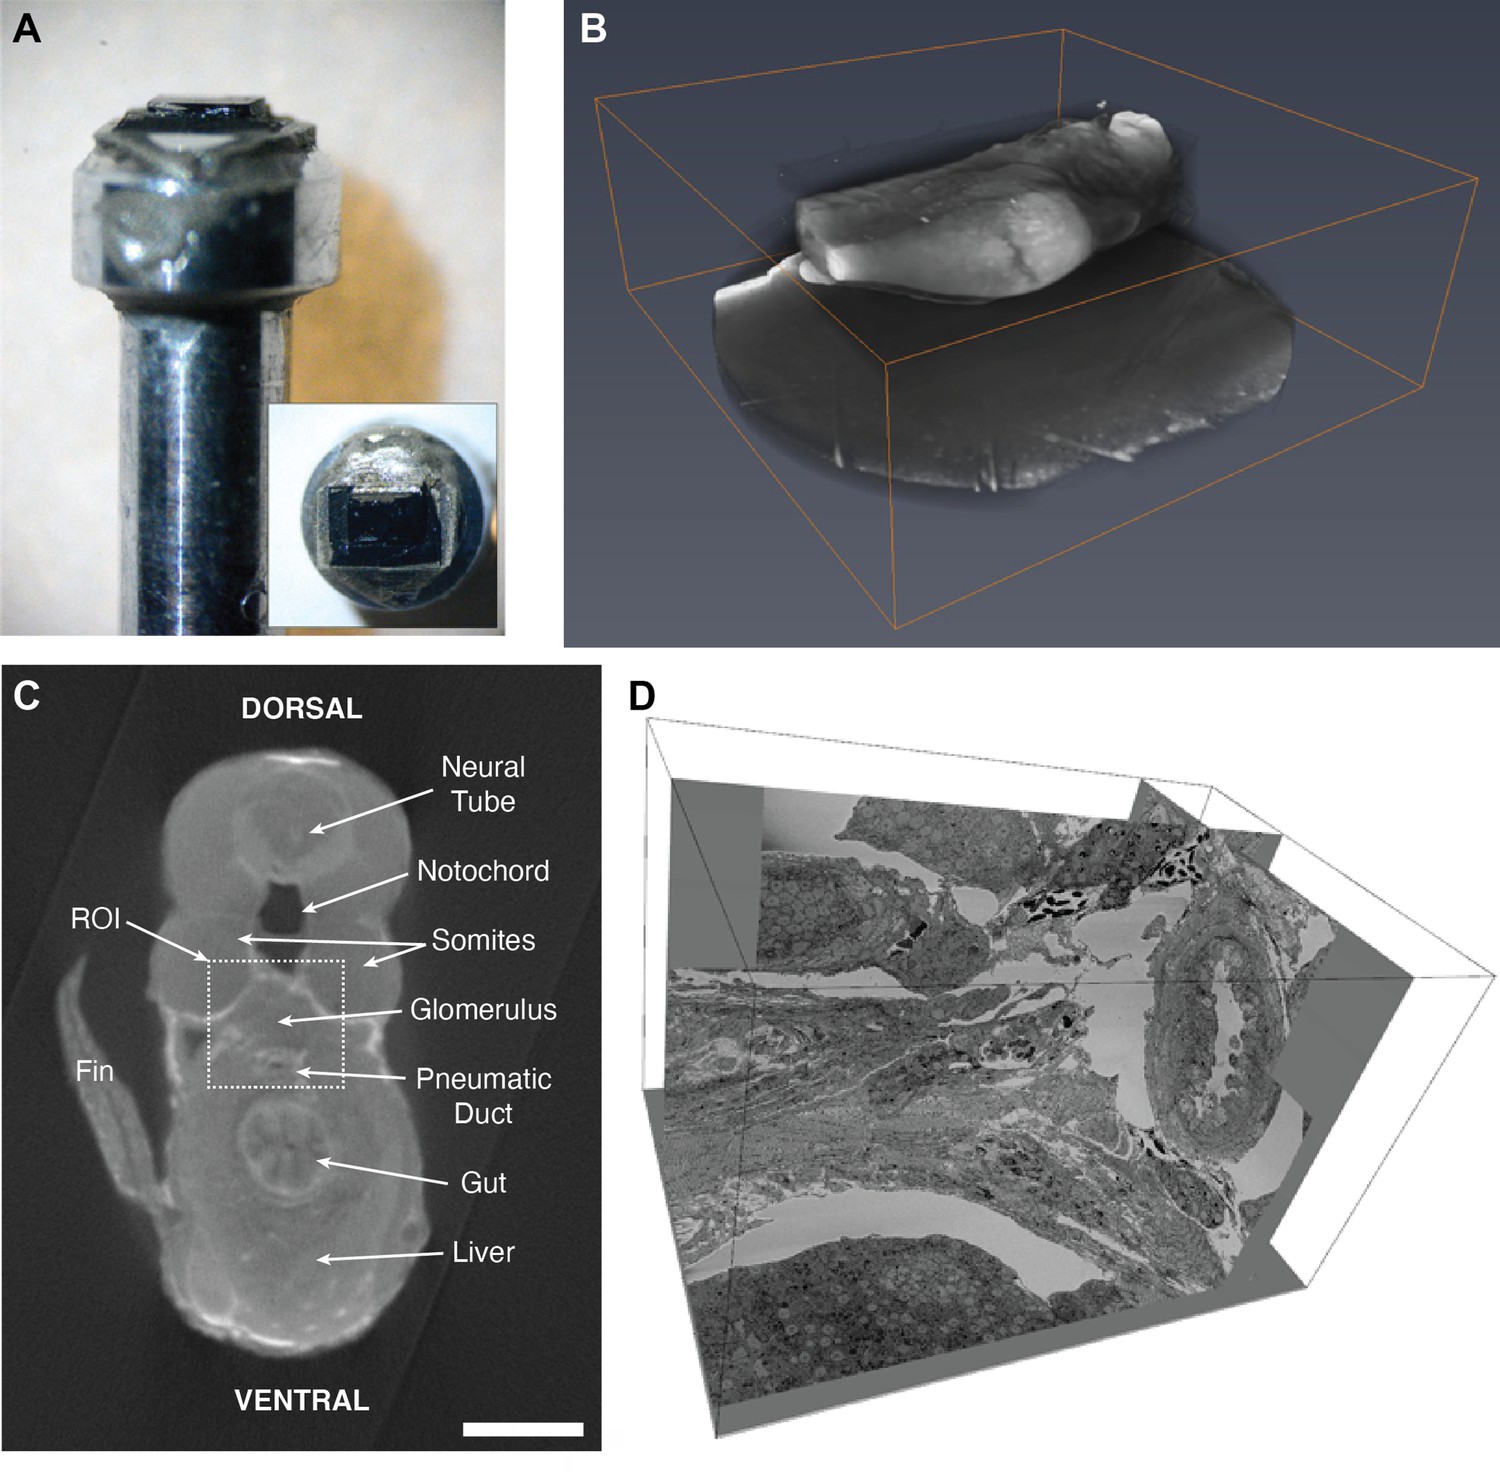
Method for mounting, aligning, and trimming the embedded sample for serial block-face scanning electron microscopy (SBEM).
(A) The zebrafish tissue block on the aluminum pin is completely opaque to light following staining for SBEM. (B) Micro-computed tomography (microCT) reveals details within the embedded block and helps to find the exact region of interest (ROI). (C) Single section of microCT dataset labeled with anatomical features. Scale bar: 100 µm. (D) Representative SBEM volume (dimensions: 31 × 22 × 30 µm3).
Figure 3—video 1
Transiently labeled hematopoietic stem and progenitor cells (HSPCs) lodge within the perivascular niche.
Corresponds to Figure 3. Time-lapse movie shows a single lodged mCherry+ HSPC (magenta; yellow arrowhead) in a transient drl:APEX2-mCherry+-injected larva. The cell is lodged ventral to the DA and anterior to the PD. Dextran-conjugated Oregon Green dye is injected to label the vessels (green). Larva is 5 days post fertilization (dpf) at the start of imaging. Frames were captured every 2 min. The video was rendered at 10 frames per second (fps). Abbreviations: ISV, intersegmental vessels; DA, dorsal aorta; PD, pneumatic duct; Gut AF, autofluorescence.
Figure 3—video 2
Micro-computed tomography (microCT) stack acquired through a fixed zebrafish larva.
Corresponds to Figure 3. MicroCT is an intermediate step between light sheet imaging and serial block-face scanning electron microscopy (SBEM) that is used to orient the sample and define our region of interest to proceed with SBEM. Tissue landmarks are labeled including target region of the larval kidney marrow.
Figure 4 with 4 supplements
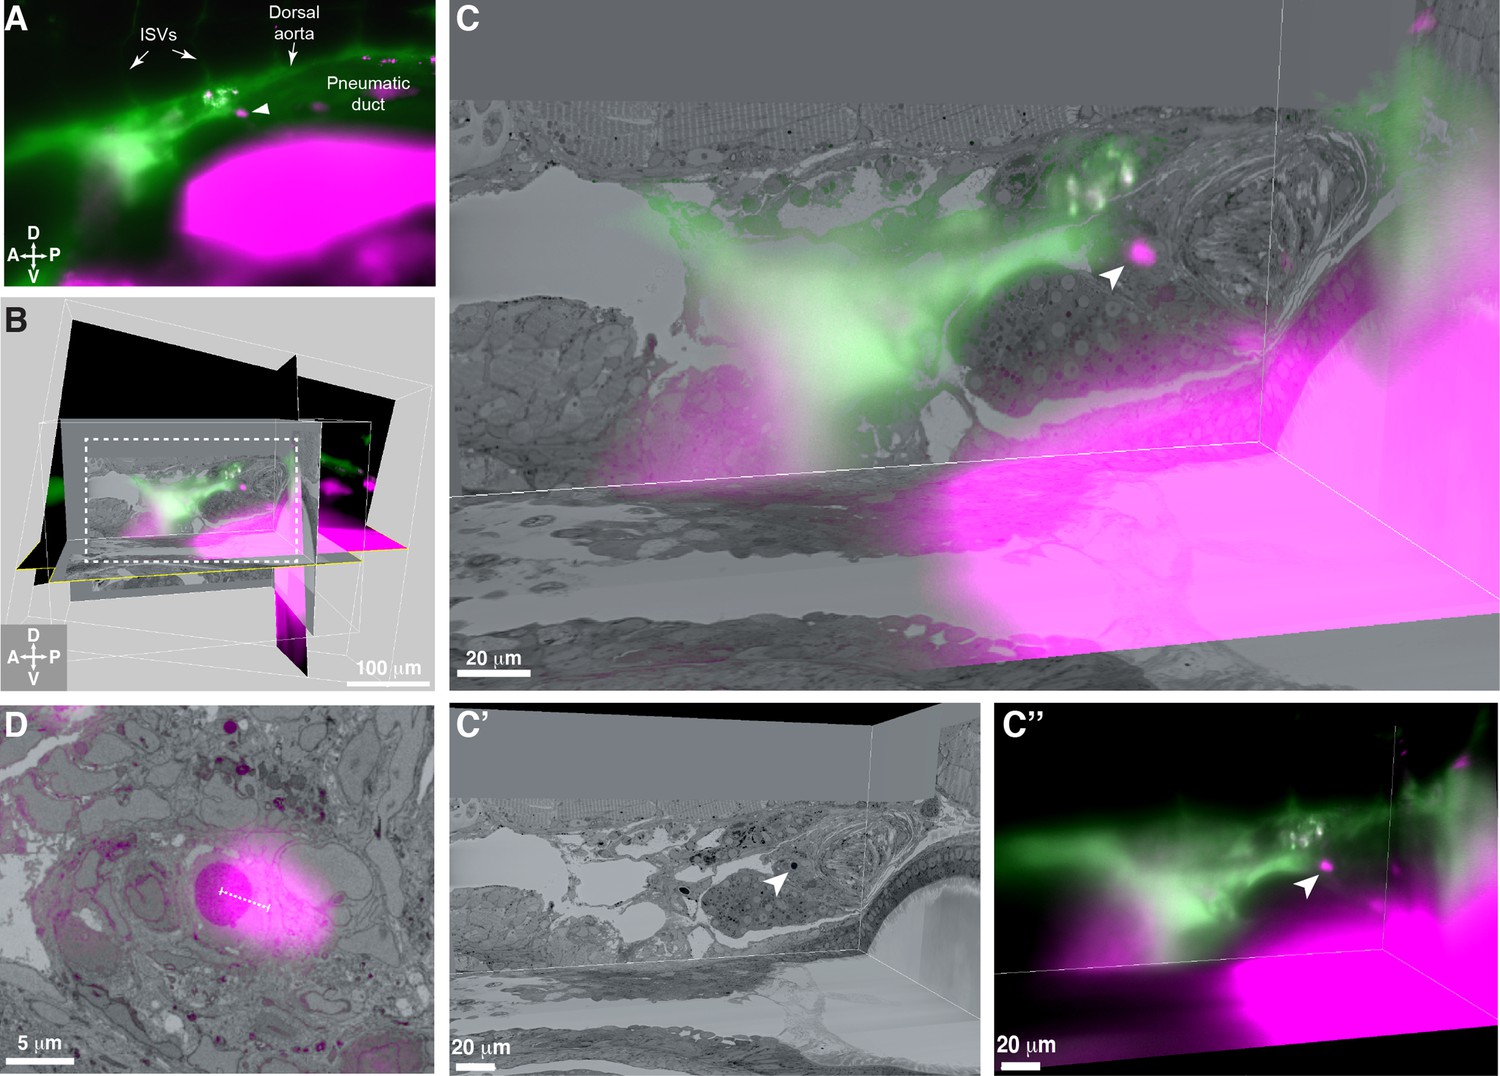
3D alignment of light sheet and serial block-face scanning electron microscopy (SBEM) datasets localizes a single rare hematopoietic stem and progenitor cell (HSPC) across multiple imaging modalities.
(A) Single Z plane from light sheet imaging of drl:APEX2-mCherry+ transgenic larva showing the lodged mCherry+ HSPC (white arrowhead). (B) Global alignment of 3D rendered models generated from light sheet and SBEM datasets using Imaris software. (C) Orthogonal views of the white boxed region within B shows a 3D view of the alignment between light sheet and SBEM datasets. White arrowhead points to the single lodged HSPC in the aligned light sheet and SBEM datasets. (C’) APEX2+ HSPC in SBEM data. (C’’) mCherry+ HSPC in light sheet data. Green: Injected Oregon Green dextran dye marking vessels. Magenta: Runx:mCherry+ HSPCs and autofluorescence in gut. (D) Detail of the alignment shows mCherry+ HSPC and APEX2+ HSPC are <5 µm apart (dotted white line). Abbreviations: ISVs, intersegmental vessels; D, dorsal; V, ventral; A, anterior; P, posterior.
Figure 4—figure supplement 1
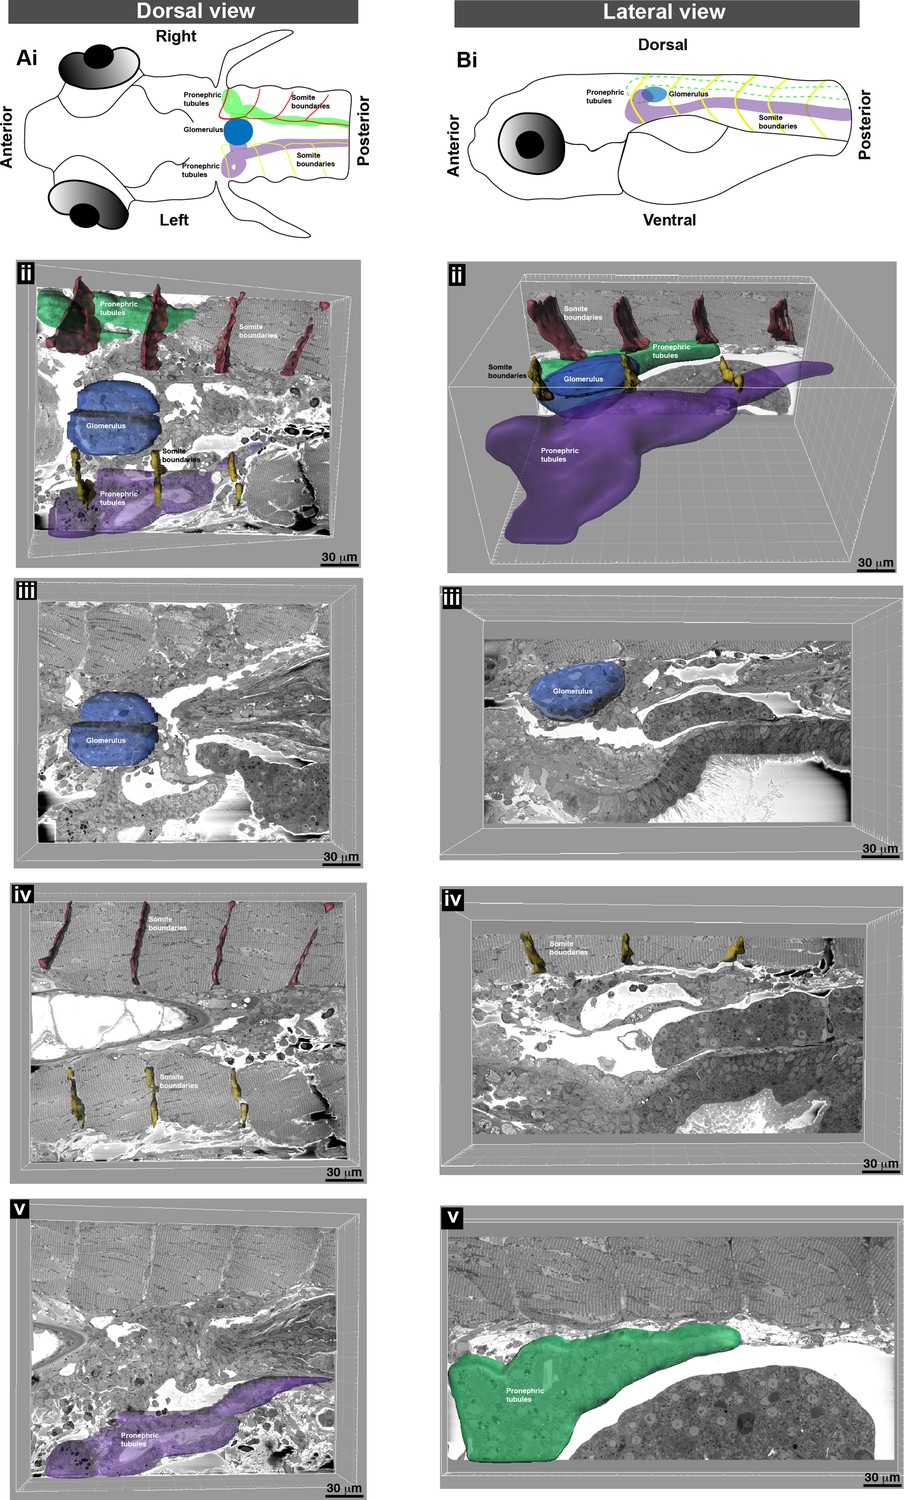
Segmentation and 3D surface rendering identifies anatomical features within the serial block-face scanning electron microscopy (SBEM) datasets.
(A) (i) Schematic dorsal view of a zebrafish larva. (ii) Oblique slice through 3D SBEM data shows the right (green) and left (purple) pronephric tubules, glomerulus (blue), and the right (red) and left (yellow) somite boundaries. Different frontal planes through the SBEM showing the (iii) glomerulus, (iv) somite boundaries, and (v) left pronephric tubules. (B) (i) Schematic lateral view of a zebrafish larva, and (ii) oblique slice through SBEM data showing pronephric tubules, glomerulus, and somite boundaries. Different sagittal planes through the SBEM showing the (iii) glomerulus, (iv) left somite boundaries, and (v) right pronephric tubule. Visualization performed using Imaris software.
Figure 4—figure supplement 2
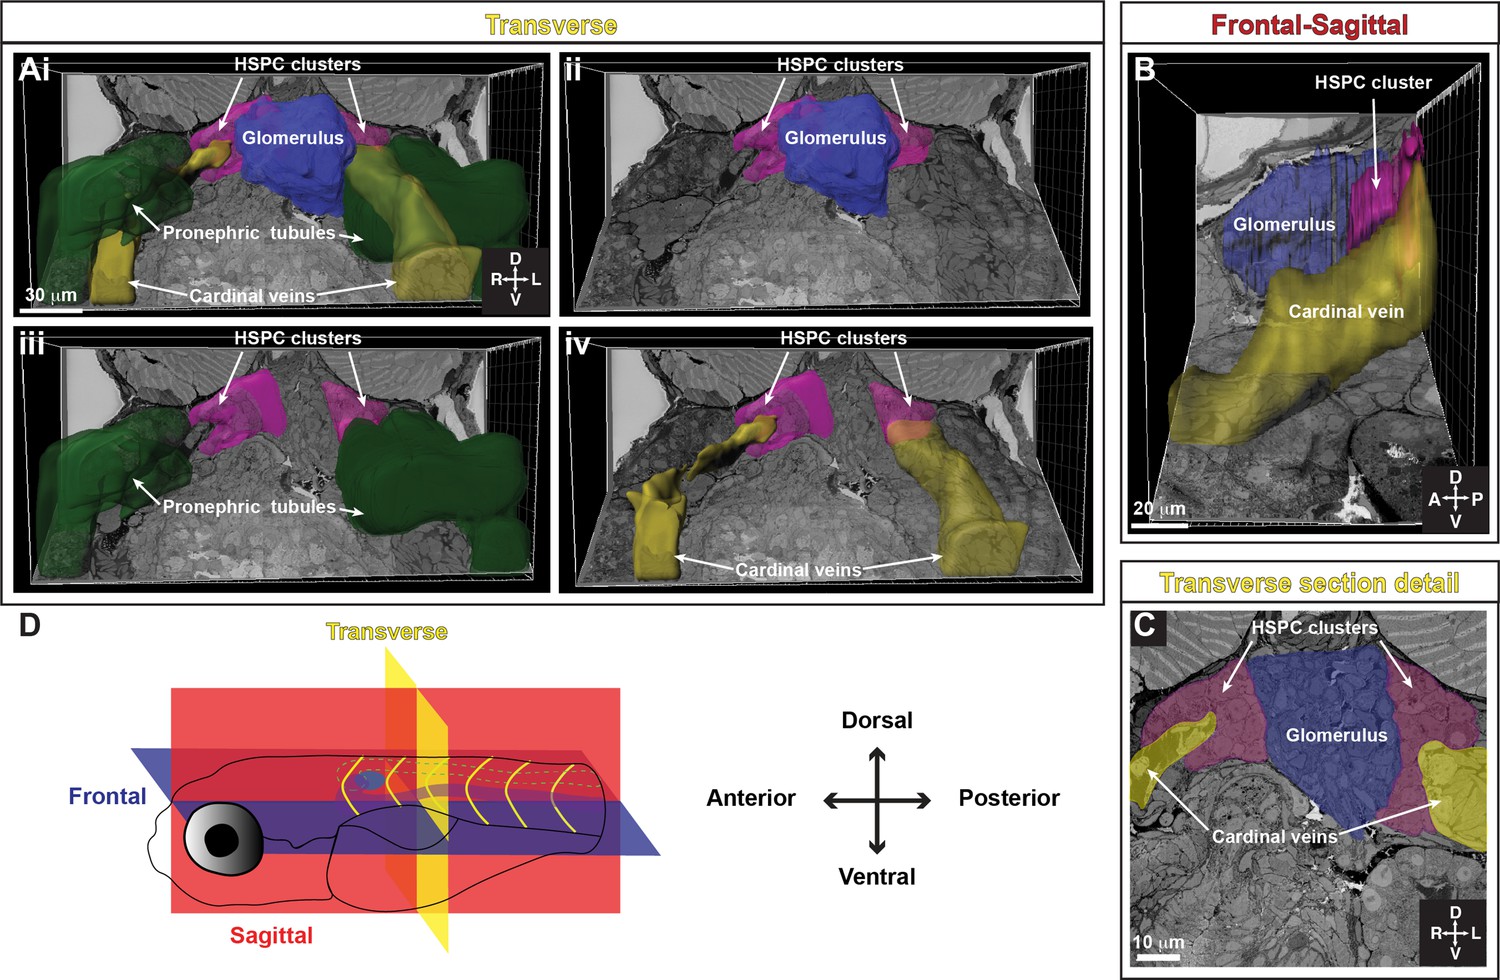
Tracing of serial block-face scanning electron microscopy (SBEM) shows location of anterior hematopoietic stem and progenitor cell (HSPC) clusters relative to the glomerulus, pronephric tubules, and cardinal veins.
(A) (i) Oblique slice along the transverse view of 3D SBEM of zebrafish larva shows the location of anterior HSPC clusters relative to the pronephric tubules, cardinal veins, and the glomerulus. Anterior HSPC clusters are located on either side of the glomerulus (ii), medio-lateral to pronephric tubules (iii), and the cardinal veins (iv). (B) Oblique slice shows the frontal-sagittal view of 3D SBEM of zebrafish larva where the HSPC cluster is located between the glomerulus and the cardinal vein. (C) Detail of a single section in the transverse view shows the location of bilateral HSPC clusters, located between the glomerulus and the cardinal veins. (D) Schematic showing the orientation of the larva and the different planes represented. Abbreviations: D, dorsal; V, ventral; A, anterior; P, posterior; L, left; R, right.
Figure 4—figure supplement 3
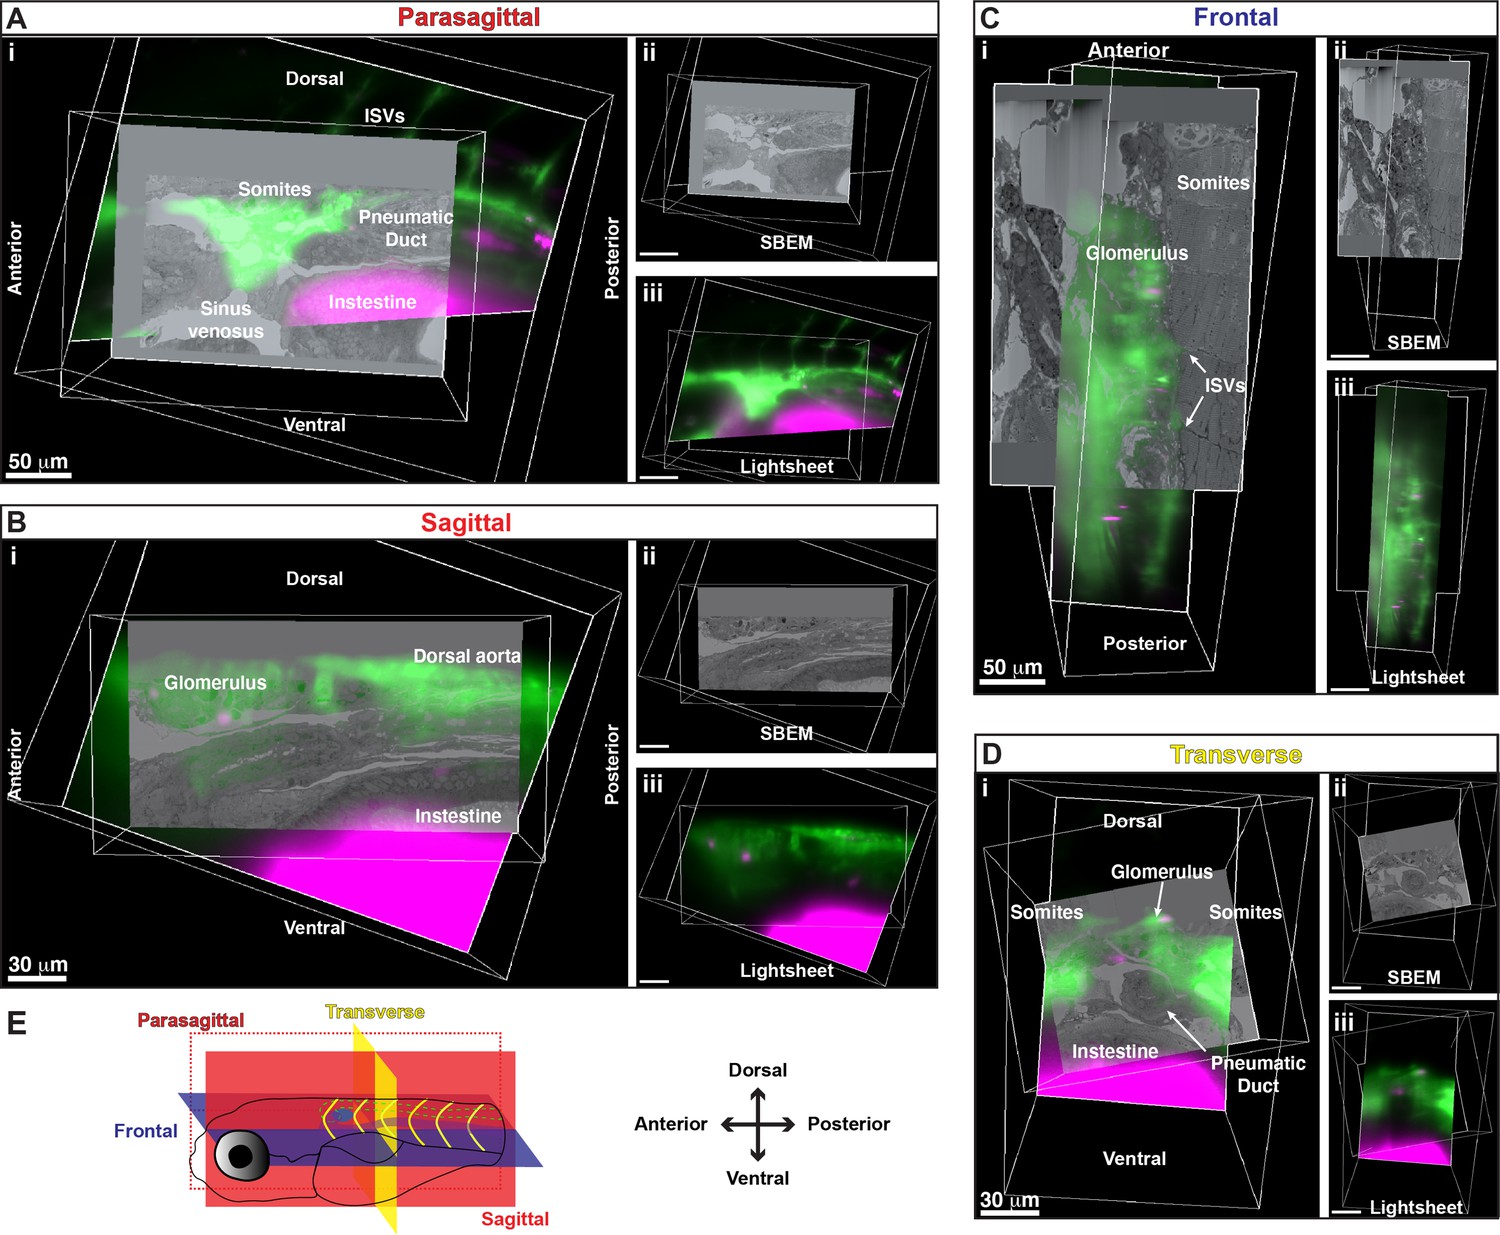
Alignment of 3D rendered models from serial block-face scanning electron microscopy (SBEM) and light sheet live imaging shows anatomical features in all three planes.
(A) Parasagittal view shows somites, pneumatic duct, intestine, sinus venosus, and inter-segmental vessels (ISVs). (B) Sagittal view shows glomerulus, dorsal aorta, and intestines. (C) Frontal view shows the glomerulus, ISVs, and somites. (D) Transverse view shows the glomerulus, somites, pneumatic duct, and intestine. (E) Schematic showing the orientation of the larva and the different planes represented. (Ai, Bi, Ci, Di) Merged 3D models of light sheet and SBEM data. (Aii, Bii, Cii, Dii) 3D SBEM volume alone. (Aiii, Biii, Ciii, Diii) 3D light sheet volume alone.
Figure 4—video 1
All sections (>3000) of a APEX2+ serial block-face scanning electron microscopy (SBEM) dataset.
Figure 5 with 4 supplements
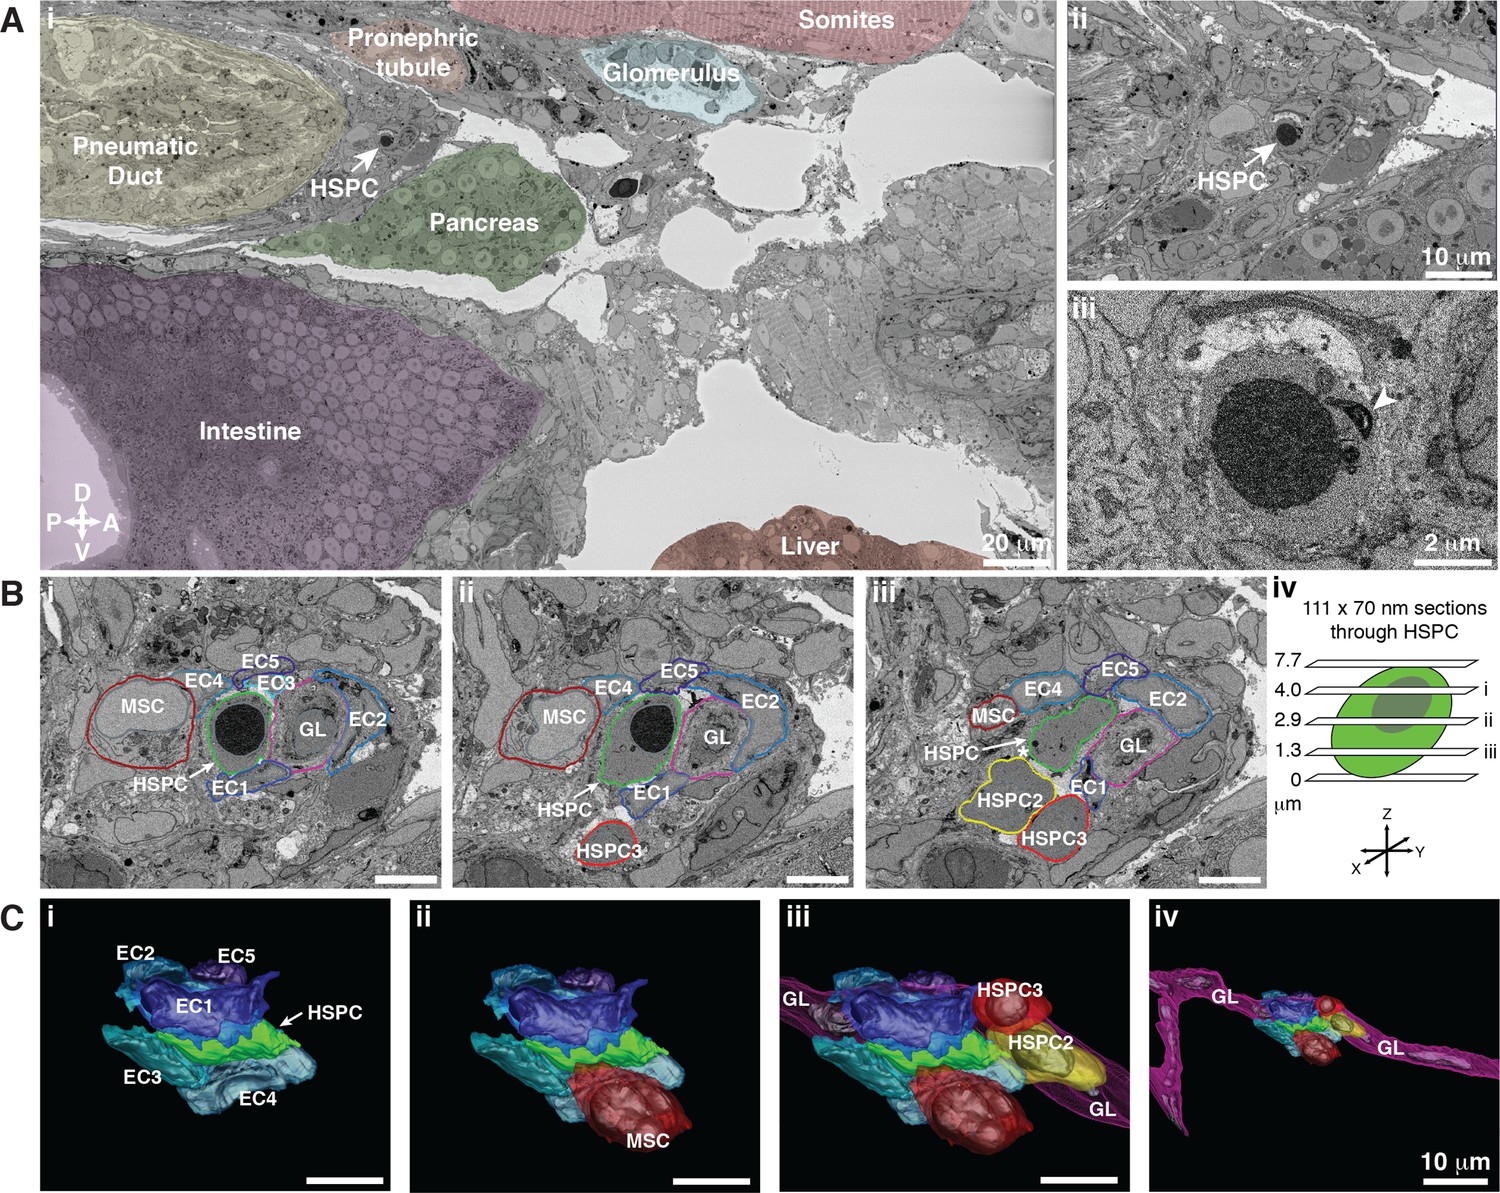
Hematopoietic stem and progenitor cells (HSPCs) lodge in a multicellular niche in the perivascular kidney marrow (KM).
The ultrastructure of a single APEX2+ HSPC (white arrow) and its surrounding niche cells are modeled using 3D SBEM (00:15 from Figure 4—video 1). (A) The APEX2+ HSPC is lodged in the perivascular KM niche. (Ai) Surrounding tissues are labeled; the HSPC is anterior to the pneumatic duct, dorsal to intestine and pancreas, and ventral to the somites and pronephric tubule. (Aii) Higher magnification shows the APEX2+ HSPC is only two-cell diameters from the vessel lumen (white area). (Aiii) Full resolution detail of the APEX2+ HSPC showing high-contrast labeling of the nucleus (APEX2-H2B), mitochondria (mito-APEX2; white arrowhead), and extracellular space dorsal to the cell. (B) (i–iii) SBEM sections at different levels through the APEX2+ HSPC (white arrows) as shown in the schematic (iv). The HSPC is simultaneously in contact with multiple niche cells: five endothelial cells (EC1–5), 1 mesenchymal stromal cell (MSC), and a ganglion-like (GL) cell. Two unlabeled APEX2 negative putative HSPCs were lodged in the same niche (HSPC2 and HSPC3). HSPC2 is attached to HSPC3, and the APEX2+ HSPC (Biii; asterisk). (C) 3D rendered models of the APEX2+ HSPC (solid green) in contact with niche cells. 3D contours are in the same colors as outlines in (B). The APEX2+ HSPC is directly contacted by: (i) five ECs; (ii) one MSC; (iii) one HSPC, and a chain of GL-like cells. (iv) The GL-like cell is part of a long continuous chain of similar cells that extends through the niche. Scale bars: 5 µm unless otherwise labeled. Abbreviations: D, dorsal; V, ventral; A, anterior; P, posterior.
Figure 5—figure supplement 1
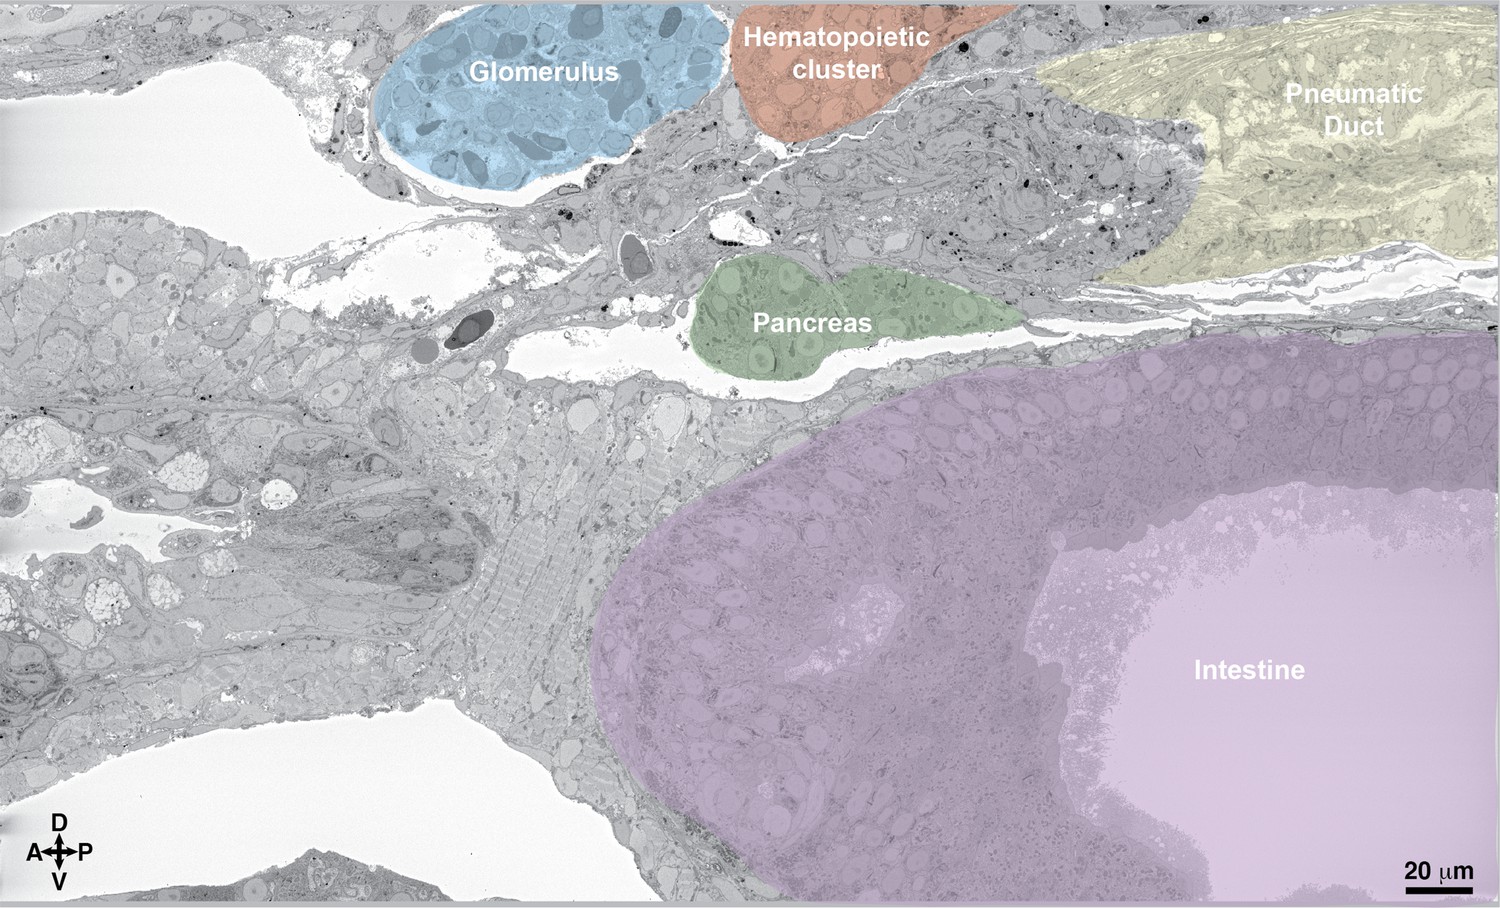
Hematopoietic clusters are visible in the serial block-face scanning electron microscopy (SBEM) dataset.
A different section of the SBEM dataset shown in Figure 5 shows the ultrastructure of the hematopoietic clusters relative to the surrounding tissues (00:17 from Figure 4—video 1). Abbreviations: D, dorsal; V, ventral; A, anterior; P, posterior.
Figure 5—figure supplement 2
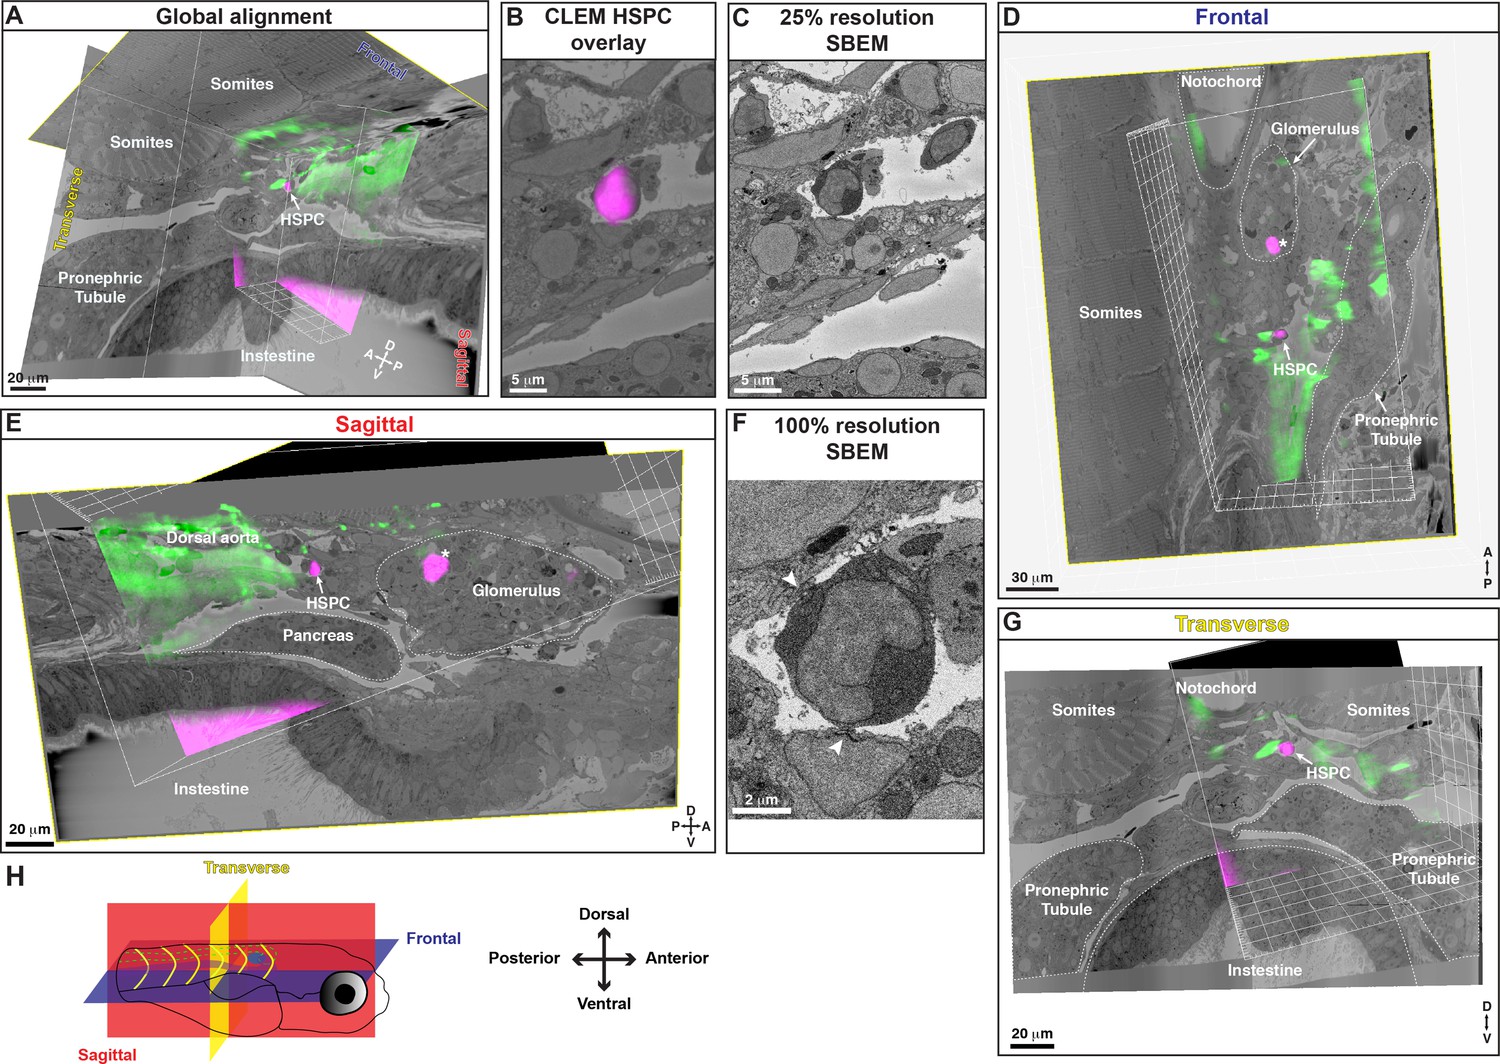
3D alignment of a second serial block-face scanning electron microscopy (SBEM) dataset showing localization of a single hematopoietic stem and progenitor cell (HSPC) across multiple imaging modalities.
Five days post fertilization (dpf) larva. (A) Location of the mCherry+;APEX2+ HSPC (white arrow) in the posterior perivascular niche region, relative to anatomical features such as somites, pronephric tubules, and intestine, aligned in all three orthogonal planes. (B) Correlative light and electron microscopy (CLEM) overlay of mCherry+ HSPC imaged with light sheet, overlapping with a single cell in the SBEM data. The target cell is in the lumen of a small vessel in the perivascular niche. Processing and staining of this sample was not optimal, as the nucleus and mitochondria were not resolved in dark contrast on electron microscopy (EM) sections. (C) A single section of SBEM data from the same region shown in (B) at 25% of full resolution. (D) Frontal view of the alignment shows notochord, glomerulus, pronephric tubule, somites, mCherry+;APEX2+ HSPC (white arrow) and a circulating HSPC within the glomerulus (asterisk). (E) Sagittal view of the alignment shows HSPC (white arrow), circulating HSPC (asterisk), glomerulus, dorsal aorta, and pronephric tubule. (F) A single section of SBEM data showing the target HSPC at full 100% resolution. The cell is lodged in the lumen of a small vessel and has clear docking sites with adjacent endothelial cells (arrowheads). (G) Transverse view shows the HSPC, notochord, pronephric tubules, and intestine. (H) Schematic showing the orientation of the larva and the different planes represented: frontal (blue slice); sagittal (red slice); transverse (yellow slice). Abbreviations: D, dorsal; V, ventral; A, anterior; P, posterior.
Figure 5—figure supplement 3
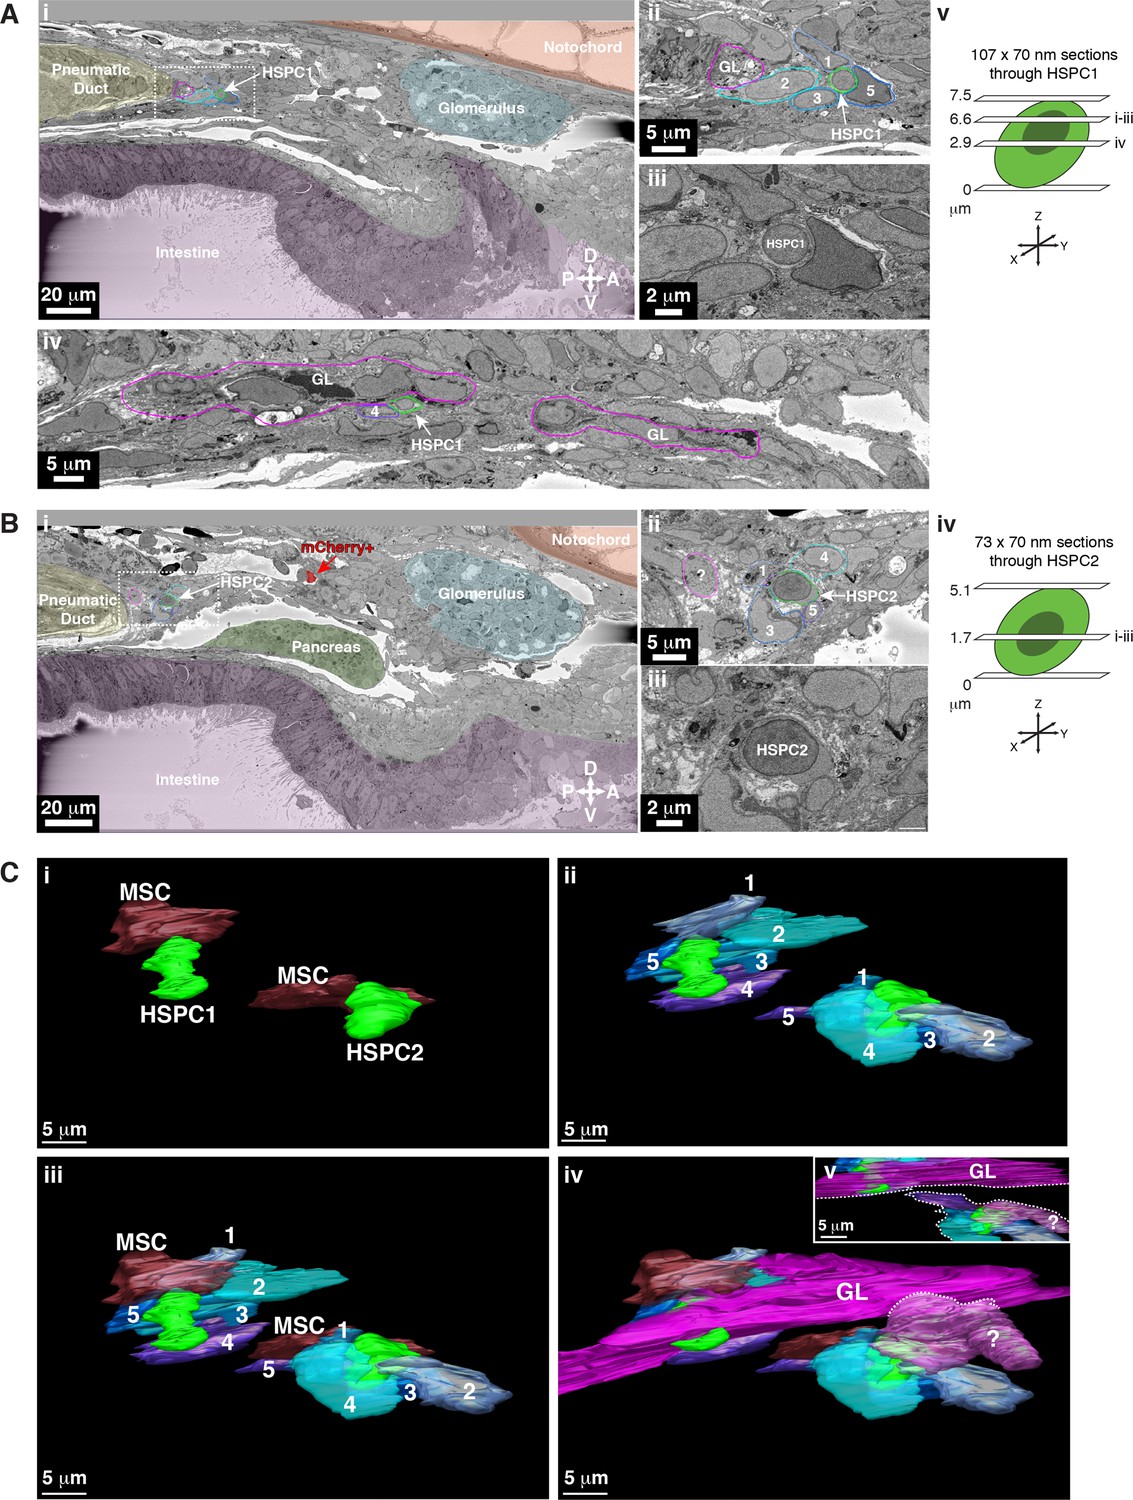
Tracing of unlabeled putative hematopoietic stem and progenitor cells (HSPCs) in a second serial block-face scanning electron microscopy (SBEM) dataset shows their relationship with niche cells.
Five days post fertilization (dpf) larva. The ultrastructure of two putative APEX2- HSPCs (based on morphology), and their surrounding niche cells, are modeled using 3D SBEM. The morphological criteria for a putative HSPC were: (1) cell diameter of ~6–7 µm; (2) large round nucleus; (3) scant cytoplasm; (4) ruffled membrane. (A) The first putative HSPC (HSPC1; white arrow) we identified was lodged in the perivascular kidney marrow (KM) niche. (Ai) Surrounding tissues are pseudo-colored. Putative HSPC1 is anterior to the pneumatic duct, dorsal to the intestine, ventral to the notochord, and posterior to the glomerulus. (Aii) Higher magnification of the dotted box shown in (Ai) shows putative HSPC1 is in contact with multiple endothelial cells (ECs) (1, 2, 3, 5; cell numbers correspond to the traced models in (C)). (Aiii) Full resolution detail of putative HSPC1. (Aiv) The long chain of ganglion-like (GL) cells (traced in magenta) are in direct contact with putative HSPC1. Cell 4 is one of the ECs shown in the model below (C). (Av) The schematic shows the level of SBEM sections through the putative HSPC. From the bottom of the cell, the section at 6.6 µm is shown in (Ai–iii), and the section at 2.9 µm is shown in (Aiv). (B) The second putative HSPC (HSPC2; white arrow) we identified was also lodged in the posterior perivascular KM niche near putative HSPC1. (Bi) Surrounding tissues are pseudo-colored. Putative HSPC2 is anterior to the pneumatic duct, dorsal to the intestine and pancreas, ventral to the notochord, and posterior to the glomerulus. The mCherry+ cell (red with red arrow) was tracked live and aligned using CLEM. We did not see APEX2+ high-contrast signal in this sample, likely because of sub-optimal DAB (3,3'-diaminobenzidine) staining. (Bii) Higher magnification of the dotted box shown in (Bi) shows putative HSPC2 is in contact with multiple ECs (1, 3, 4, 5; cell numbers correspond to the traced models in (C)). Not shown in this section, the unidentified cell type outlined in light magenta (?) contacts HSPC2 (see Civ). (Biii) Full resolution detail of putative HSPC2. (Biv) The schematic shows the level of the SBEM section through the putative HSPC. From the bottom of the cell, the section at 1.7 µm is shown in (Bi–iii). (C) 3D rendered models of putative HSPC1 and HSPC2 (solid green) in direct contact with multiple niche cells. The colors of the 3D contours correspond to the tracing outlines in (A and B). (Ci–iii) Both putative HSPCs are directly contacted by 1×MSC and 5×ECs. (Civ) Putative HSPC1 is in contact with a long chain of GL-like cells, like the example shown in Figure 5, which also extends through the niche. Putative HSPC2 is in contact with an unidentified cell type (?). (Cv) The inset shows that the unidentified cell does not connect with the chain of GL-like cells (dotted lines; Civ–v). Abbreviations: D, dorsal; V, ventral; P, posterior; A, anterior.
Figure 5—video 1
Hematopoietic stem and progenitor cells (HSPCs) lodge in a multicellular niche structure in the perivascular kidney marrow (KM).
Corresponds to Figure 5. Orthogonal views through the serial block-face scanning electron microscopy (SBEM) data in all three planes shows the dense tissue in the larval KM region. APEX2+ staining of the HSPC allows us to distinguish it from other cell types. IMOD software was used to trace the outlines of the HSPC and the surrounding niche cells such as endothelial cells (ECs), mesenchymal stromal cells (MSCs), and ganglion-like cells. The movie frame that corresponds to Figure 5A has the prominent tissues outlined and labeled.
Figure 6 with 2 supplements
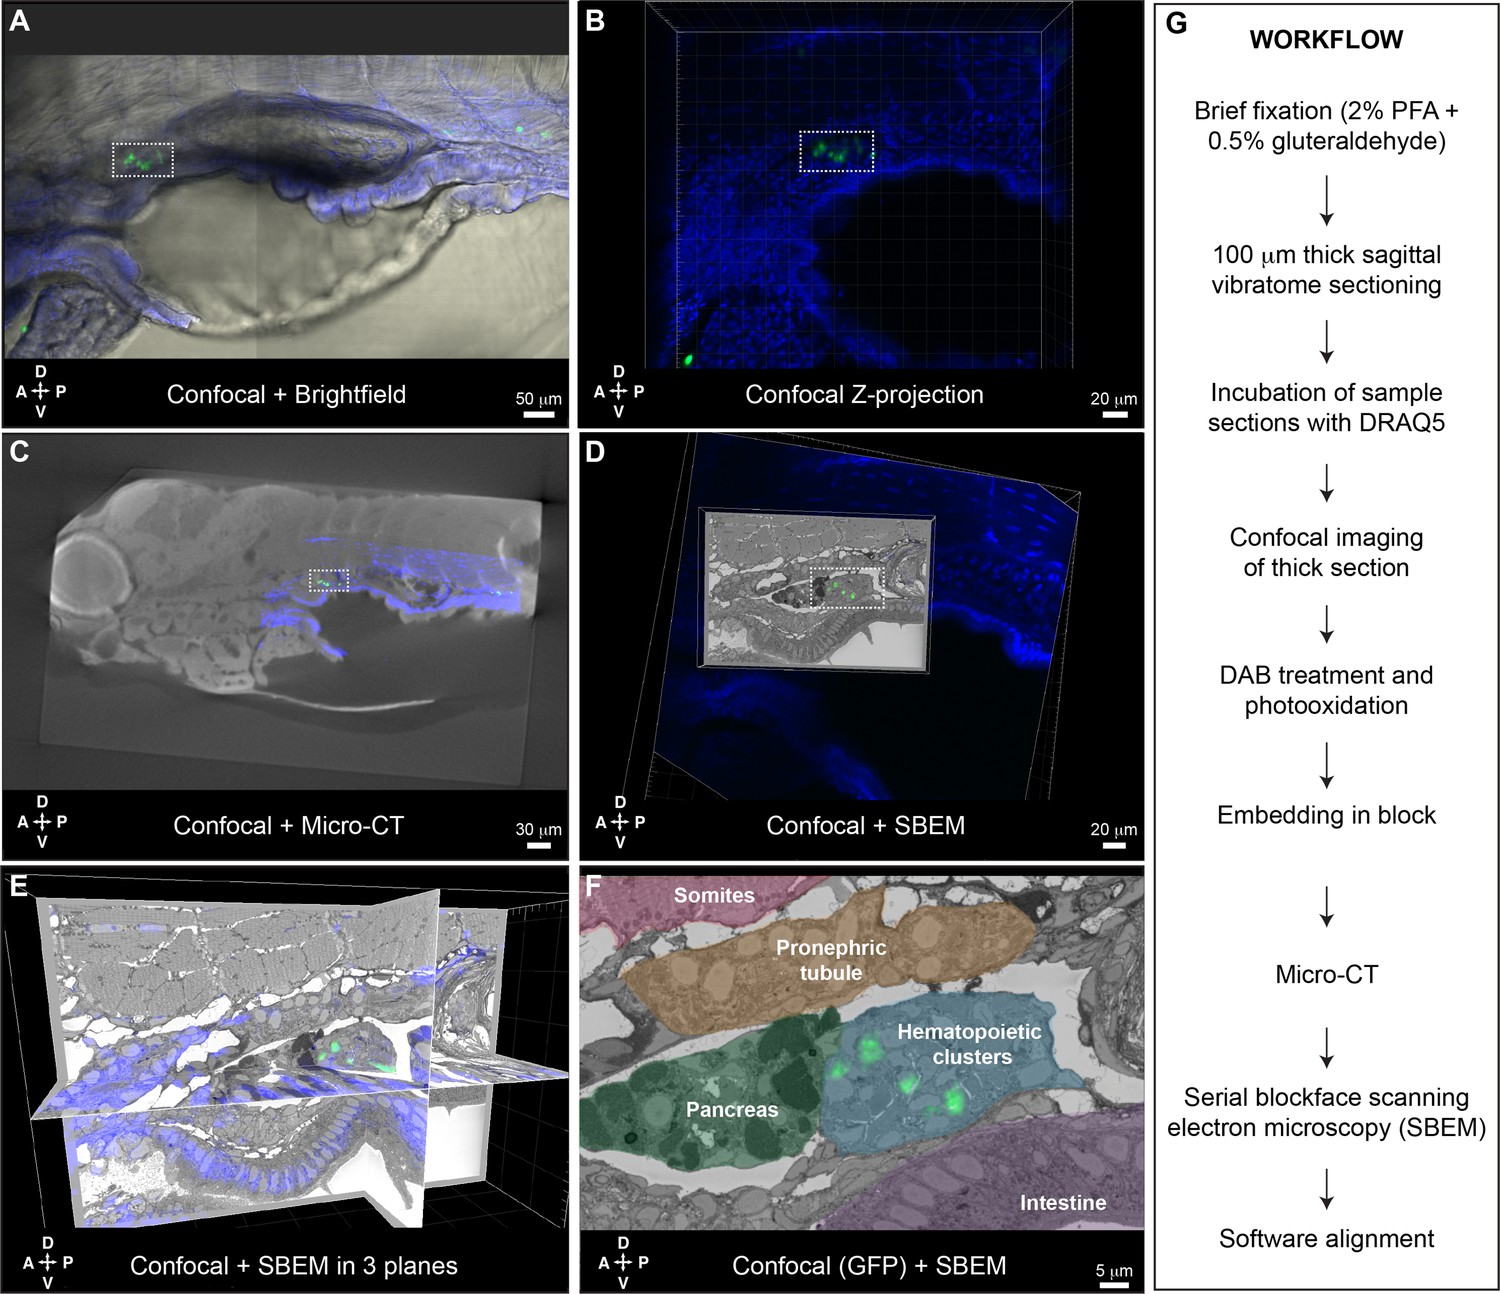
Correlative light and electron microscopy (CLEM) Workflow #2 to align all cd41:GFP+ hematopoietic stem and progenitor cells (HSPCs) in the larval kidney marrow (KM) niche.
Five days post fertilization (dpf) cd41:GFP+ HSPCs (green) and DRAQ5 nuclear dye (blue). (A-D) The same region of the KM niche is marked by a white dotted rectangle. (A) Confocal and brightfield image of thick vibratome section. (B) Confocal Z projection of thick vibratome section. (C) Aligned overlay of micro-computed tomography (microCT) and confocal data. (D) Aligned overlay of serial block-face scanning electron microscopy (SBEM) and confocal data (XY plane only). (E) Aligned overlay of SBEM and confocal data (XY, XZ, YZ planes). (F) Detail of single SBEM section with aligned overlay of cd41:GFP+ HSPCs. Anatomical features are labeled and color-coded. (G) Summary of processing steps used in Workflow #2. Abbreviations: D, dorsal; V, ventral; A, anterior; P, posterior.
Figure 6—figure supplement 1
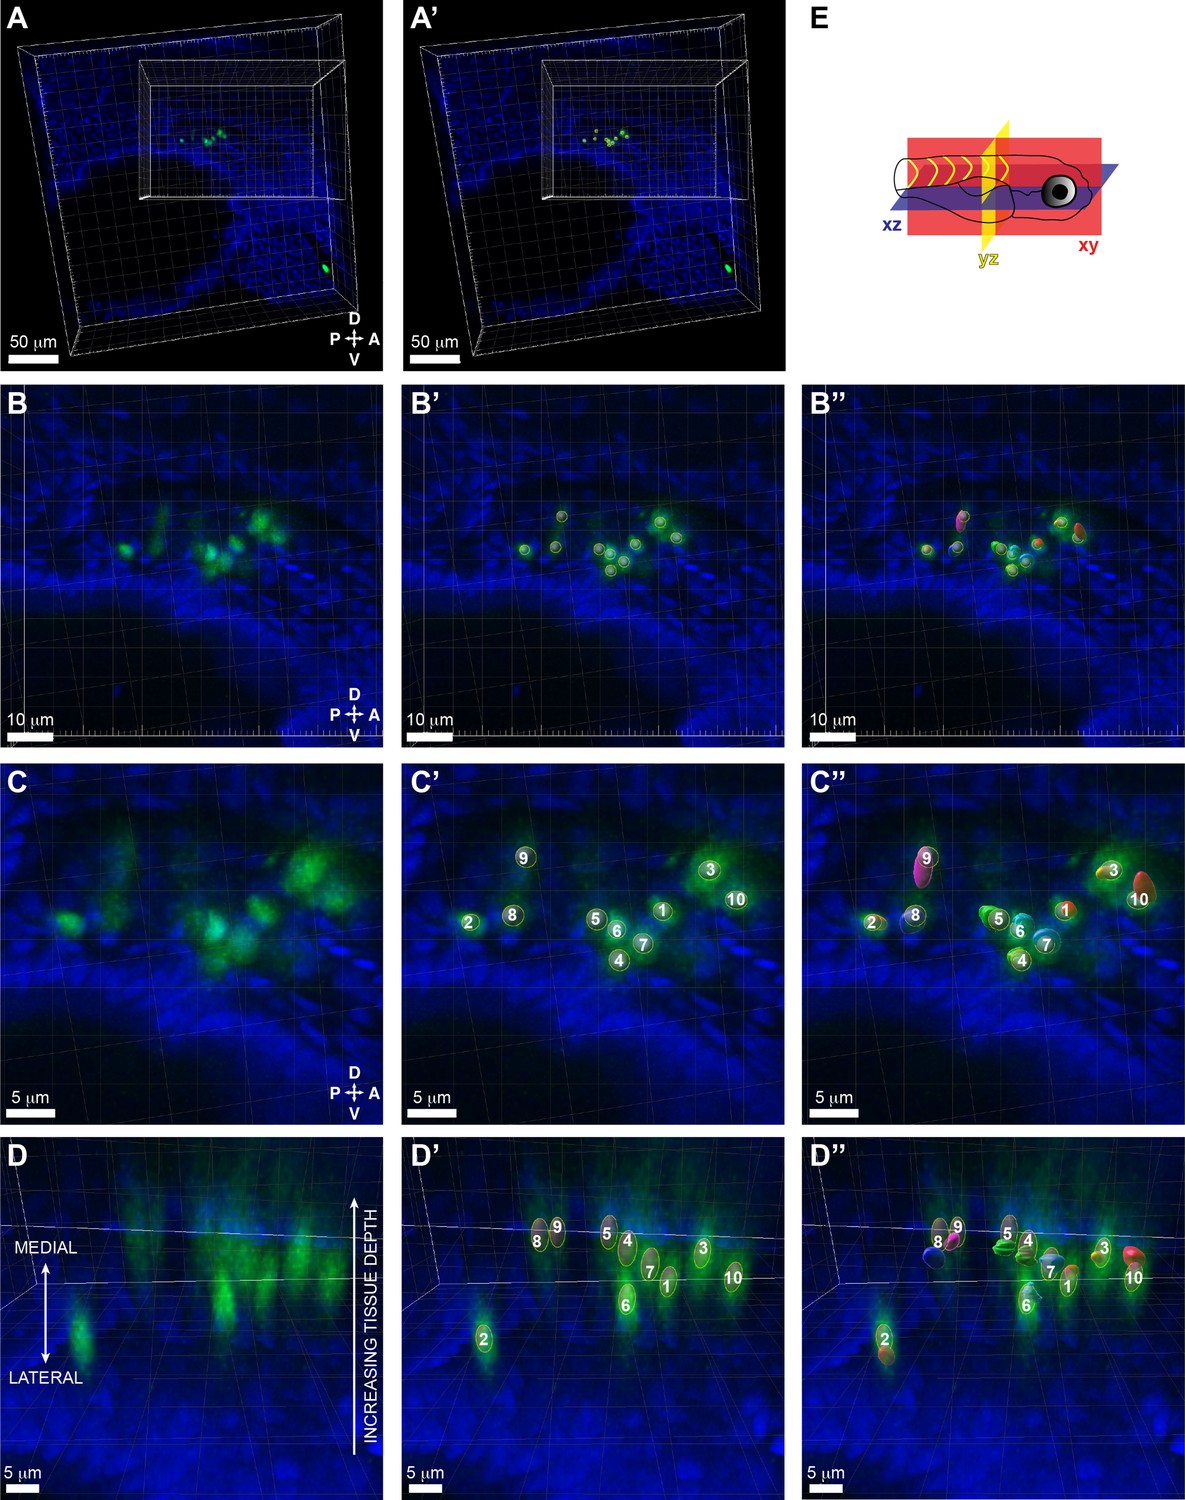
Positional overlap of cd41:GFP+ hematopoietic stem and progenitor cells (HSPCs) in confocal data and segmentation of putative HSPCs in serial block-face scanning electron microscopy (SBEM) data.
(A) Z projection of cd41:GFP+ HSPCs (green) and DRAQ5+ nuclei (blue) surrounded by larger grid box (xy orientation). Smaller grid box shows aligned position of SBEM dataset (see Figure 6D). (A’) Same as A but with overlay of ‘Spots’ (gray circles) defined by Imaris software using ‘Spot Detection’ (‘Filter Spots’ with ‘Quality’ above 158; Estimated XY diameter 3.00 μm; Model PSF-elongation along Z axis ‘ON’; estimated Z diameter 6.00 μm; background subtraction ‘ON’). (B) Fivefold higher magnification of (A), with (B’) overlay of ‘Spots’, (B’’) segmentation of putative HSPCs traced on SBEM (see Figure 6—figure supplement 2). (C) Ten-fold higher magnification of (A), with (C’) overlay of ‘Spots’ (n=10 cd41:GFP+ HSPCs predicted by ‘Spot Detection’), (C’’) segmentation of putative HSPCs (n=10) traced on SBEM (see Figure 6—figure supplement 2). (D) Side view (xz orientation) of (C) with the lateral region of the embryo at the bottom and the medial region at the top. The thick section was imaged from the lateral region, so the tissue depth increases toward the medial region, and there is more out of focus light and lower signal. (D’) Same as (D) but with overlay of ‘Spots’ (gray ovals that show PSF-elongation along Z axis). (D’’) Same as (D’) but with overlay of segmentation of putative HSPCs (n=10) traced on SBEM (see Figure 6—figure supplement 2). Shows that n=10 cd41:GFP+ ‘Spots’ overlap with segmentation of putative HSPCs. (E) Schematic showing the orientation of the larva and the different planes represented. Abbreviations: D, dorsal; V, ventral; A, anterior; P, posterior.
Figure 6—figure supplement 2
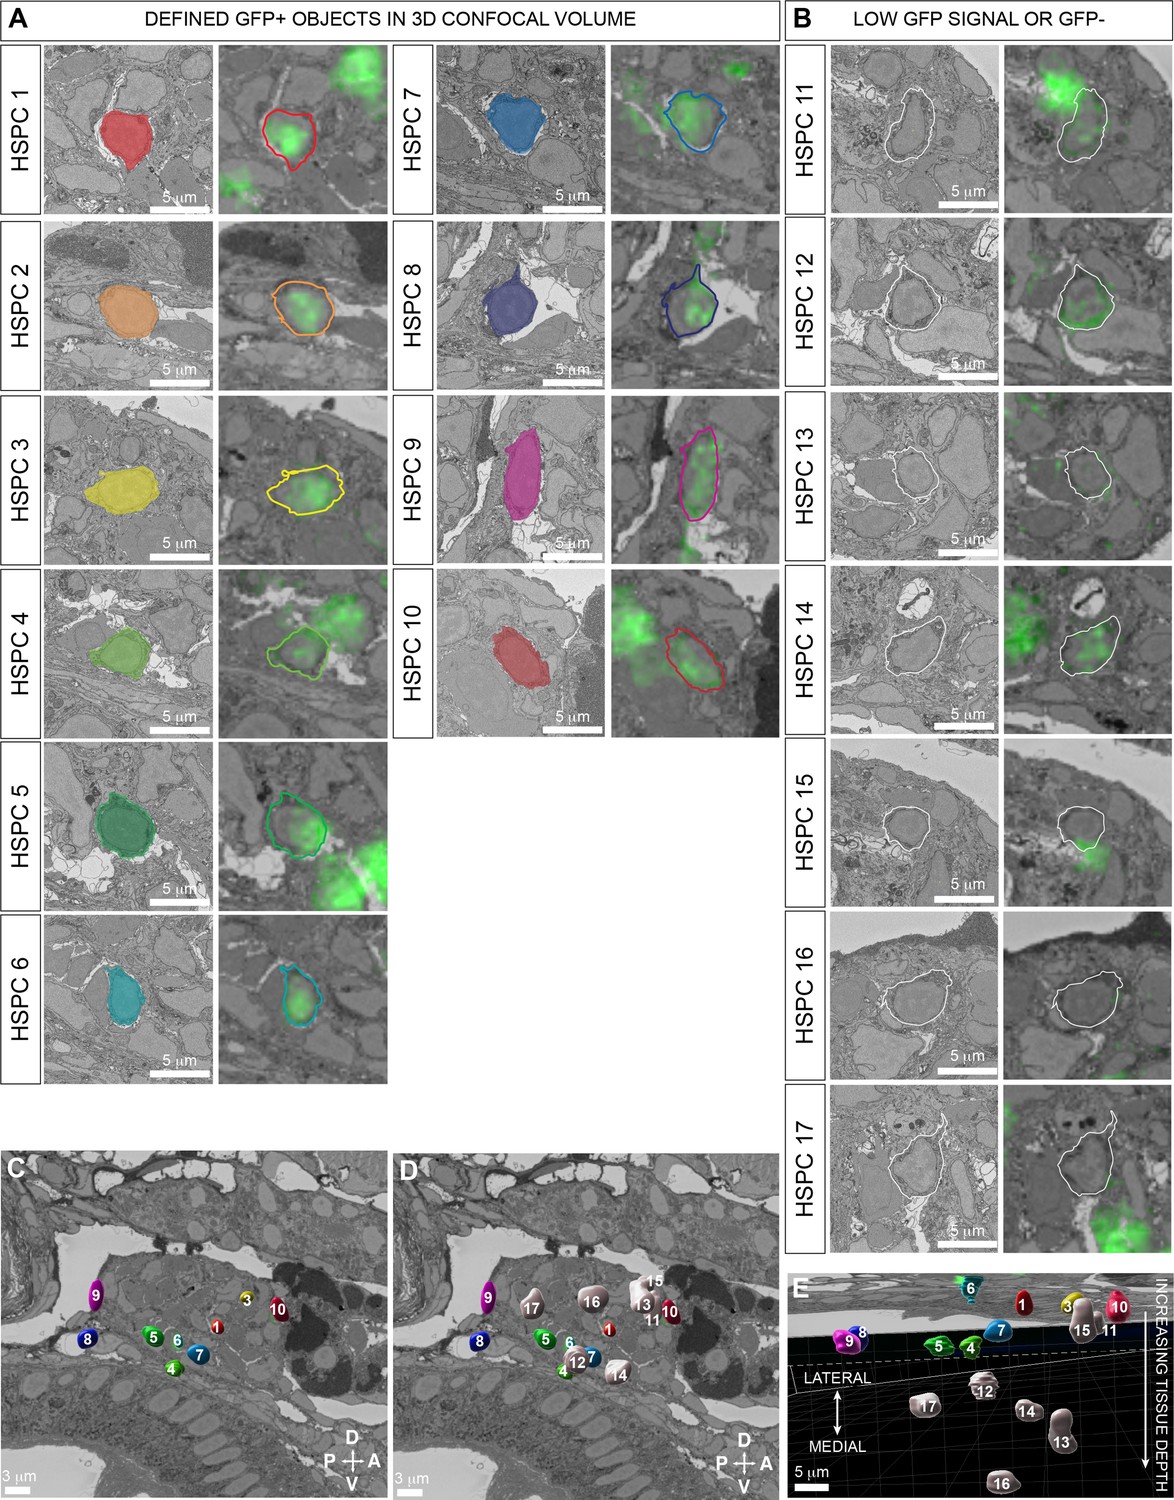
Segmentation of cd41:GFP+ and cd41:GFP- putative hematopoietic stem and progenitor cells (HSPCs) in serial block-face scanning electron microscopy (SBEM) data.
(A) Defined GFP+ objects in 3D confocal volume (HSPC #1–10; see Figure 6—figure supplement 2). Left panel is a detail of one section from the SBEM dataset. Right panel shows overlay of aligned confocal (GFP) and SBEM datasets (see Figure 6D). (B) Undefined GFP low or GFP- signal in putative HSPCs identified morphologically in SBEM dataset (HSPC #11–17). Left panel is a detail of one section from the SBEM dataset. Right panel shows overlay of aligned confocal (GFP) and SBEM datasets (see Figure 6D). (C) Overlay of segmentation models of defined GFP+ putative HSPCs on SBEM section to show position within the hematopoietic cluster (HSPC #1–10). (D) Overlay of segmentation models of defined GFP+ and undefined GFP low or GFP- putative HSPCs on SBEM section to show position within the hematopoietic cluster (HSPC #1–17). (E) Side view of (D) with the lateral region of the embryo at the top and the medial region at the bottom. Most segmentation models of undefined GFP low or GFP- putative HSPCs are deeper in the tissue sample. Abbreviations: D, dorsal; V, ventral; A, anterior; P, posterior.
Figure 7 with 3 supplements
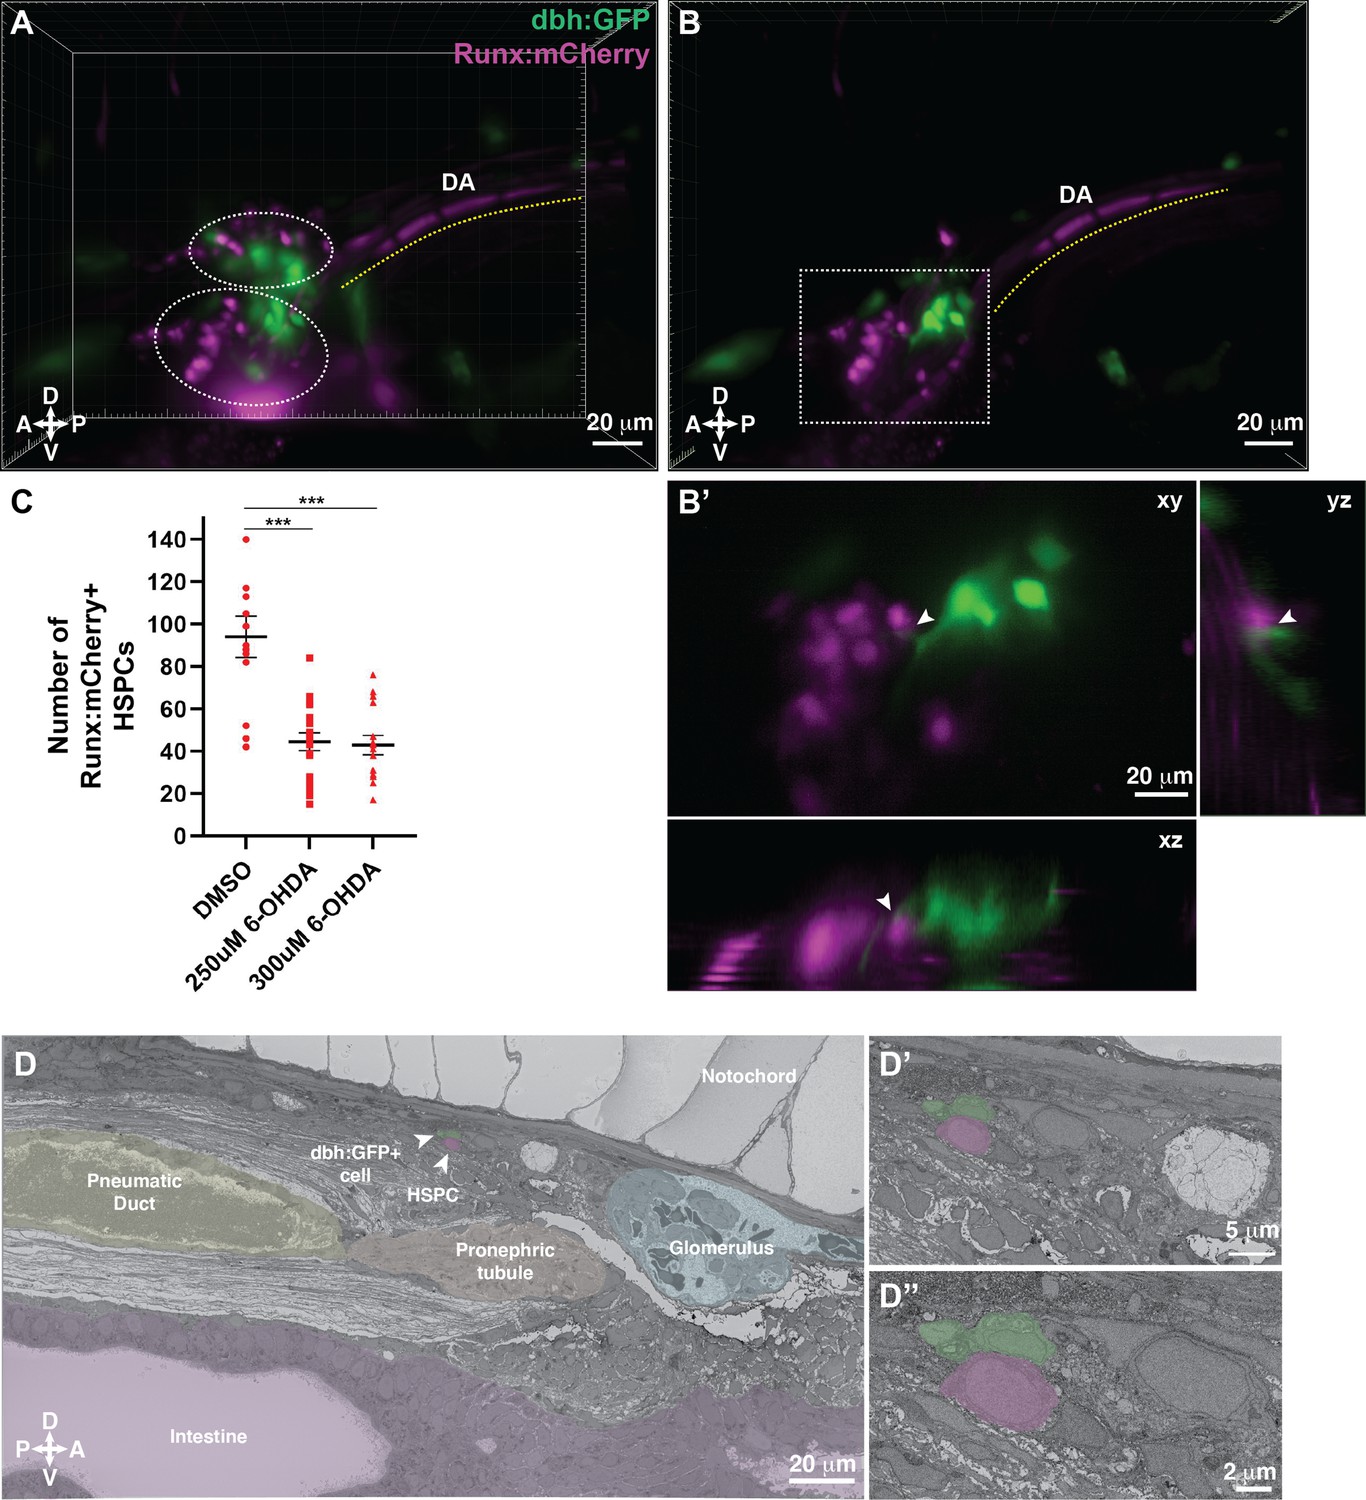
Dopamine beta-hydroxylase positive ganglion-like cells are present within the larval kidney marrow niche.
(A) 3D rendering generated using light sheet movies of Runx:mCherry;dbh:GFP double transgenic larva shows mCherry+ clusters (dotted ovals) in close proximity to GFP+ cells. DA, dorsal aorta. (B) Oblique slice through the 3D volume shows GFP+ extensions from the dbh:GFP+ cells into the mCherry+ hematopoietic stem and progenitor cell (HSPC) clusters. (B’) Detail of the boxed region in B shows contact formation between the GFP+ extensions and mCherry+ HSPCs (white arrowheads) in all three planes. (C) Quantification showing significantly reduced number of Runx:mCherry+ HSPCs in 6-hydroxydopamine (6-OHDA)-treated transgenic larvae compared to DMSO controls. Unpaired t test with Welch’s correction. DMSO vs. 250 μM 6-OHDA, p=0.0003; DMSO vs. 300 μM 6-OHDA, p=0.0002. Sample size (n), DMSO, n=13; 250 μM 6-OHDA, n=18; 300 μM 6-OHDA, n=15. Number of biological replicates = 3. (D) The ultrastructure of a dbh:GFP+ cell (labeled green) in proximity of a cell with HSPC-like morphology (labeled magenta) (white arrowheads). Surrounding tissues are labeled, and the dbh:GFP+ cell HSPC pair is posterior to the glomerulus, dorsal to pneumatic duct, pronephric tubule and intestine, and ventral to the notochord. (D’) Higher magnification shows the dbh:GFP+ cell-HSPC pair is only three-cell diameters from the vessel lumen (white area). (D’’) Full resolution detail of the dbh:GFP+ cell-HSPC pair showing contact formation. Abbreviations: D, dorsal; V, ventral; A, anterior; P, posterior.
Figure 7—figure supplement 1
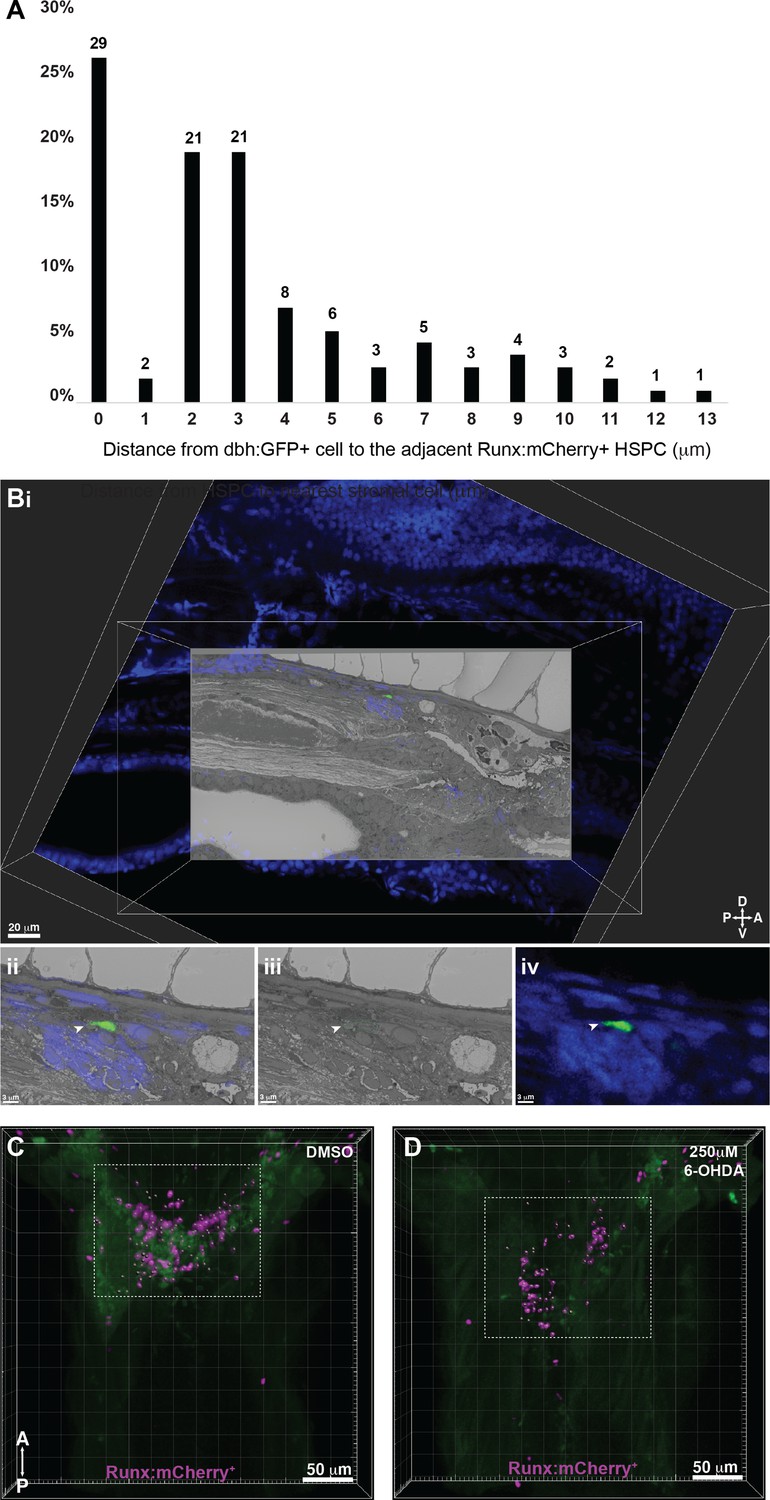
Correlative light and electron microscopy (CLEM) confirms that dbh:GFP+ cells are present within the kidney marrow (KM) and neurotoxin targeting dopaminergic cells reduces hematopoietic stem and progenitor cell (HSPC) colonization of the KM niche.
(A) Quantification of distances measured between dbh:GFP+ cells and Runx:mCherry+ HSPCs shows that almost 30% of HSPCs are in contact with dbh:GFP+ cells and the remaining are within 13 µm. Numbers above the columns indicate the cell numbers counted in each group (combined data from n=10 larvae). (B) 3D CLEM alignment of confocal dataset with DRAQ5-labeled nuclei (blue in (i), (ii), and (iv)) and SBEM datasets identifies a dbh:GFP+ cell in the KM niche. (i) Alignment between confocal and SBEM datasets in the XY plane. (ii) White arrowhead points to the single dbh:GFP+ cell in the aligned confocal and SBEM datasets, and in (iii) the green outlined dbh:GFP+ cell in SBEM data alone. (iv) dbh:GFP+ cell in confocal data alone. (C,D) Representative images that correspond to graphs in Figure 7C. 3D rendered confocal stacks show reduced number of Imaris software-defined ‘Spots’ within the anterior KM niche (in the white dotted box), corresponding to reduced Runx:mCherry+ HSPCs upon 250 µM 6-OHDA treatment (D), as compared to DMSO-treated controls (C). Green is autofluorescence.
Figure 7—video 1
Alignment of confocal and micro-computed tomography (microCT) stacks for the dbh:gfp+ larvae.
Corresponds to Figure 7. Aligned sections through the correlated stack in XY plane. MicroCT (grayscale), confocal dbh:gfp+ (green), confocal DRAQ5 nuclei (blue). Magnification ×20. Scale bar: 50 µm. D, dorsal; V, ventral; A, anterior; P, posterior.
Figure 7—video 2
Correlative light and electron microscopy (CLEM) of confocal and serial block-face scanning electron microscopy (SBEM) datasets confirms dbh:gfp+ cells form part of the larval kidney marrow (KM) niche.
Corresponds to Figure 7. Aligned sections through the correlated stack of confocal and SBEM data in the XY plane shows that dbh:GFP+ cells are located within the KM niche. Rendered at 10 frames per second (fps). 1/10 full resolution of SBEM. Scale bar: 10 µm. D, dorsal; V, ventral; A, anterior; P, posterior.
Tables
Table 1
Summary of all putative hematopoietic stem and progenitor cells (HSPCs) in serial block-face scanning electron microscopy (SBEM) datasets, their locations, and niche cell contacts.
‘Cell Image Library (CIL)’ refers to the public database accession numbers. ‘SBEM dataset’ refers to one of the four datasets used in the study: APEX2 #1, APEX2 #2, cd41:GFP, and dbh:GFP. ‘Figure’ refers to the figure where the putative HSPC is shown in the manuscript. ‘Putative HSPC’ refers to the number of the HSPC as it is annotated within its respective figure. ‘Label’ refers to the endogenous genetic label for HSPCs in each sample. Label is not applicable (N/A) in the dbh:GFP sample because GFP marks the niche cells and not the HSPCs. ‘Color code’ refers to the outline, 3D model, or color overlay used to distinguish between different putative HSPCs in the SBEM dataset. ‘Location’ describes where the putative HSPC is located within the niche: perivascular lodgement, in a vessel lumen, or in the hematopoietic clusters adjacent to the glomerulus. Cell contact columns indicate how many individual niche cells (based on morphology, except in the case of dbh:GFP) are in direct contact with a single putative HSPC.
| Cell Image Library (CIL) | SBEMdataset | Figure | PutativeHSPC | Label | Color code | Location | EC contact | MSC contact | RBC contact | HSPC contact | GL contact |
|---|---|---|---|---|---|---|---|---|---|---|---|
| CIL:54847 | APEX2 #1 | 5 | 1 | APEX2+ | Green | Perivascular | 5 | 1 | 0 | 2 | 1 |
| CIL:54846 | APEX2 #2 | 5-S2 | 1 | APEX2+ | None | Lumen | 2 | 0 | 0 | 0 | 0 |
| CIL:54846 | APEX2 #2 | 5-S3 | 1 | APEX2- | Green | Perivascular | 5 | 1 | 0 | 0 | 1 |
| CIL:54846 | APEX2 #2 | 5-S3 | 2 | APEX2- | Green | Perivascular | 5 | 1 | 0 | 0 | 0 |
| CIL:54849 | cd41:GFP | 6 | 1 | GFP+ | Red | Cluster | 5 | 0 | 0 | 0 | 0 |
| CIL:54849 | cd41:GFP | 6 | 2 | GFP+ | Orange | Lumen | 3 | 0 | 3 | 0 | 0 |
| CIL:54849 | cd41:GFP | 6 | 3 | GFP+ | Yellow | Cluster | 5 | 1 | 2 | 2 | 0 |
| CIL:54849 | cd41:GFP | 6 | 4 | GFP+ | Lime | Cluster | 3 | 0 | 1 | 0 | 0 |
| CIL:54849 | cd41:GFP | 6 | 5 | GFP+ | Bright green | Cluster | 5 | 1 | 0 | 0 | 0 |
| CIL:54849 | cd41:GFP | 6 | 6 | GFP+ | Teal | Cluster | 3 | 0 | 3 | 0 | 0 |
| CIL:54849 | cd41:GFP | 6 | 7 | GFP+ | Light blue | Cluster | 5 | 0 | 1 | 0 | 0 |
| CIL:54849 | cd41:GFP | 6 | 8 | GFP+ | Dark blue | Lumen | 3 | 0 | 1 | 0 | 0 |
| CIL:54849 | cd41:GFP | 6 | 9 | GFP+ | Magenta | Lumen | 3 | 0 | 2 | 0 | 0 |
| CIL:54849 | cd41:GFP | 6 | 10 | GFP+ | Dark red | Cluster | 5 | 1 | 1 | 1 | 0 |
| CIL:54849 | cd41:GFP | 6 | 11 | GFP low | White | Cluster | 2 | 1 | 1 | 3 | 0 |
| CIL:54849 | cd41:GFP | 6 | 12 | GFP low | White | Cluster | 3 | 1 | 1 | 0 | 0 |
| CIL:54849 | cd41:GFP | 6 | 13 | GFP low | White | Cluster | 6 | 0 | 1 | 0 | 0 |
| CIL:54849 | cd41:GFP | 6 | 14 | GFP low | White | Cluster | 4 | 1 | 1 | 0 | 0 |
| CIL:54849 | cd41:GFP | 6 | 15 | GFP- | White | Cluster | 5 | 0 | 1 | 1 | 0 |
| CIL:54849 | cd41:GFP | 6 | 16 | GFP- | White | Cluster | 5 | 0 | 2 | 0 | 0 |
| CIL:54849 | cd41:GFP | 6 | 17 | GFP low | White | Cluster | 5 | 1 | 2 | 0 | 0 |
| CIL:54848 | dbh:GFP | 7 | 1 | None | Magenta | Perivascular | 5 | 1 | 0 | 1 | 1 |
-
EC, endothelial cell; MSC, mesenchymal stromal cell; RBC, red blood cell; HSPC, hematopoietic stem and progenitor cell; GL, ganglion-like cell.
Additional files
Download links
A two-part list of links to download the article, or parts of the article, in various formats.
Downloads (link to download the article as PDF)
Open citations (links to open the citations from this article in various online reference manager services)
Cite this article (links to download the citations from this article in formats compatible with various reference manager tools)
Defining the ultrastructure of the hematopoietic stem cell niche by correlative light and electron microscopy
eLife 11:e64835.
https://doi.org/10.7554/eLife.64835


