A subcellular map of the human kinome
- The MOE Key Laboratory of Biosystems Homeostasis & Protection, Zhejiang Provincial Key Laboratory for Cancer Molecular Cell Biology, and Innovation Center for Cell Signaling Network, Life Sciences Institute, Zhejiang University, China
- Cancer Center, Zhejiang University, China
- College of Biology and Pharmacy, Yulin Normal University, China
- State Key Laboratory of Membrane Biology, Beijing Key Laboratory of Cardiometabolic Molecular Medicine, Institute of Molecular Medicine, Peking University, China
- Department of Hepatobiliary and Pancreatic Surgery, Zhejiang Provincial Key Laboratory of Pancreatic Disease, The First Affiliated Hospital, School of Medicine, Zhejiang University, China
- Department of Ophthalmology, The Children’s Hospital, School of Medicine, and National Clinical Research Center for Child Health, Zhejiang University, China
- Institute of Biochemistry II, Goethe University Frankfurt-Medical Faculty, University Hospital, Germany
- Institute of Aging Research, Hangzhou Normal University, China
Figures
Figure 1 with 1 supplement
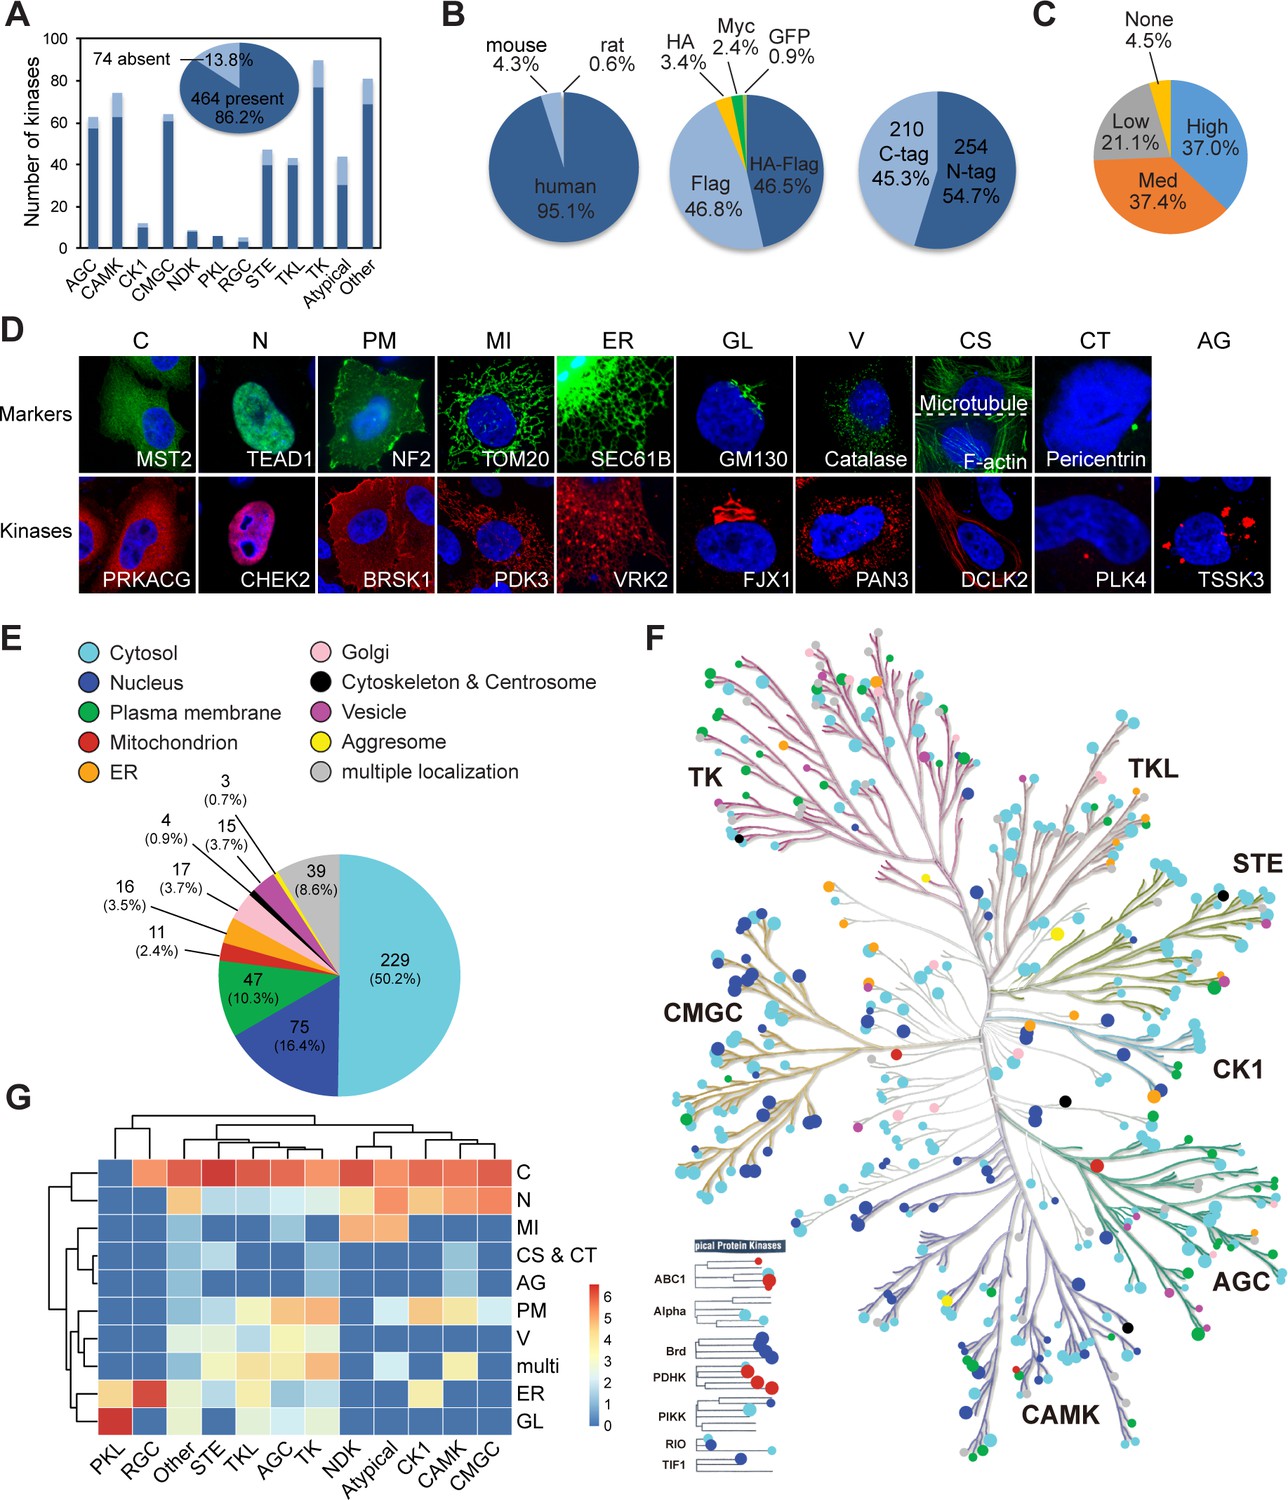
Mapping subcellular localizations of the kinome.
(A) Coverage of the kinome (pie graph) and kinase families (bar graph) by the plasmid library. (B) Composition of the kinome library. Species origins (left), epitope tags (middle), and tag positions (right) were summarized. (C) Expression levels of kinase plasmids. HeLa cells were transfected and expression levels were determined by western blotting. (D) Ten cellular compartments with organelle markers (top) and representative kinases (bottom). SEC61B was visualized by GFP tag. TOM20, GM130, Catalase, microtubule, and pericentrin were stained by specific antibodies. F-actin was marked by phalloidin. Other proteins were transfected and stained for epitope tags. (E) Subcellular distribution of the kinome. (F) Kinome tree with localization information. Each dot represents a kinase. Color denotes compartment and size reflects localization score. (G) Family-enriched distributions for kinases. Kinase families were clustered by the ratio of localization to different compartments (Figure 1—figure supplement 1).
-
Figure 1—source data 1
Raw data for Figure 1 and Figure 1—figure supplement 1.
- https://cdn.elifesciences.org/articles/64943/elife-64943-fig1-data1-v2.xlsx
Figure 1—figure supplement 1
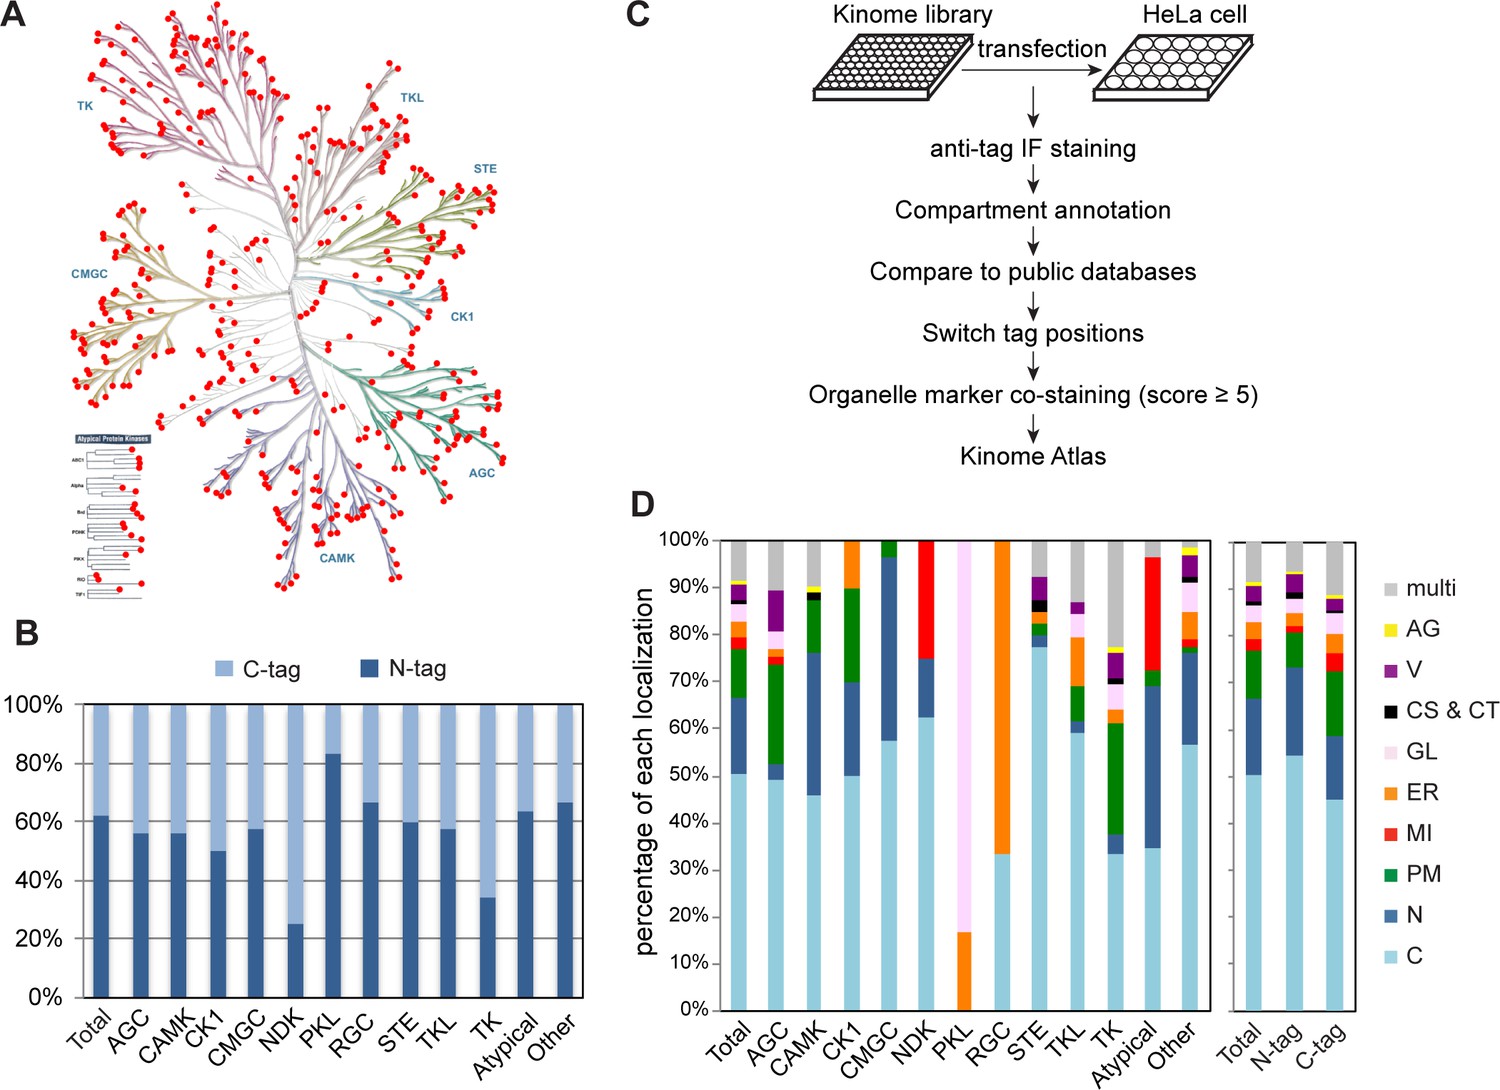
Mapping subcellular localizations of the kinome.
(A) Distribution of the kinome plasmid library on the kinome tree. Each red dot represents a kinase in the library. (B) Ratio of N-terminal- and C-terminal-tagged kinases in each kinase family. (C) Flowchart of kinome subcellular localization mapping. (D) Distribution of 10 subcellular compartments in each kinase family (left panel) and in kinases with different tag positions (right panel).
Figure 2 with 1 supplement
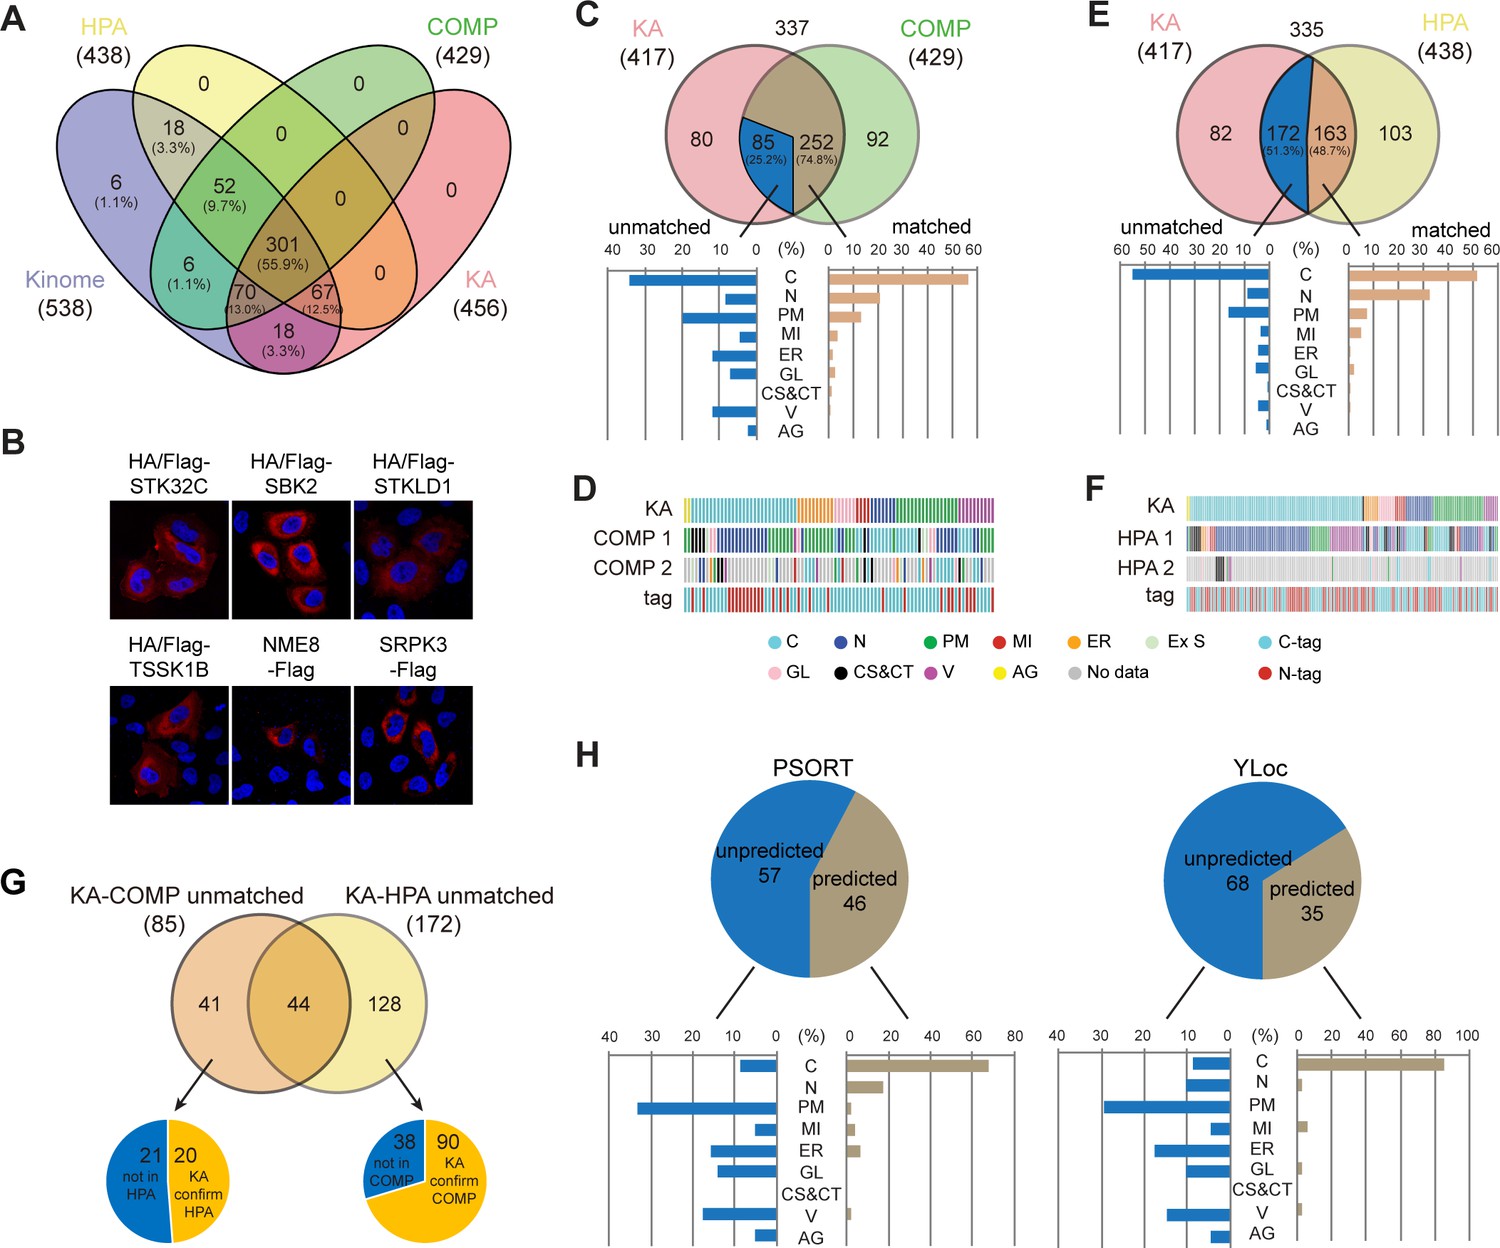
Kinome Atlas (KA) complements current databases for kinome localization.
(A) Coverage of the kinome by COPARTMENTS, Human Protein Atlas (HPA), and KA in Venn diagram. (B) Subcellular localization of six kinases first annotated by KA. (C, D) Comparison of annotations in revised KA and high-confidence localizations in COMPARTMENTS. Distributions of matched and unmatched localizations are shown by bar graph. The heatmap demonstrates kinases (column) with color-coded localizations or position of epitope tag (row). Top two localizations in COMPARTMENTS are shown. (E, F) Comparison of annotations in HPA and KA. Analyses were similar to (C, D). (G) KA provides unique kinase localizations different from databases. Kinases showing different annotations in KA-COMPARTMENTS or KA-HPA comparisons were further consolidated. (H) Prediction of KA-unique kinase localizations. Localizations of unique kinases in (G) were predicted by WoLF PSORT (left panel) or YLoc (right panel). Distribution of predicted or unpredicted kinases is shown by bar graph (Figure 2—figure supplement 1).
-
Figure 2—source data 1
Raw data for Figure 2 and Figure 2—figure supplement 1.
- https://cdn.elifesciences.org/articles/64943/elife-64943-fig2-data1-v2.xlsx
Figure 2—figure supplement 1
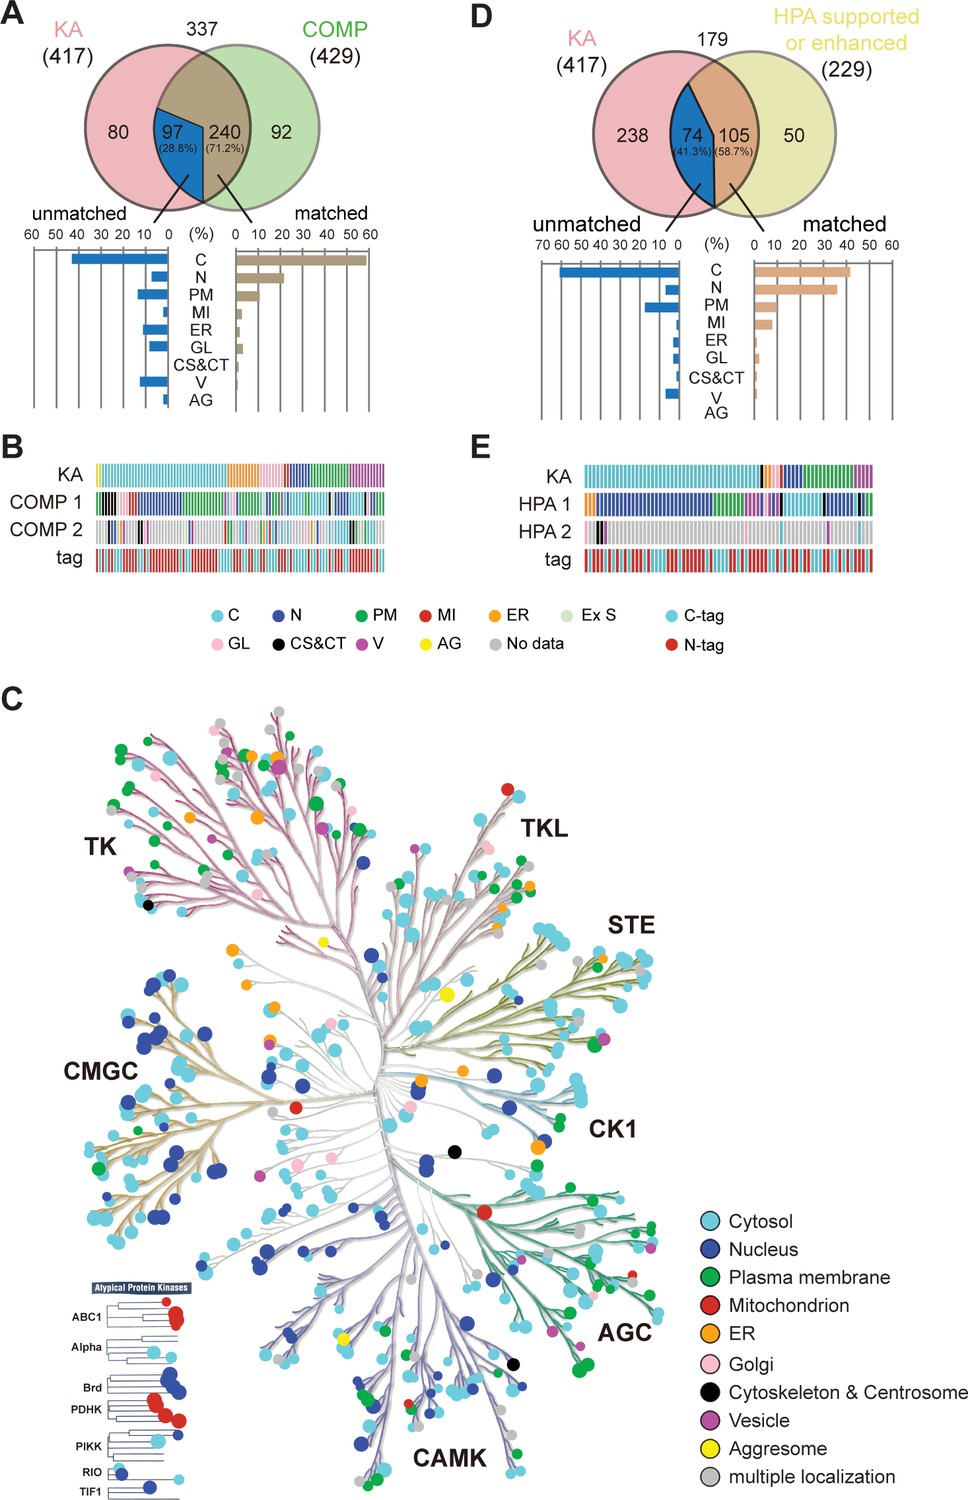
Kinome Atlas (KA) complements current databases for kinome localization.
(A) Comparison of specific localizations in KA with high-confidence localizations in COMPARTMENTS. Distributions of matched and unmatched localizations are shown by bar graph. (B) The heatmap demonstrates kinases (column) with color-coded localizations or position of epitope tag (row). Top two localizations in COMPARTMENTS are shown. (C) Revised kinome tree with localization information. Each dot represents a kinase. Color denotes compartment and size reflects localization score. (D, E) Comparison of KA with ‘enhanced’ or ‘supported’ localizations in Human Protein Atlas (HPA). Analyses were similar to (A, B).
Figure 3 with 1 supplement

Kinome Atlas (KA) identified unknown localizations for kinases.
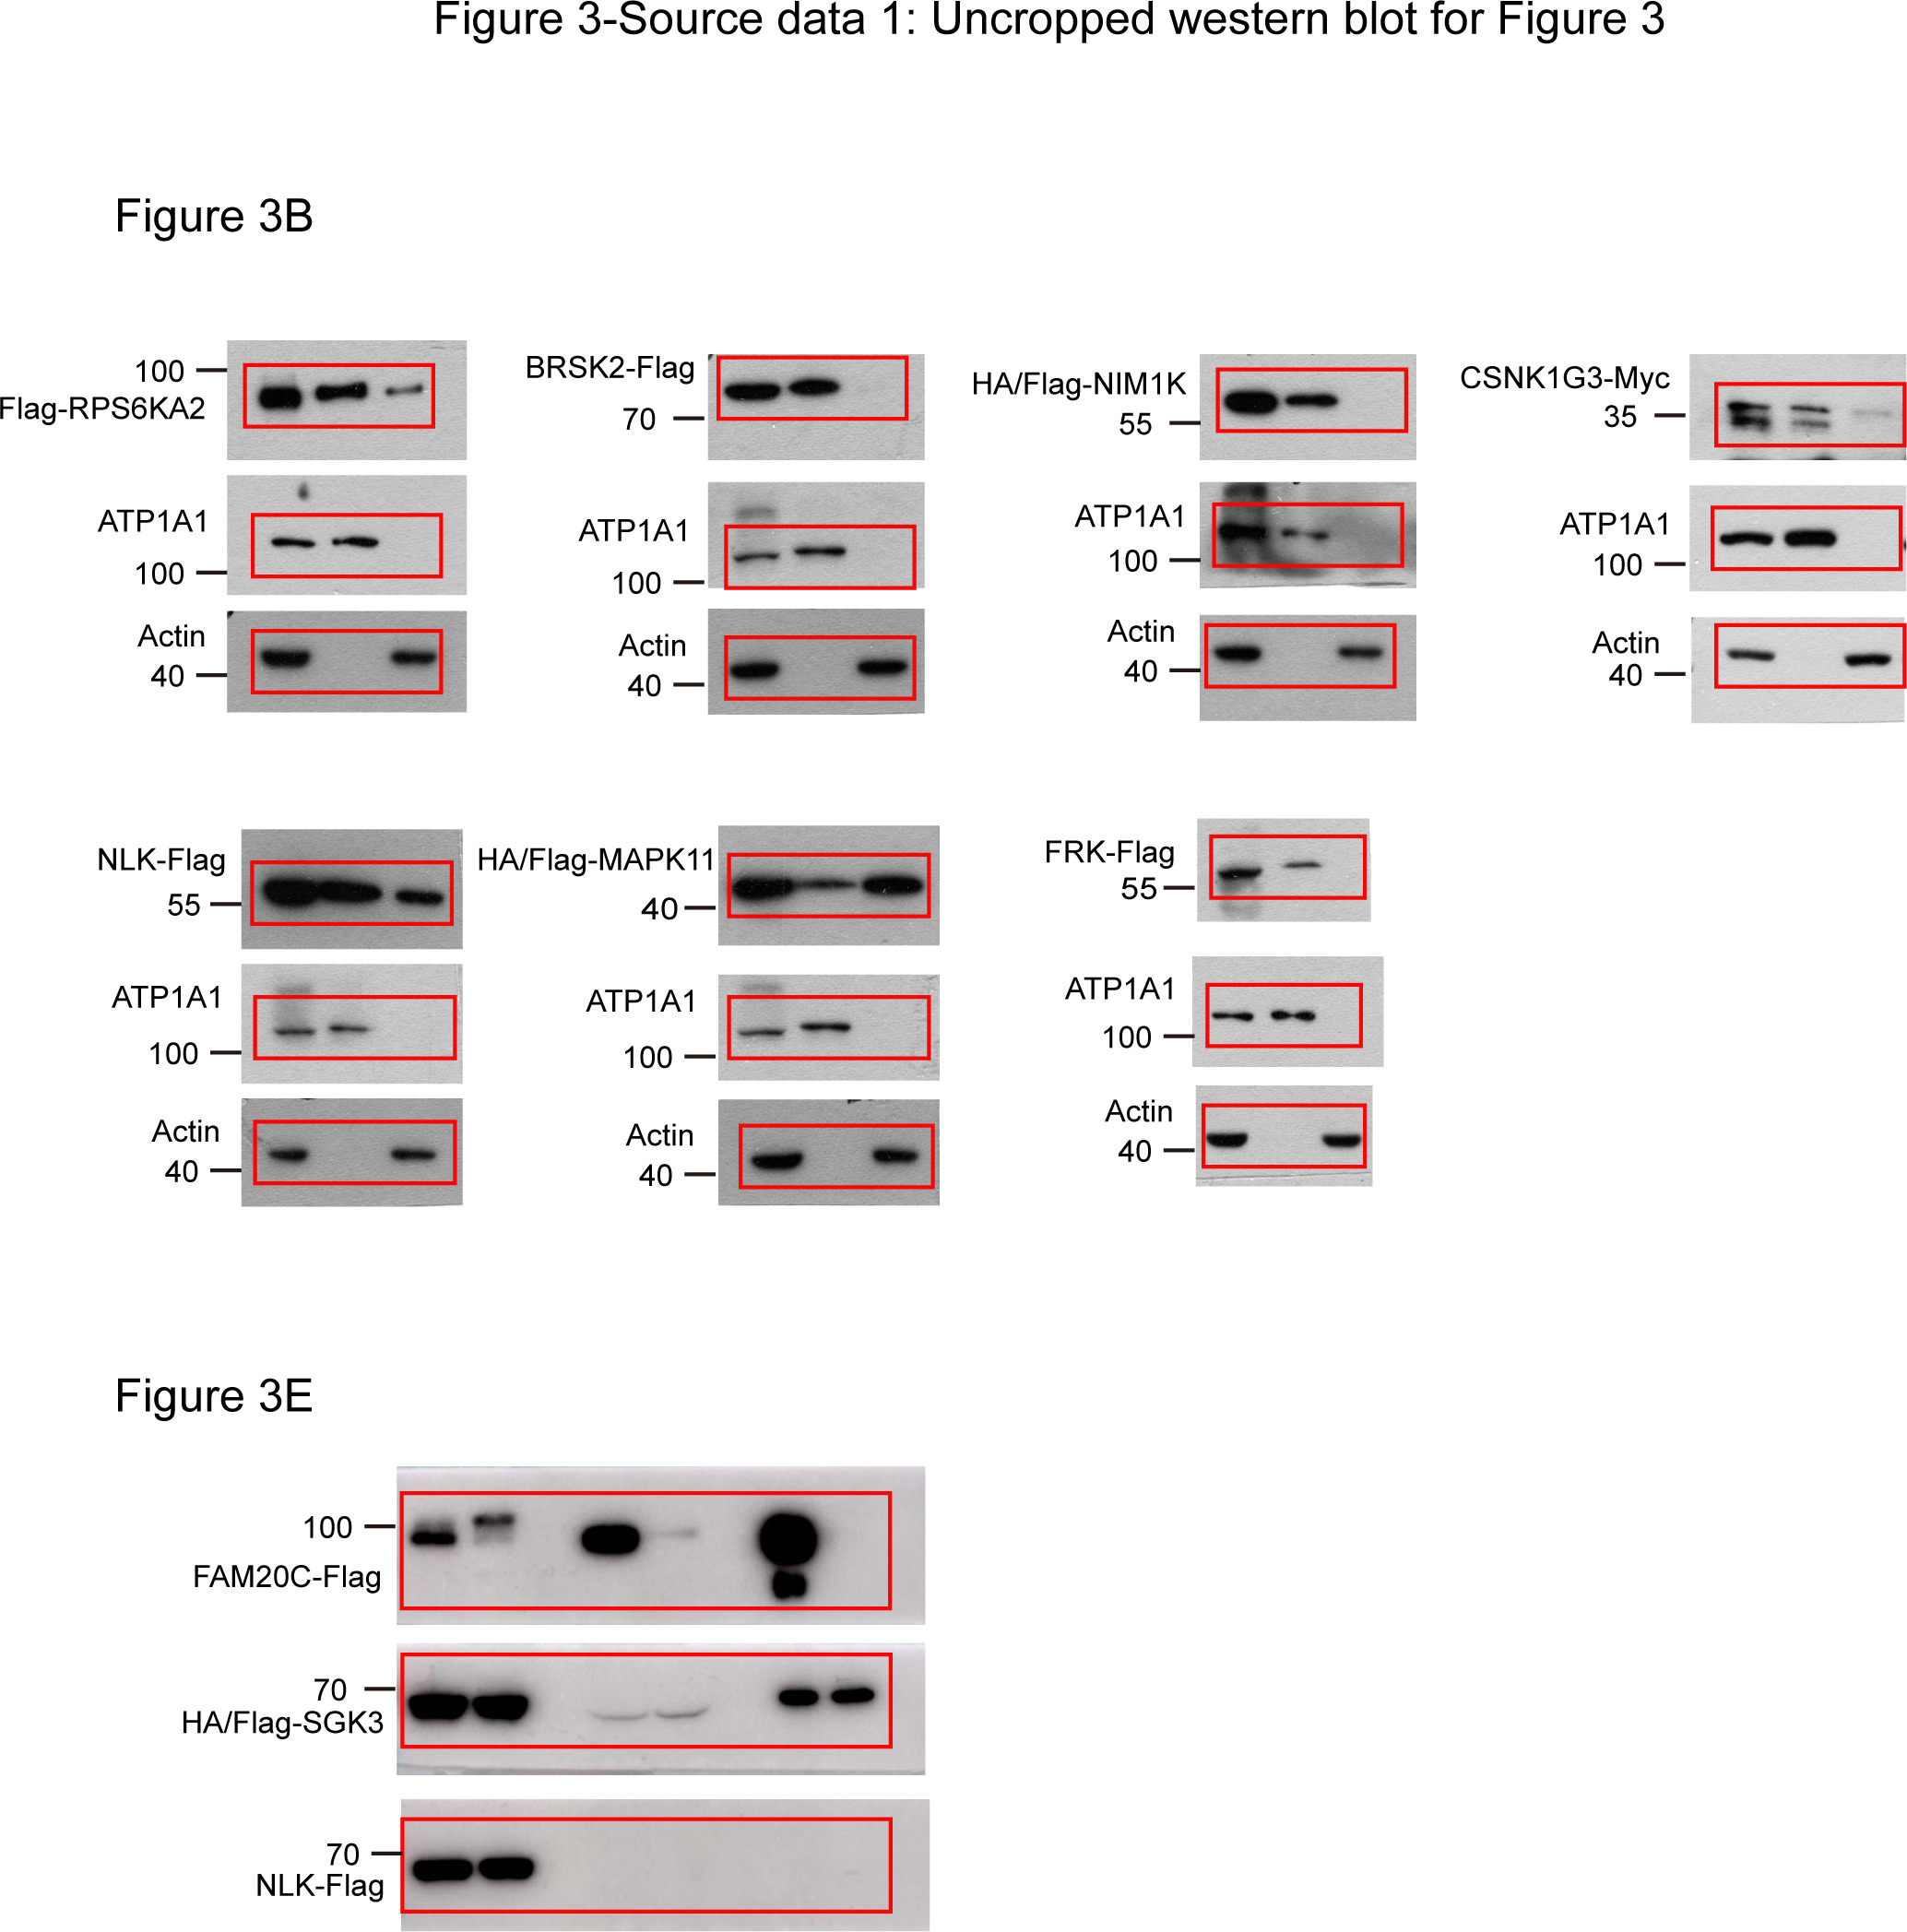
(A, B) New plasma membrane-localized kinases identified by KA. Original mapping data (A) and confirmation by cellular fractionation (B). W: whole cell lysate; M: membrane; C: cytosol. Equal loading was achieved by normalizing to the same number of cells. (C) Confirmation of endoplasmic reticulum (ER)-localized kinases. HeLa cells were co-transfected with kinase and GFP-SEC61B. VRK2 was used as a positive control of ER protein. Squared areas were enlarged on the right. (D) Confirmation of SGK3 localization in transfected HeLa cells. (E) SGK3 was secreted to culture medium. HEK293T cells were transfected and brefeldin A (BFA) (0.5 μg/ml) treated for 24 hr as indicated. Both culture medium and cell lysates were collected. Medium was further immunoprecipitated by anti-Flag antibody. Loading was normalized by the number of input cells, and IP samples were loaded at 5× of input. (F) MAP4K3 colocalizes with microtubule and ER in HeLa cells. Arrowheads indicate colocalization. (G) MAP4K3 colocalizes with SEC61B as captured by Zeiss Airyscan high-resolution microscopy. (H) Cell-type-dependent localization of MAP4K3. Indicated cells were transfected with Flag-MAP4K3 and stained by anti-Flag antibody. (I) LKB1 inhibits tubule-like localization of MAP4K3. Control and LKB1-expressing H460 cells were transfected with Flag-MAP4K3 and were stained by anti-Flag antibody. Cells with different localization patterns were quantified. Data was represented as mean ± SD; n = 3 independent experiments, two-tailed Student’s t test; n = 100 cells were analyzed in each experiment (Figure 3—figure supplement 1).
-
Figure 3—source data 1
Uncropped western blot for Figure 3.
- https://cdn.elifesciences.org/articles/64943/elife-64943-fig3-data1-v2.jpg
-
Figure 3—source data 2
Raw data for Figure 3.
- https://cdn.elifesciences.org/articles/64943/elife-64943-fig3-data2-v2.xlsx
Figure 3—figure supplement 1
Kinome Atlas (KA) identified unknown localizations for kinases.
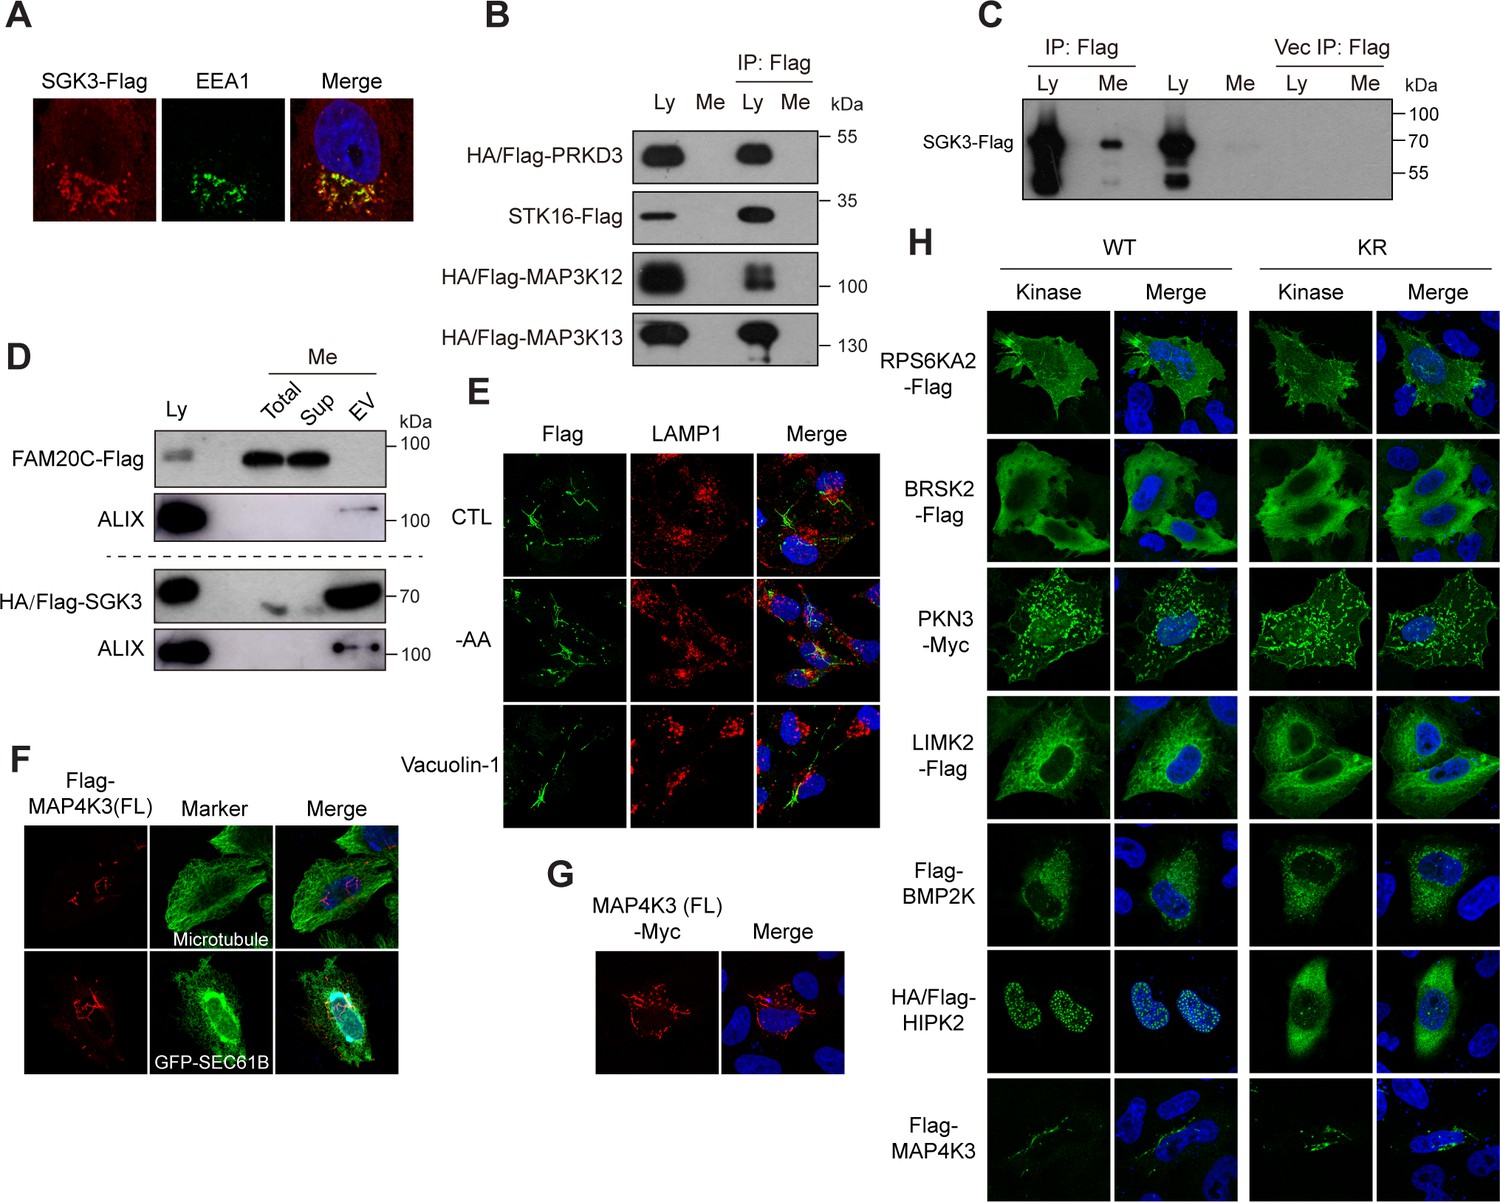
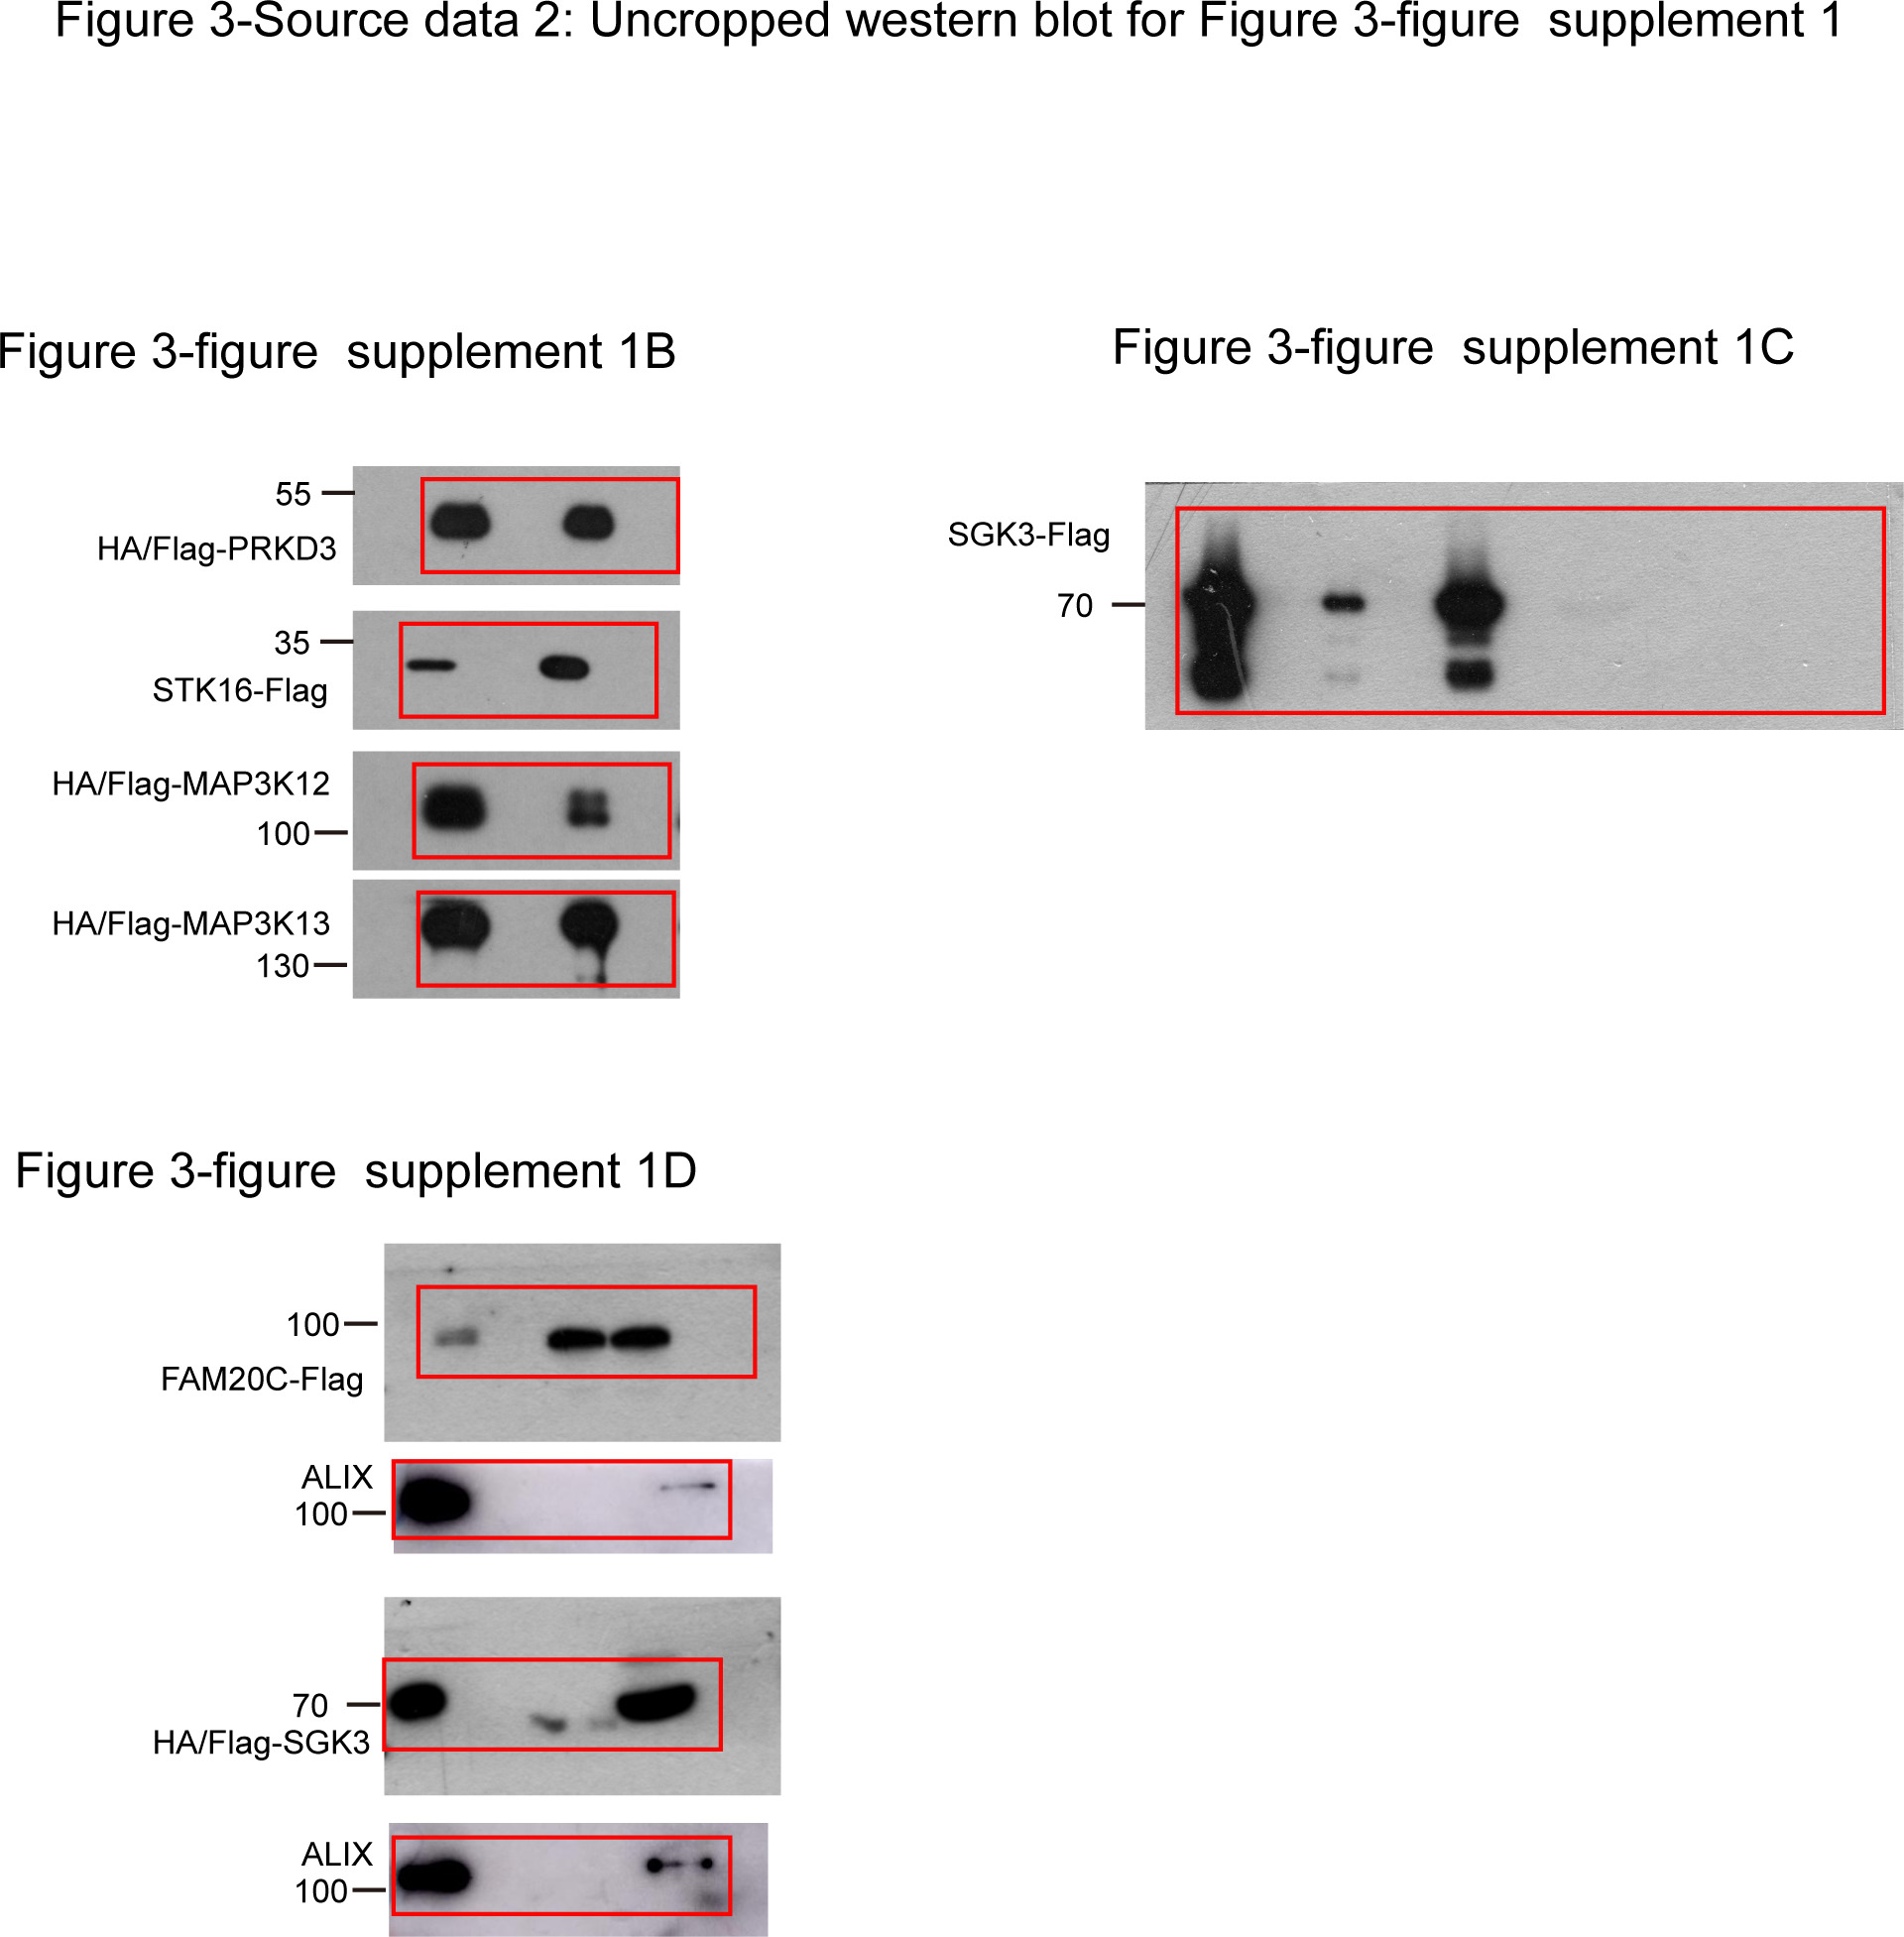
(A) C-terminal tagged SGK3 colocalizes with EEA1 in HeLa cells. (B) PRKD3, STK16, MAP3K12, and MAP3K13 are not secreted. HEK293T cells were transfected. Both culture medium and cell lysates were collected and immunoprecipitated by anti-Flag M2 resin. Loading was normalized by the number of input cells, and IP samples were loaded at 5× of input. (C) C-terminal tagged SGK3 was secreted to culture medium. Experiments were similar to (B). (D) Presence of SGK3 in exosomes. Culture mediums were ultracentrifuged, and fractions were examined by western blotting. Loading was normalized by the number of input cells, and EV fractions were loaded at 5× of input. ALIX is a marker of exosome. (E) MAP4K3 does not colocalize with lysosome. HeLa cells were transfected with Flag-MAP4K3. Cells were starved in Hanks’ Balanced Salt Solution containing 10% dialyzed FBS and 4.5 g/L glucose for 6 hr or treated with 200 nM vacuolin-1 for 1.5 hr. Cells were stained with anti-Flag and anti-LAMP1 antibodies. (F) N-terminal tagged full-length MAP4K3 exhibits tubule-like structures colocalizing with microtubule and endoplasmic reticulum (ER) in HeLa cells. (G) C-terminal tagged full-length MAP4K3 exhibits tubule-like structures in HeLa cells. (H) Subcellular localization of inactive kinases. Wildtype kinases and kinase inactive mutants (KR) were transfected into HeLa cells. Cells were then fixed and stained.
-
Figure 3—figure supplement 1—source data 1
Uncropped western blot for Figure 3—figure supplement 1.
- https://cdn.elifesciences.org/articles/64943/elife-64943-fig3-figsupp1-data1-v2.jpg
Figure 4 with 1 supplement
Phase separation assembles kinase condensates.
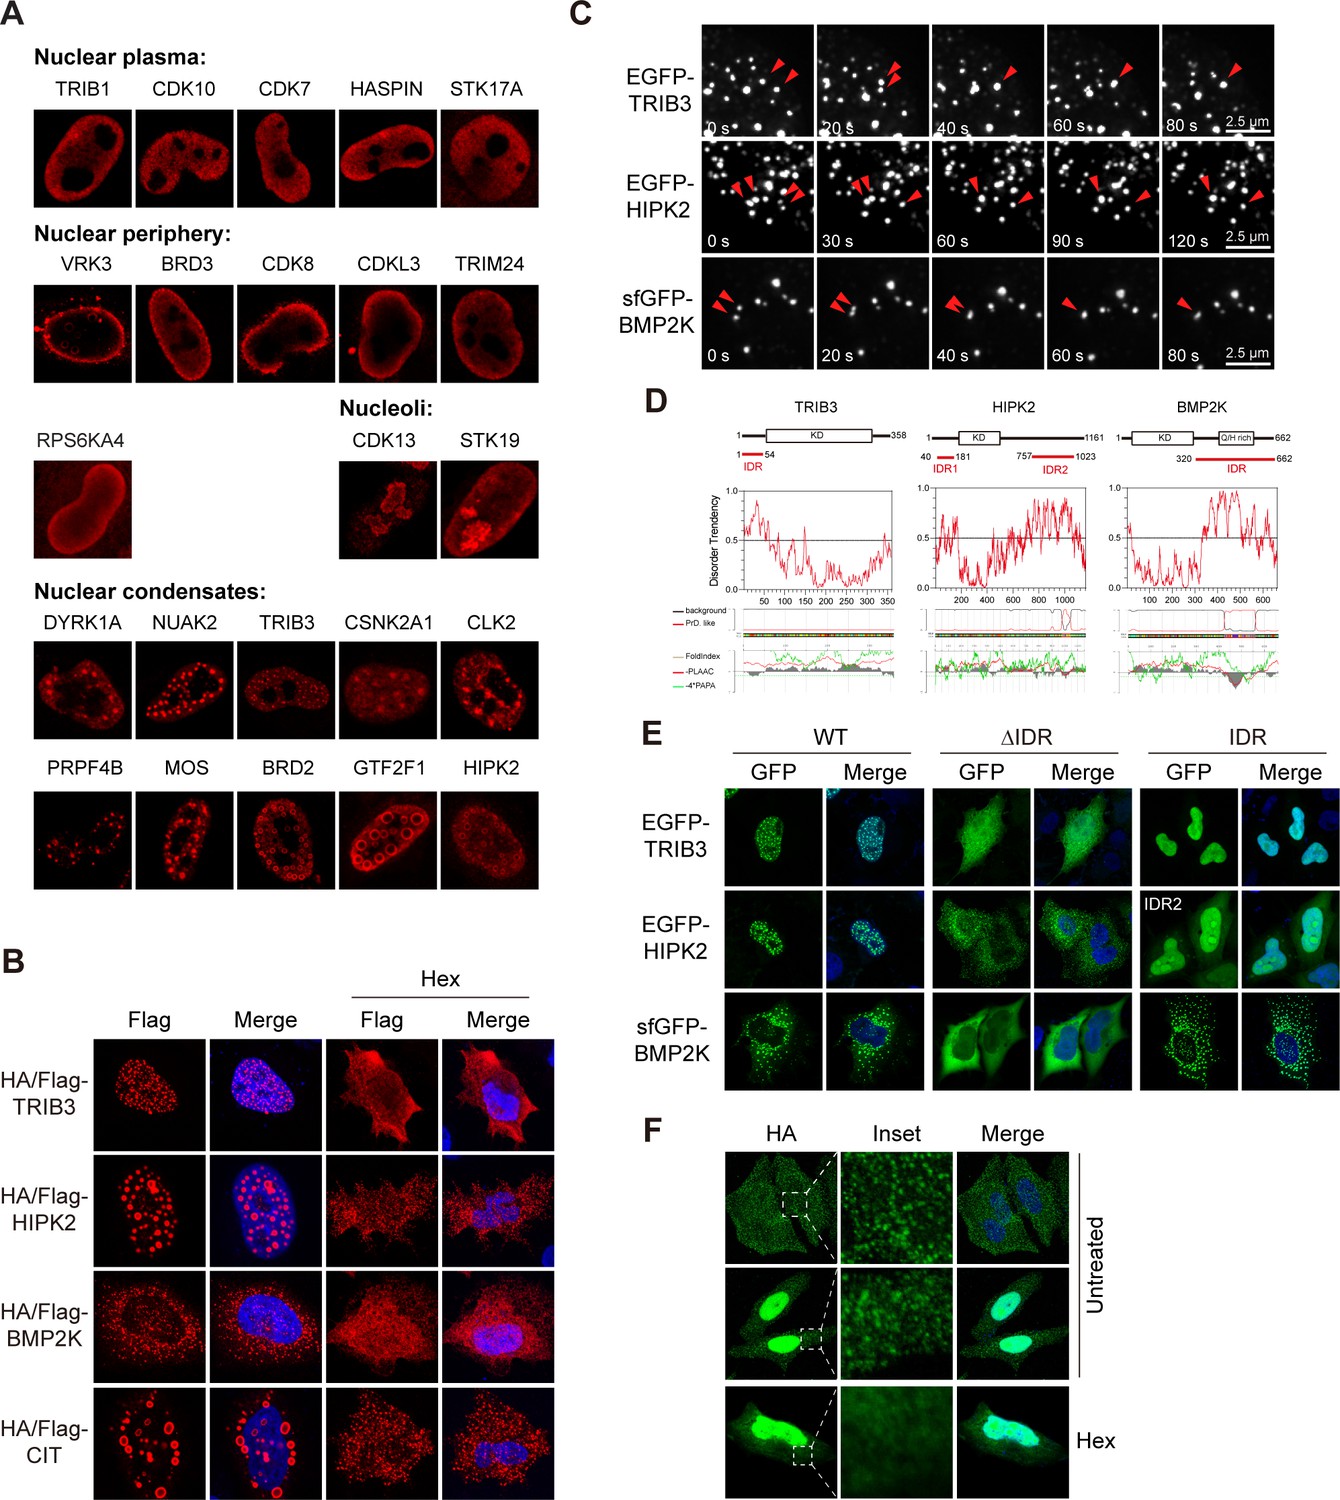
(A) Sub-nuclear patterns of kinases in Kinome Atlas (KA). (B) Hex disrupts puncta localization of kinases. Transfected HeLa cells were treated with 10% 1,6-hexanediol (Hex) for 1 min as indicated. Cells were then fixed and stained. (C) Fusion of kinase puncta in live cells. HeLa cells expressing GFP-tagged kinases were examined by time-lapse microscopy. Fusion events were indicated by arrowheads. (D) Sequence analysis identified intrinsically disordered regions (IDRs) in kinases. Domain organizations were illustrated in scale. KD: kinase domain. Disorder tendency was predicted by IUPred2A. Prion-like regions and fold index were predicted by PLAAC. (E) Deletion of IDR impairs puncta localization. Wildtype or mutants with GFP tag were expressed and visualized in HeLa cells. For HIPK2, both IDRs were deleted in ΔIDR. (F) Puncta formed by endogenous BMP2K in HeLa cells. BMP2K 3xHA tag knock-in HeLa cells were treated with 10% Hex for 1 min as indicated. Cells were then fixed and stained (Figure 4—figure supplement 1).
Figure 4—figure supplement 1
Phase separation assembles kinase condensates.
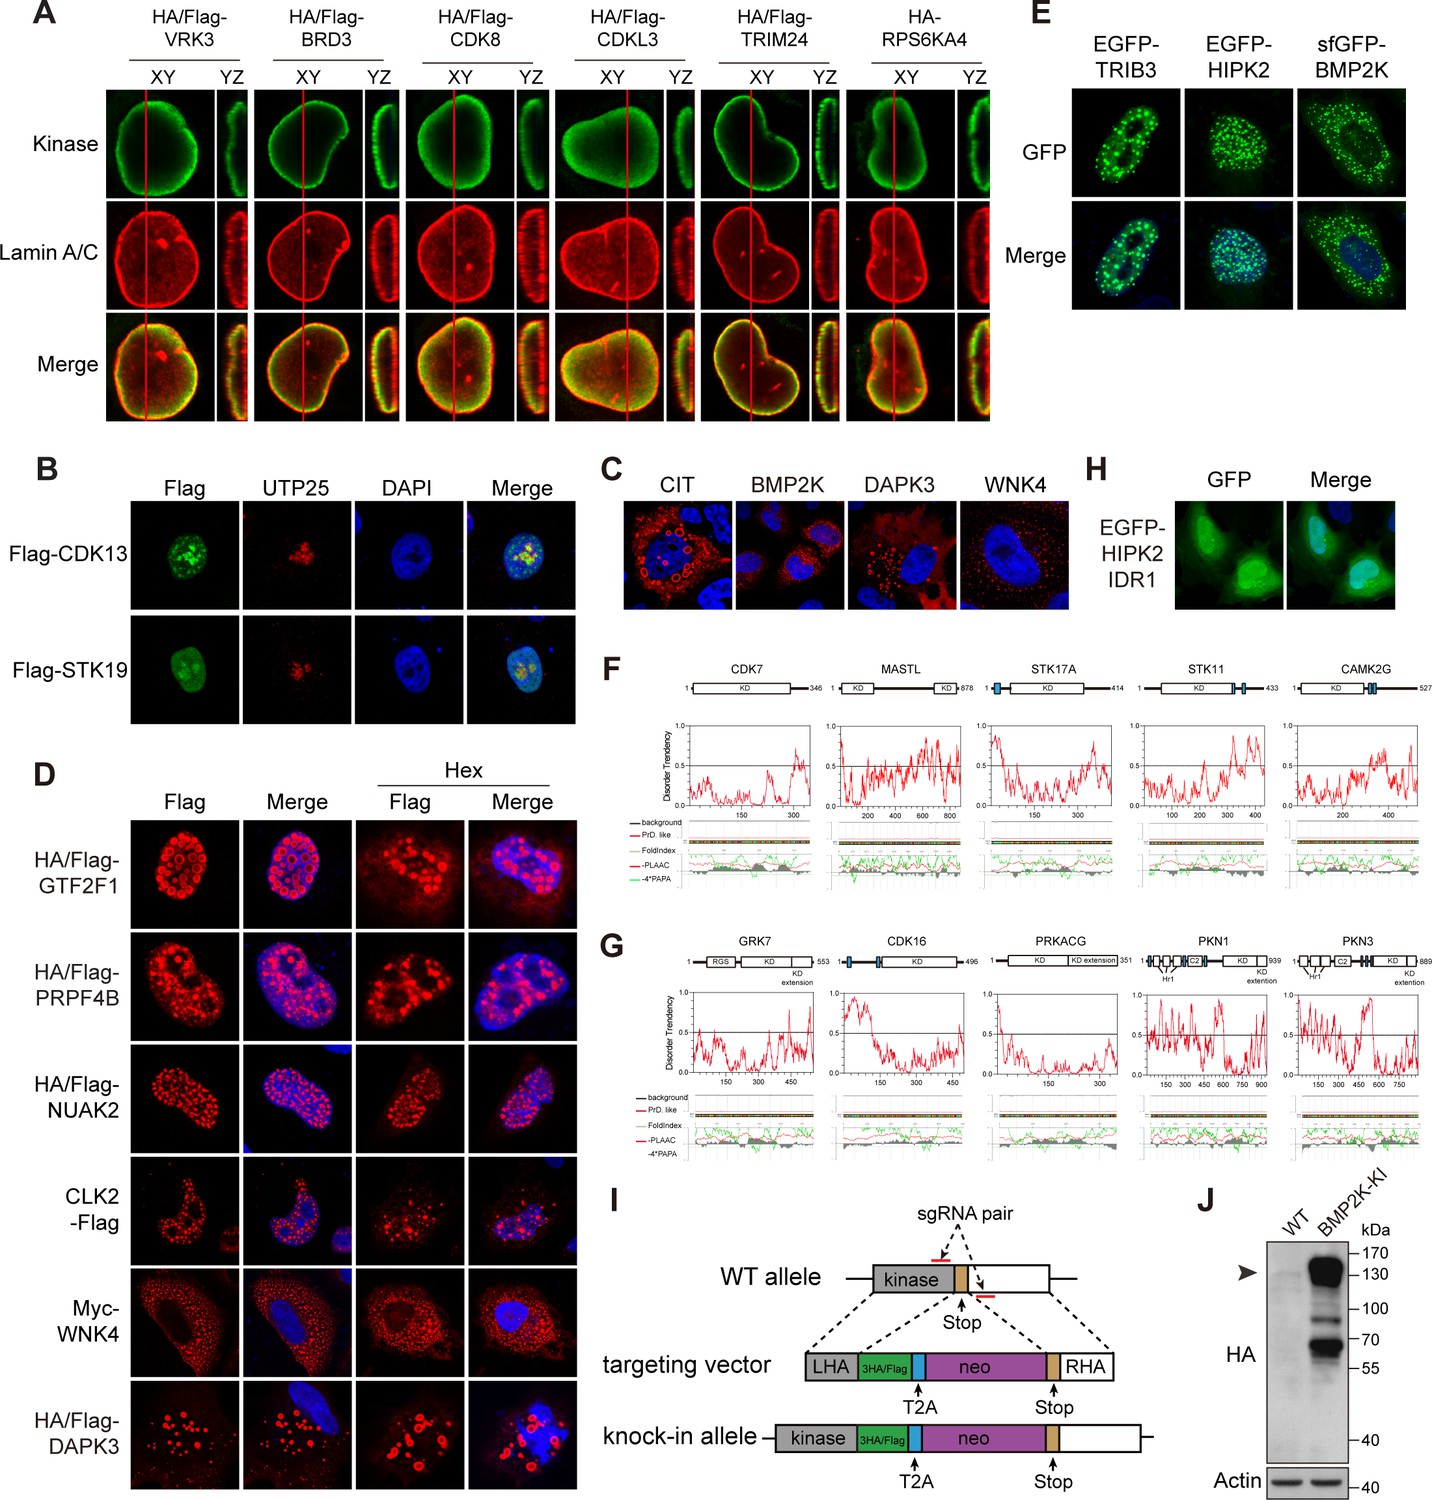
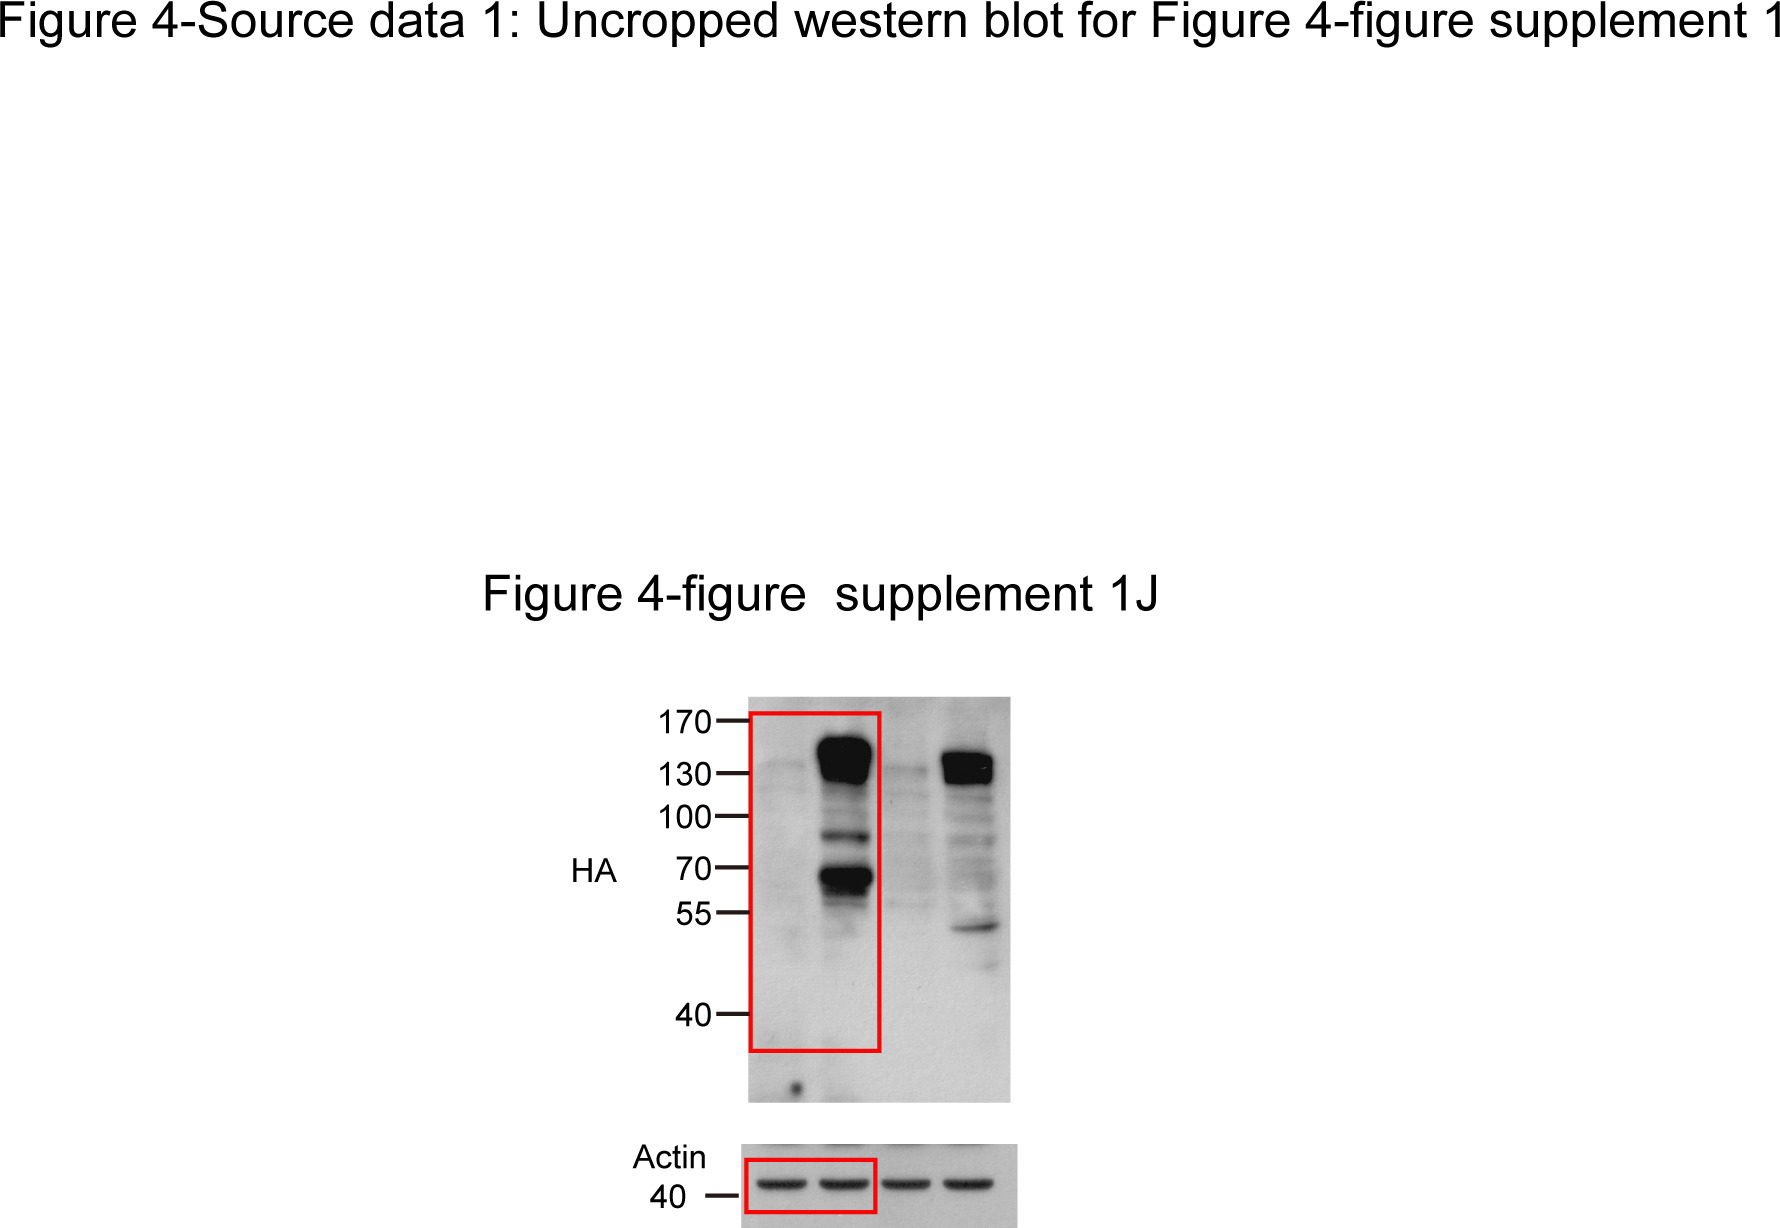
(A) Nuclear peripheral kinases visualized by Airyscan high-resolution microscopy. Transfected HeLa cells were stained with anti-HA for the kinase and anti-Lamin A/C for nuclear envelope. (B) Confirmation of CDK13 and STK19 in nucleoli. HeLa cells were transfected and stained by anti-Flag and anti-UTP25 antibodies. (C) Cytoplasmic puncta formed by kinases. (D) Hex-resistant puncta formed by kinases. Transfected HeLa cells were treated with 10% Hex for 1 min as indicated. Cells were then fixed and stained. (E) GFP tag did not affect puncta localization of examined kinases. GFP-tagged kinases were expressed and imaged in HeLa cells. (F, G) Sequence analysis of randomly selected nuclear (F) and cytosolic (G) kinases with even distribution. Domain organizations were illustrated in scale. KD: kinase domain. Blue bars represent low complexity domains. Disorder tendency was predicted by IUPred2A. Prion-like regions and fold index were predicted by PLAAC. (H) Subcellular localization of HIPK2 intrinsically disordered region (IDR)1. HIPK2 IDR1 with GFP tag was expressed and visualized in HeLa cells. (I) Knock-in of epitope tags with CRISPR/Cas9 technology. L/RHA: left/right homologous arm. (J) Confirmation of BMP2K knock-in cells by western blotting. Arrowhead denotes BMP2K in predicted molecular weight.
-
Figure 4—figure supplement 1—source data 1
Uncropped western blot for Figure 4—figure supplement 1.
- https://cdn.elifesciences.org/articles/64943/elife-64943-fig4-figsupp1-data1-v2.jpg
Figure 5 with 1 supplement
Kinome Atlas (KA) identified novel mitochondrial kinases.
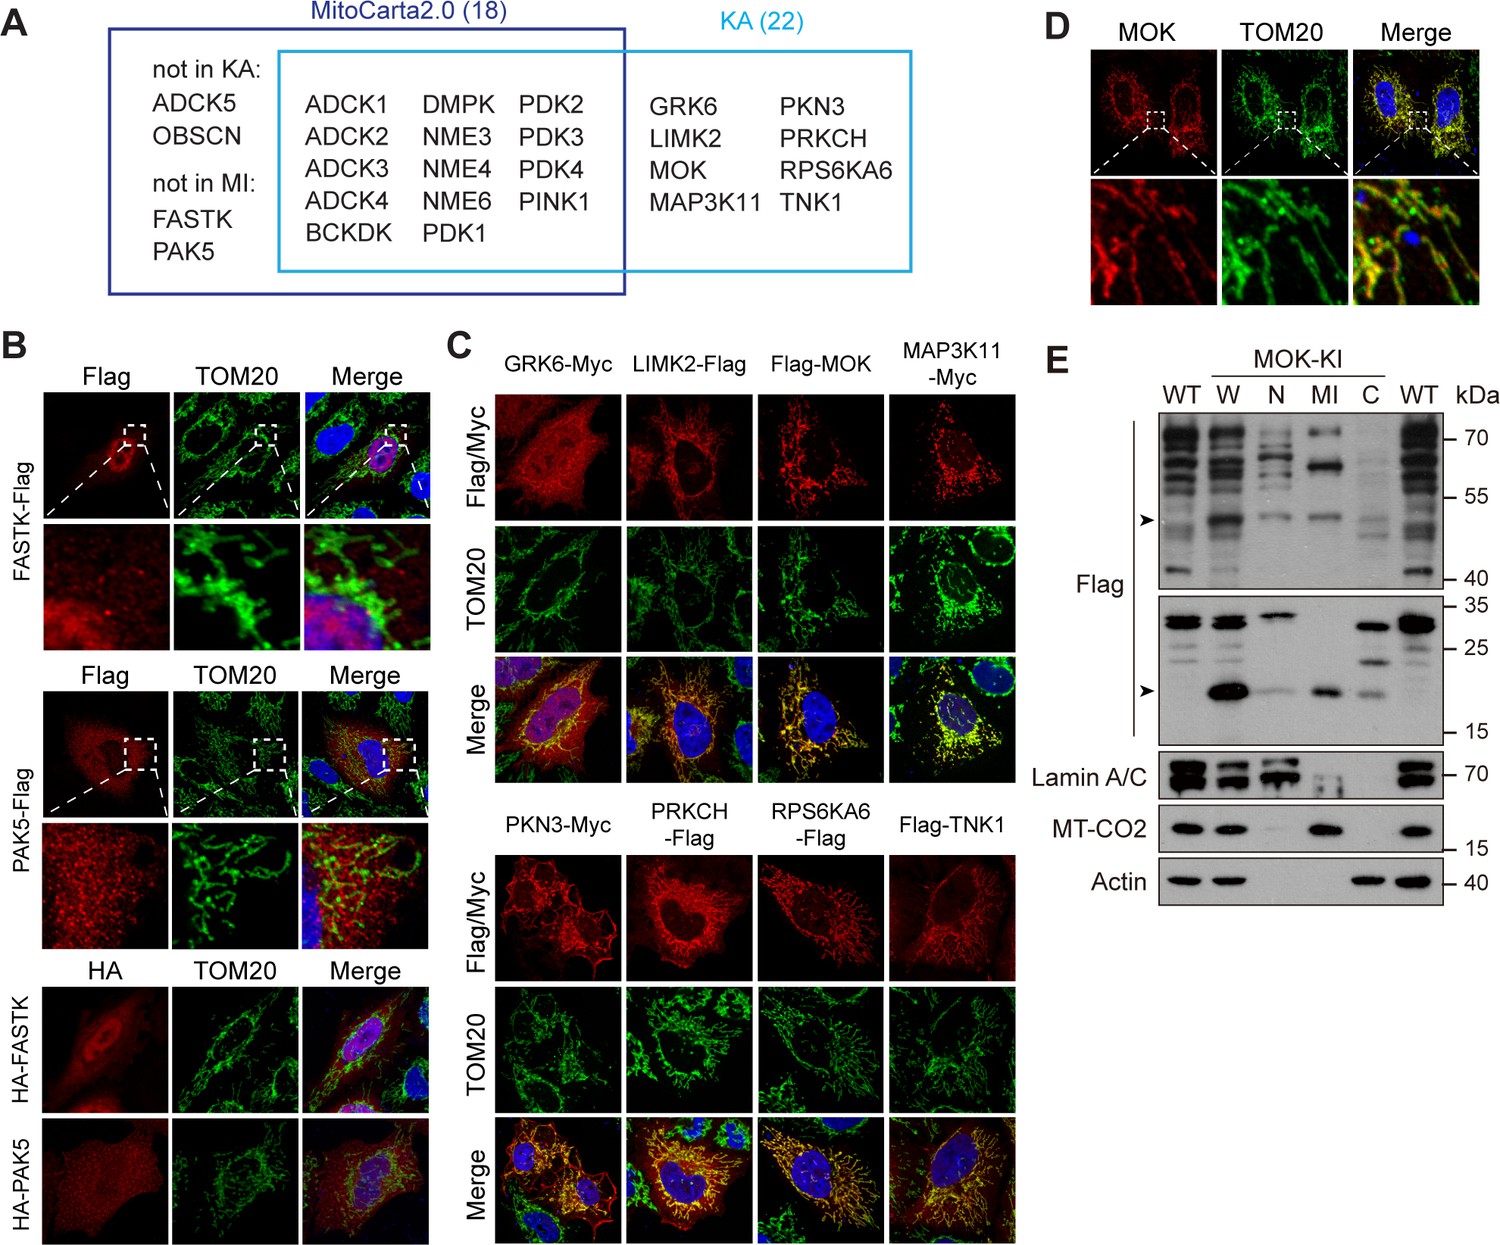
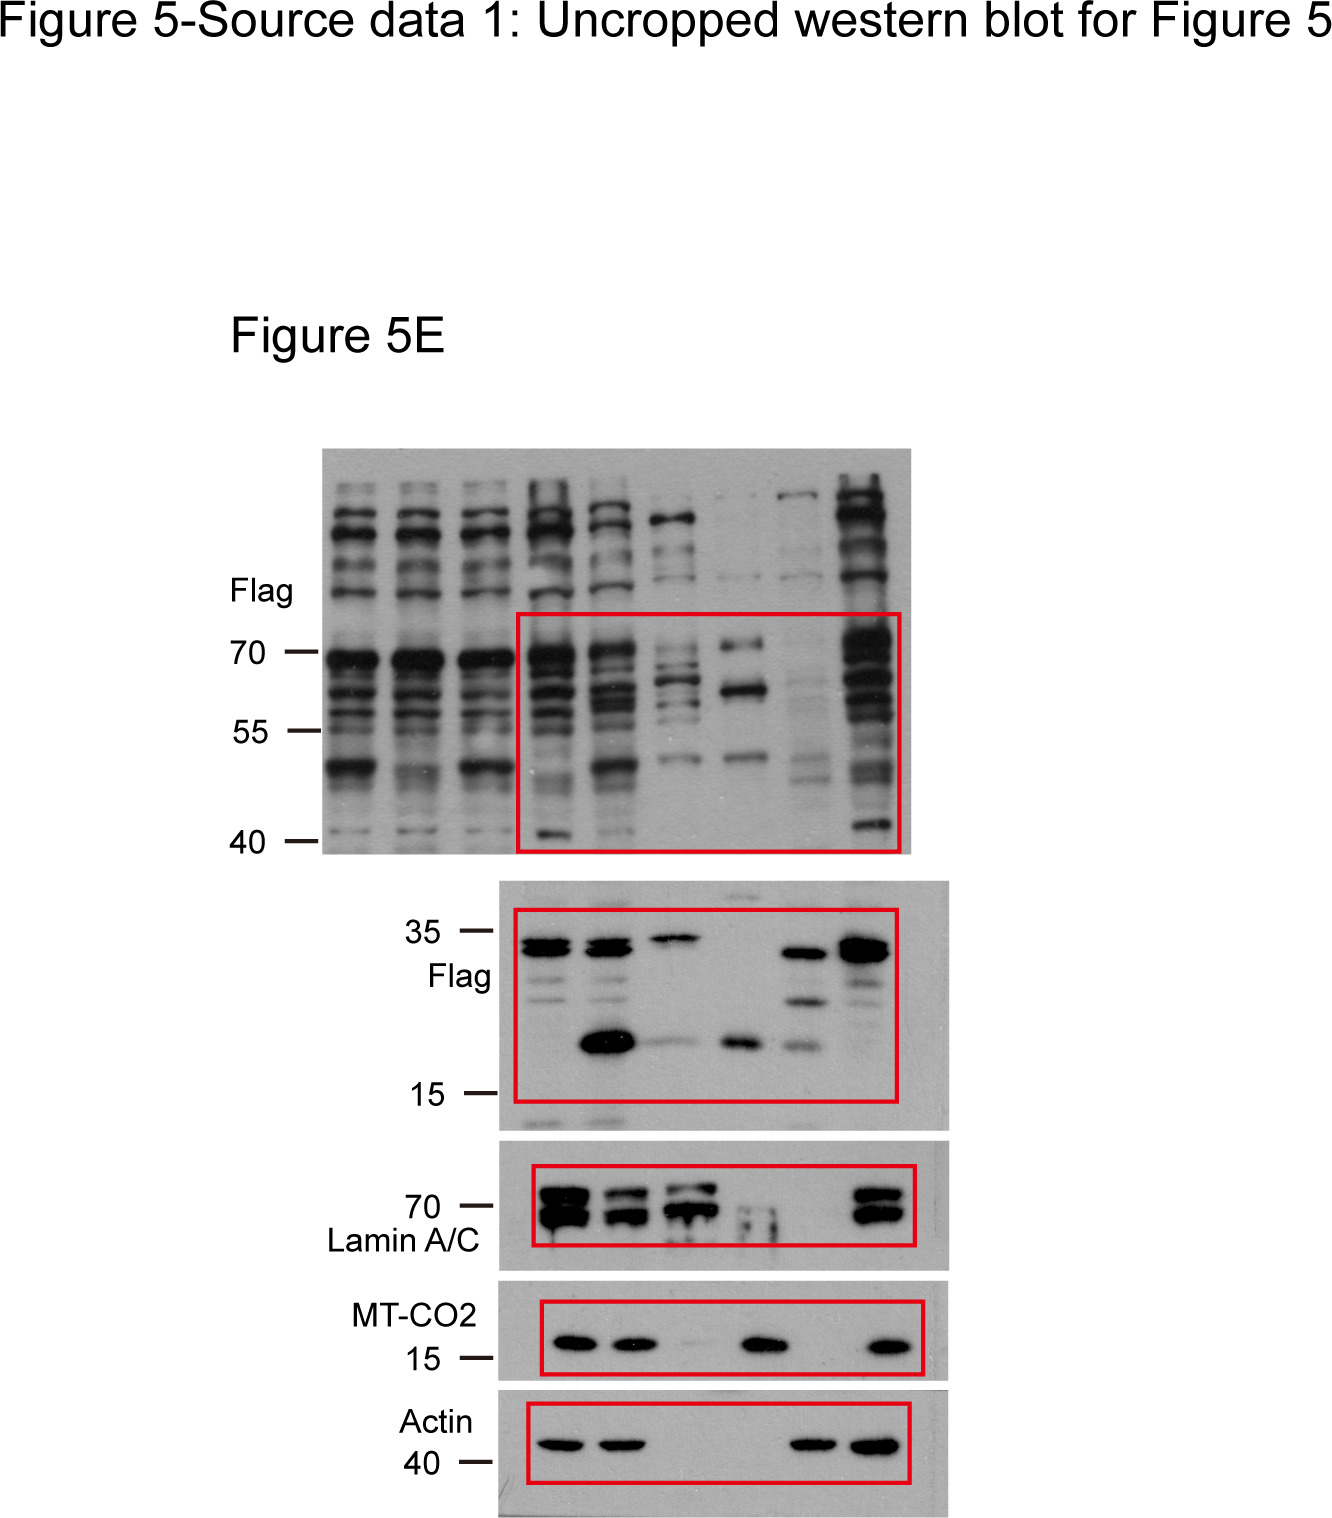
(A) Comparison of MitoCarta2.0 and KA. (B) FASTK and PAK5 are not mitochondrial. N- and C-terminal tagged kinases were expressed in HeLa cells and stained. (C) Mitochondrial kinases identified by KA. Experiments are similar to (B). (D) Overexpressed tagless MOK localized to mitochondria. Transfected HeLa cells were fixed and stained with anti-MOK antibody. (E) Endogenous MOK was present in mitochondria. MOK 3x Flag knock-in HeLa cells were fractionated and examined by western blotting. W: whole cell lysate; N: nucleus; MI: mitochondria; C: cytosol. Lamin A/C, MT-CO2, and Actin are nuclear, mitochondrial, and cytosolic markers, respectively. Equal loading was achieved by normalizing to the same number of cells. Arrowheads indicate MOK (Figure 5—figure supplement 1).
-
Figure 5—source data 1
Uncropped western blot for Figure 5.
- https://cdn.elifesciences.org/articles/64943/elife-64943-fig5-data1-v2.jpg
Figure 5—figure supplement 1
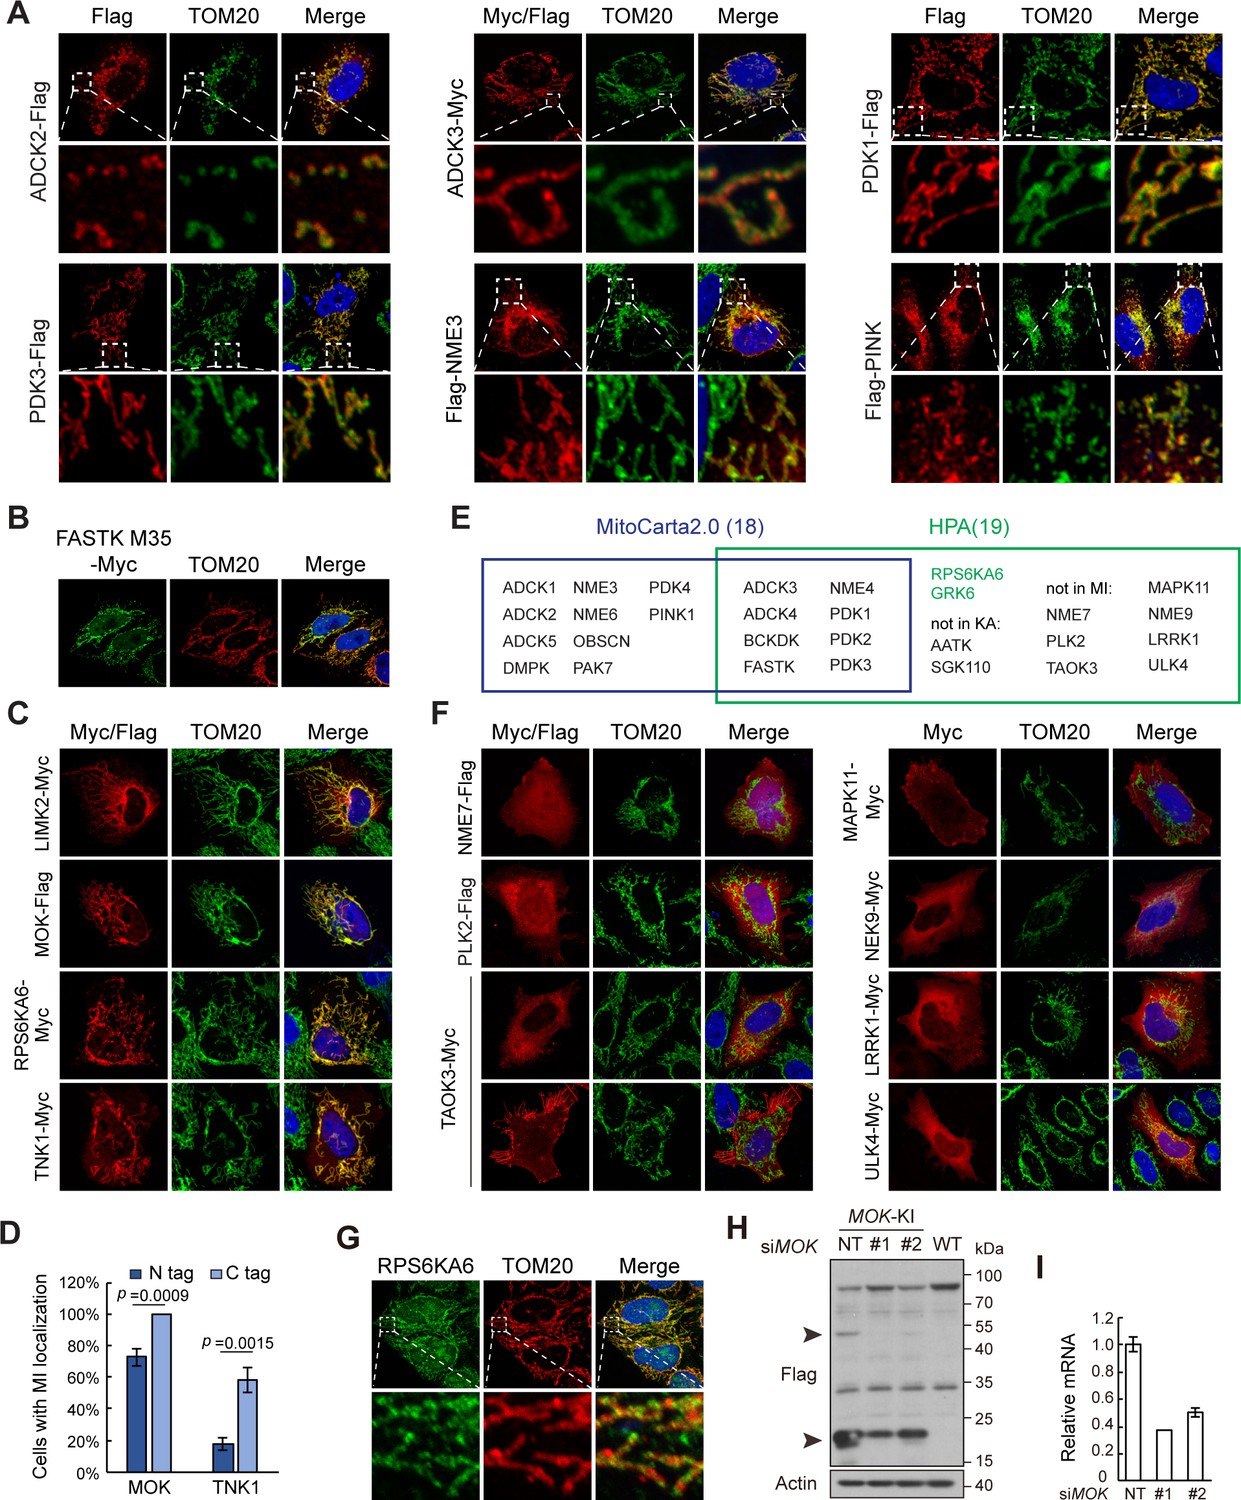
Kinome Atlas (KA) identified novel mitochondrial kinases.
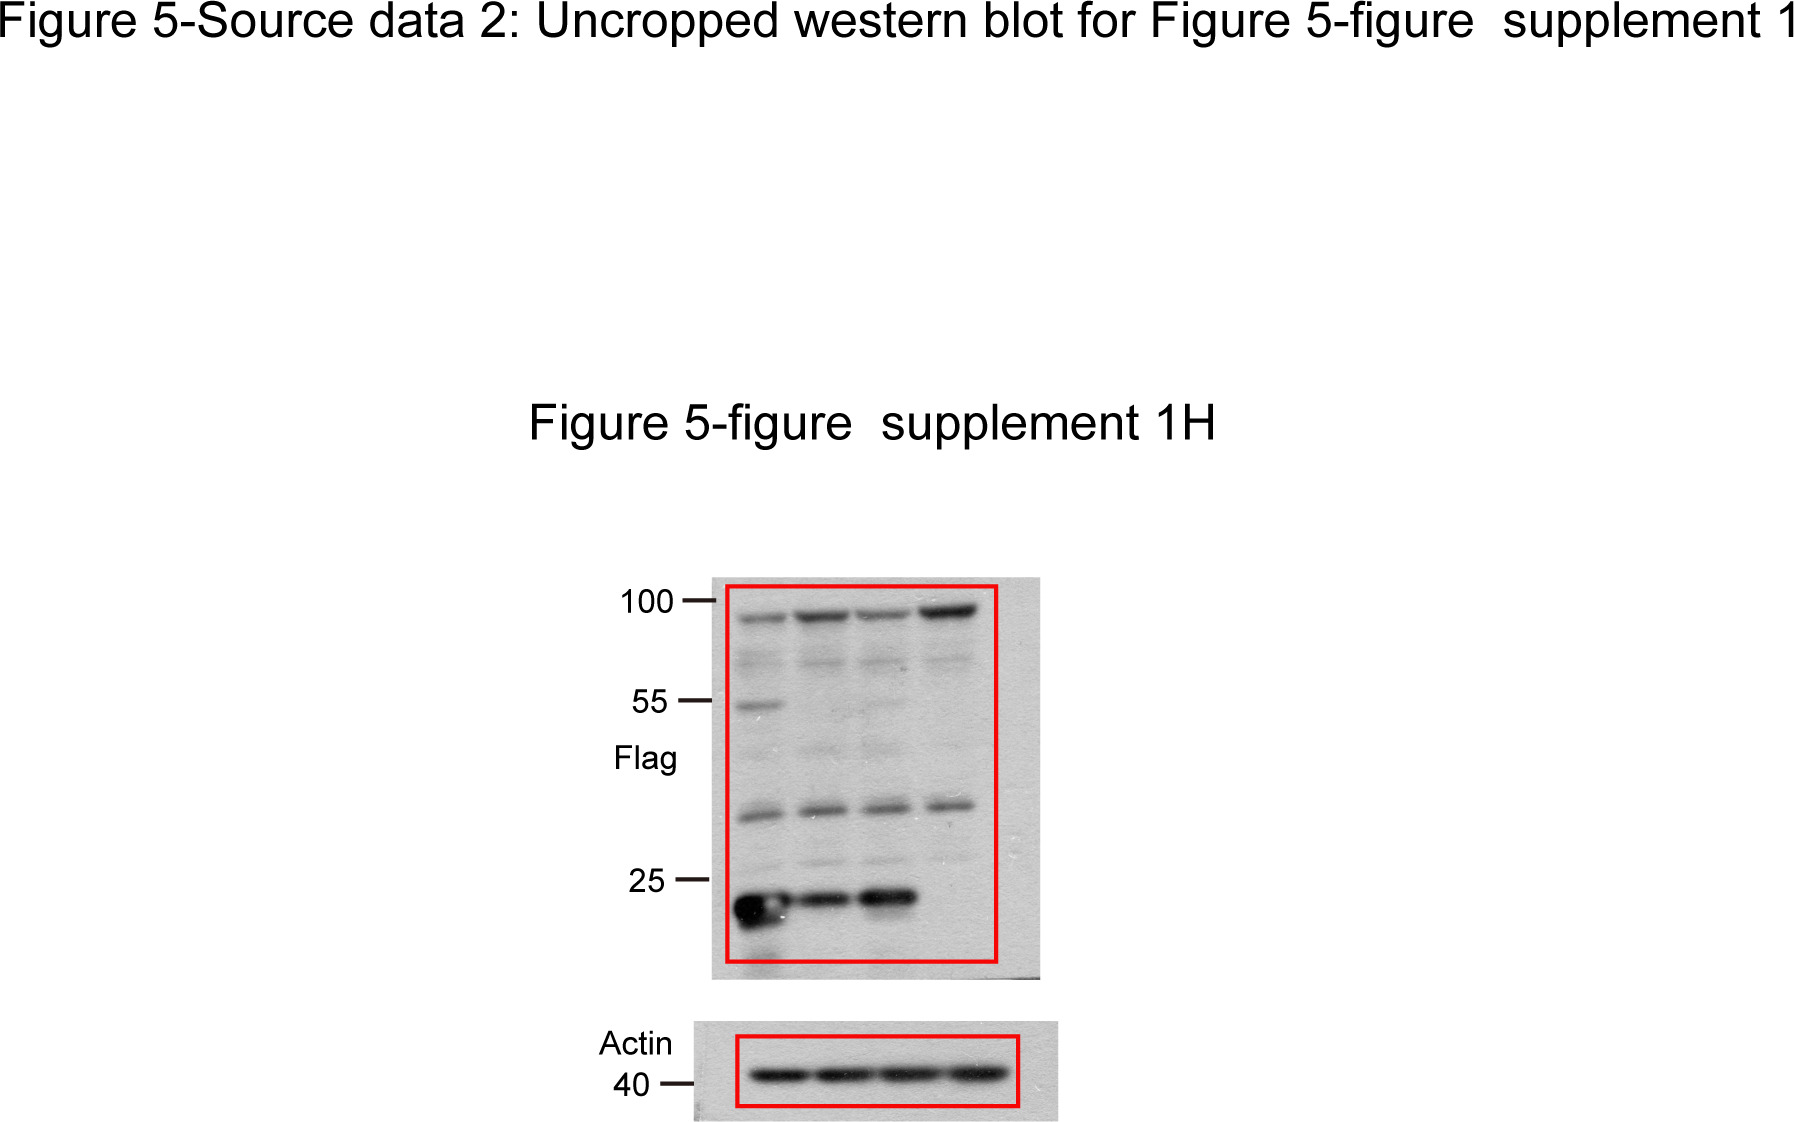
(A) Confirmation of mitochondrial kinases by co-staining with TOM20. (B) N-terminal truncated isoform of FASTK exhibited mitochondrial localization. FASTK-M35 was transfected in HeLa cells and stained with anti-Myc antibody. (C) Confirmation of mitochondrial kinases in MCF10A cells. C-terminal-tagged kinases were expressed in MCF10A cells and stained. (D) Effect of tag position on MOK and TNK1 mitochondrial localization. MOK and TNK1 tagged on either end were expressed in HeLa cells, and 100 cells in random views were quantified for mitochondrial localization. Data is represented as mean ± SD; n = 3 independent experiments, two-tailed Student’s t test. (E) Comparison of mitochondrial kinases in MitoCarta2.0 and Human Protein Atlas (HPA). Kinases only in HPA and confirmed by KA were labeled in green. (F) Kinases were tagged on the C-terminal, transfected, and stained in HeLa cells. (G) Endogenous RPS6KA6 of HeLa cells was stained by a specific antibody. (H) MOK 3x Flag knock-in HeLa cells were transfected with non-targeting or specific siRNAs, and cell lysates were examined by western blotting. (I) MOK siRNA knockdown efficiency as determined by quantitative RT-PCR.
-
Figure 5—figure supplement 1—source data 1
Uncropped western blot for Figure 5—figure supplement 1.
- https://cdn.elifesciences.org/articles/64943/elife-64943-fig5-figsupp1-data1-v2.jpg
-
Figure 5—figure supplement 1—source data 2
Raw data for Figure 5—figure supplement 1.
- https://cdn.elifesciences.org/articles/64943/elife-64943-fig5-figsupp1-data2-v2.xlsx
Figure 6 with 1 supplement
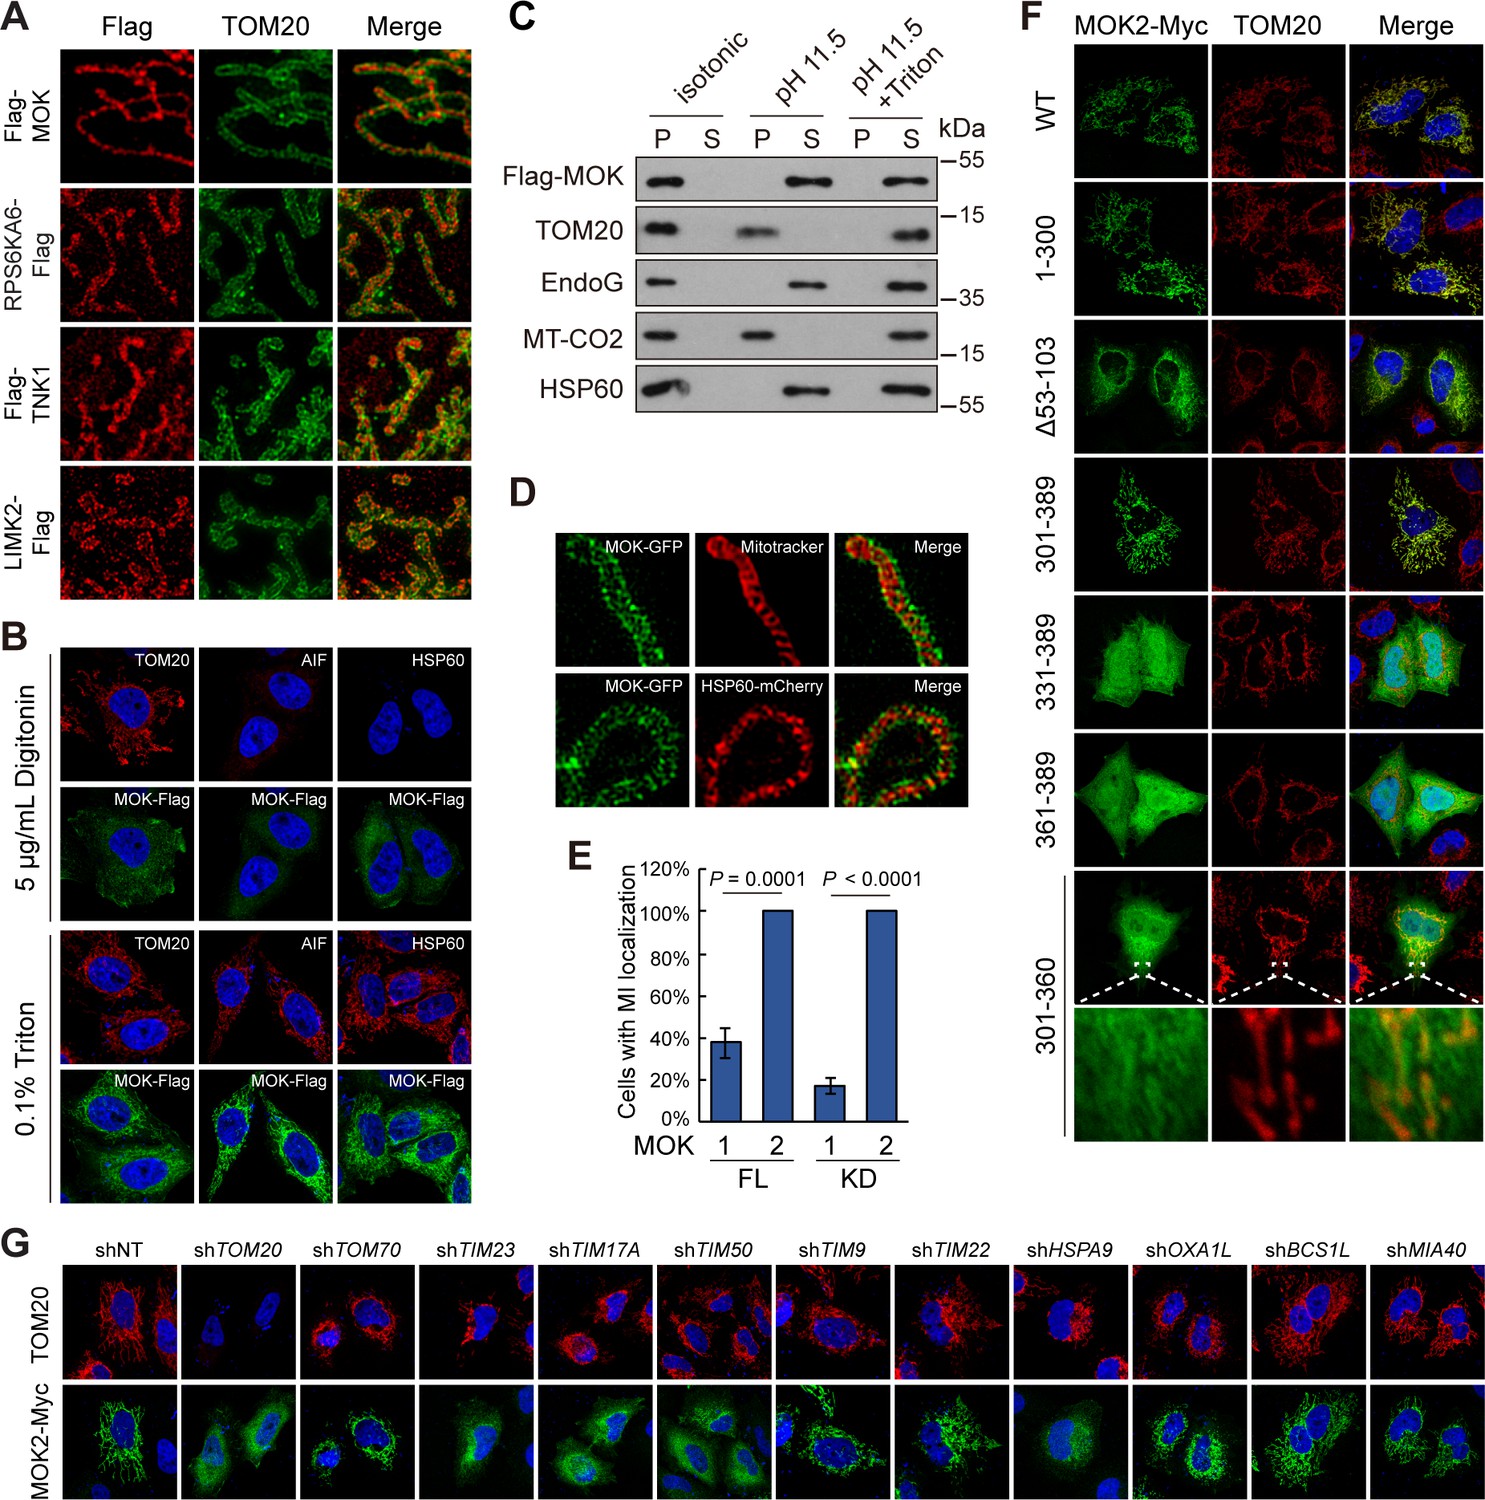
MOK is a mitochondrial intermembrane space (IMS)-localized protein.
(A) Sub-mitochondrial localizations of new mitochondrial kinases. Transfected HeLa cells were stained and imaged by 3D structured illumination microscopy (3D-SIM). (B) MOK2 is imported into mitochondria. Transfected HeLa cells were fixed and permeabilized with digitonin or Triton X-100 before staining. (C) MOK is not a mitochondrial membrane protein. Mitochondria purified from transfected HeLa cells were incubated in indicated buffers, and then centrifuged. Supernatants (S) and pellets (P) were analyzed by western blotting. Equal loading was achieved by normalizing to the same number of cells. (D) MOK is an IMS protein. COS-7 cells transfected with MOK2-GFP were imaged by Hessian SIM. MitoTracker Red marked inner membrane (IMM) and co-transfected HSP60-mCherry marked matrix. (E) MOK2 has better mitochondrial localization than MOK1. HeLa cells were transfected with full-length (FL) or kinase domain (KD) of MOK1 and MOK2. Cells with mitochondrial MOK were quantified. Data is represented as mean ± SD; n = 3 independent experiments, two-tailed Student’s t test; n = 100 cells were analyzed in each experiment. (F) Mitochondrial localization of MOK mutants. Transfected HeLa cells were stained with anti-Myc and anti-TOM20 antibodies. (G) TOM20-TIM23 complex is required for mitochondrial importing of MOK. HeLa cells expressing specific shRNAs were transfected with MOK2-Myc and stained (Figure 6—figure supplement 1).
-
Figure 6—source data 1
Uncropped western blot for Figure 6.
- https://cdn.elifesciences.org/articles/64943/elife-64943-fig6-data1-v2.jpg
-
Figure 6—source data 2
Raw data for Figure 6 and Figure 6—figure supplement 1.
- https://cdn.elifesciences.org/articles/64943/elife-64943-fig6-data2-v2.xlsx
Figure 6—figure supplement 1
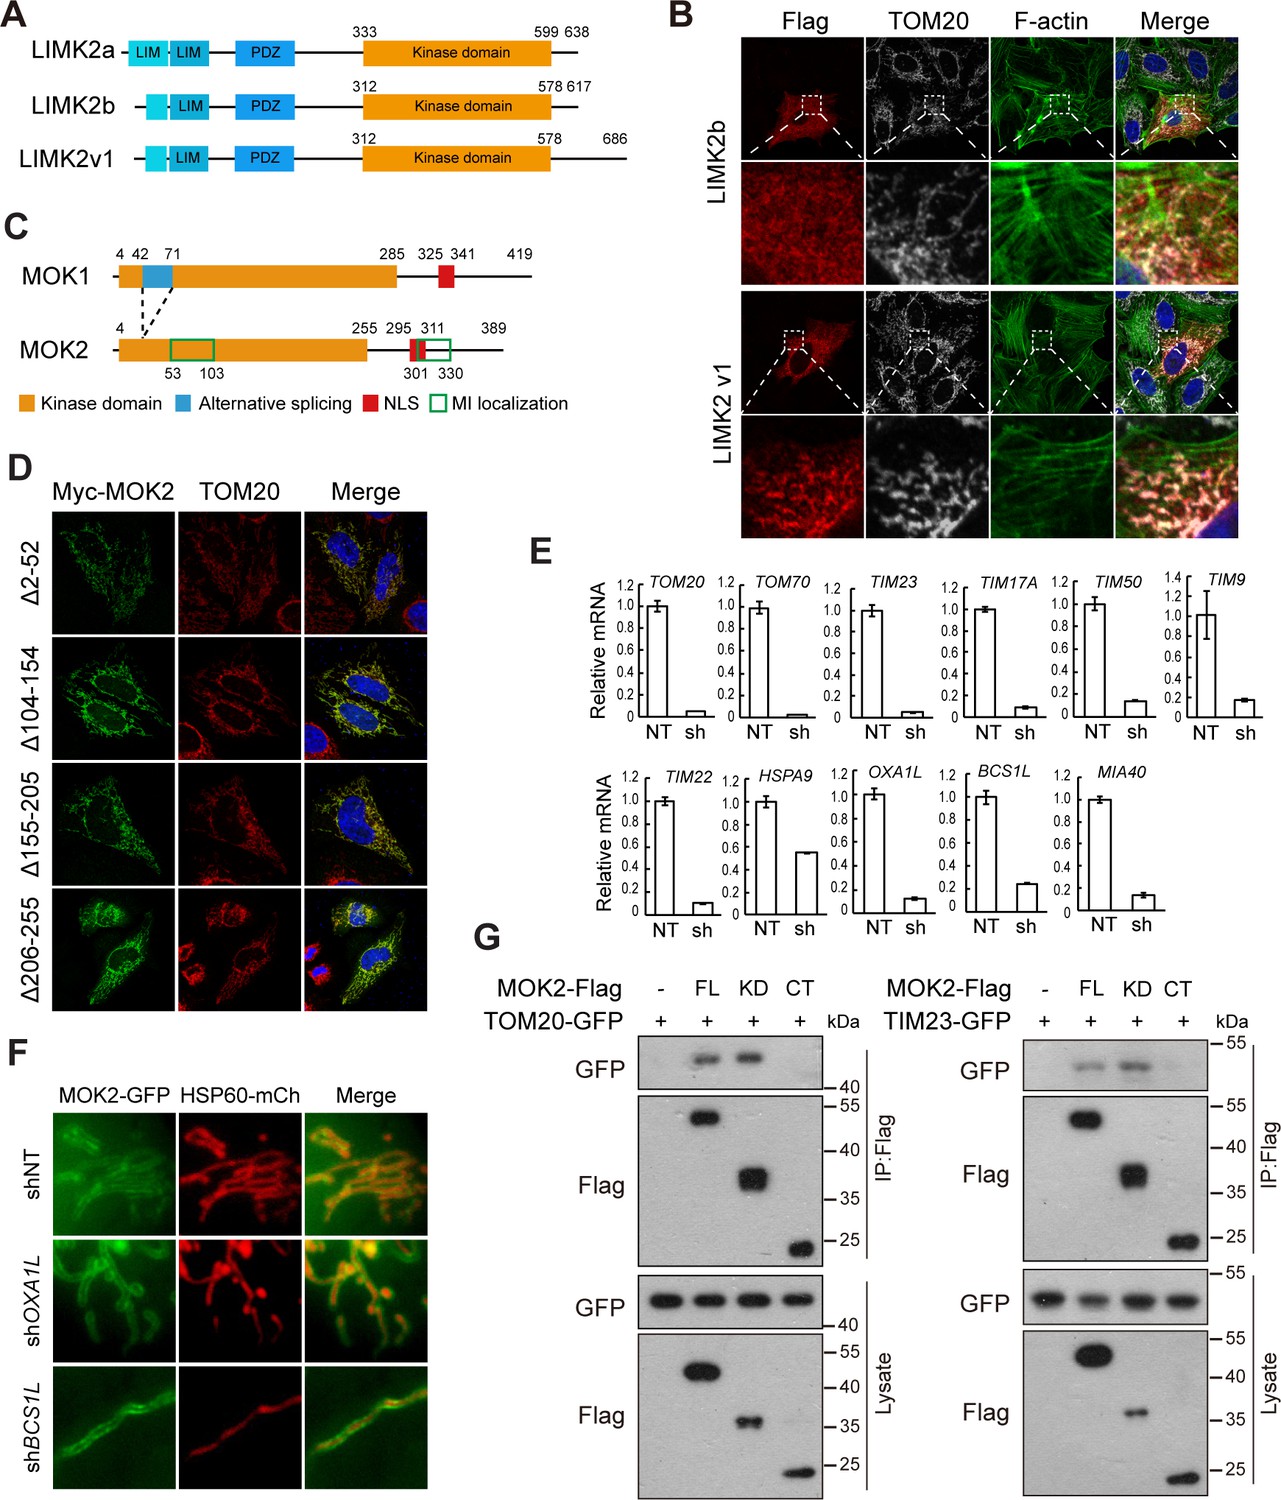
MOK is a mitochondrial intermembrane space (IMS)-localized protein.
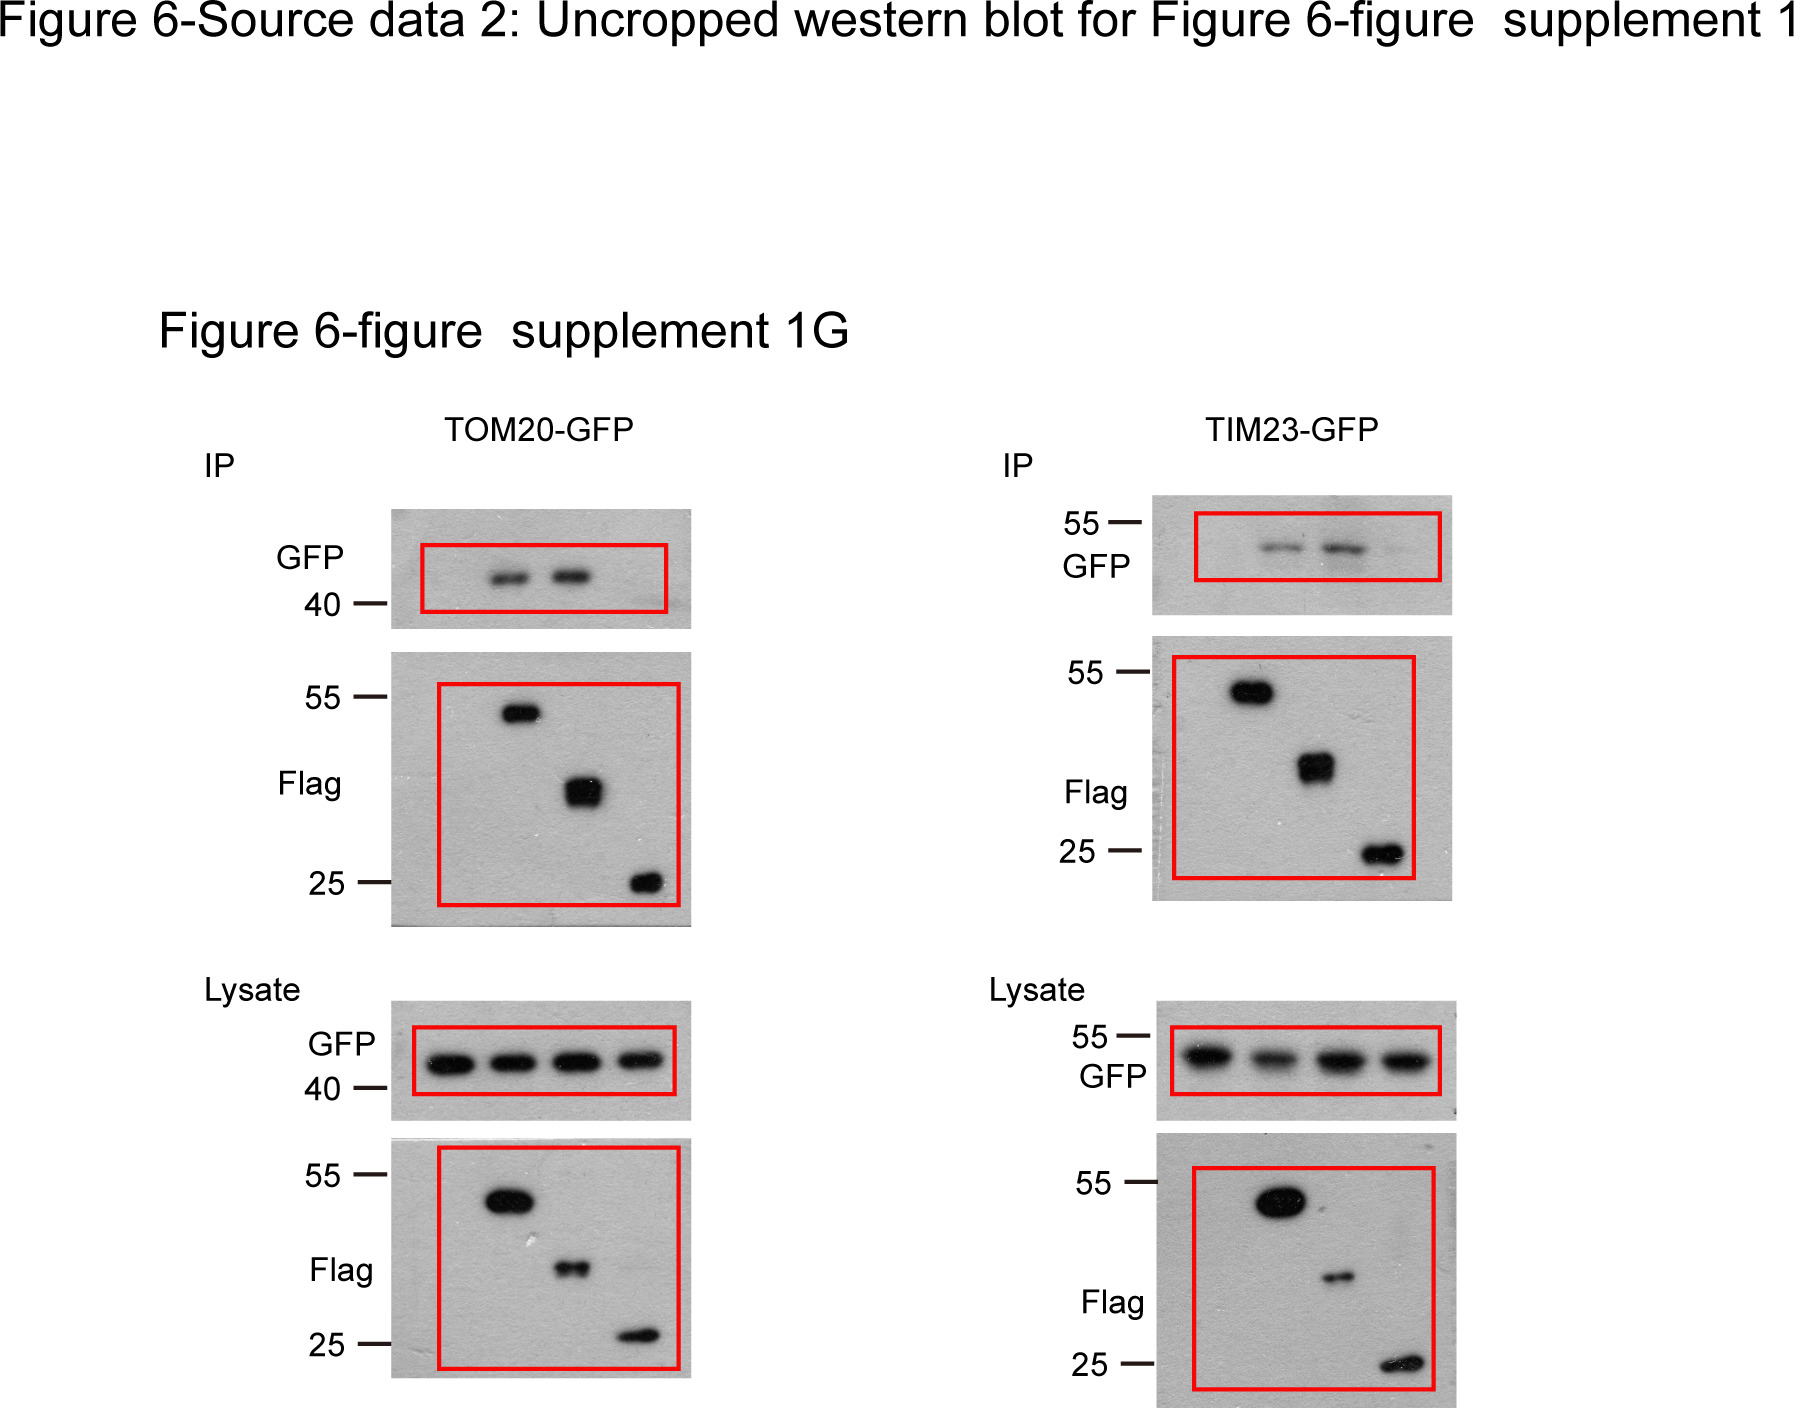
(A) Domain organization of LIMK2 isoforms. (B) Subcellular localization of LIMK2 isoforms. HeLa cells transfected with LIMK2 isoforms were stained with anti-Flag and anti-TOM20 antibodies. F-actin was marked by phalloidin staining. (C) Domain organization of MOK1 and MOK2. NLS: nuclear localization signal. Sequences responsible for mitochondrial localization are marked by green boxes. (D) Subcellular localization of MOK mutants. Transfected HeLa cells were stained with anti-Myc and anti-TOM20 antibodies. (E) Knockdown efficiency of shRNAs were determined by quantitative RT-PCR. NT: non-targeting control. Data is represented as mean ± SD from three technical repeats. (F) Knockdown of OXA1L and BCS1L did not affect MOK2 sub-mitochondrial localization. HeLa cells expressing indicated shRNAs were transfected with MOK2-GFP and HSP60-mCherry. (G) MOK2 interacts with TOM20 and TIM23. HEK293T cells were transfected and lysed for immunoprecipitation by anti-Flag resin. FL: full-length; KD: kinase domain; CT: C-terminus.
-
Figure 6—figure supplement 1—source data 1
Uncropped western blot for Figure 6—figure supplement 1.
- https://cdn.elifesciences.org/articles/64943/elife-64943-fig6-figsupp1-data1-v2.jpg
Figure 7 with 1 supplement

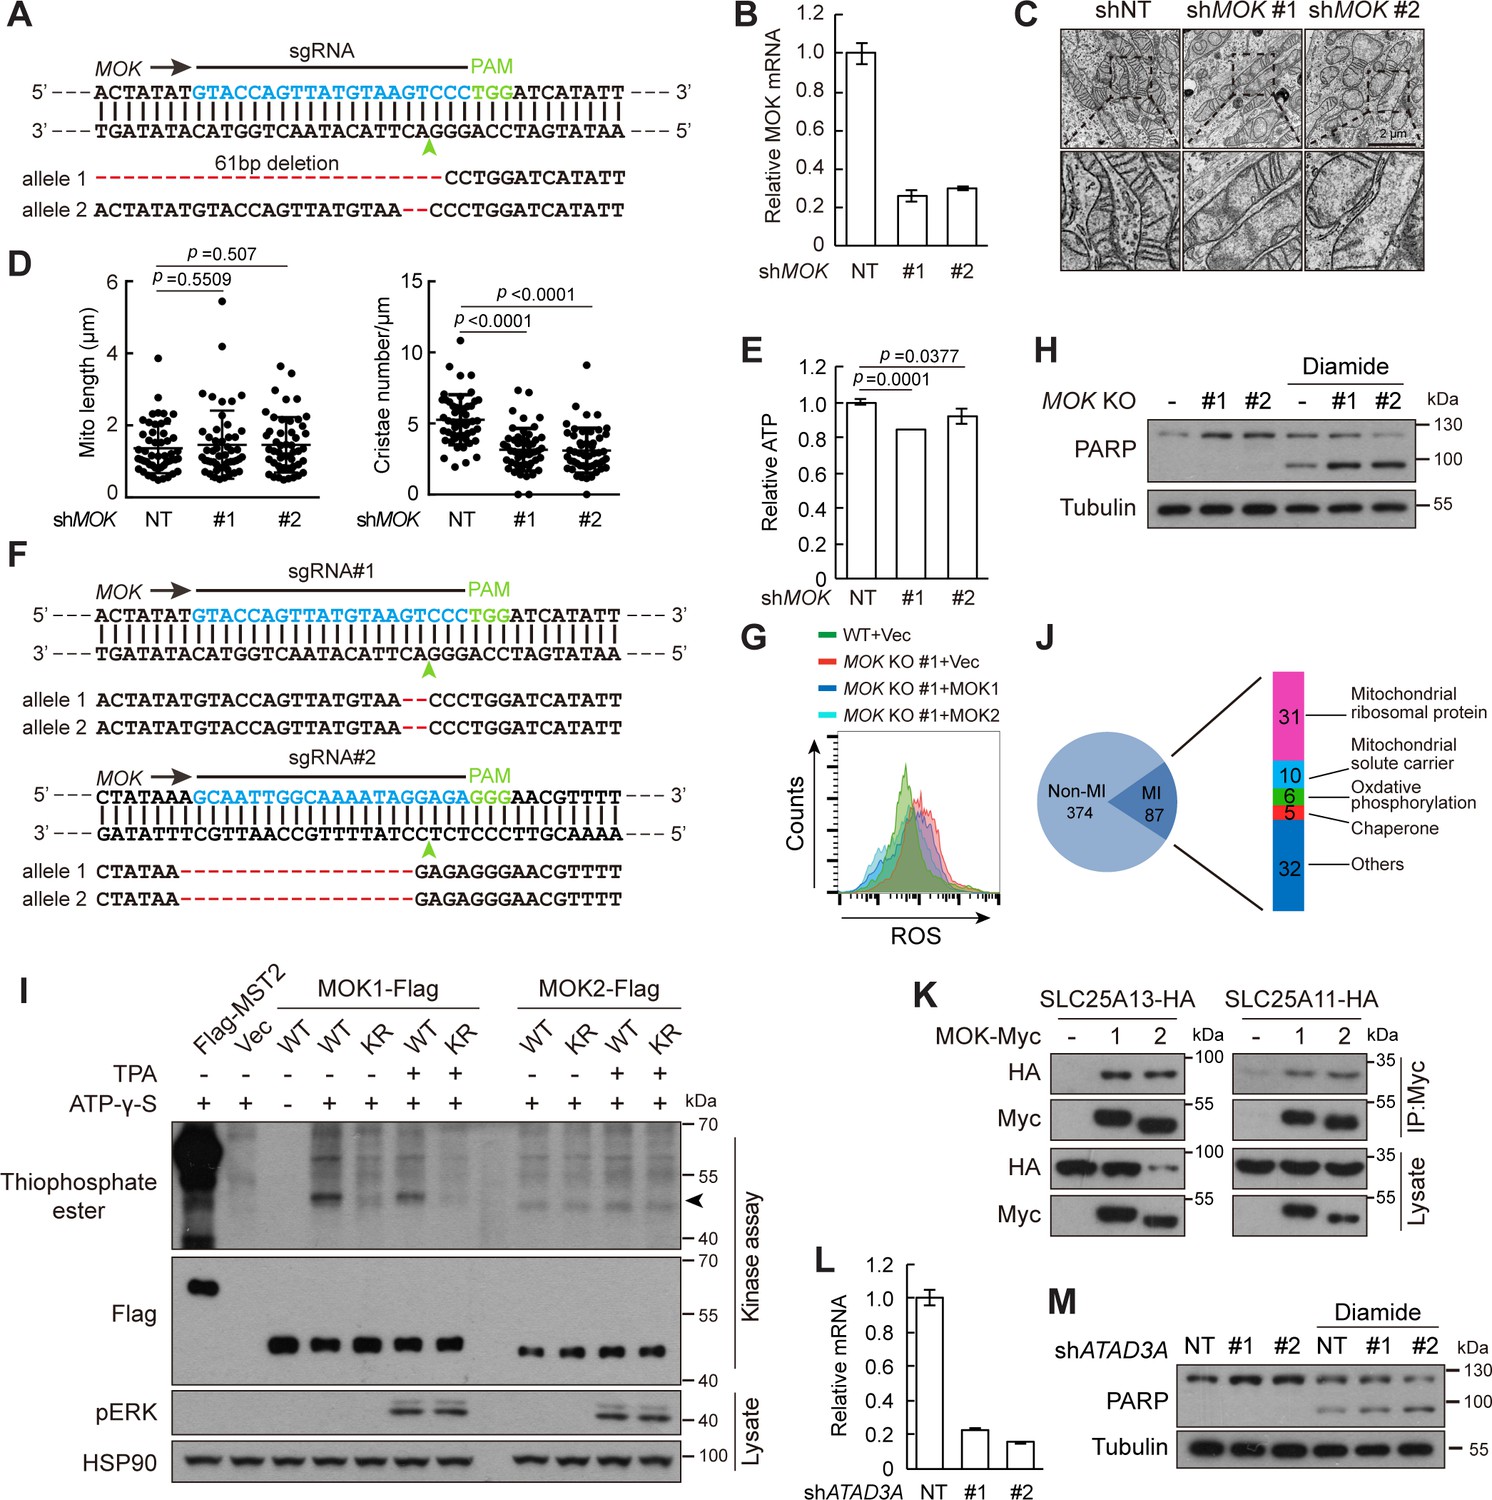
Knockout (KO) of MOK impairs mitochondrial structure and functions.
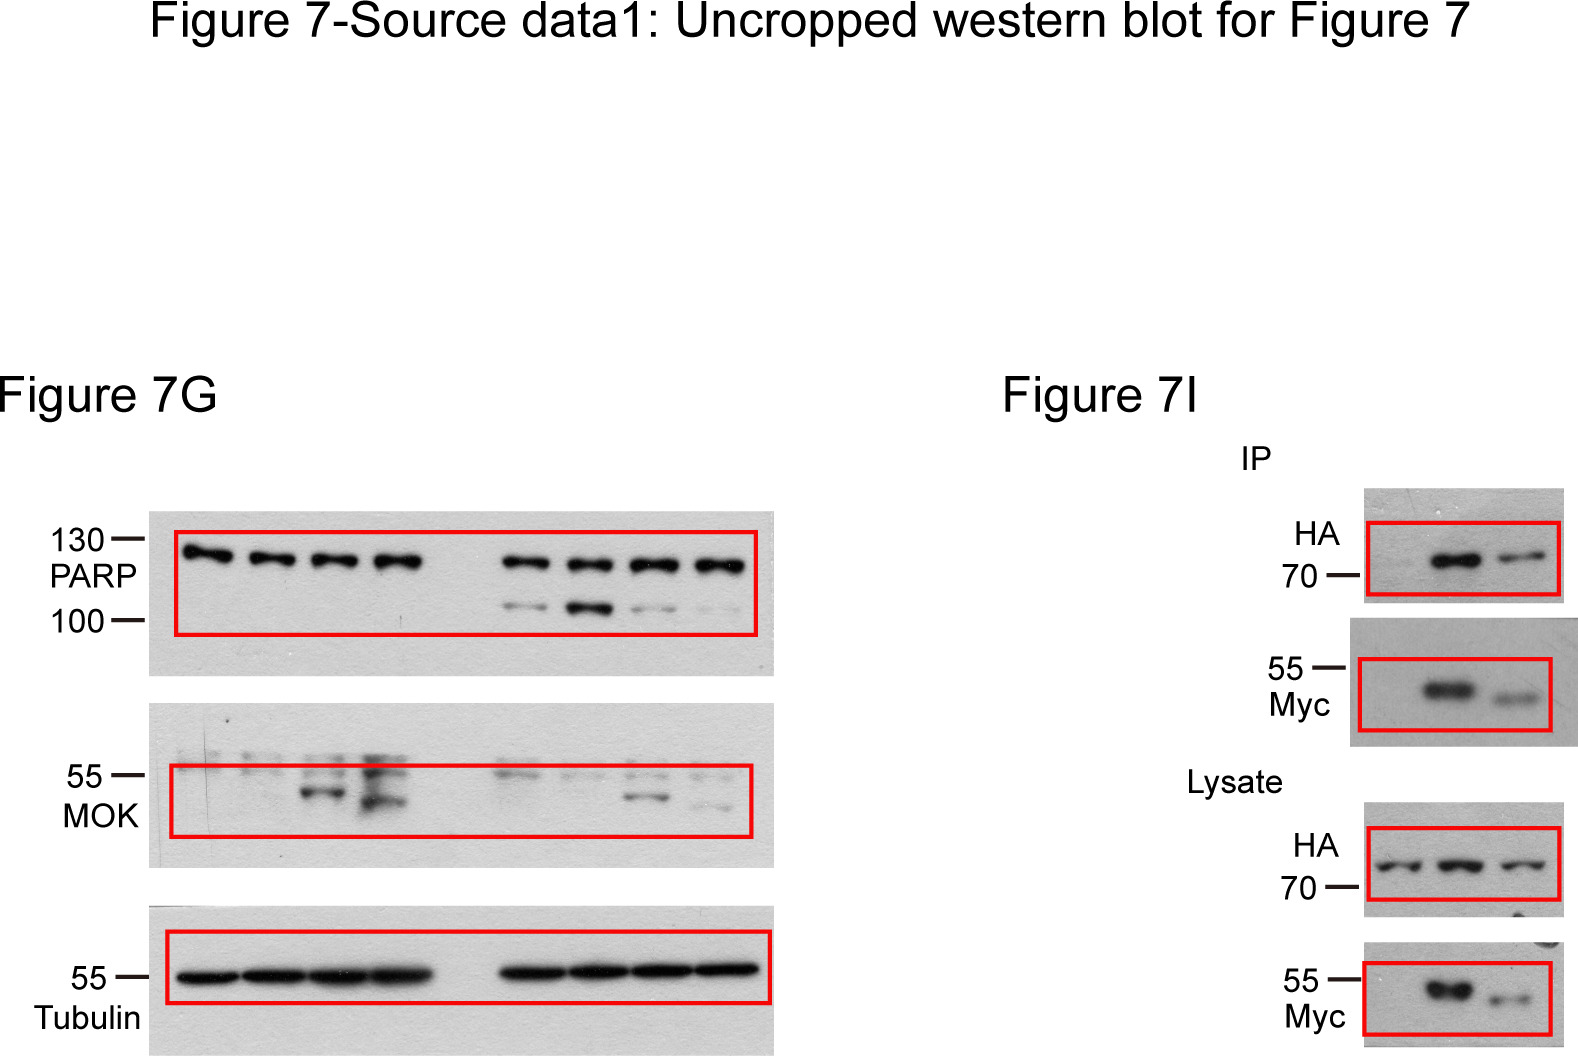
(A, B) MOK KO reduced mitochondria cristae. Indicated A375 cells were examined by electron microscopy (A). The length and cristae number of mitochondria (n = 30) were quantified (B). (C, D) MOK KO impairs mitochondrial respiration. Cells sequentially exposed to mitochondrial inhibitors were analyzed on a Seahorse Analyzer. Oxygen consumption rate (OCR) was measured and normalized to protein concentration (C). Respiratory parameters were calculated from OCR data as described in the Materials and methods section (D). Data is representative and represented as mean ± SD, n = 3, two-tailed Student’s t test. (E) MOK KO reduced cellular ATP level. Data is representative and represented as mean ± SD, n = 3, two-tailed Student’s t test. (F) MOK KO increased cellular reactive oxygen species (ROS) level. Cells were stained with CM-H2DCFDA followed by flow cytometry. (G) MOK KO promoted apoptosis in response to oxidative stress. Indicated A375 cells were treated with 200 nM diamide for 20 hr, and cell lysates were analyzed by western blotting. (H) TAP identified MOK2 interacting proteins in mitochondria. MOK2-Flag-SBP was expressed in MCF10A cells, purified, and analyzed by silver staining after electrophoresis (left). Arrowhead denotes MOK. Top hits from mass spectrometry are shown (right). (I) MOK interacts with ATAD3A. HEK293T cells were transfected and cell lysates were immunoprecipitated with anti-Myc antibody. (J, K) Knockdown of ATAD3A reduced mitochondrial cristae number. Experiments were similar to these in (A, B). Data is representative and represented as mean ± SD, n = 30, two-tailed Student’s t test (Figure 7—figure supplement 1).
-
Figure 7—source data 1
Uncropped western blot for Figure 7.
- https://cdn.elifesciences.org/articles/64943/elife-64943-fig7-data1-v2.jpg
-
Figure 7—source data 2
Raw data for Figure 7 and Figure 7—figure supplement 1.
- https://cdn.elifesciences.org/articles/64943/elife-64943-fig7-data2-v2.xlsx
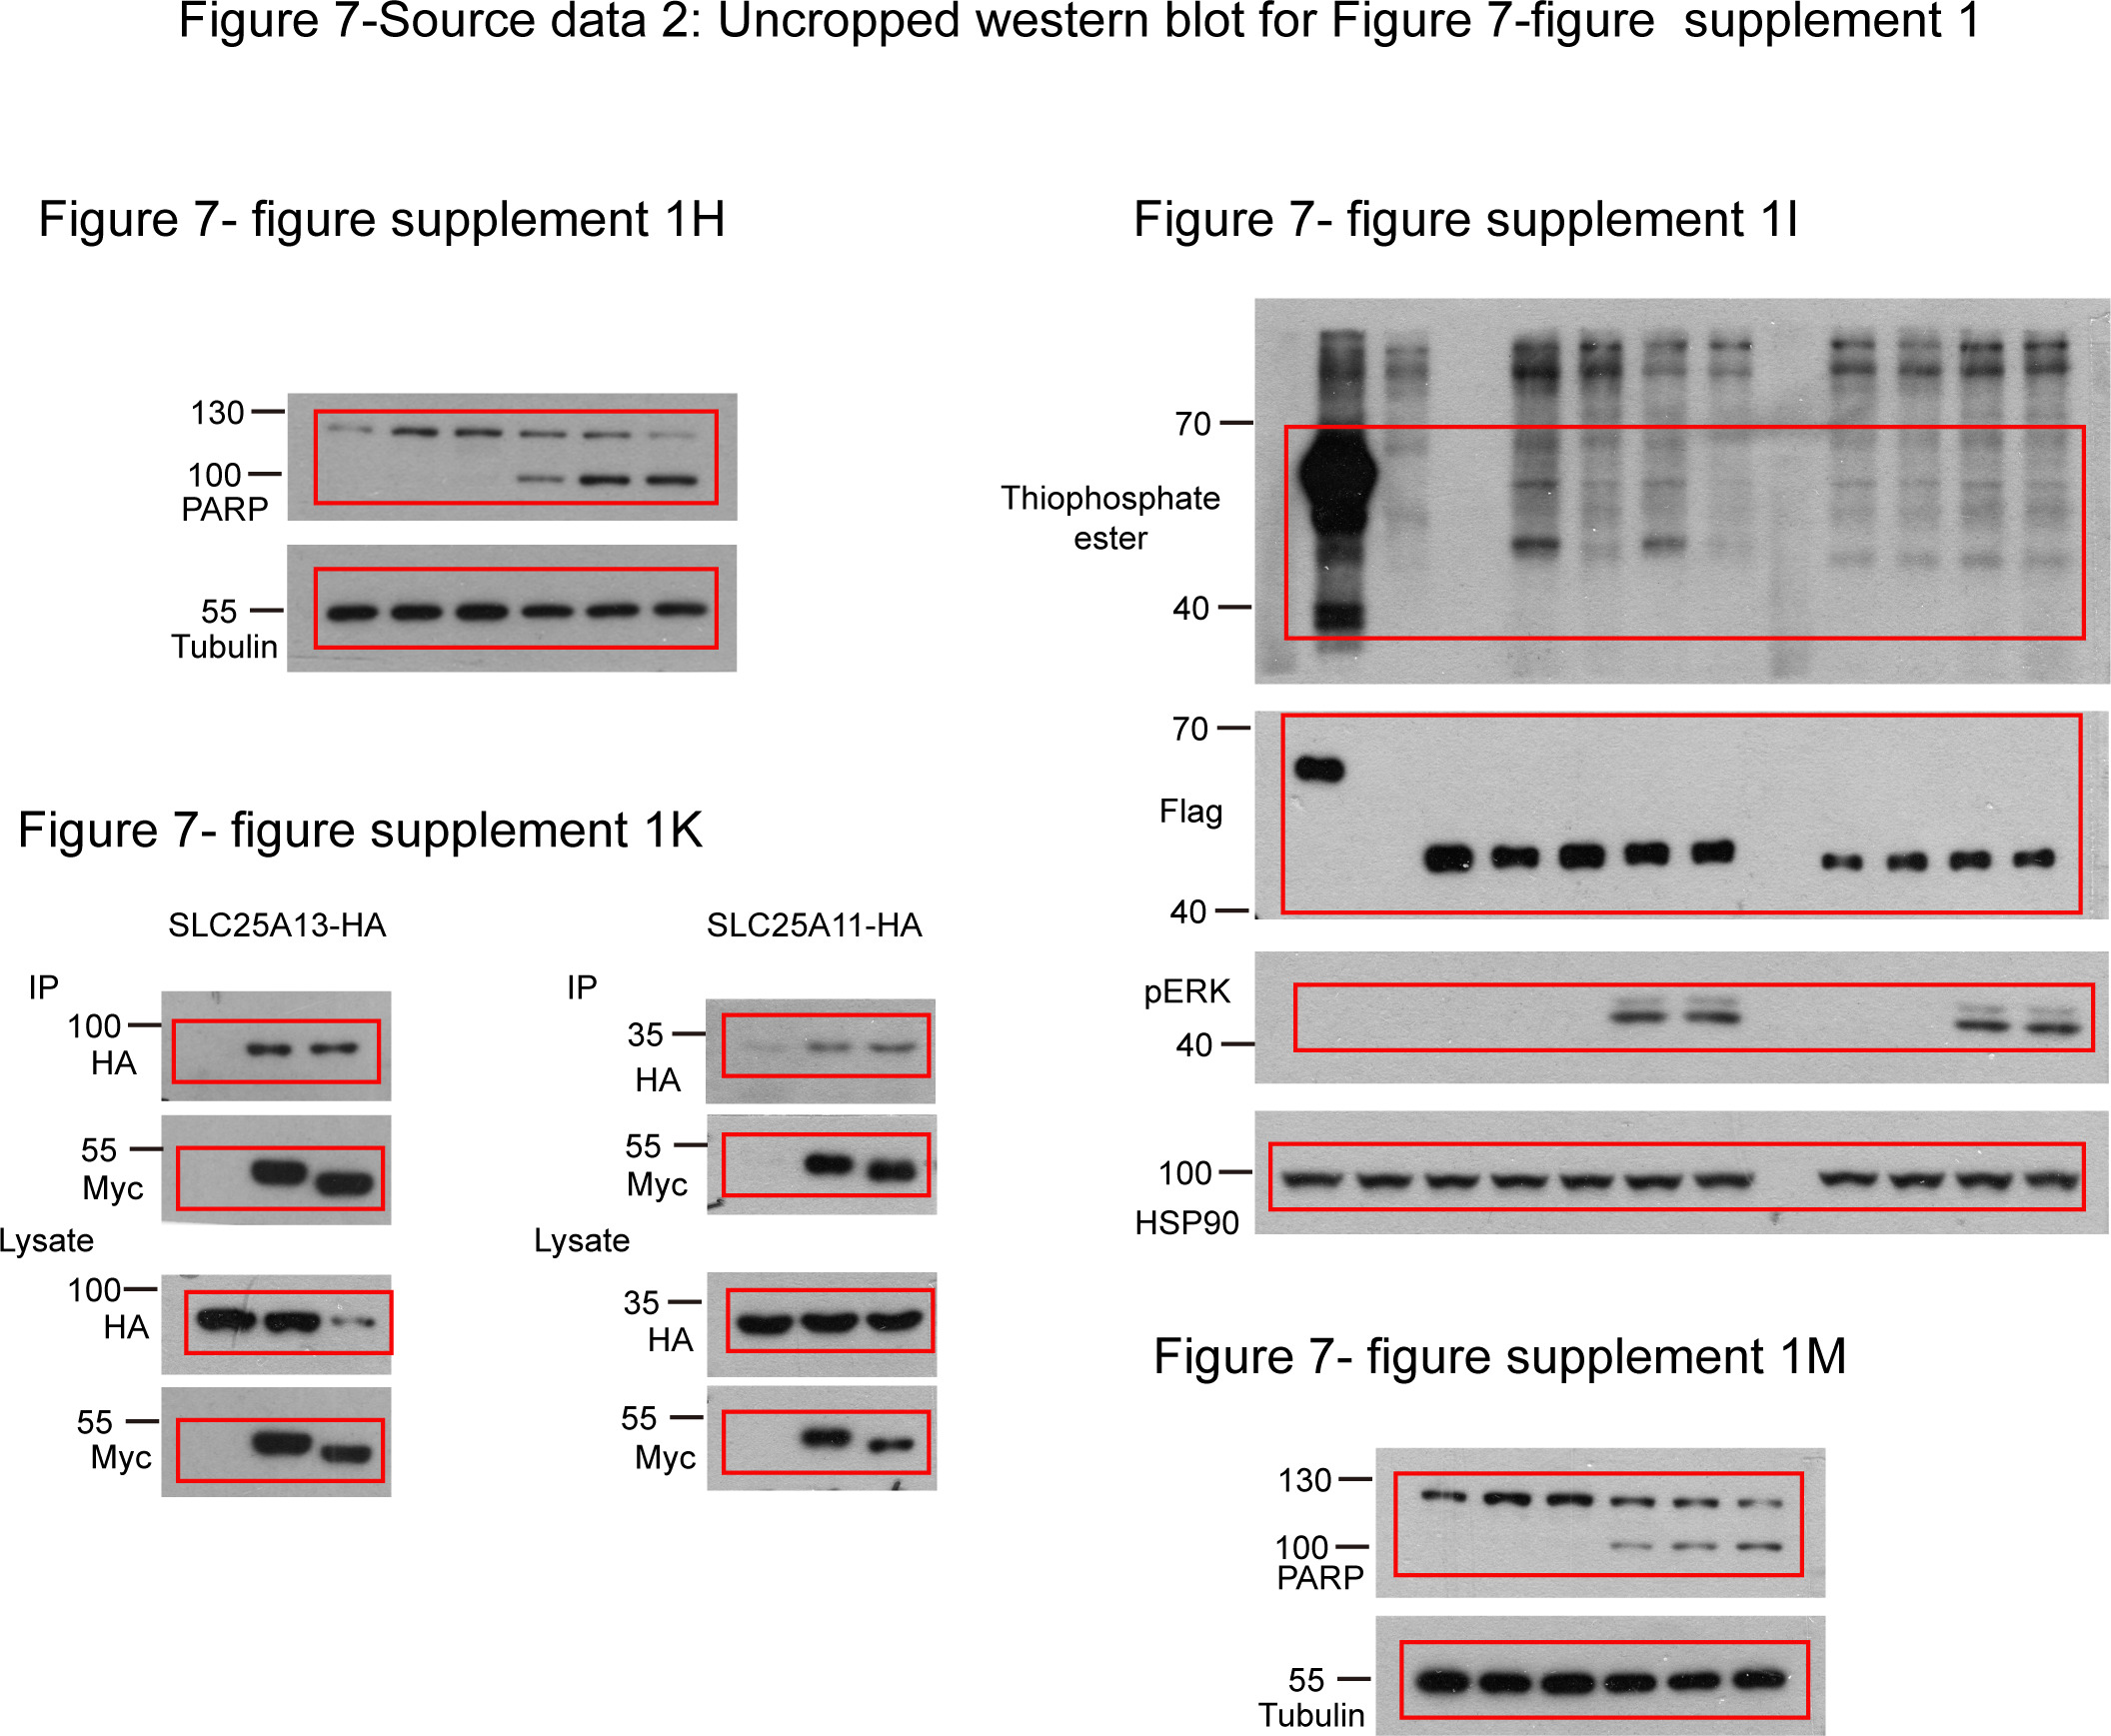
Figure 7—figure supplement 1
Knockout of MOK impairs mitochondrial structure and functions.
(A) Confirmation of MOK knockout in A375 cells by genomic DNA sequencing. Indels are labeled in red. Arrowhead indicates predicted Cas9 cutting site. (B) MOK knockdown efficiency in Caki-1 cells as determined by quantitative RT-PCR. (C, D) Knockdown of MOK reduced mitochondria cristae in Caki-1 cells. The length and cristae number of mitochondria (n = 50) were quantified. Data is represented as mean ± SD, two-tailed Student’s t test. (E) Knockdown of MOK in Caki-1 cells reduced cellular ATP level. Data is represented as mean ± SD. n = 3 repeats, two-tailed Student’s t test. (F) Confirmation of MOK knockout in MCF10A cells by genomic DNA sequencing. (G) Knockout of MOK increased cellular reactive oxygen species (ROS) level. Cells were treated with 150 mM H2O2 for 15 min and analyzed by flow cytometry. (H) Knockout of MOK promoted apoptosis in response to oxidative stress. Indicated cells were treated with 200 nM diamide for 20 hr, and cell lysates were analyzed by western blotting. (I) MOK2 lacks kinase activity. MOK was immunoprecipitated from transfected HEK293T cells and subjected to in vitro kinase activity assay. Phosphorylation was detected by anti-thiophosphate-ester antibody. Arrowhead denotes MOK autophosphorylation. To activate MAPK signaling, cells were treated with 100 ng/ml tetradecanoyl phorbol acetate (TPA) for 30 min. Flag-MST2 was used as a positive control. KR denotes a kinase inactive mutant generated by mutating the ATP binding Lys to Arg. (J) Distribution of MOK-interacting proteins identified from TAP purification. (K) MOK interacts with SLC25A13 and SLC25A11. HEK293T cells were transfected and cell lysates were immunoprecipitated by anti-Myc antibody. (L) ATAD3A knockdown efficiency in A375 cells as determined by quantitative RT-PCR. (M) Knockdown of ATAD3A did not promote A375 apoptosis in response to oxidative stress. Indicated cells were treated with 200 nM diamide for 20 hr, and cell lysates were analyzed by western blotting.
-
Figure 7—figure supplement 1—source data 1
Uncropped western blot for Figure 7—figure supplement 1.
- https://cdn.elifesciences.org/articles/64943/elife-64943-fig7-figsupp1-data1-v2.jpg
-
Figure 7—figure supplement 1—source data 2
Raw data for Figure 7—figure supplement 1J.
- https://cdn.elifesciences.org/articles/64943/elife-64943-fig7-figsupp1-data2-v2.xlsx
Author response image 1
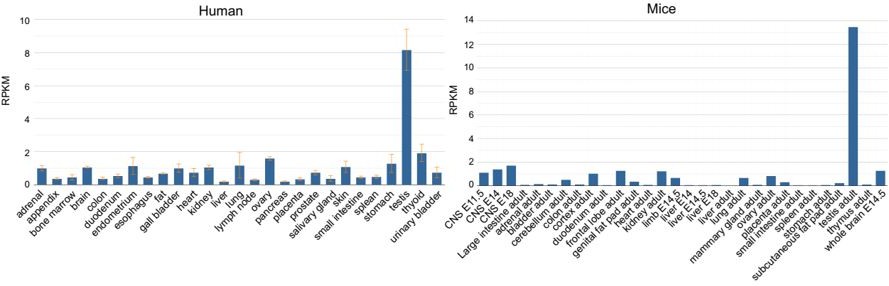
Expression of MOK in human and mouse tissues.
Data was analyzed from the HPA RNA-seq normal tissues project (human) and the Mouse ENCODE transcriptome data.
Author response image 2

Expression of MOK in human cancers in TCGA database as analyzed by FireBrowse (http://firebrowse.org/).
Tables
Appendix 1—key resources table
| Reagent type (species) or resource | Designation | Source or reference | Identifiers | Additional information |
|---|---|---|---|---|
| Gene (Homo sapiens) | Human kinome cDNA | Center for Cancer Systems Biology of Harvard University | hORFeome v3.1 | |
| Gene (Homo sapiens) | Human kinome cDNA | Thermo Fisher | Ultimate ORF Clone LITE Collection | |
| Cell line (Homo sapiens) | HeLa | ATCC | Cat# CCL-2, RRID:CVCL_0030 | |
| Cell line (Homo sapiens) | HEK293T | ATCC | Cat# CRL-11268, RRID:CVCL_1926 | |
| Cell line (Homo sapiens) | A375 | ATCC | Cat# CRL-1619, RRID:CVCL_0132 | |
| Cell line (Homo sapiens) | DU 145 | ATCC | Cat# HTB-81, RRID:CVCL_0105 | |
| Cell line (Homo sapiens) | MCF10A | ATCC | Cat# CRL-10317, RRID:CVCL_0598 | |
| Cell line (Homo sapiens) | Caki-1 | Liping Xie (Zhejiang University) | ||
| Cell line (Cercopithecus aethiops) | COS-7 | ATCC | Cat# CRL-1651, RRID:CVCL_0224 | |
| Transfected construct (Homo sapiens) | siNT | This paper | Control siRNA target sequence: UUCUCCGAACGUGUCA CGU | |
| Transfected construct (Homo sapiens) | siMOK#1 | This paper | siRNA target sequence: CCUCUUUCCUGGAGUA AAU | |
| Transfected construct (Homo sapiens) | siMOK#2 | This paper | siRNA target sequence: AGUCGAGAGCUAUGAA UUU | |
| Transfected construct (Homo sapiens) | shNT | This paper | Control shRNA target sequence: CCTAAGGTTAAGTCGCCCTCG | |
| Transfected construct (Homo sapiens) | sh-TOM20 | This paper | shRNA target sequence: GGCGTAGACCATCTGACAAAT | |
| Transfected construct (Homo sapiens) | sh-TOM70 | This paper | shRNA target sequence: GCATGCTGTTAGCCGATAAAG | |
| Transfected construct (Homo sapiens) | sh-TIM17A | This paper | shRNA target sequence: GCTGGTATCTTGTTGACAAGA | |
| Transfected construct (Homo sapiens) | sh-TIM50 | This paper | shRNA target sequence: CCTCAAGACCATTGCACTGAA | |
| Transfected construct (Homo sapiens) | sh-TIM23 | This paper | shRNA target sequence: CCAGCCTCTATGCACTATATA | |
| Transfected construct (Homo sapiens) | sh-HSPA9 | This paper | shRNA target sequence: CGTGCTCAATTTGAAGGGATT | |
| Transfected construct (Homo sapiens) | sh-HSP60 | This paper | shRNA target sequence: CCTGCTCTTGAAATTGCCAAT | |
| Transfected construct (Homo sapiens) | sh-MIA40 | This paper | shRNA target sequence: TCTTGACATCTTGACATATAC | |
| Transfected construct (Homo sapiens) | sh-TIM9 | This paper | shRNA target sequence: GCTTGGTCACTTGATTAGAAA | |
| Transfected construct (Homo sapiens) | sh-TIM22 | This paper | shRNA target sequence: GCTTTGACCCTAAGGATCCTT | |
| Transfected construct (Homo sapiens) | sh-OXA1L | This paper | shRNA target sequence: CGAATCAGAGAGGCCAAGTTA | |
| Transfected construct (Homo sapiens) | sh-BCS1L | This paper | shRNA target sequence: CGTCCAGGAATTCATCGATAA | |
| Transfected construct (Homo sapiens) | sh-MOK #1 | This paper | shRNA target sequence: CTGGTTCTCTTGCAC TAATAT | |
| Transfected construct (Homo sapiens) | sh-MOK #2 | This paper | shRNA target sequence: ACCTCTACTAACAACCAATTT | |
| Transfected construct (Homo sapiens) | sh-ATAD3A #1 | This paper | shRNA target sequence: CATCAATGAGATGGTCCACTT | |
| Transfected construct (Homo sapiens) | sh-ATAD3A #2 | This paper | shRNA target sequence: CAAGGACAAATGGAGCAACTT | |
| Transfected construct (Homo sapiens) | sg-MOK KO #1 | This paper | PEP-KO with gRNA sequence: GTACCAGTTATGTAAGTCCC | |
| Transfected construct (Homo sapiens) | sg-MOK KO #2 | This paper | PEP-KO with gRNA sequence: GCAATTGGCAAAATAGGAGA | |
| Transfected construct (Homo sapiens) | sg-BMP2K KI #1 | This paper | PEP-KI with gRNA sequence: GAAATGGAGCAGCACCAAAT | |
| Transfected construct (Homo sapiens) | sg-BMP2K KI #2 | This paper | PEP-KI with gRNA sequence: TAAACAGTAGATACTTCTGA | |
| Transfected construct (Homo sapiens) | sg-MOK KI #1 | This paper | PEP-KI with gRNA sequence: TCTTCCGCCTTTCCGCACTA | |
| Transfected construct (Homo sapiens) | sg-MOK KI #2 | This paper | PEP-KI with gRNA sequence: CACCGTCGTCTCGACTTCGG | |
| Antibody | Mouse monoclonal anti-alpha 1 Sodium Potassium ATPase antibody | Abcam | Cat# ab7671, RRID:AB_306023 | WB (1:2000) |
| Antibody | Mouse monoclonal anti-GM130 antibody | BD Biosciences | Cat# 610823, RRID:AB_398142 | IF (1:1000) |
| Antibody | Rabbit polyclonal anti-UTP25 antibody | Dr. Jinrong Peng (Zhejiang University) | IF (1:200) | |
| Antibody | Rabbit polyclonal anti-Lamin A/C (H-110) antibody | Santa Cruz Biotechnology | Cat# sc-20681, RRID:AB_648154 | WB (1:2000) |
| Antibody | Mouse monoclonal anti-Lamin A/C (636) antibody | Santa Cruz Biotechnology | Cat# sc-7292, RRID:AB_627875 | IF (1:1000) |
| Antibody | Rabbit monoclonal anti-Catalase (D4P7B) antibody | Cell Signaling Technology | Cat# 12980, RRID:AB_2798079 | IF (1:100) |
| Antibody | Rabbit polyclonal anti-Pericentrin antibody | Covance | Cat# PRB-432C-200, RRID:AB_291635 | IF (1:500) |
| Antibody | Rabbit monoclonal anti-EEA1 (C45B10) antibody | Cell Signaling Technology | Cat# 3288, RRID:AB_2096811 | IF (1:100) |
| Antibody | Rabbit monoclonal anti-TOM20 (F-10) antibody | Santa Cruz Biotechnology | Cat# sc-17764, RRID:AB_628381 | IF (1:1000) |
| Antibody | Mouse polyclonal anti-TOM20 (FL-145) antibody | Santa Cruz Biotechnology | Cat# sc-11415, RRID:AB_2207533 | IF (1:1000) |
| Antibody | Rabbit monoclonal anti-HSP60 (D6F1) antibody | Cell Signaling Technology | Cat# 46611, RRID:AB_2799305 | WB (1:1000), IF (1:500) |
| Antibody | Mouse monoclonal anti-ENDOG (B-2) antibody | Santa Cruz Biotechnology | Cat# sc-365359, RRID:AB_10843802 | WB (1:2000) |
| Antibody | Mouse monoclonal anti-MT-CO2 antibody | Abcam | Cat# ab110258, RRID:AB_10887758 | WB (1:2000) |
| Antibody | Mouse monoclonal anti-LAMP1 antibody | Santa Cruz Biotechnology | Cat# sc-20011, RRID:AB_626853 | IF (1:500) |
| Antibody | Mouse monoclonal anti-HSP90 antibody | BD Biosciences | Cat# 610418, RRID:AB_397798 | WB (1:5000) |
| Antibody | Rabbit monoclonal anti-pErk1/2 (Thr202/Tyr204) antibody | Cell Signaling Technology | Cat# 4370, RRID:AB_2315112 | WB (1:2000) |
| Antibody | Rabbit monoclonal anti-Thiophosphate ester antibody | Abcam | Cat# ab133473, RRID:AB_2737094 | WB (1:5000) |
| Antibody | Rabbit monoclonal anti-PARP (46D11) antibody | Cell Signaling Technology | Cat# 9532, RRID:AB_659884 | WB (1:2000) |
| Antibody | Rabbit polyclonal anti-RPS6KA6 antibody | Sigma-Aldrich | Cat# HPA002852, RRID:AB_1079854 | IF (1:100) |
| Antibody | Rabbit polyclonal anti-MOK antibody | Sigma-Aldrich | Cat# HPA027292, RRID:AB_10600989 | WB (1:1000) |
| Antibody | Mouse monoclonal ANTI-FLAG M2 antibody | Sigma-Aldrich | Cat# F3165, RRID:AB_259529 | IF (1:1000) |
| Antibody | Rabbit monoclonal anti-DYKDDDDK Tag (D6W5B) antibody | Cell Signaling Technology | Cat# 14793, RRID:AB_2572291 | IF (1:500) |
| Antibody | Mouse monoclonal anti-Flag M2-Peroxidase-HRP conjugated antibody | Sigma-Aldrich | Cat# A8592, RRID:AB_439702 | WB (1:5000) |
| Antibody | Rabbit monoclonal anti-HA-Tag (C29F4) antibody | Cell Signaling Technology | Cat# 3724, RRID:AB_1549585 | IF (1:500) |
| Antibody | Mouse monoclonal anti-Myc-Tag (9B11) antibody | Cell Signaling Technology | Cat# 2276, RRID:AB_331783 | IF (1:500) |
| Antibody | Rabbit polyclonal anti-GFP antibody | Abcam | Cat# ab6556, RRID:AB_305564 | WB (1:2000) |
| Antibody | Mouse monoclonal anti-β-actin antibody | Proteintech | Cat# 66009–1-Ig, RRID:AB_2687938 | WB (1:5000) |
| Antibody | Mouse monoclonal anti-Tubulin (clone B5-1-2) antibody | Sigma-Aldrich | Cat# T6074, RRID:AB_477582 | WB (1:5000), IF (1:1000) |
| Antibody | Mouse monoclonal anti- γ-Tubulin (clone GTU88) antibody | Sigma-Aldrich | Cat# T5326, RRID:AB_532292 | IF (1:500) |
| Antibody | Goat polyclonal anti-Rabbit IgG(H + L)-Alexa Fluor 488 conjugated antibody | Thermo Fisher Scientific | Cat# A-11034, RRID:AB_2576217 | IF (1:1000) |
| Antibody | Goat polyclonal anti-Mouse IgG(H + L)-Alexa Fluor 488 conjugated antibody | Thermo Fisher Scientific | Cat# A-11029, RRID:AB_2534088 | IF (1:1000) |
| Antibody | Goat polyclonal anti-Rabbit IgG(H + L)-Alexa Fluor 594 conjugated antibody | Thermo Fisher Scientific | Cat# A-11037, RRID:AB_2534095 | IF (1:1000) |
| Antibody | Goat polyclonal anti-Mouse IgG(H + L)-Alexa Fluor 594 conjugated antibody | Thermo Fisher Scientific | Cat# A-11032, RRID:AB_2534091 | IF (1:1000) |
| Antibody | Goat polyclonal anti-Rabbit IgG(H + L)-Alexa Fluor 647 conjugated antibody | Thermo Fisher Scientific | Cat# A-21244, RRID:AB_2535812 | IF (1:1000) |
| Sequence-based reagent | TOM20 RT-F | This paper | AGGGCGTAGACCATCTGACA | |
| Sequence-based reagent | TOM20 RT-R | This paper | TTCAGCCAAGCTCTGAGCAC | |
| Sequence-based reagent | TOM70 RT-F | This paper | AGACGTGCAAAAGCCCATGA | |
| Sequence-based reagent | TOM70 RT-R | This paper | AAGCATGGGCTGGGAAATGA | |
| Sequence-based reagent | TIM17A RT-F | This paper | GGGAGGGCTGTTTTCCATGA | |
| Sequence-based reagent | TIM17A RT-R | This paper | GGAGGGGTCTTCTGCAAACT | |
| Sequence-based reagent | TIM50 RT-F | This paper | TGCACGAGGTTGGCGA | |
| Sequence-based reagent | TIM50 RT-R | This paper | TGTATGTCCGGCGCAACTG | |
| Sequence-based reagent | TIM23 RT-F | This paper | AGGGGCACTTTGGGCTAATAC | |
| Sequence-based reagent | TIM23 RT-R | This paper | TATCCCTCGAAGACCACCTGT | |
| Sequence-based reagent | HSPA9 RT-F | This paper | CCTACGGCCTGGACAAGAAG | |
| Sequence-based reagent | HSPA9 RT-R | This paper | CTTGTGCTTGCGCTTGAACT | |
| Sequence-based reagent | HSP60 RT-F | This paper | CTTTTAGCCGATGCTGTGGC | |
| Sequence-based reagent | HSP60 RT-R | This paper | TTGGCTATAGAGCGTGCCAG | |
| Sequence-based reagent | MIA40 RT-F | This paper | CTATTGCCGGCAGGAAGGG | |
| Sequence-based reagent | MIA40 RT-R | This paper | GGCATGGGCAGTTCCAGTTA | |
| Sequence-based reagent | TIM9 RT-F | This paper | ACAGAGACCTGCTTTTTGGACT | |
| Sequence-based reagent | TIM9 RT-R | This paper | GCCAGGGCTTCATTCTGCTG | |
| Sequence-based reagent | TIM21 RT-F | This paper | CCTGAGACAGCGGGTTCC | |
| Sequence-based reagent | TIM21 RT-R | This paper | AAGACAAATCCTCCCACGCA | |
| Sequence-based reagent | OXA1L RT-F | This paper | CTCGCAATGGCTTGGGAAAC | |
| Sequence-based reagent | OXA1L RT-R | This paper | CTCAGGTACTGCTGTGGGTG | |
| Sequence-based reagent | BCS1L RT-F | This paper | ATGGCGTCCCTTTGGCTATC | |
| Sequence-based reagent | BCS1L RT-R | This paper | AGTCGGTCATCAGAGAGGCT | |
| Sequence-based reagent | MOK RT-F | This paper | TGAGCTAATACGAGGGAGAAGA | |
| Sequence-based reagent | MOK RT-R | This paper | TACTCCAGGAAAGAGGGGCT | |
| Sequence-based reagent | ATAD3A RT-F | This paper | GCCTCCTGCTCTTTGTGGAT | |
| Sequence-based reagent | ATAD3A RT-R | This paper | AACTGCTCTGGTTGGTTGCT | |
| Sequence-based reagent | ACTB RT-F | This paper | CTCGCCTTTGCCGATCC | |
| Sequence-based reagent | ACTB RT-R | This paper | GAATCCTTCTGACCCATGCC | |
| Commercial assay or kit | Seahorse XF Cell Mito Stress Test Kit | Agilent Technologies | Cat# 103015-100 | |
| Commercial assay or kit | ATP detection kit | Beyotime Biotechnology | Cat# S0026 | |
| Chemical compound, drug | ProLong Gold Antifade Mountant with DAPI | Thermo Fisher Scientific | Cat# P36931 | |
| Chemical compound, drug | Alexa Fluor 488 phalloidin | Thermo Fisher Scientific | Cat# A12379 | IF (1:1000) |
| Chemical compound, drug | MitoTracker Green FM | Thermo Fisher Scientific | Cat# M7514 | |
| Chemical compound, drug | CM-H2DCFDA | Thermo Fisher Scientific | Cat# C6827 | |
| Chemical compound, drug | MitoTracker Red CMXRos | Thermo Fisher Scientific | Cat# M7512 | |
| Chemical compound, drug | Pfu Turbo DNA Polymerase | Agilent Technologies | Cat# 600252-52 | |
| Chemical compound, drug | Streptavidin Resin | Agilent Technologies | Cat# 240105--51 | |
| Chemical compound, drug | 1,6-Hexanediol | Sigma-Aldrich | Cat# 8043081000 | |
| Chemical compound, drug | EDTA-free Protease Inhibitor Cocktail | Sigma-Aldrich | Cat# S8830 | |
| Chemical compound, drug | ANTI-FLAG M2 agarose beads | Sigma-Aldrich | Cat# F2426 | |
| Chemical compound, drug | Polybrene | Sigma-Aldrich | Cat# 107689 | |
| Chemical compound, drug | Diamide | Sigma-Aldrich | Cat# D3648 | |
| Chemical compound, drug | Biotin | Sigma-Aldrich | Cat# B4501 | |
| Chemical compound, drug | Vacuolin-1 | Sigma-Aldrich | Cat# V7139 | |
| Chemical compound, drug | Digitonin | Sangon Biotech | Cat# DG1152 | |
| Chemical compound, drug | ATP-γ-S | Abcam | Cat# ab138911 | |
| Chemical compound, drug | p-Nitrobenzyl mesylate (PNBM) | Abcam | Cat# ab138910 | |
| Software, algorithm | GraphPad Prism | GraphPad | RRID:SCR_002798 | |
| Software, algorithm | Image-Pro Plus 6.0 | Image-Pro Plus | RRID:SCR_016879 | |
| Software, algorithm | VENNY2.1 | https://bioinfogp.cnb.csic.es/tools/venny/index.html | Coverage of the kinome by KA and databases were analyzed by VENNY2.1 | |
| Software, algorithm | KinMap | PMID:28056780 | Kinome Atlas were presented on kinome tree using KinMap The localization and enrichment levels were reflected by colors and sizes of circles | |
| Software, algorithm | SMART | http://smart.embl.de/ | Domain architecture of each kinase is analyzed by SMART | |
| Software, algorithm | IUPred2A | https://iupred2a.elte.hu/ | Intrinsic disorder tendency is predicted by IUPred2A | |
| Software, algorithm | PLAAC | http://plaac.wi.mit.edu/ | Prion-like domains (PrD.like, red) of each kinase are predicted by PLAAC |
Additional files
-
Supplementary file 1
Human kinome and the kinome plasmid library, related to Figure 1A, B, Figure 1—figure supplement 1A, B, and Figure 2A.
- https://cdn.elifesciences.org/articles/64943/elife-64943-supp1-v2.xlsx
-
Supplementary file 2
Summary of the Kinome Atlas, related to Figure 1E–G, Figure 1—figure supplement 1D, and Figure 2—figure supplement 1C.
- https://cdn.elifesciences.org/articles/64943/elife-64943-supp2-v2.xlsx
-
Supplementary file 3
Coverage of the kinome by Kinome Atlas (KA) and databases, related to Figure 2A.
- https://cdn.elifesciences.org/articles/64943/elife-64943-supp3-v2.xlsx
-
Supplementary file 4
Kinome Atlas (KA) in comparison with COMPARTMENTS, related to Figure 2C, D.
- https://cdn.elifesciences.org/articles/64943/elife-64943-supp4-v2.xlsx
-
Supplementary file 5
Kinome Atlas (KA) in comparison with Human Protein Atlas (HPA), related to Figure 2E, F, Figure 2—figure supplement 1D, E.
- https://cdn.elifesciences.org/articles/64943/elife-64943-supp5-v2.xlsx
-
Supplementary file 6
Analysis of kinases uniquely annotated by Kinome Atlas (KA), related to Figure 2G,H and Figure 3.
- https://cdn.elifesciences.org/articles/64943/elife-64943-supp6-v2.xlsx
-
Transparent reporting form
- https://cdn.elifesciences.org/articles/64943/elife-64943-transrepform-v2.docx
Download links
A two-part list of links to download the article, or parts of the article, in various formats.
Downloads (link to download the article as PDF)
Open citations (links to open the citations from this article in various online reference manager services)
Cite this article (links to download the citations from this article in formats compatible with various reference manager tools)
A subcellular map of the human kinome
eLife 10:e64943.
https://doi.org/10.7554/eLife.64943


