Extensive age-dependent loss of antibody diversity in naturally short-lived turquoise killifish
- Max Planck Institute for Biology of Ageing, Germany
- University of Cologne, Germany
Figures
Figure 1 with 3 supplements
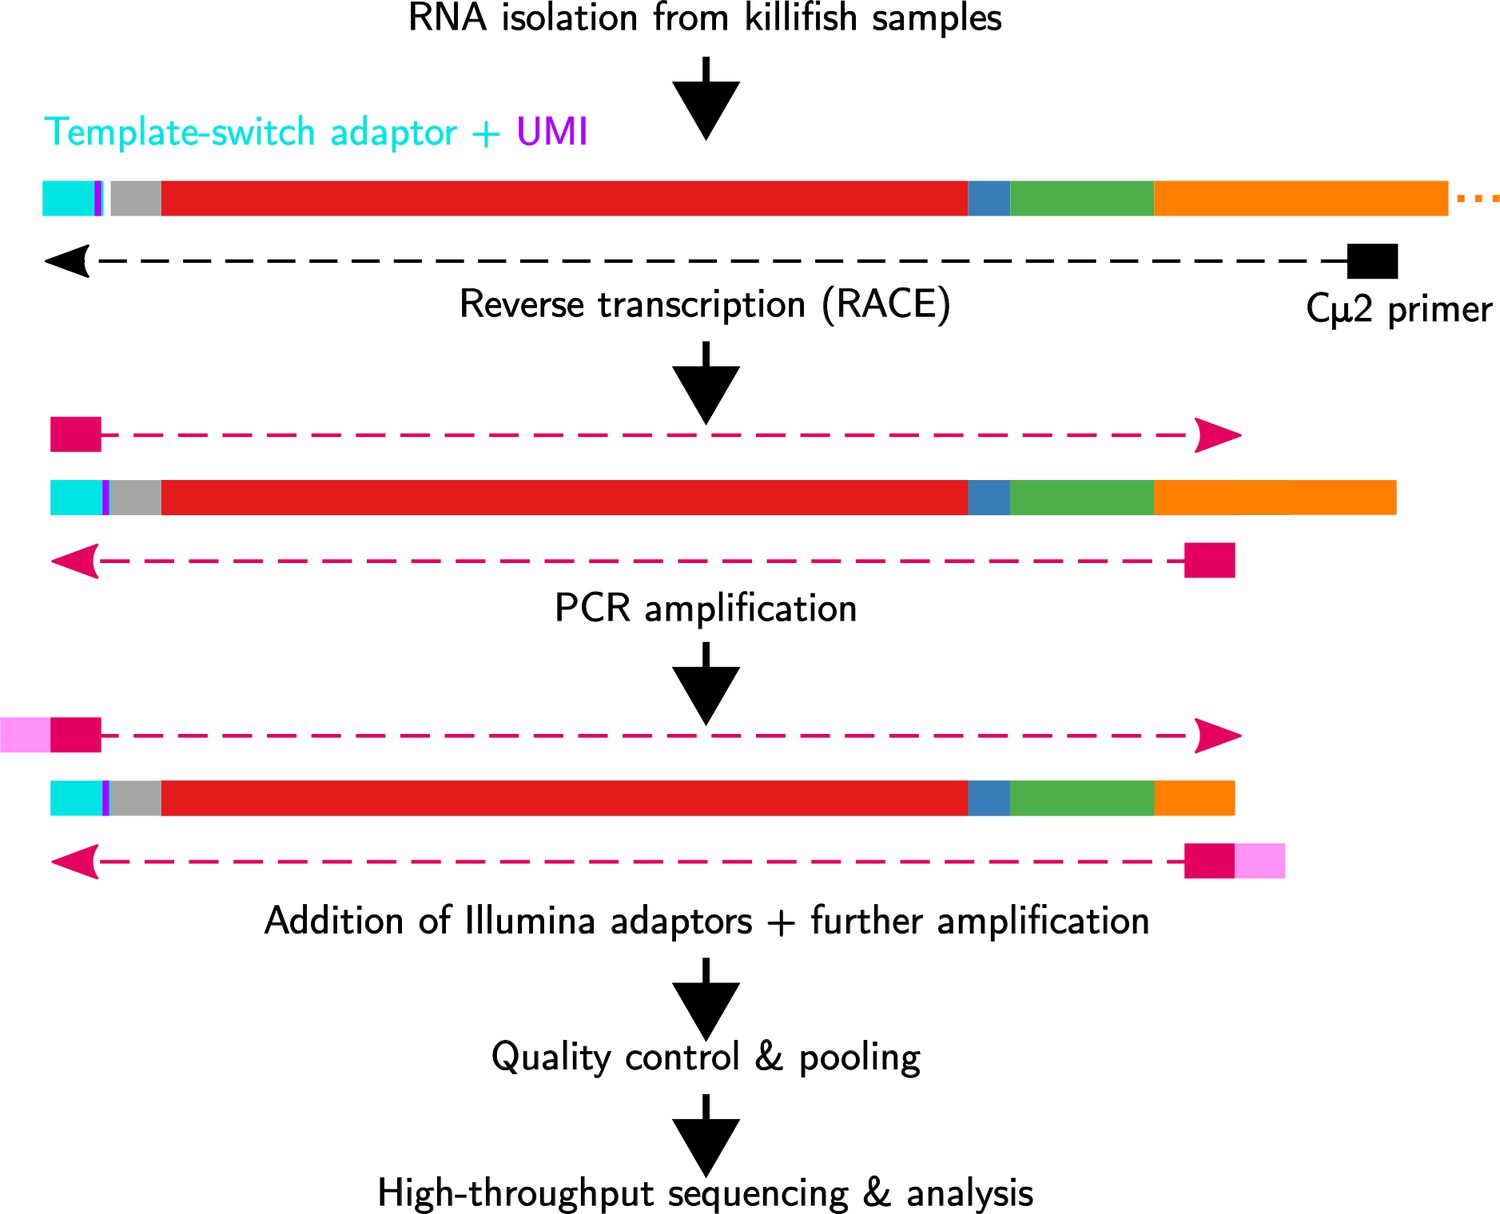
Immunoglobulin sequencing from turquoise-killifish total RNA samples.
Each sample undergoes reverse transcription with template switching to attach a 5' adaptor sequence and unique molecular identifier (UMI), followed by multiple rounds of PCR amplification and addition of Illumina sequencing adaptors. Libraries are then pooled, undergo size selection, and are sequenced on an Illumina MiSeq sequencing machine.
Figure 1—figure supplement 1
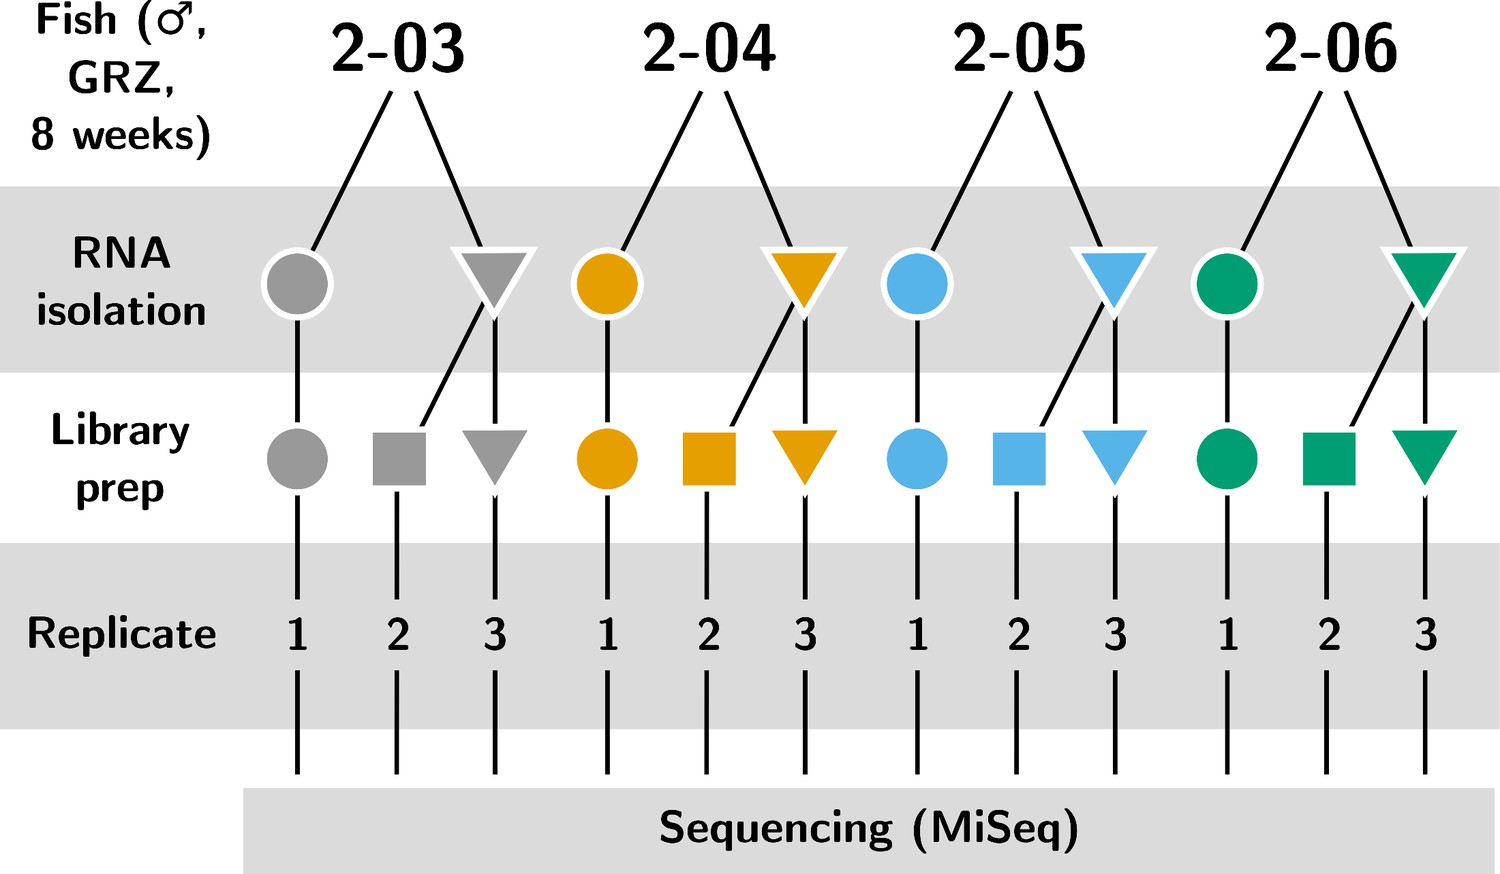
Experimental design of the IgSeq pilot experiment in the turquoise killifish.
Four individuals from the 8-week-old group in Supplementary file 2c were each independently sequenced three times: once from a separate whole-body total RNA sample (replicate 1) and twice independently from a second sample (replicates 1 and 2).
Figure 1—figure supplement 2
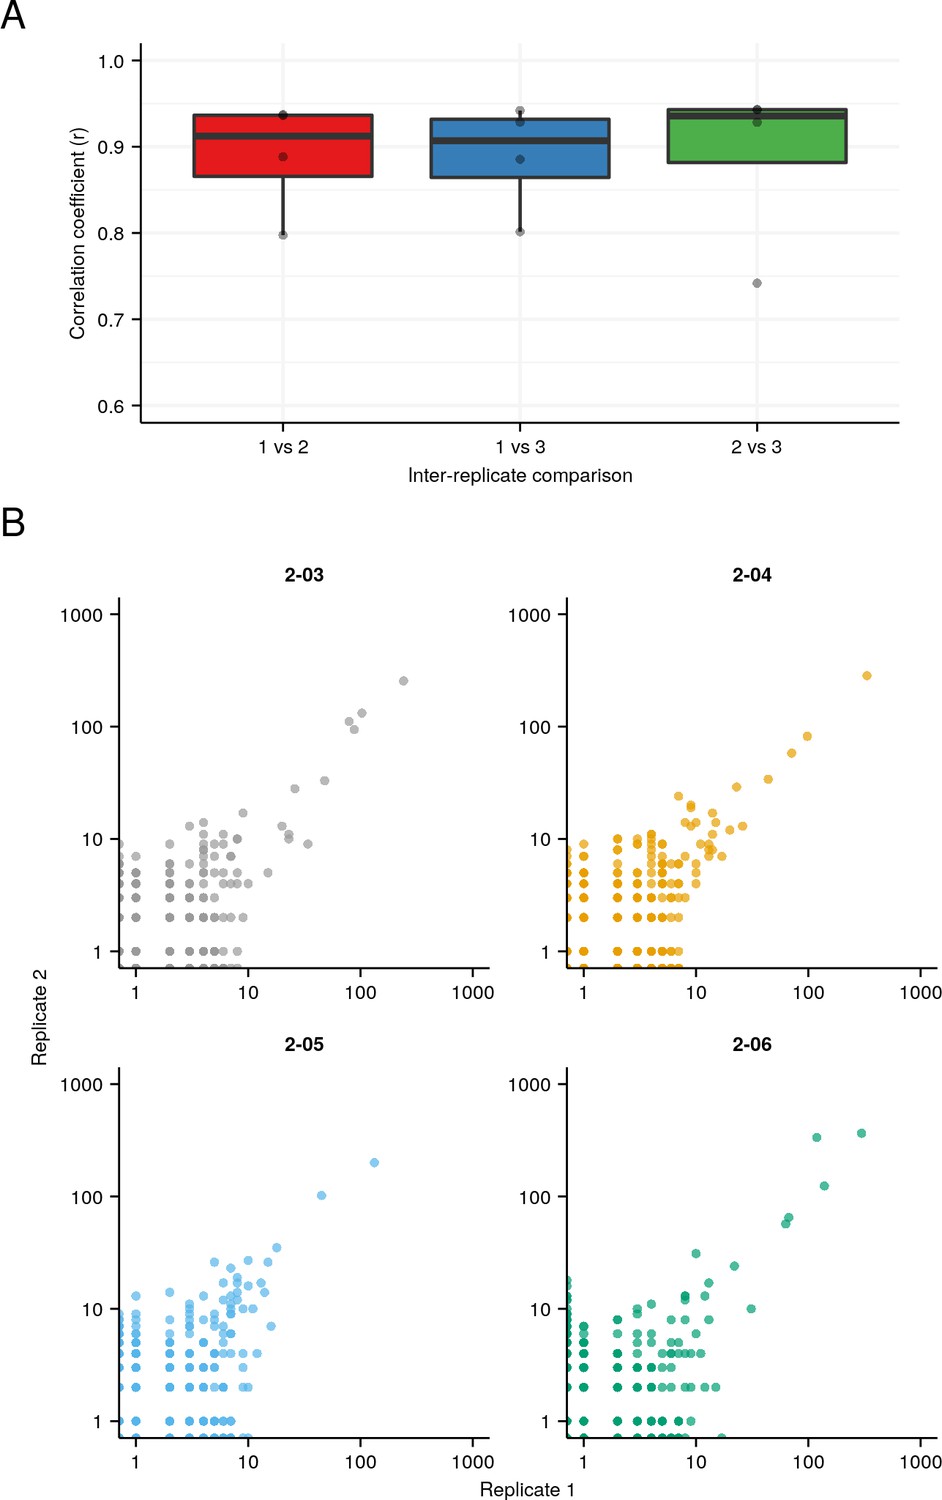
Replicability of IgSeq results on total-body RNA.
(A) Boxplots of inter-replicate correlation in clone sizes across the four individuals in the pilot experiment (Figure 1—figure supplement 1). (B) Example scatter plot for each individual, showing the relationship between the size of a clone in replicate 1 and the same clone in replicate 2.
Figure 1—figure supplement 3
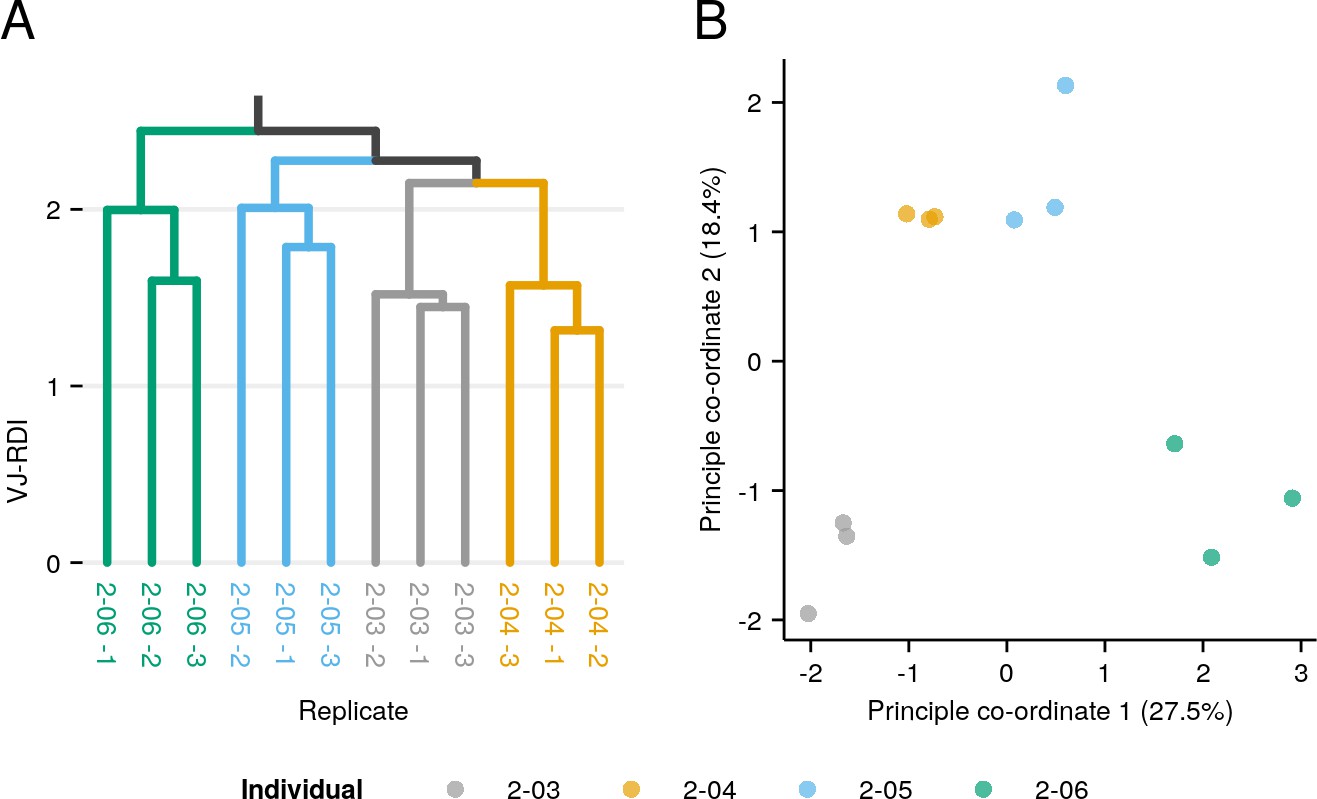
Clustering of replicates in control libraries.
(A) UPGMA clustering dendrogram on repertoire pilot replicates (Figure 1—figure supplement 1), based on pairwise repertoire dissimilarity index (RDI) distances computed on the V/J composition of each replicate and colored according to individual origin. (B) Principal coordinate analysis (PCoA) of pairwise VJ-RDI distances between all replicates, colored by individual origin.
Figure 2 with 4 supplements

Aging in whole-body killifish IGH repertoires.
(A) Experimental design. Adult male GRZ-strain turquoise killifish were sacrificed at 39, 56, 73, and 128 days post-hatching, flash-frozen and homogenized. (B–E) Alpha-diversity spectra, indicating average within-individual repertoire diversity for each age group and diversity order (*: 0.05 ≤ 0.01, **: 0.01≤ p ≤ 0.001, Kruskal-Wallis permutation test, Appendix 1—note 7). (B) Clonal alpha-diversity spectra. (C) VJ alpha-diversity spectra, all clones. (D) VJ alpha-diversity spectra, large clones (>4 unique sequences) only. (E) VJ alpha-diversity spectra, small clones (<5 unique sequences) only. (F) VJ alpha-diversity ratios for old vs. young killifish at each diversity order, for small (dashed lines) or large (solid lines) clones. Color indicates the older age group being compared to young (39 days) fish. (G) Normalized VJ beta-diversity spectra, indicating between-individual variability in repertoire composition for each age group and diversity order. (H) Distributions of pairwise repertoire dissimilarity index (RDI) distances between individuals in each age group (***: p ≤ 0.001, Mann-Whitney U tests for pairwise age differences), based on the VJ composition of each individual’s repertoire. (I) Principal coordinate analysis (PCoA) of pairwise RDI distances for each age group, visualizing the progressively greater dispersion seen at later ages. Each curve in (B–G) represents the mean across 2000 bootstrap replicates (Appendix 1—note 7); shaded regions indicate 95% confidence intervals over the same.
Figure 2—figure supplement 1
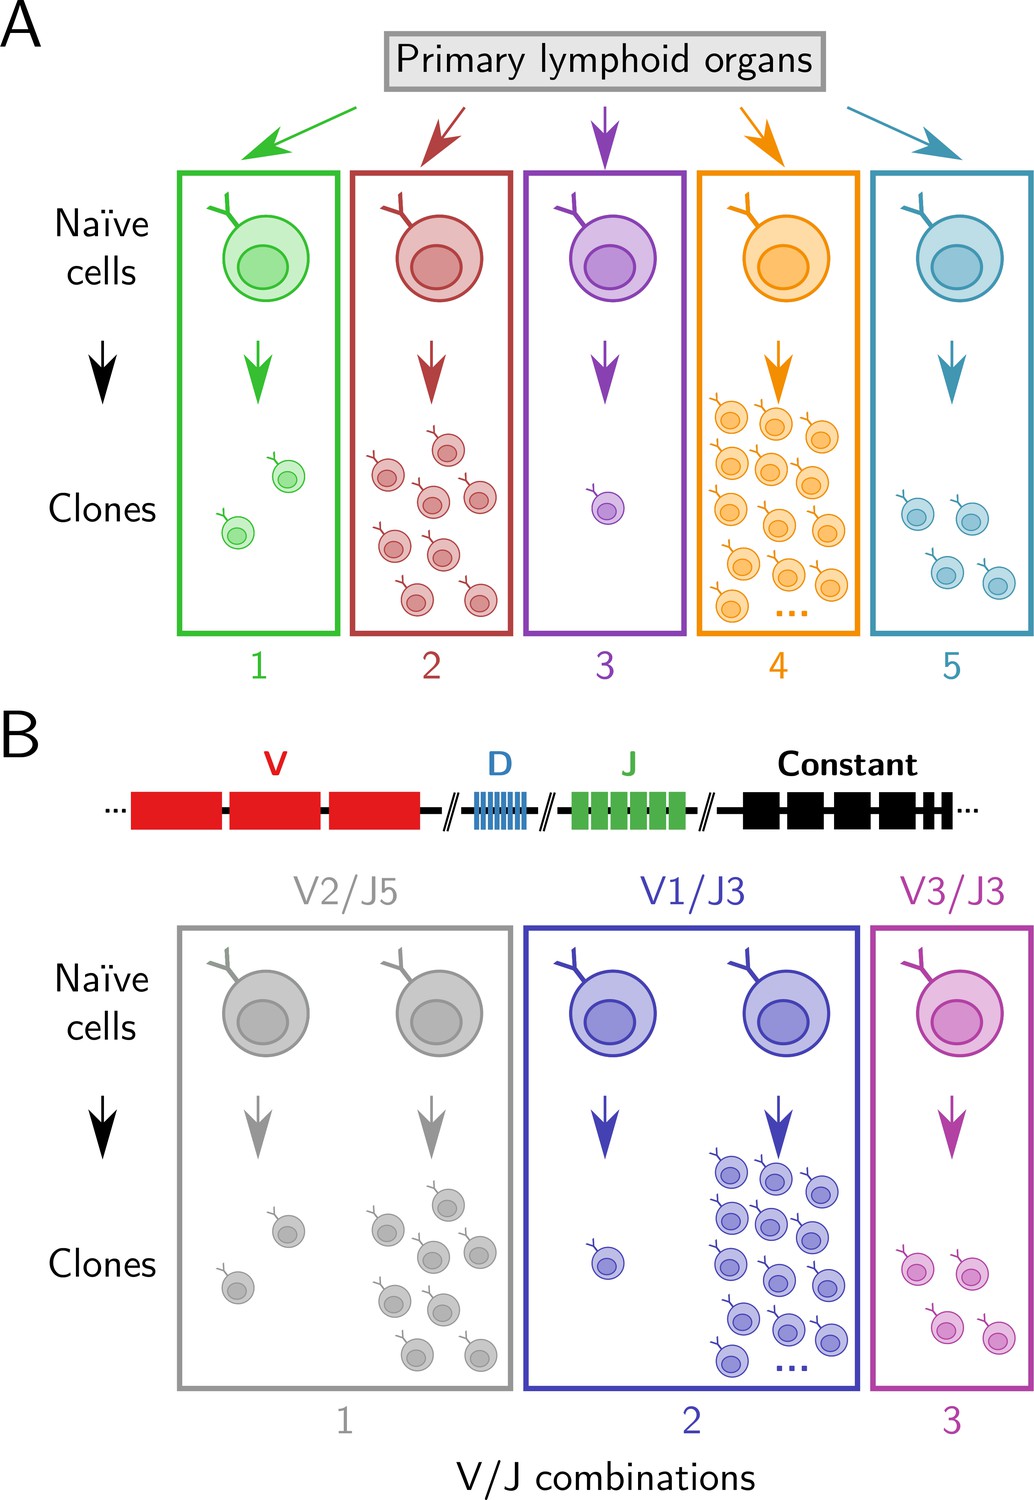
Clonal and V/J diversity in antibody repertoires.
(A) A clone is a group of B-cells descended from the same naïve ancestor cell. In this figure, a group of 28 unique sequences in an antibody repertoire, each representing a single cell, is partitioned into five groups based on their inferred clonal identity. (B) Each developing B-cell selects a single V, D, and J gene segment from those present in the native immunoglobulin heavy-chain (IGH) locus and recombines them together to produce its antigen-binding sequence. In this figure, the same 28 sequences are instead grouped by the V and J segments their naïve ancestors selected during development. As each developing B-cell selects from the same range of possible gene segments, this results in multiple clones being grouped together in a single V/J category, resulting in only three groups.
Figure 2—figure supplement 2
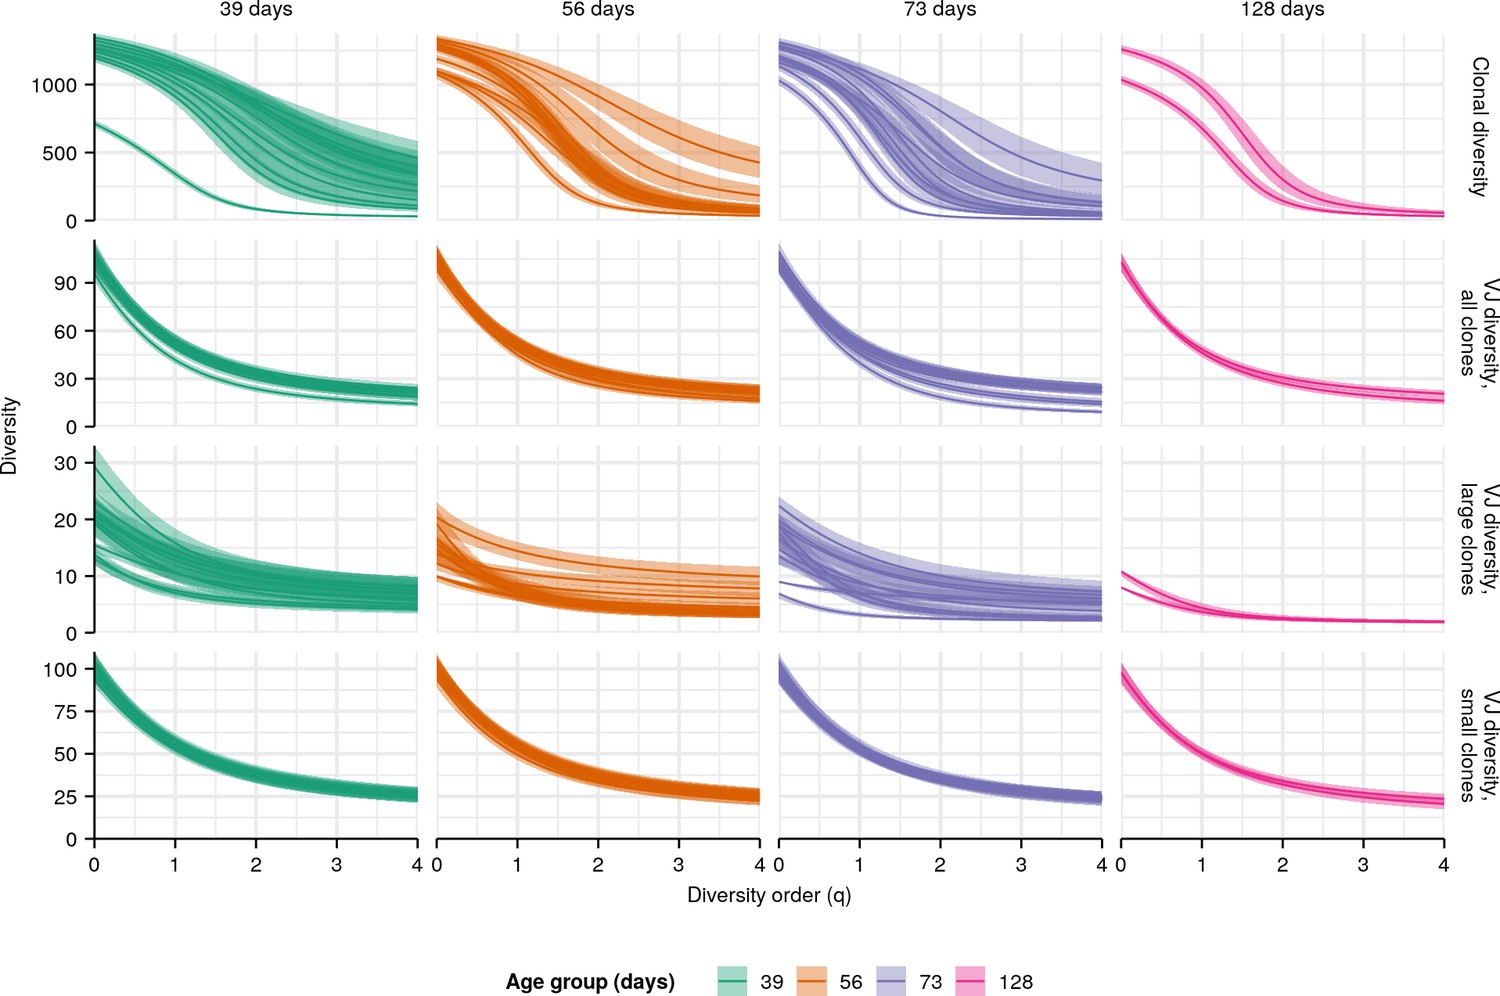
Individual diversity spectra in killifish whole-body repertoires.
Clonal (top row) or VJ (other rows) diversity spectra of individual turquoise killifish of different ages. Each curve represents the mean Hill diversity for that individual across 2000 bootstrap replicates (Appendix 1—note 7); shaded regions indicate 95% confidence intervals over the same.
Figure 2—figure supplement 3
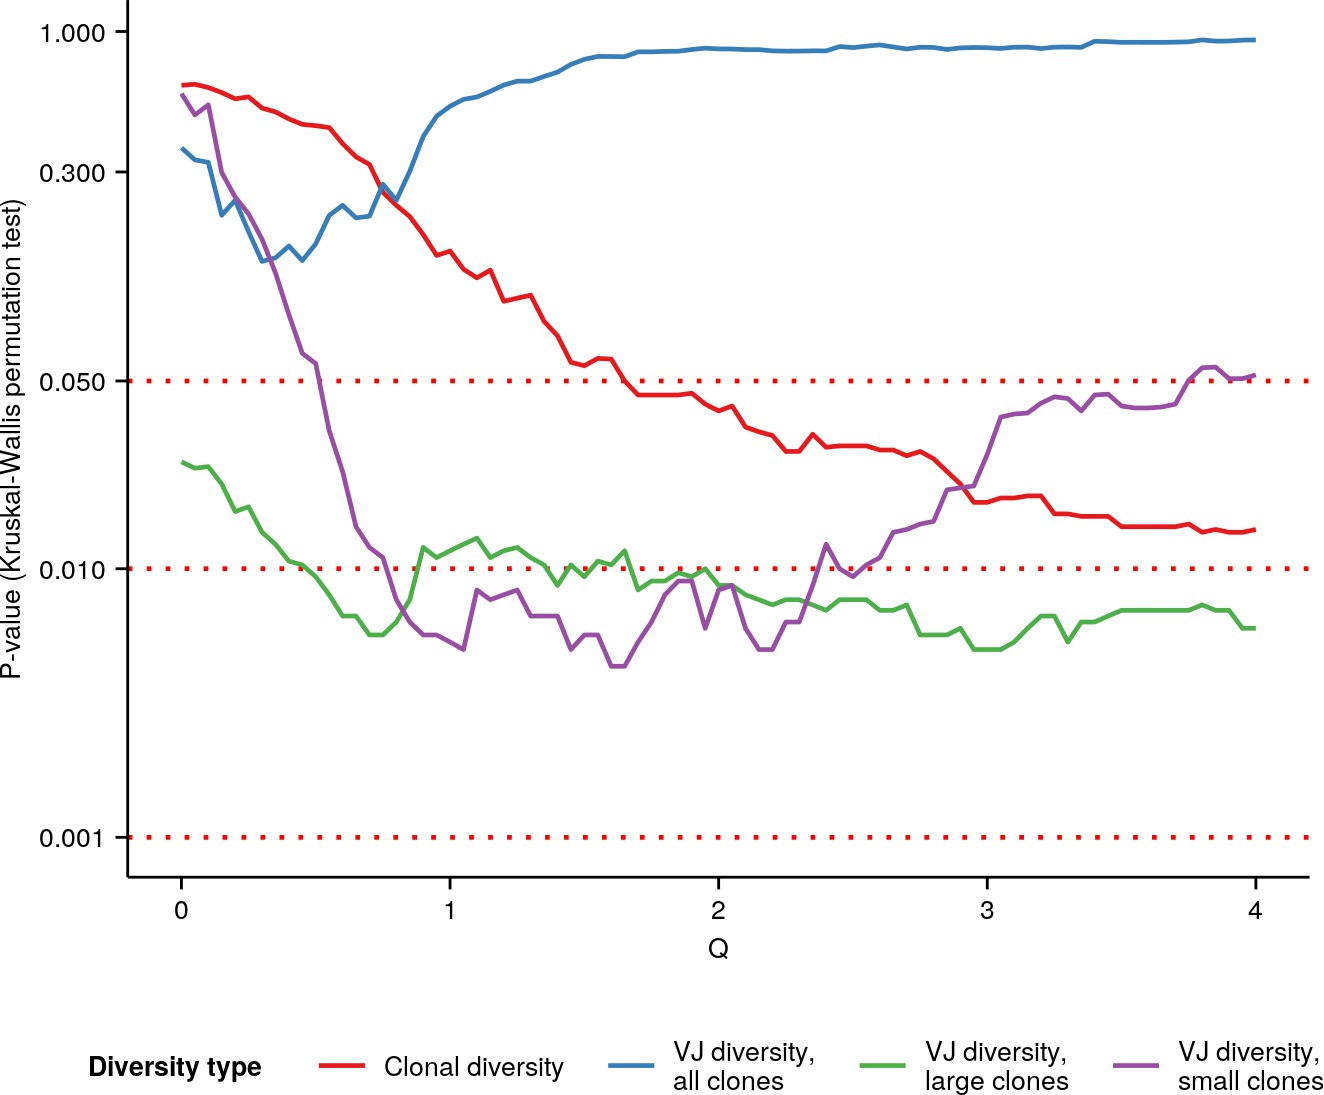
p-Values of Kruskal-Wallis permutation tests for an age effect (Appendix 1—note 7) in whole-body killifish IGH repertoires at different Hill diversity orders.
Color indicates type of diversity (clonal vs. VJ, etc.) being tested; see main text and Appendix 1—note 7 for more details.
Figure 2—figure supplement 4
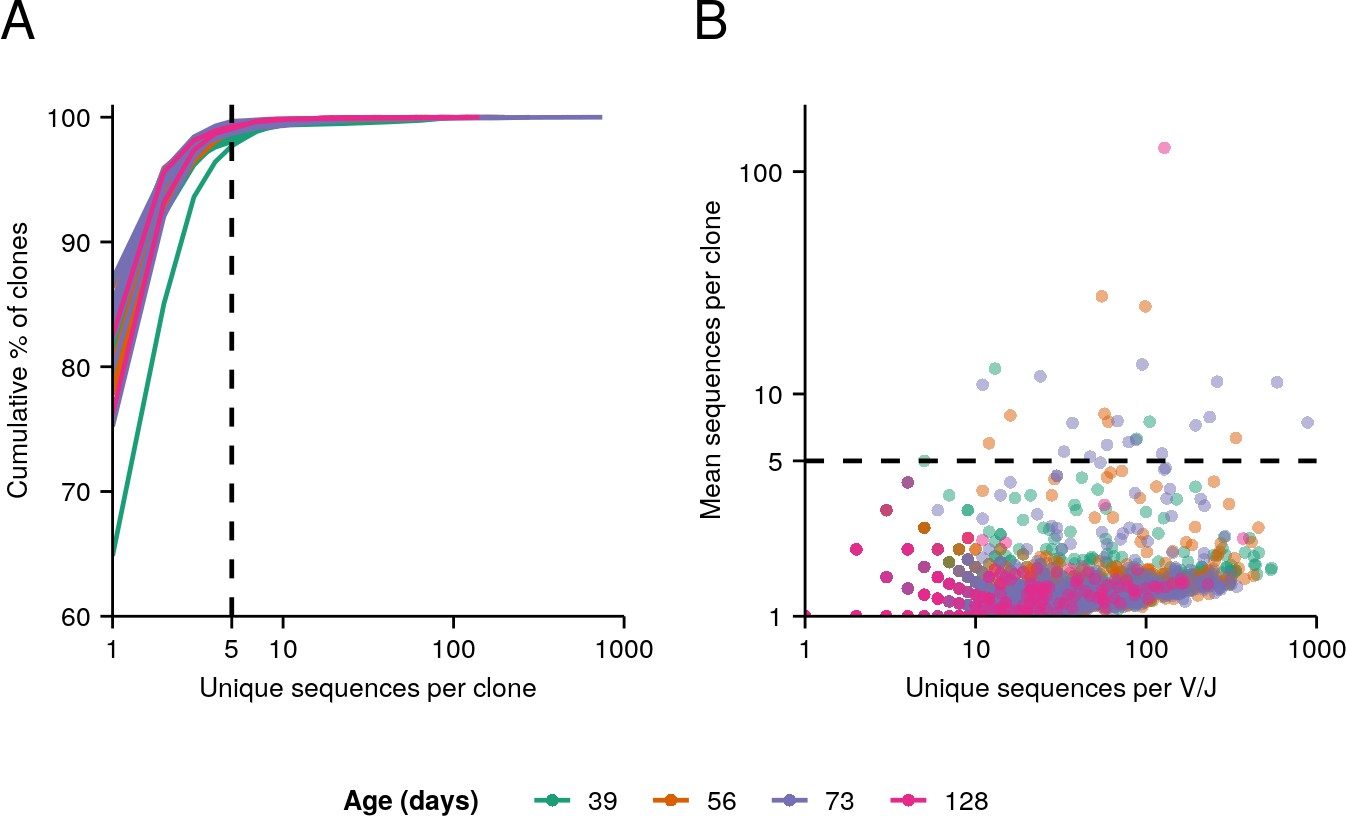
Clone size distributions in killifish whole-body repertoires.
(A) Cumulative clone-size distributions for each individual in the aging dataset. (B) V/J combinations present in each individual whole-body repertoire in the dataset, with each point representing a single V/J combination in a single individual, its x-coordinate indicating the number of unique IGH sequences assigned to that V/J combination in that individual, and its y-coordinate indicating the average clone size among those sequences.
Figure 3 with 5 supplements
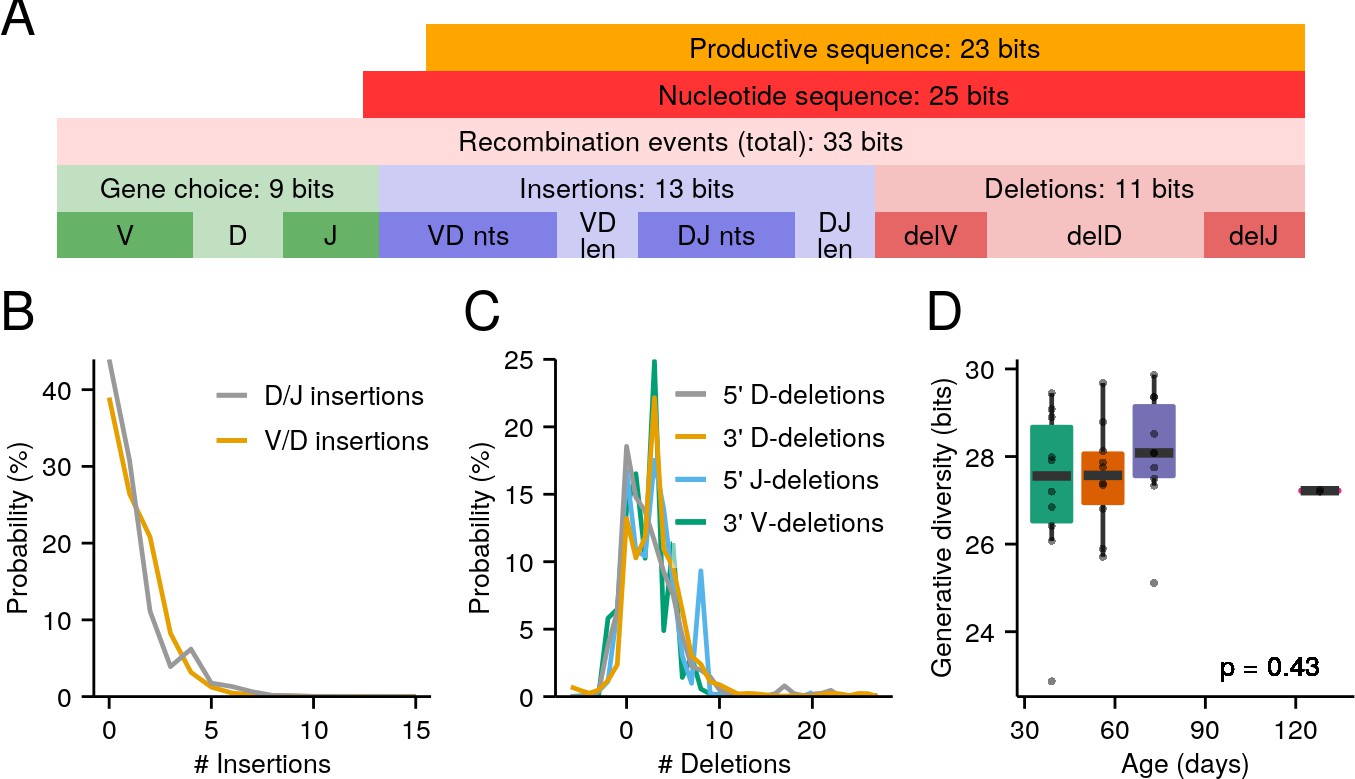
The killifish generative repertoire.
(A) Entropy composition of the generative process from four 8-week-old GRZ-strain adult male turquoise killifish. (B) Probability distributions of junctional N-insertions in the same dataset. (C) P-insertions and deletion distributions inferred from the same dataset, with P-insertions modeled as negative deletions. (D) Boxplots of total recombination entropy values for models inferred separately for each individual in the 32-individual aging cohort (p = 0.43, Kruskal-Wallis one-way analysis of variance [ANOVA] for an age effect).
Figure 3—figure supplement 1

Individual IGoR-inferred insertion/deletion distributions (Figure 3A) for individuals in the pilot dataset (Figure 1—figure supplement 1).
Figure 3—figure supplement 2
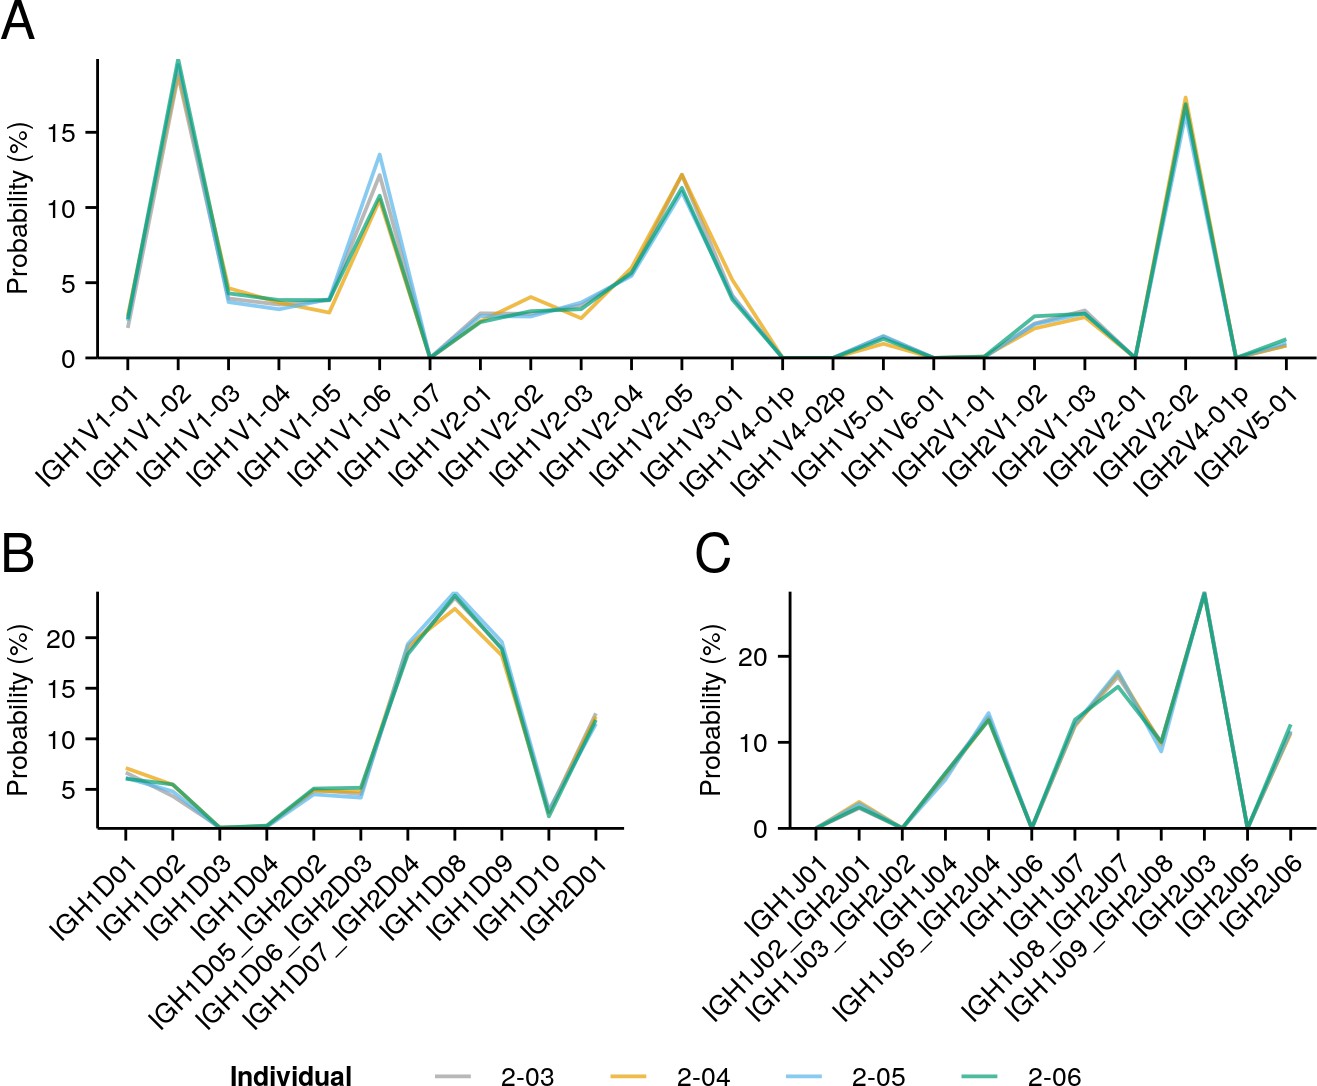
Individual IGoR-inferred segment-usage distributions (Figure 3B) for individuals in the pilot dataset (Figure 1—figure supplement 1).
Figure 3—figure supplement 3

Individual IGoR-inferred insertion/deletion distributions (Figure 3A) for all individuals in the whole-body killifish dataset (Figure 2A and Supplementary file 2c).
Figure 3—figure supplement 4
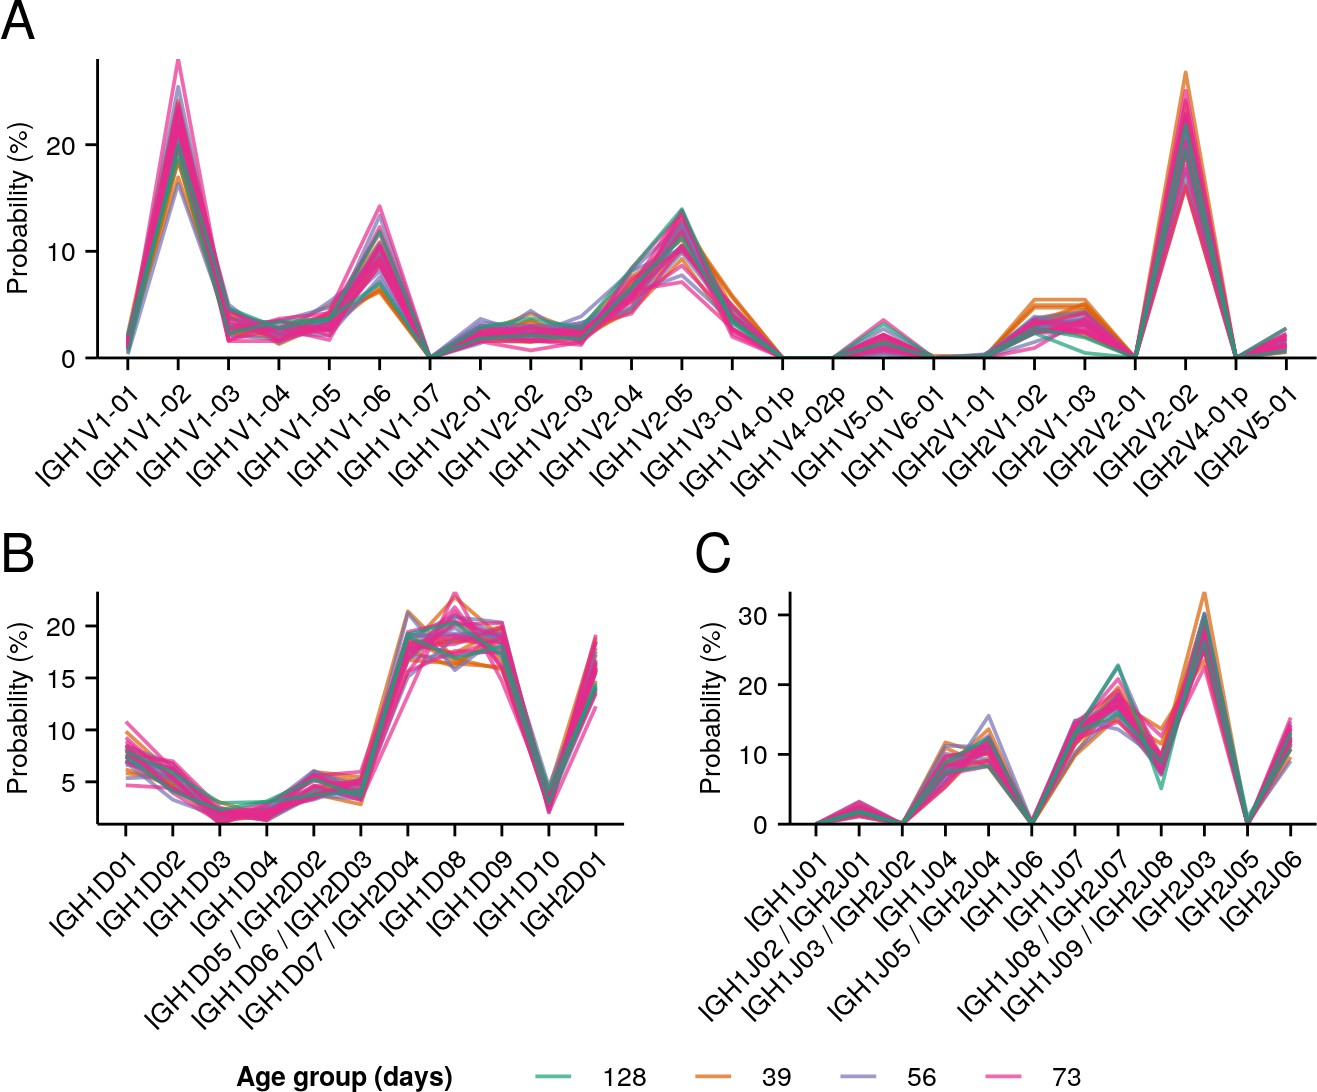
Individual IGoR-inferred segment-usage distributions (Figure 3B) for all individuals in the whole-body killifish dataset (Figure 2A and Supplementary file 2c).
Figure 3—figure supplement 5
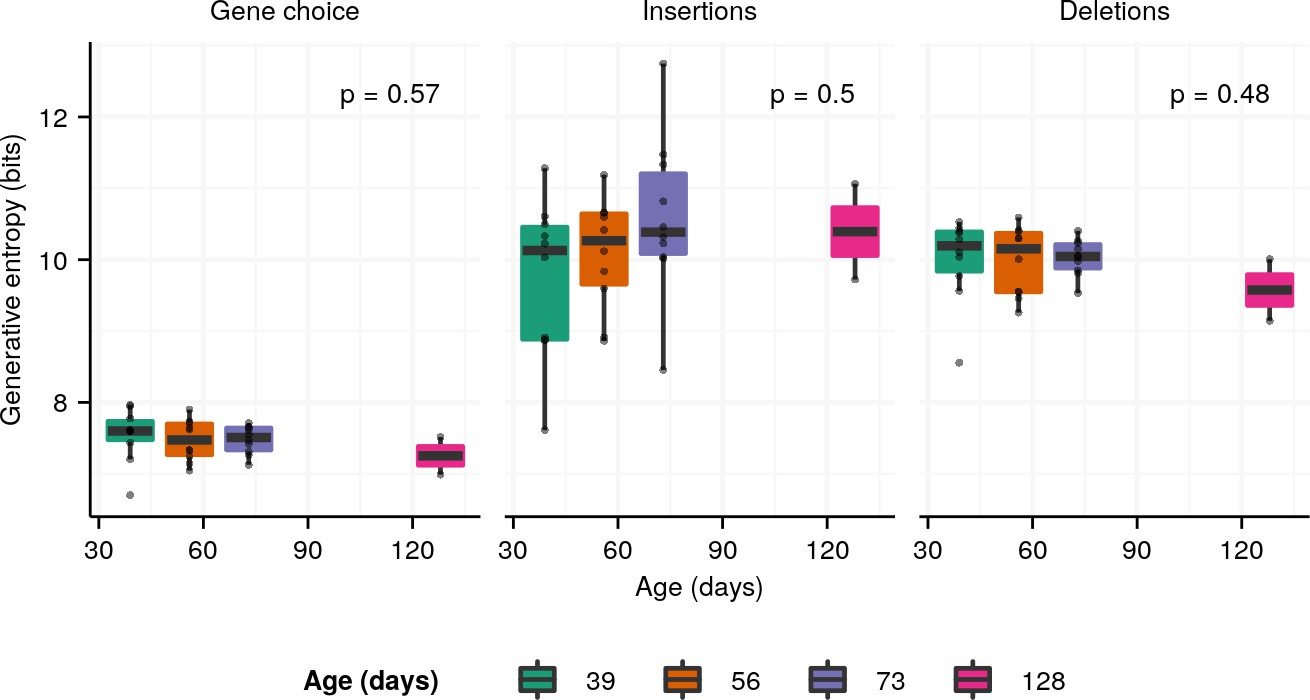
Boxplots of the entropy contributions of (A) gene choice, (B) N-insertions, and (C) P-insertions and deletions to the generative repertoires of individual turquoise killifish at different ages (Figure 2A and Supplementary file 2c).
The stated p-values are from Kruskal-Wallis one-way analysis-of-variance tests for an age effect.
Figure 4 with 4 supplements

Aging in killifish intestinal repertoires.
(A) Experimental design. Adult male GRZ-strain turquoise killifish were sacrificed at 6 and 16 weeks’ post-hatching, and total RNA was extracted from the dissected intestine. (B–C) Alpha-diversity spectra, indicating average within-individual repertoire diversity for each age group and diversity order (*: 0.05 ≤ 0.01, **: 0.01≤ p ≤ 0.001, Kruskal-Wallis permutation test, Appendix 1—note 7). (A) Clonal alpha-diversity spectra. (B) VJ alpha-diversity spectra, all clones. (D) Normalized VJ beta-diversity spectra, indicating between-individual variability in repertoire composition for each age group and diversity order. (E) Distribution of pairwise repertoire dissimilarity index (RDI) distances between killifish intestinal repertoires at different ages (***: p ≤ 0.001, Mann-Whitney U tests for pairwise age differences). Each curve in (A–C) represents the mean across 2000 bootstrap replicates (Appendix 1—note 7); shaded regions indicate 95% confidence intervals over the same.
Figure 4—figure supplement 1
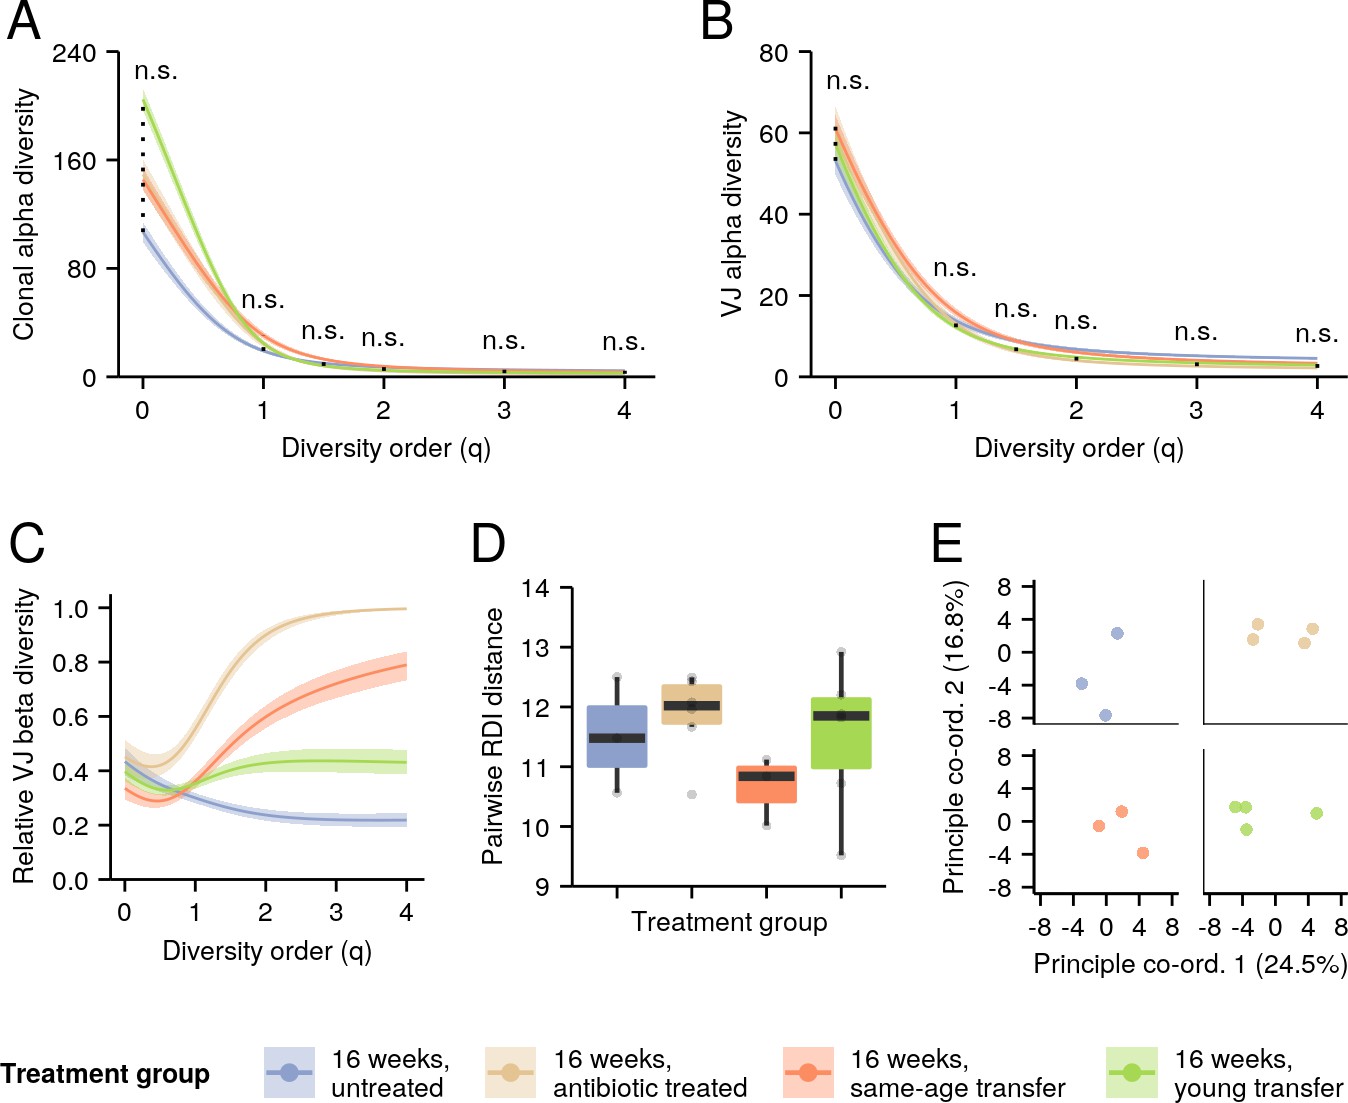
Effect of microbiota transfer on the intestinal repertoires of 16-week-old turquoise killifish.
(A–B) Alpha-diversity spectra, indicating average within-individual repertoire diversity for each treatment group and diversity order (n.s.: p > 0.05 Kruskal-Wallis permutation test, Appendix 1—note 7). (A) Clonal alpha-diversity spectra. (B) VJ alpha-diversity spectra, all clones. (D) Normalized VJ beta-diversity spectra, indicating between-individual variability in repertoire composition for each treatment group and diversity order. (E) Distribution of pairwise repertoire dissimilarity index (RDI) distances between killifish intestinal repertoires of different treatment groups (no significant difference between any two groups, Mann-Whitney U tests for pairwise differences). Each curve in (A–C) represents the mean across 2000 bootstrap replicates (Appendix 1—note 7); shaded regions indicate 95% confidence intervals over the same.
Figure 4—figure supplement 2
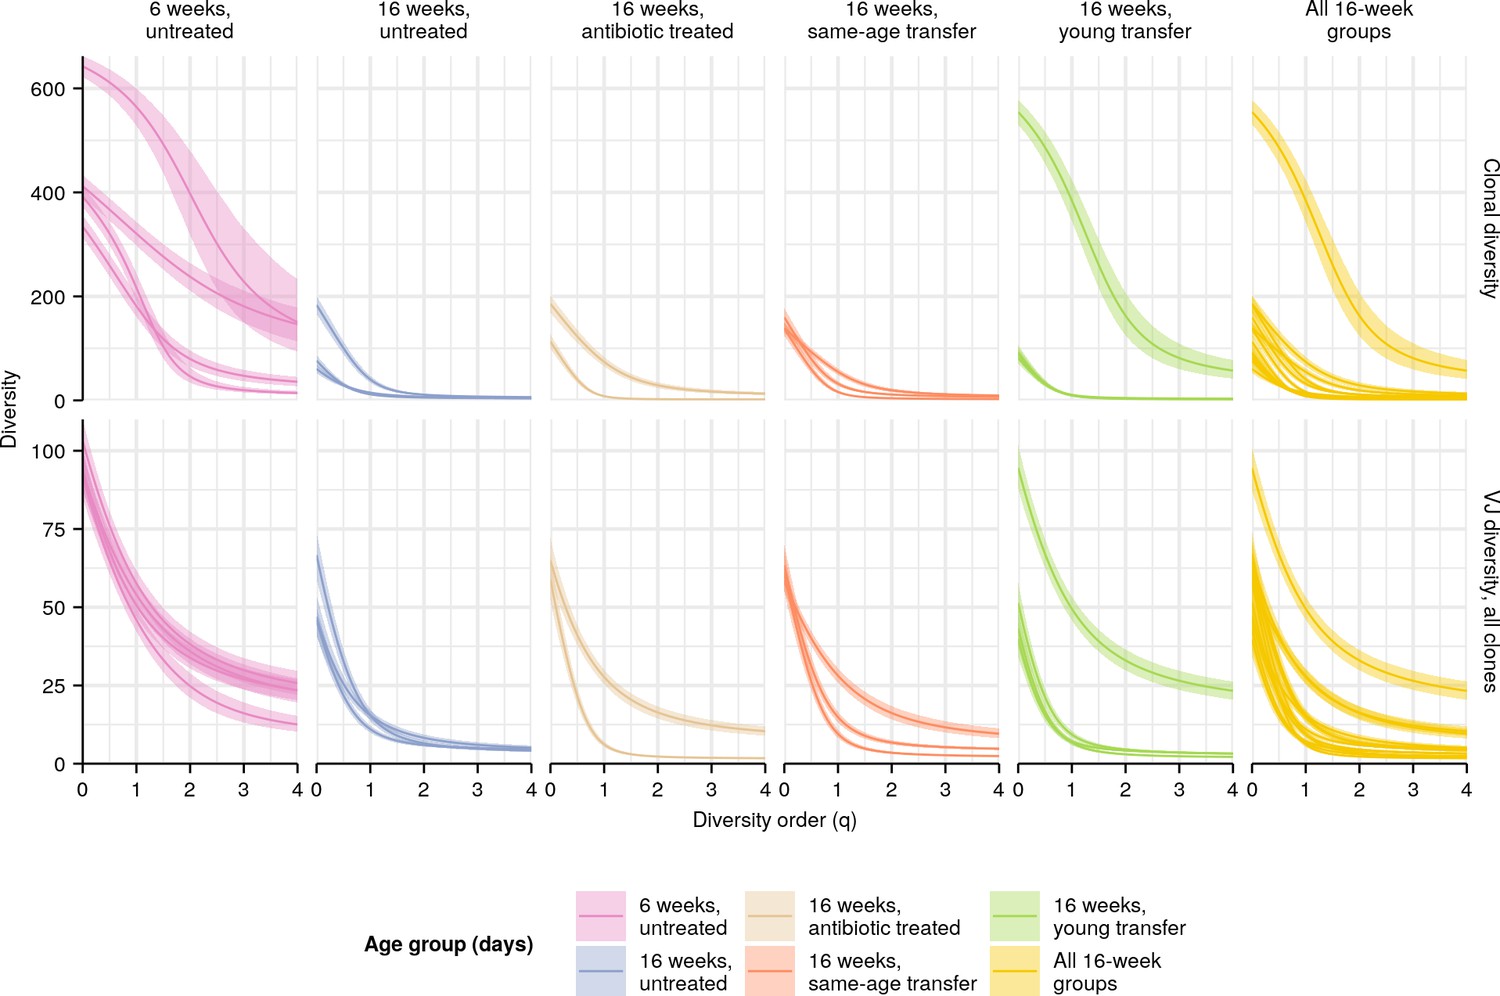
Individual diversity spectra in killifish intestinal repertoires.
Clonal (top row) or VJ (bottom row) diversity spectra of the intestines of individual turquoise killifish of different ages. Each curve represents the mean Hill diversity for that individual across 2000 bootstrap replicates (Appendix 1—note 7); shaded regions indicate 95% confidence intervals over the same.
Figure 4—figure supplement 3
p-Values of Kruskal-Wallis permutation tests (Appendix 1—note 7) for (left) an effect of microbiota transfer treatment group or (B) an age effect in intestinal killifish IGH repertoires at different Hill diversity orders.
Color indicates type of diversity (clonal vs. VJ) being tested; see main text and Appendix 1—note 7 for more details.
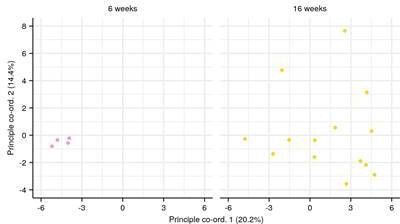
Figure 4—figure supplement 4
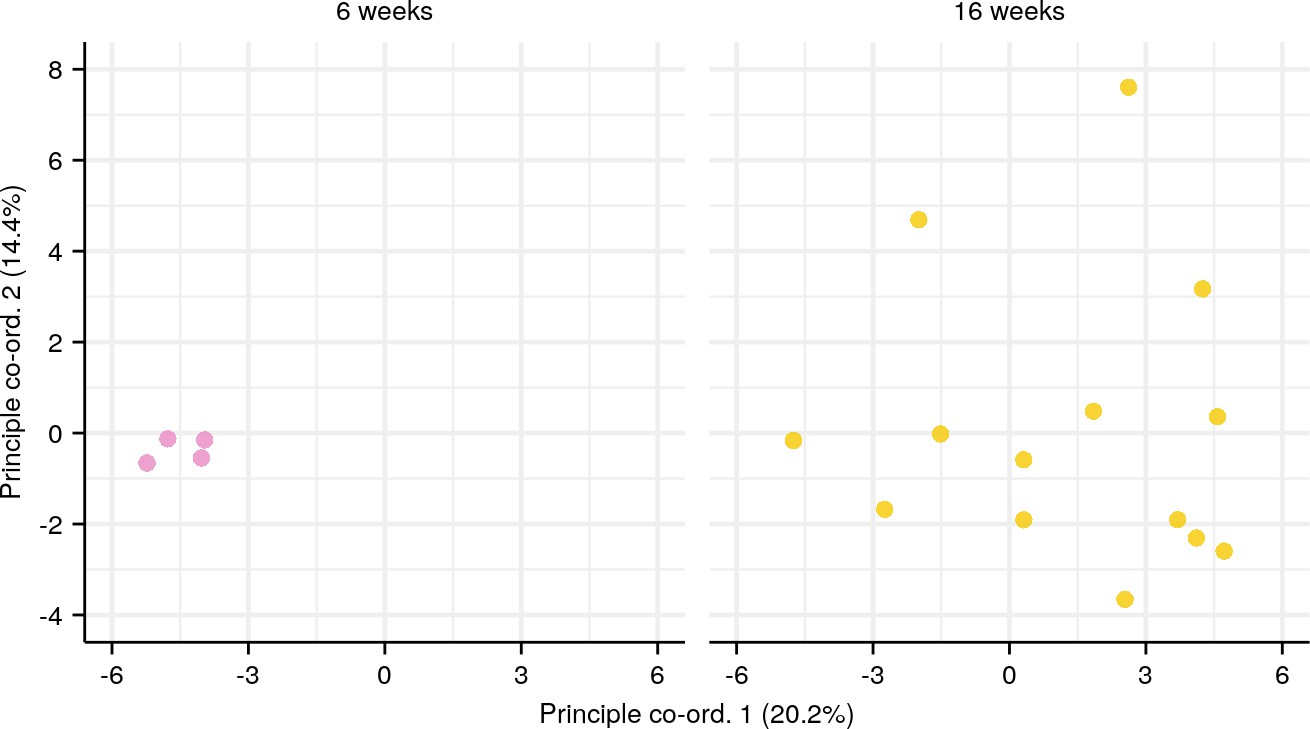
Principal coordinate analysis (PCoA) of pairwise repertoire dissimilarity index (RDI) distances for each age group in the killifish intestinal dataset (Figure 4E, Supplementary file 2b).
Figure 5 with 1 supplement
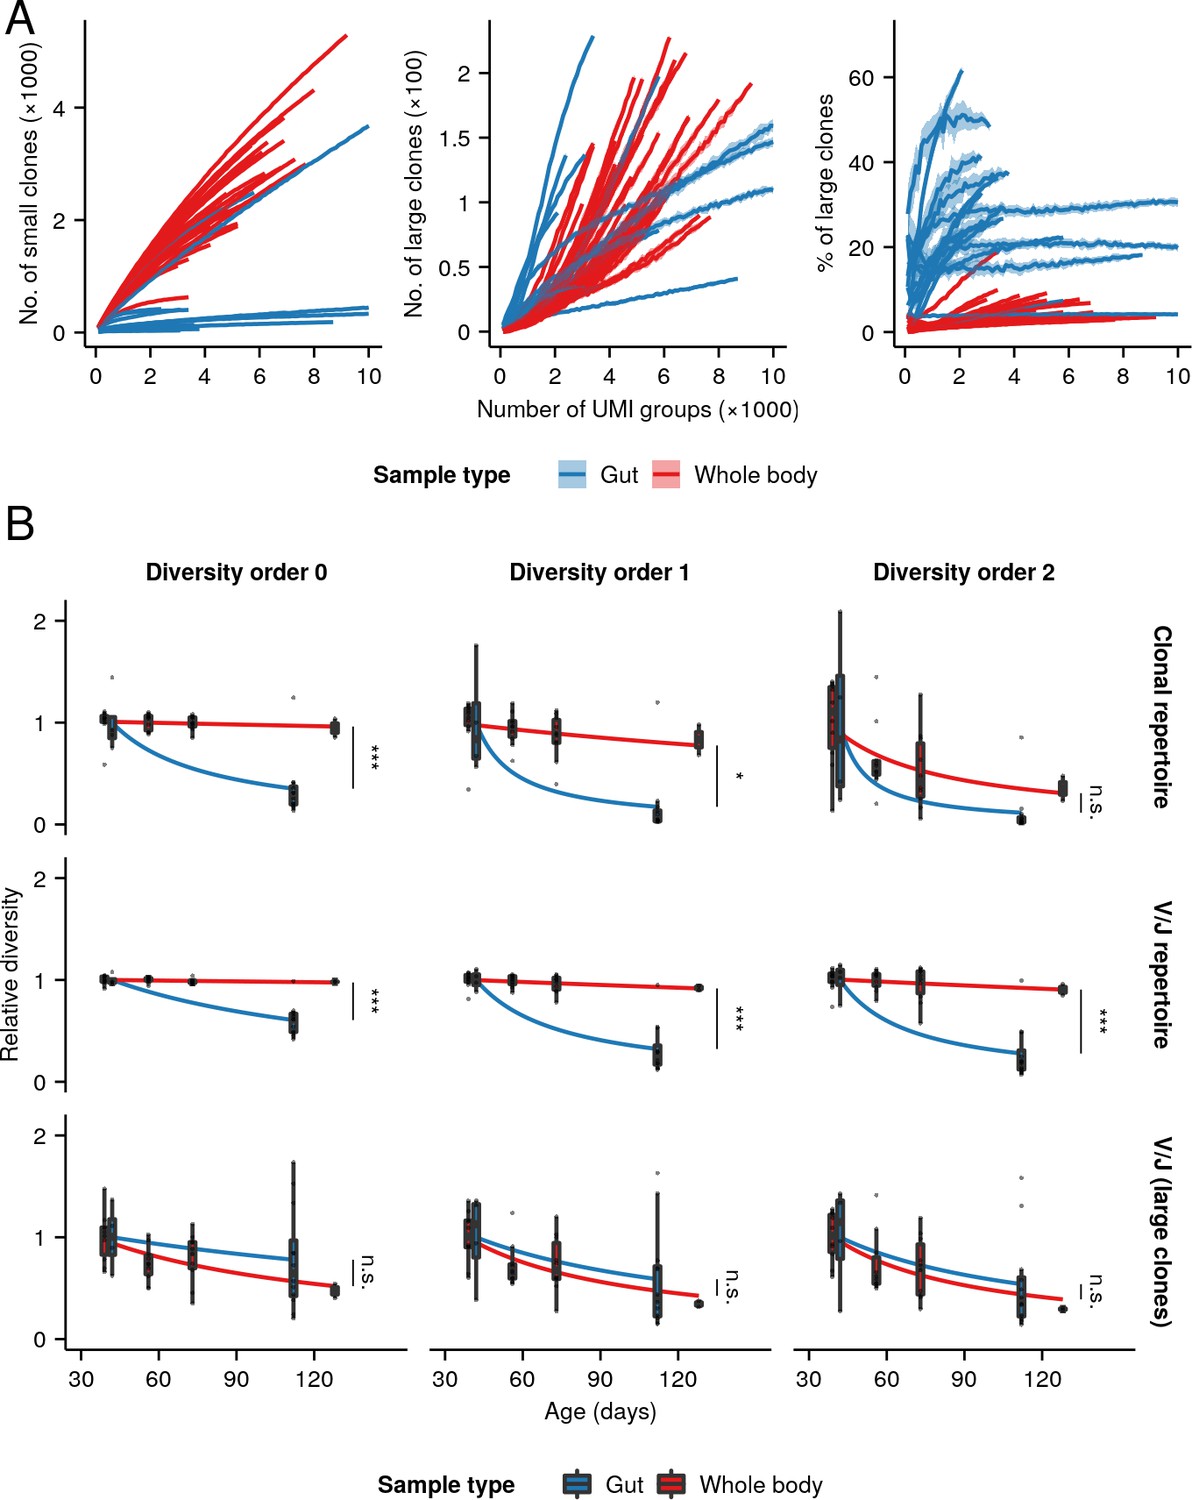
Relative clonal composition and aging phenotypes of whole-body and intestinal repertoires.
(A) Rarefaction analysis of clonal composition of antibody repertoires from whole-body and intestinal samples, showing the average number of small (left, <5 unique sequences) and large (middle, 5 unique sequences) clones for each individual across 20 independent replicates at each sample size, as well as the average proportion of all clones in each repertoire which are large (right). Shaded regions around each line show the region within one standard deviation of the mean value. (B) Boxplots of individual diversity measurements of repertoires from each age group in the whole-body and intestinal datasets, divided by the mean diversity of the youngest age group in each dataset. Fitted curves show the maximum-likelihood prediction of a gamma-distributed generalized linear model of diversity vs. age and sample type for the whole-body and intestinal dataset, relative to the average diversity of the youngest age group in each experiment, testing for a significant effect of sample type on the rate of diversity change with age (Student’s t-test,*: 0.01< p 0.05; ***: p 0.001).
Figure 5—figure supplement 1
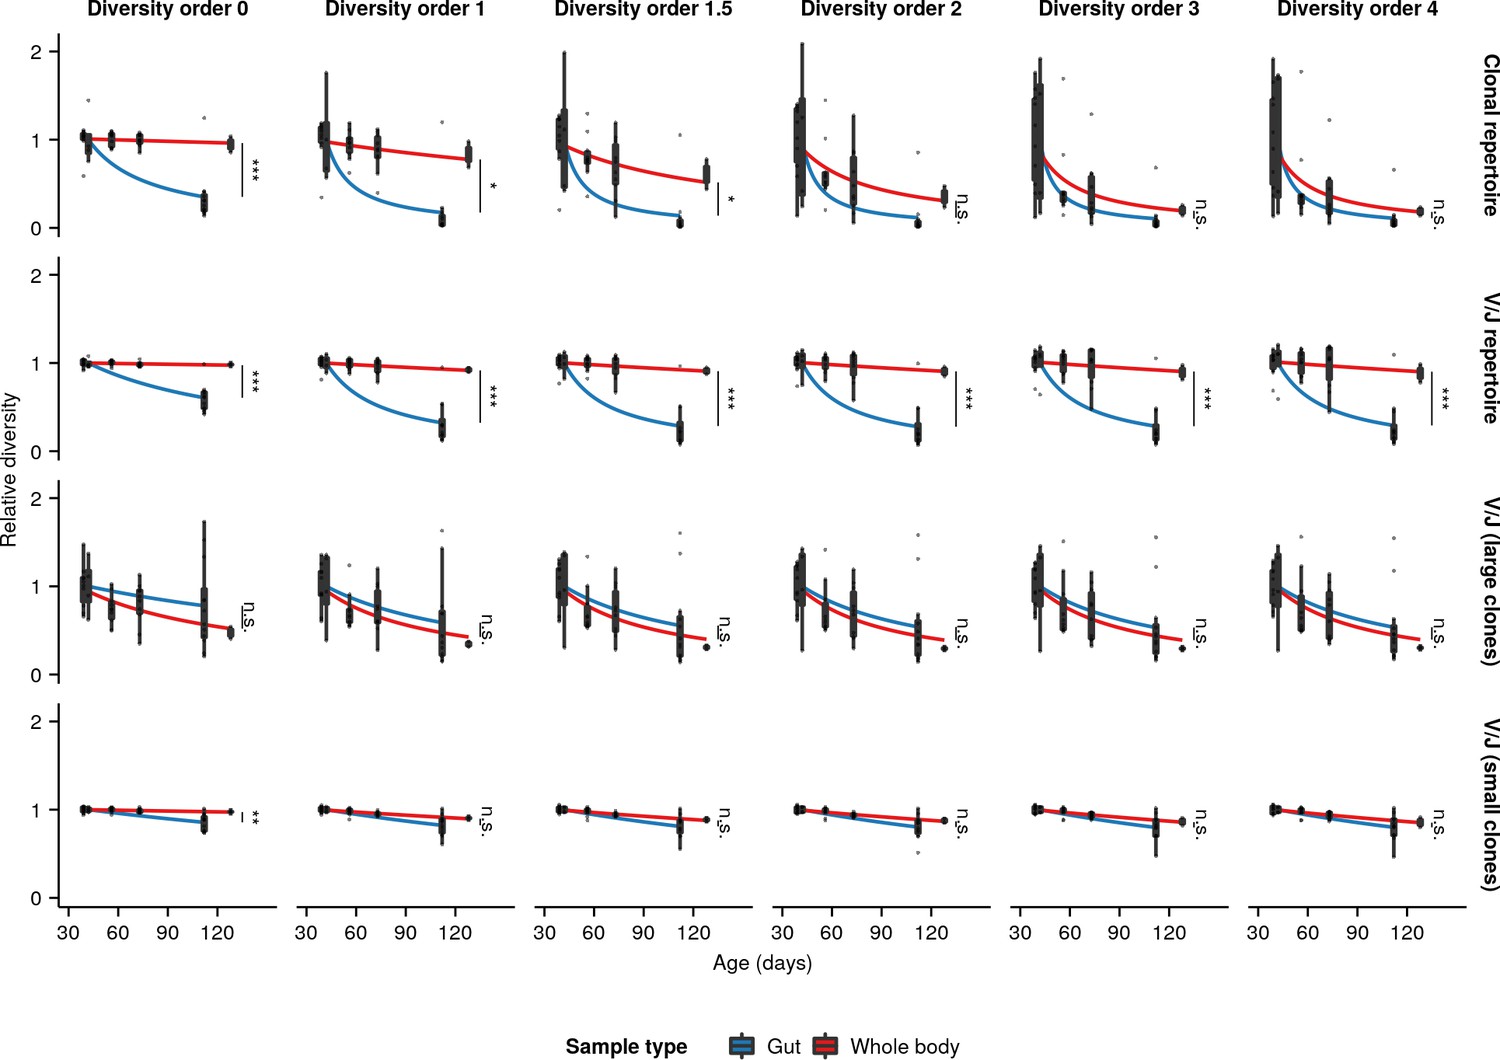
Extended boxplots of individual diversity measurements of repertoires from each age group in the whole-body and intestinal datasets, divided in each case by the mean diversity of the youngest age group in that dataset.
Fitted curves show the maximum-likelihood prediction of a gamma-distributed generalized linear model of diversity vs. age and sample type, testing for a significant effect of sample type on the rate of diversity change with age (Student’s t-test,*: 0.01< p ≤ 0.05; **: 0.01< p ≤ 0.001, ***: p < 0.001).
Figure 6 with 3 supplements
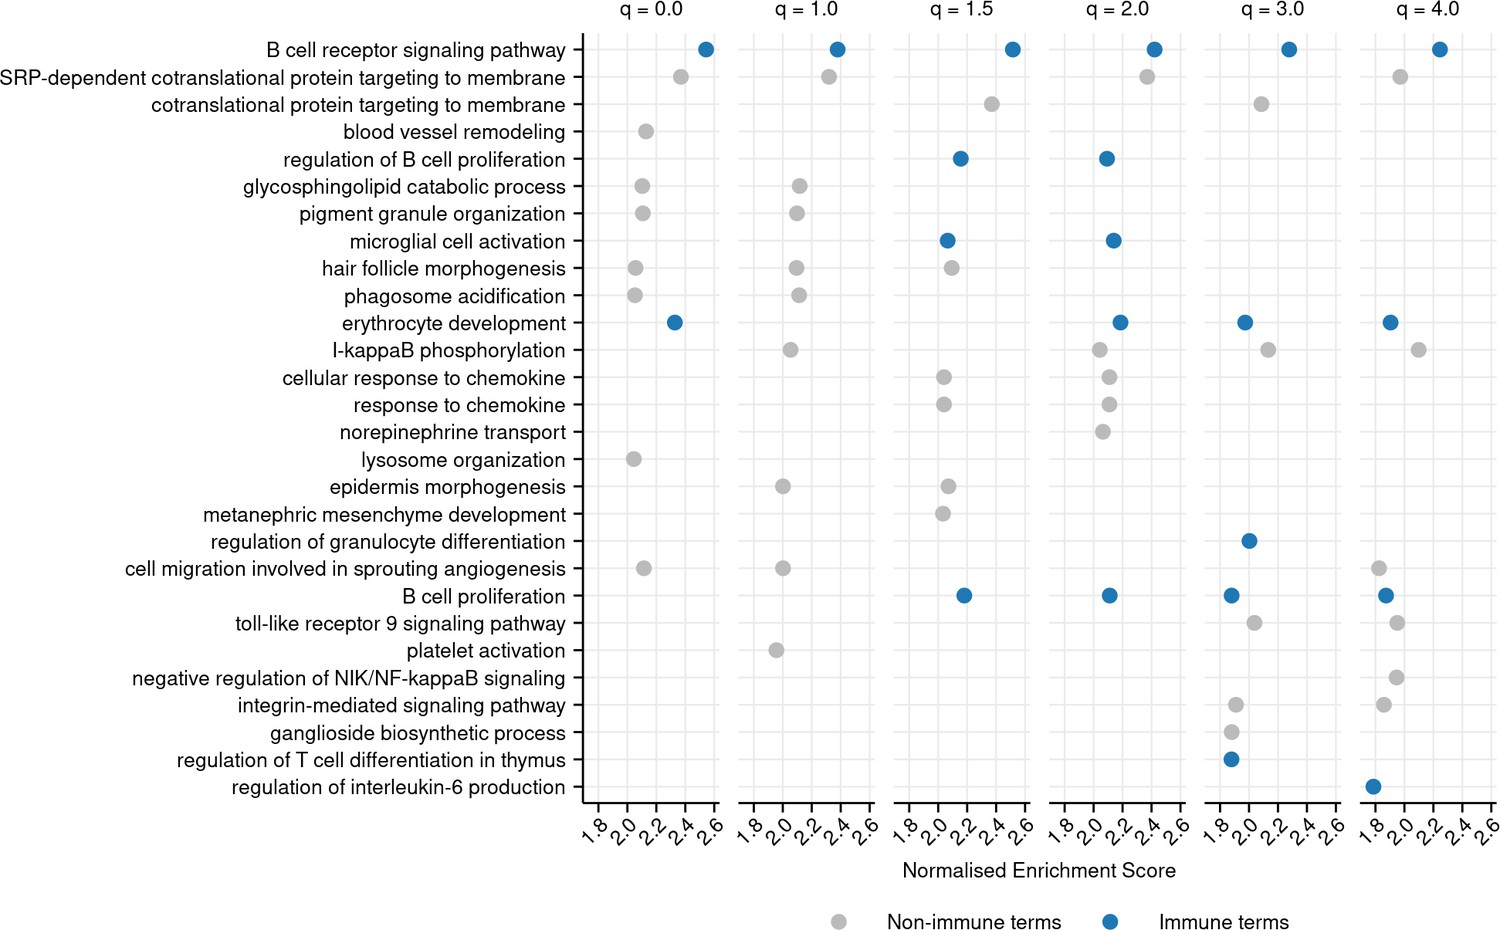
Top 10 most positively enriched gene ontology (GO) terms associated with each diversity order in turquoise killifish, controlling for age, ranked by normalized enrichment score in descending order (Materials and methods).
Immune terms are highlighted in blue. Terms that are significantly positively enriched for a given diversity order, but not in the top 10, are not shown, even if they fall in the top 10 terms for other orders.
Figure 6—figure supplement 1

Top 10 most negatively enriched gene ontology (GO) terms associated with each diversity order in turquoise killifish, controlling for age, ranked by normalized enrichment score in ascending order (Materials and methods).
Terms that are significantly negatively enriched for a given diversity order, but not in the top 10, are not shown, even if they fall in the top 10 terms for other orders.
Figure 6—figure supplement 2
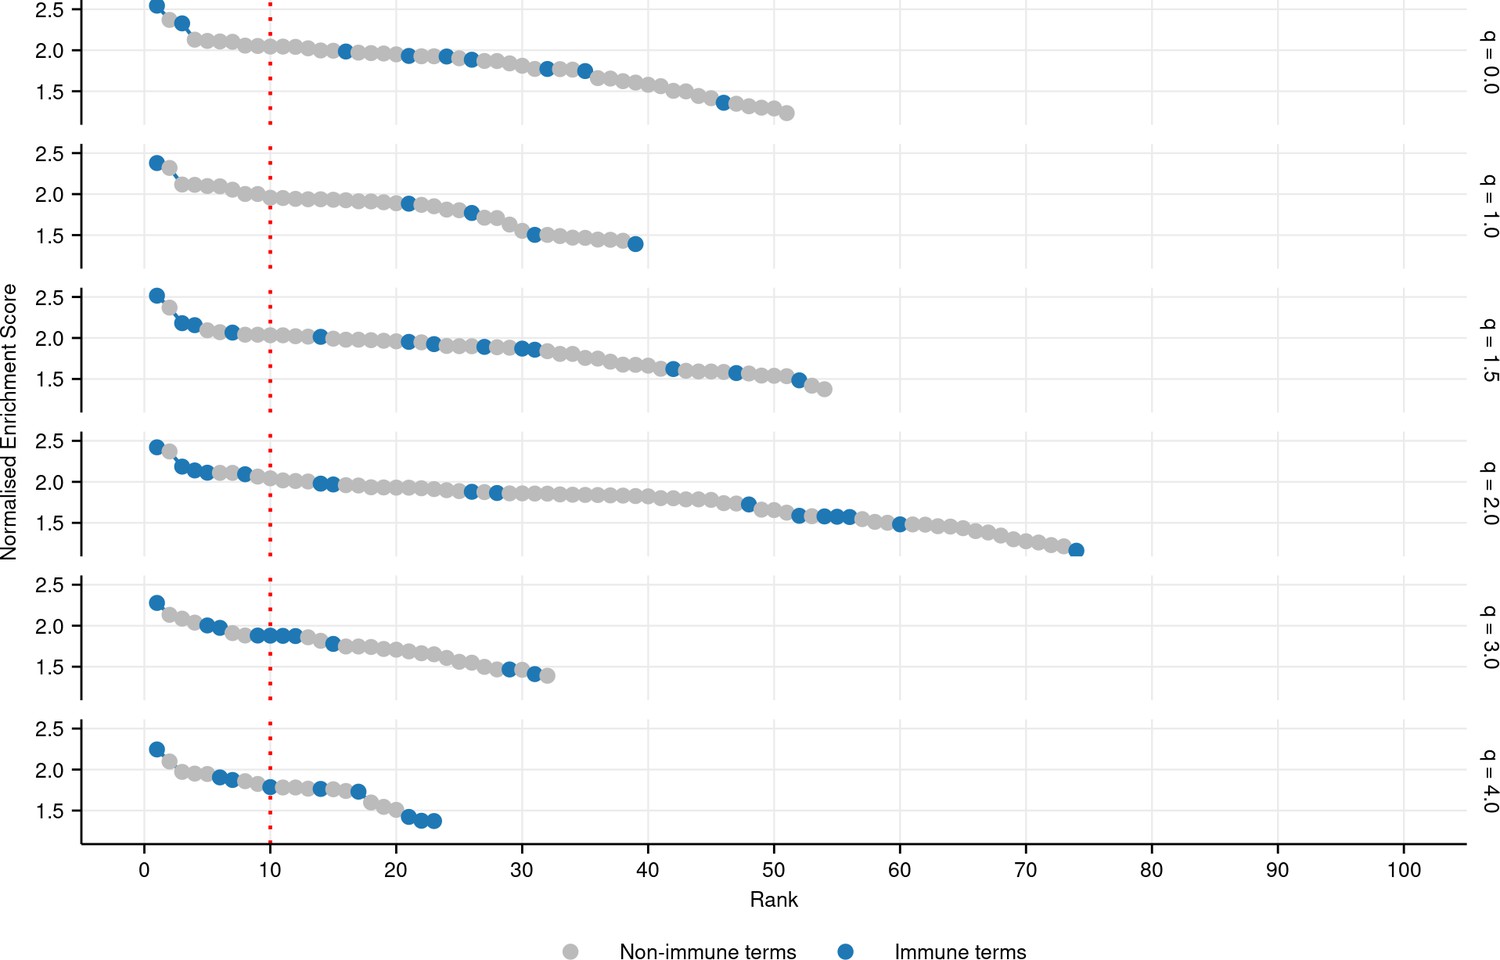
Plot of all significantly positively enriched gene ontology (GO) terms (FDR-adjusted p-value ≤ 0.05) associated with each diversity order in turquoise killifish, controlling for age, ranked by normalized enrichment score in descending order (Materials and methods).
Immune terms are highlighted in blue.
Figure 6—figure supplement 3
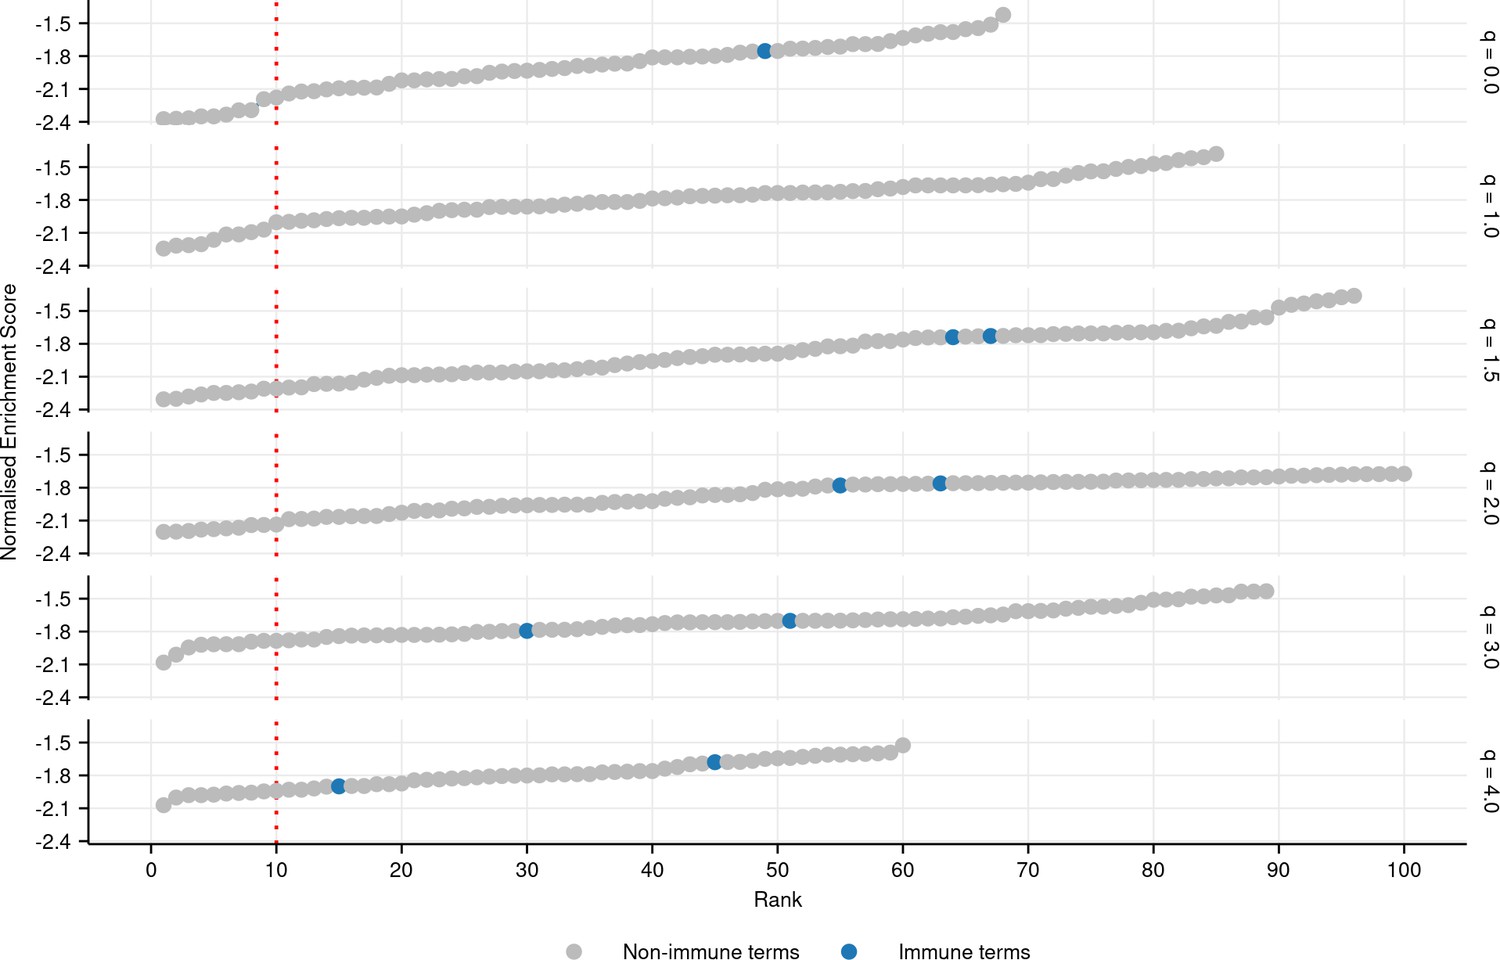
Plot of all significantly negatively enriched gene ontology (GO) terms (FDR-adjusted p-value ≤ 0.05) associated with each diversity order in turquoise killifish, controlling for age, ranked by normalized enrichment score in ascending order (Materials and methods).
Immune terms are highlighted in blue.
Appendix 1—figure 1
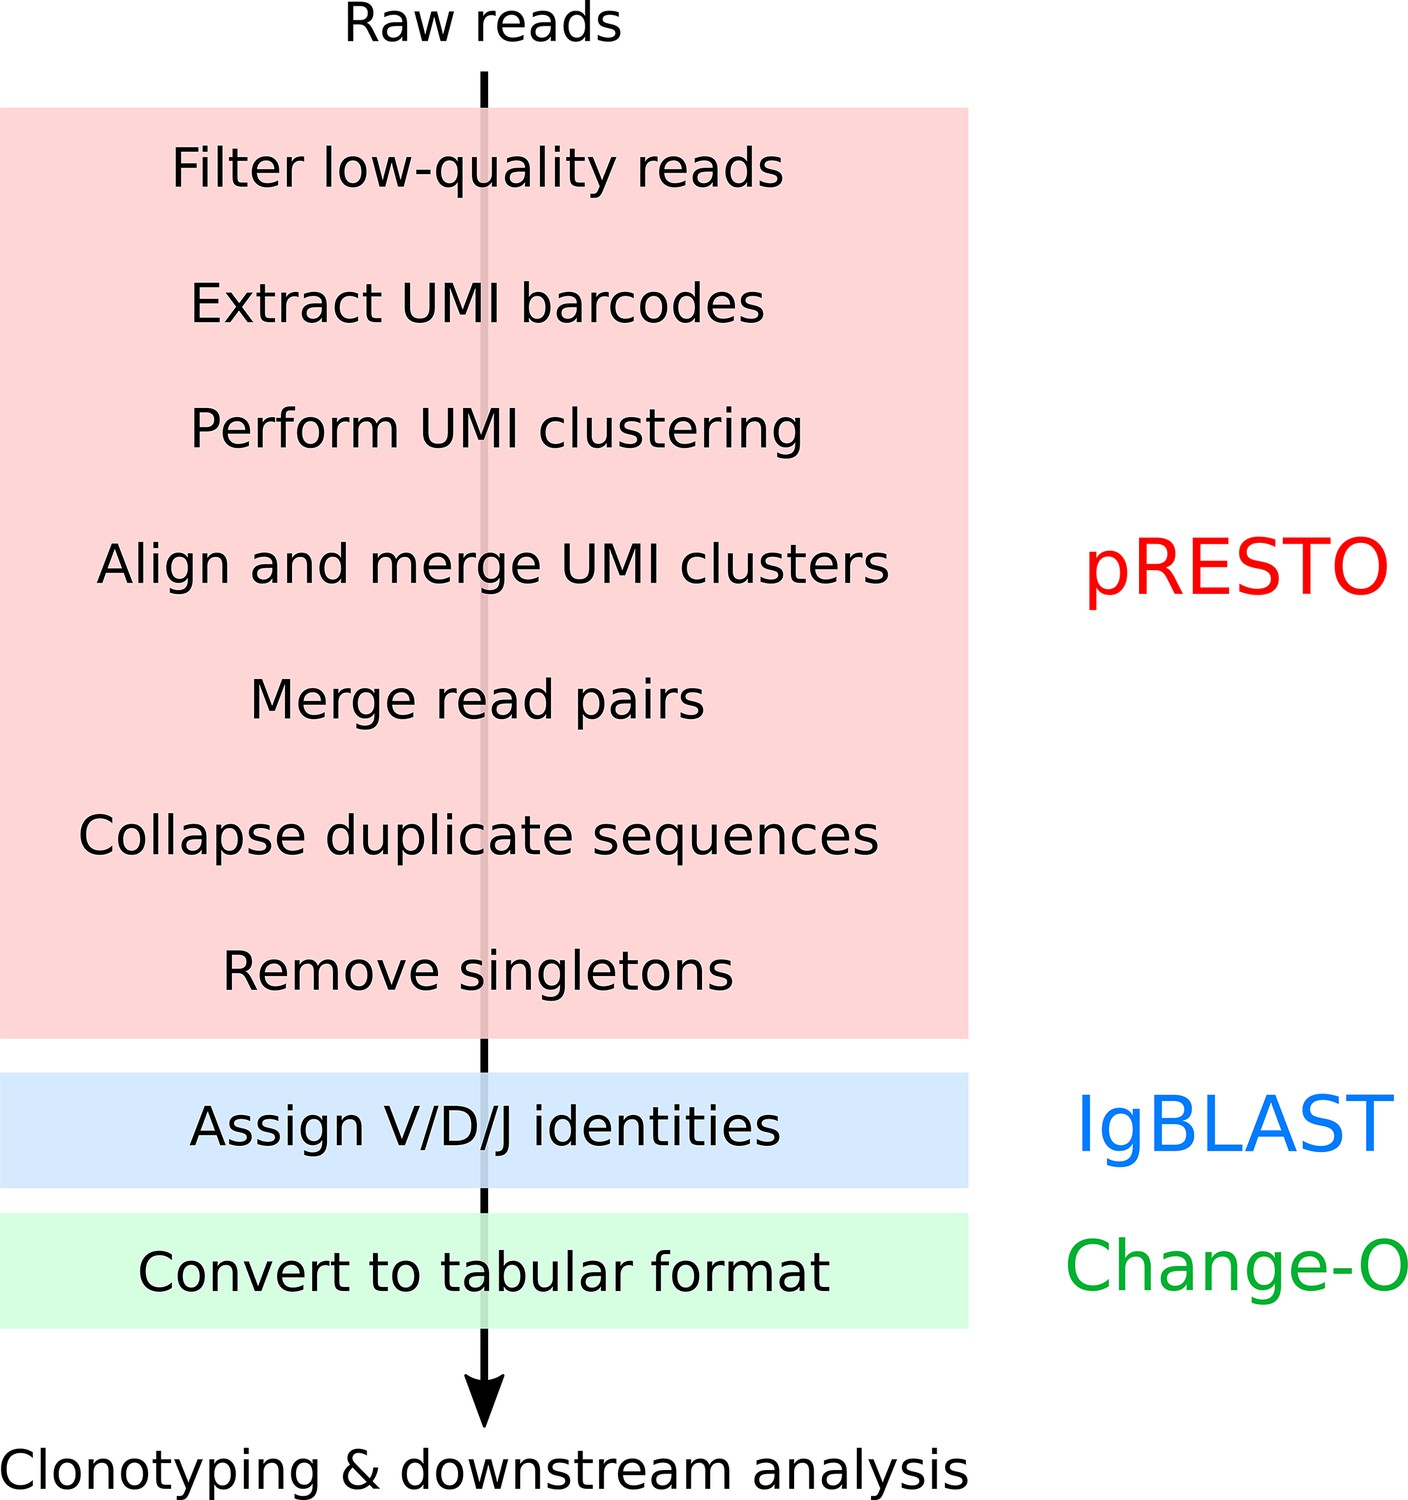
Summary of pre-processing pipeline applied to killifish repertoire-sequencing data (Appendix 1—note 6).
Appendix 1—figure 2

The SmartNNNa template-switch adapter.
Annotated sequence of the SmartNNNa barcoded template-switch adapter (TSA) used in template-switch reverse transcription for immunoglobulin-sequencing library preparation (Turchaninova et al., 2016). The 5’-terminal pink characters represent an invariant sequence used for primer-binding in downstream PCR steps, while the gray N characters represent the random nucleotides constituting the unique molecular identifier (UMI), each of which could take any value from A, C, G, or T. The blue U residues represent deoxyuridine, which is specifically digested after reverse transcription to remove residual TSA oligos from the reaction mixture. The orange, 3’-terminal rG characters indicate riboguanosine residues, which pair with terminal-transferase added cytidine residues to enable template switching.
Additional files
-
Supplementary file 1
Software versions used in computational analyses.
- https://cdn.elifesciences.org/articles/65117/elife-65117-supp1-v2.xlsx
-
Supplementary file 2
Summary of killifish used in the study.
(a) Summary of killifish used in IgSeq pilot and aging experiments. All fish are GRZ-AD strain and male, and hatched on May 9, 2016. (b) Summary of killifish used in IgSeq gut-microbiota transfer experiment. All fish are GRZ-Bellemans strain and male. (c) IDs and death weights of all individual turquoise killifish used in IgSeq aging experiment (a). (d) Individual killifish samples used in IgSeq gut-microbiota transfer (b).
- https://cdn.elifesciences.org/articles/65117/elife-65117-supp2-v2.xlsx
-
Supplementary file 3
Gene Ontology analysis.
(a) Gene ontology (GO) terms identified by gene set enrichment analysis as being significantly associated with killifish repertoire diversity, controlling for age, in at least four different diversity orders. Ranks are determined based on absolute normalized enrichment value (NES), and reported both for all significantly enriched GO terms and for positively enriched terms only. Reported p-values have been adjusted for multiple testing using the Benjamini-Hochberg method (Benjamini and Hochberg, 1995) (Materials and methods). NES, rank, and p-value are summarized across all diversity orders for which a given GO term is significantly enriched, reported as mean ± standard deviation. (b) Parent terms used to identify immune-associated GO terms. Any term that is a descendant of any of these terms was identified as an immune term.
- https://cdn.elifesciences.org/articles/65117/elife-65117-supp3-v2.xlsx
-
Supplementary file 4
PCR conditions.
(a) Master-mix components for reverse transcription reaction used in library preparation protocol (per sample). (b) Overall PCR thermocycler protocol for library preparation protocol (see (c) for missing parameter values). (c) Specific PCR protocols used for different stages of Nothobranchius furzeri immunoglobulin sequencing library preparation protocol (see (d) for overall thermocycler protocol and Supplemental (d) for cycle numbers). See Supplementary file 5a for sequence information. If the number of samples to be sequenced was small, all volumes of PCR three were doubled for a 50 μl total PCR volume. The stated volumes apply separately to both forward and reverse primers for each reaction. All primers were diluted to and stored at an initial concentration of 10 μM. See Supplemental (d) for specific cycle numbers used in each experiment. (d) PCR cycle numbers during N. furzeri IgSeq library preparation protocol (b–c). (e) Bead cleanups during N. furzeri IgSeq library preparation protocol. Each bead cleanup takes place immediately after its corresponding stage. Bead volumes are usually given as multiples of the sample volume. All elutions performed in the specified volume of elution buffer (10 mM Tris-HCl, pH 8.5). If the PCR three reaction volume differed from 25 μl, bead and elution volumes were rescaled proportionally to sample volume as appropriate. In each experiment, samples were pooled in equimolar ratio, so the input volume depended on the number of samples and the concentration of the libraries.
- https://cdn.elifesciences.org/articles/65117/elife-65117-supp4-v2.xlsx
-
Supplementary file 5
Primers and oligonucleotides used across the study.
(a) Primers and oligonucleotides used in Nothobranchius furzeri IgSeq library preparation protocol. See Appendix 1—figure 2 for more information about the structure of the template-switch adapter. For each P2 oligo (D701-D712), the N characters are replaced by the appropriate Illumina i7 index sequence from (c). For each P1 oligo (D501-D508), the highlighted N characters are replaced by the appropriate Illumina i5 index sequence from (d). The template-switch adapter and primer sequences homologous to it (M1SS and M1S) were provided by Turchaninova et al., 2016, while those homologous to constant-region exons (GSP, IGH-B, and IGH-C) were designed using Primer3 (Untergasser et al., 2012). (b) i5 index sequences. (c) i7 index sequences.
- https://cdn.elifesciences.org/articles/65117/elife-65117-supp5-v2.xlsx
-
Transparent reporting form
- https://cdn.elifesciences.org/articles/65117/elife-65117-transrepform1-v2.pdf
Download links
A two-part list of links to download the article, or parts of the article, in various formats.
Downloads (link to download the article as PDF)
Open citations (links to open the citations from this article in various online reference manager services)
Cite this article (links to download the citations from this article in formats compatible with various reference manager tools)
Extensive age-dependent loss of antibody diversity in naturally short-lived turquoise killifish
eLife 11:e65117.
https://doi.org/10.7554/eLife.65117


