Intronic enhancer region governs transcript-specific Bdnf expression in rodent neurons
- Department of Chemistry and Biotechnology, Tallinn University of Technology, Estonia
- Protobios LLC, Estonia
- Centre for Developmental Neurobiology, King’s College London, United Kingdom
Figures
Figure 1 with 2 supplements
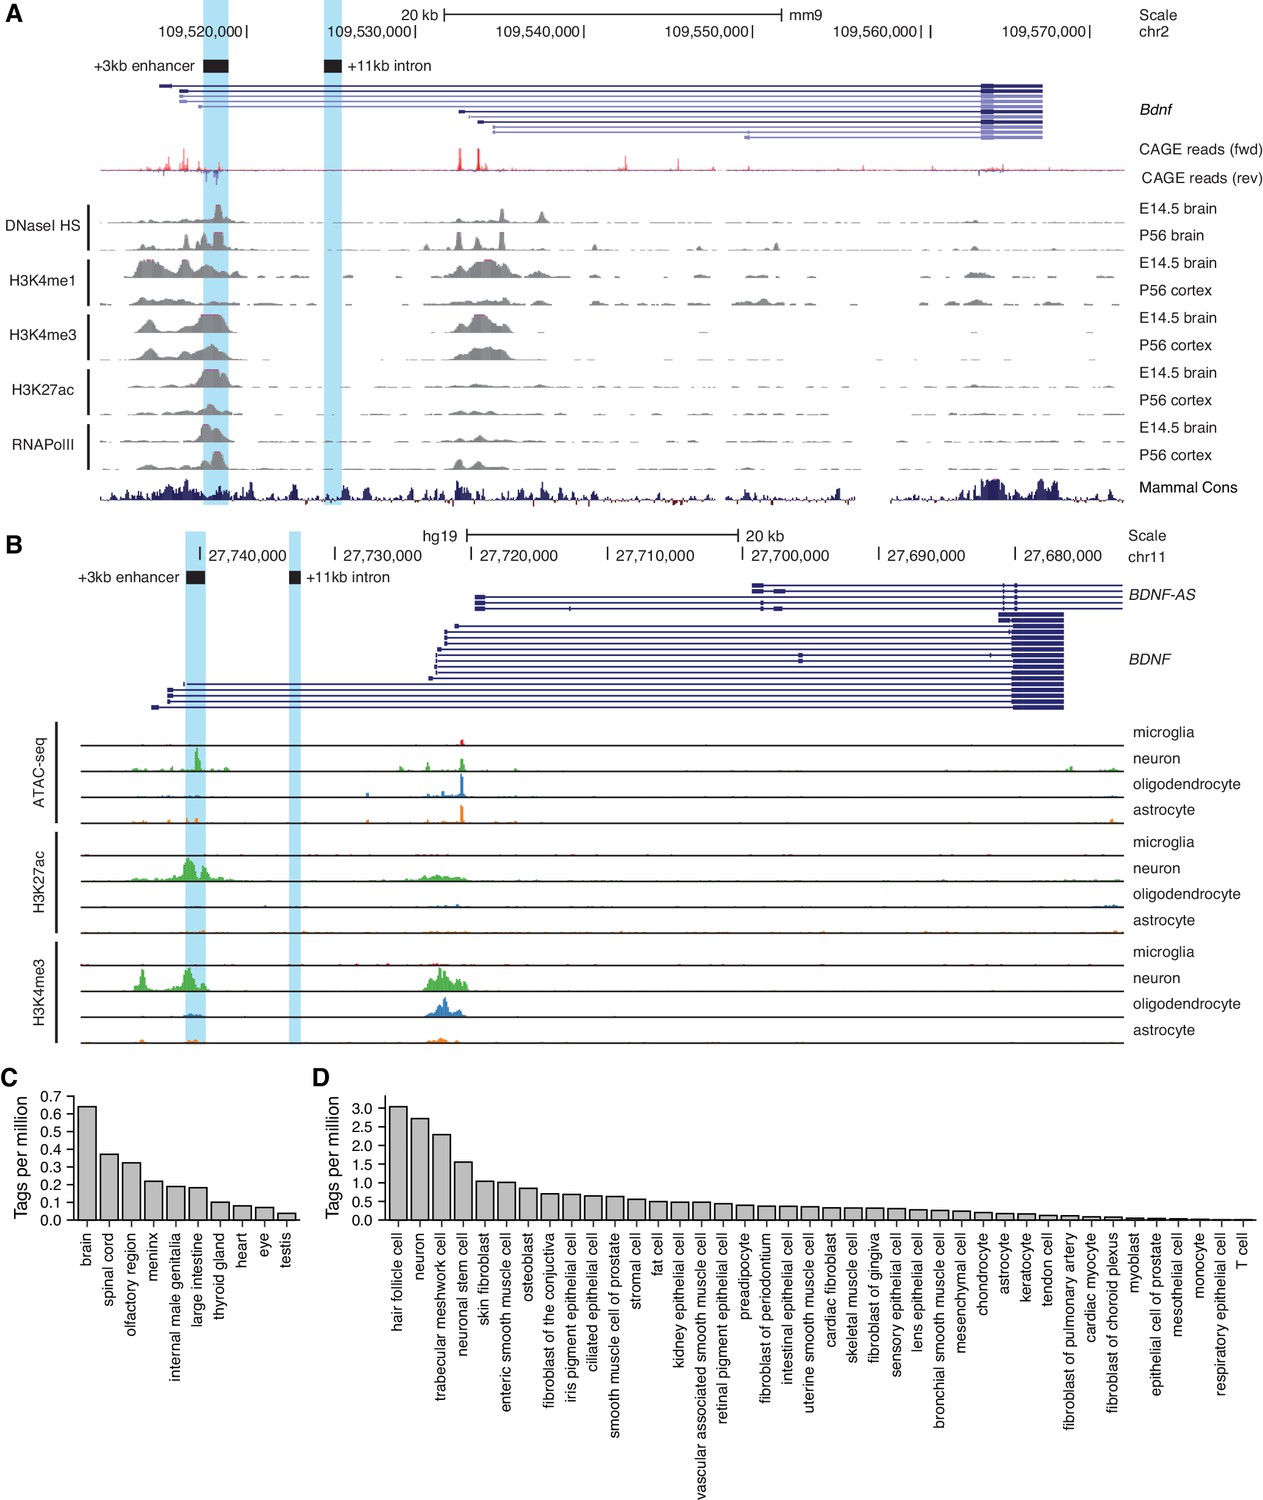
Region downstream of Bdnf exon III shows enhancer-associated characteristics in mouse and human neural tissues.
UCSC Genome browser was used to visualize (A) DNaseI hypersensitivity sites and ChIP-seq data from the ENCODE project in mouse brain tissue, CAGE data of transcription start sites from the FANTOM5 project (all tissues and cell types), and (B) open chromatin (ATAC-seq) and ChIP-seq in different human brain cell types by Nott et al., 2019. E indicates embryonic day, P postnatal day. Signal clipping outside the visualization range is indicated with purple color. The +3 kb region, a potential enhancer of the Bdnf gene, and +11 kb intronic region, a negative control region used in the present study, were converted from rat genome to mouse or human genome using UCSC Liftover tool and are shown as light blue. The names of the regions represent the distance of the respective region from rat Bdnf exon I transcription start site. (C, D) +3 kb enhancer region (chr11:27693843–27694020, hg19 genome build) enhancer RNA (eRNA) expression levels based on CAGE sequencing data from the FANTOM5 project obtained from the Slidebase tool (Ienasescu et al., 2016, http://slidebase.binf.ku.dk). eRNA expression levels were grouped by different tissue types (C) or cell types (D). Only tissue and cell types with non-zero eRNA expression are shown.
Figure 1—figure supplement 1
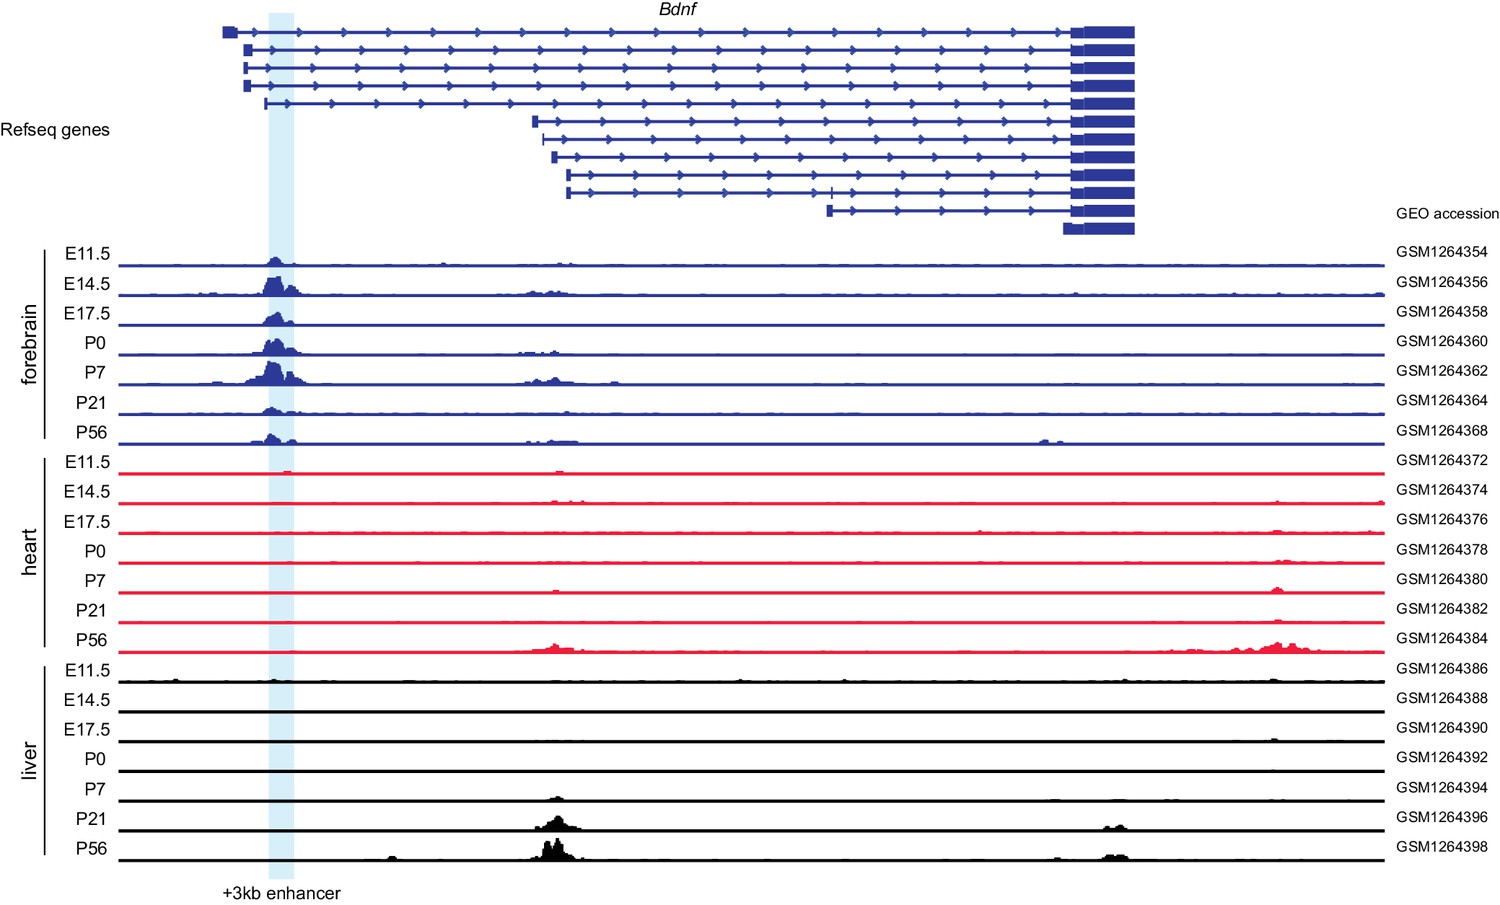
The +3 kb enhancer region shows brain-specific H3K27ac histone modification.
Integrative Genomics Viewer was used to visualize H3K27ac ChIP-seq data of different mouse tissues throughout the development (Nord et al., 2013). Different Bdnf transcripts are shown in the upper part of the figure, developmental stage and tissue are shown on the left. E indicates embryonic day, P postnatal day. +3 kb enhancer region is marked with light blue. Gene Expression Omnibus (GEO) accession numbers of the data are shown on the right.
Figure 1—figure supplement 2
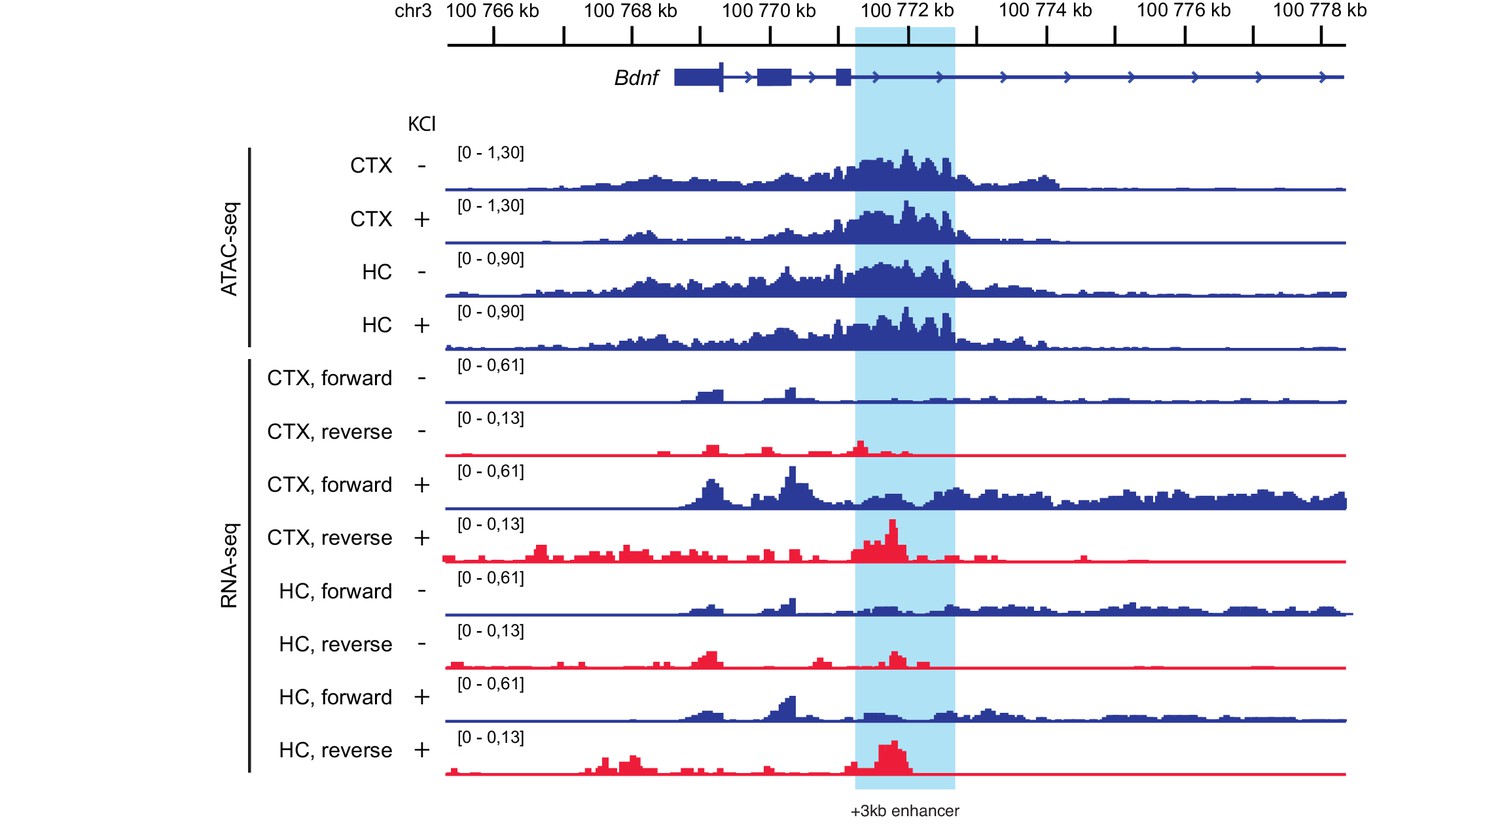
The +3 kb enhancer region shows open chromatin structure and enhancer RNA (eRNA) expression in rat cultured neurons.
Integrative Genomics Viewer was used to visualize ATAC-seq and RNA-seq data from cultured cortical (CTX) or hippocampal (HC) neurons treated with 10 mM KCl for 1 hr where indicated with ‘+' (data obtained from Carullo et al., 2020). +3 kb enhancer region is marked with light blue. RNA-seq data from the forward and reverse strand is depicted in blue and red, respectively. Note that forward and reverse strand signals have different data range for clearer visualization. Only antisense eRNA can be detected, possibly due to Bdnf pre-mRNA signal masking the expression of sense eRNA.
Figure 2

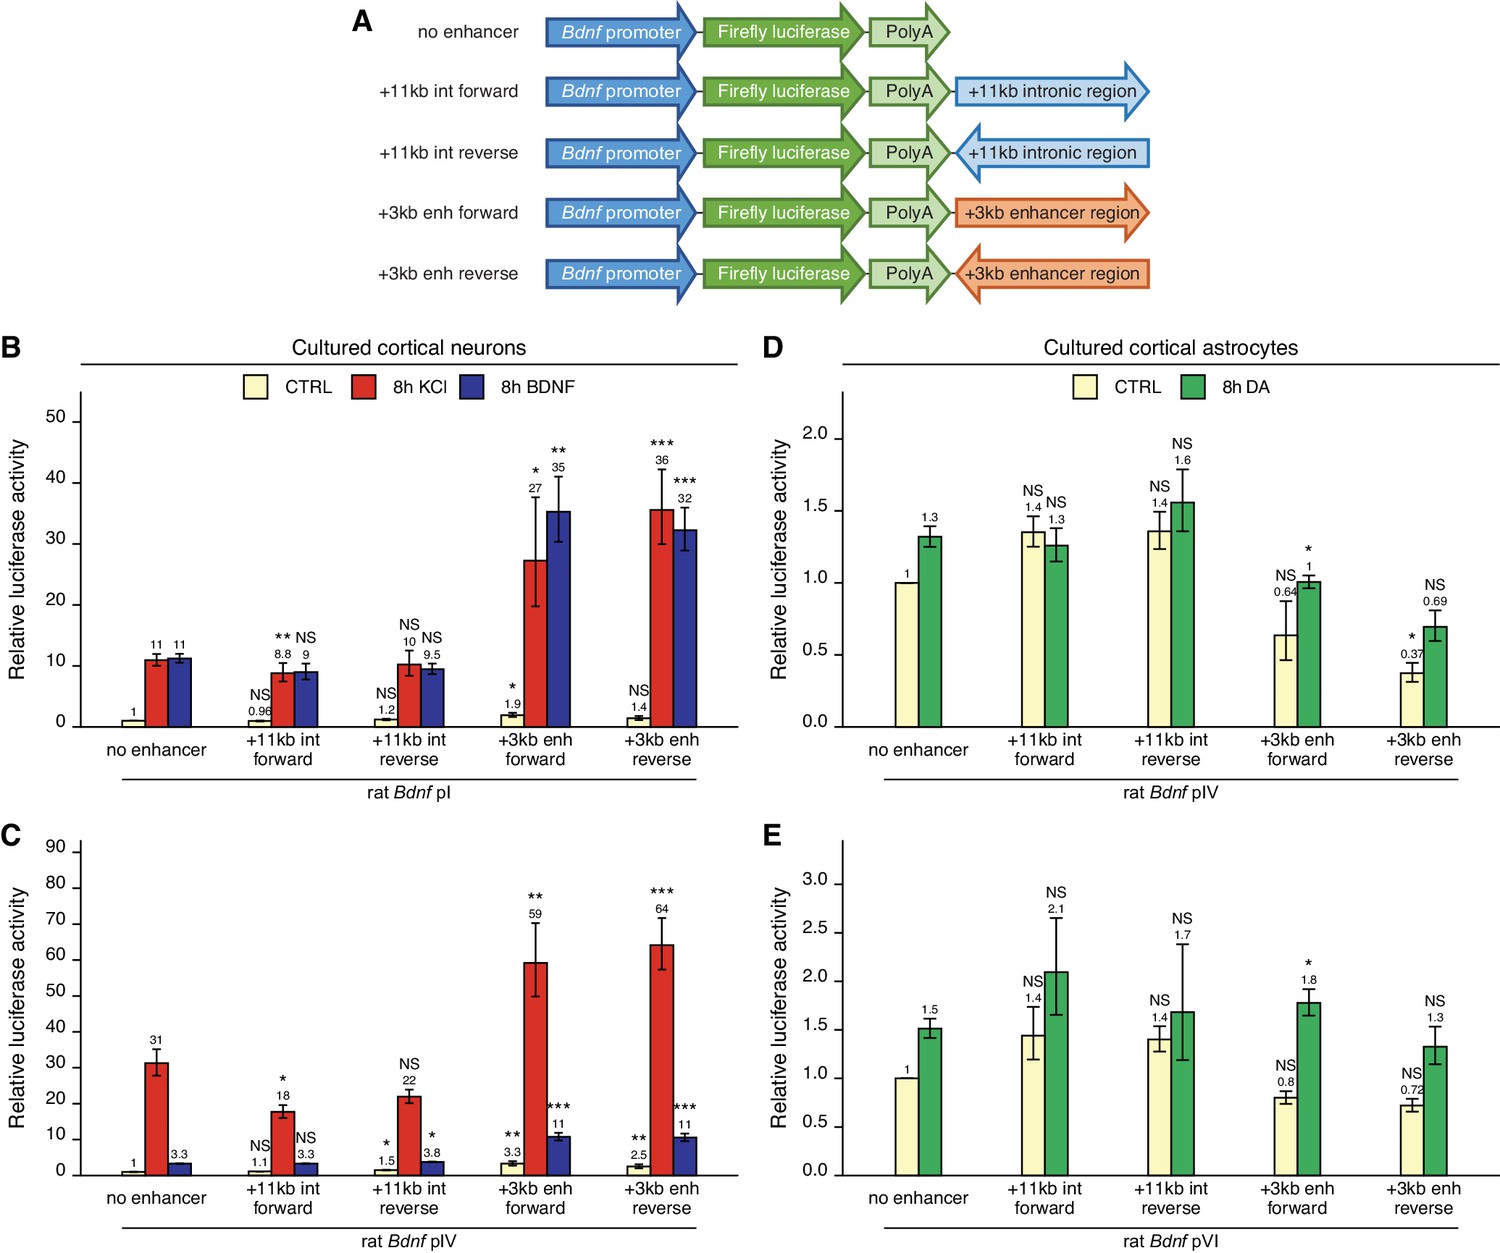
The +3 kb enhancer region shows bidirectional transcription in luciferase reporter assay in rat cultured cortical neurons and astrocytes.
(A) Reporter constructs used in the luciferase reporter assay where the +3 kb enhancer region and the +11 kb control region were cloned in either forward or reverse orientation (respective to the rat Bdnf gene) in front of the luciferase expression cassette. (B, C) Rat cortical neurons (B) or astrocytes (C) were transfected with the indicated reporter constructs at 6 and 13 DIV, respectively. Two days post-transfection, neurons were left untreated (CTRL) or treated with 25 mM KCl (with 5 µM D-APV) or 50 ng/ml brain-derived neurotrophic factor (BDNF) for the indicated time (B); astrocytes were treated with 150 µM dopamine (DA) or respective volume of vehicle (CTRL) for the indicated time (C), after which luciferase activity was measured. Luciferase activity in cells transfected with a vector containing no promoter and treated with vehicle or left untreated was set as 1. The average luciferase activity of independent experiments is depicted above the columns. Error bars indicate SEM (n = 7 [B, +3 kb enhancer constructs and no promoter construct], n = 3 [B, intron constructs], and n = 4 [C] independent experiments). Asterisks above the columns indicate statistical significance relative to luciferase activity in untreated cells transfected with the reporter vector containing no promoter, or between indicated groups. NS: not significant. *p<0.05, **p<0.01, ***p<0.001 (paired two-tailed t-test).
Figure 3
The +3 kb enhancer region potentiates the activity of Bdnf promoters in luciferase reporter assay in rat cortical neurons but not in astrocytes.
(A) A diagram of the luciferase reporter constructs used in this experiment, with a Bdnf promoter in front of the firefly luciferase coding sequence and the +3 kb enhancer or +11 kb intronic region in either forward or reverse orientation (respective to the rat Bdnf gene) downstream of the luciferase expression cassette. Rat cortical neurons (B, C) or astrocytes (D, E) were transfected with the indicated reporter constructs at 6 and 13 DIV, respectively. Two days post transfection, neurons were left untreated (CTRL) or treated with 25 mM KCl (with 5 µM D-APV) or 50 ng/ml brain-derived neurotrophic factor (BDNF) for 8 hr (B, C); astrocytes were treated with 150 µM dopamine (DA) or respective volume of vehicle (CTRL) for 8 hr (D, E), followed by luciferase activity assay. Luciferase activity is depicted relative to the luciferase activity in untreated or vehicle-treated (CTRL) cells transfected with respective Bdnf promoter construct without an enhancer region. The average luciferase activity of independent experiments is shown above the columns. Error bars represent SEM (n = 6 [B, +3 kb enhancer-containing constructs and no enhancer construct], n = 3 [B, + 11 kb intron constructs], n = 4 [C], and n = 3 [D–E] independent experiments). Statistical significance was calculated compared to the activity of the respective Bdnf promoter regions without the enhancer region after the respective treatment. NS: not significant. *p<0.05, **p<0.01, ***p<0.001 (paired two-tailed t-test).
Figure 4 with 2 supplements
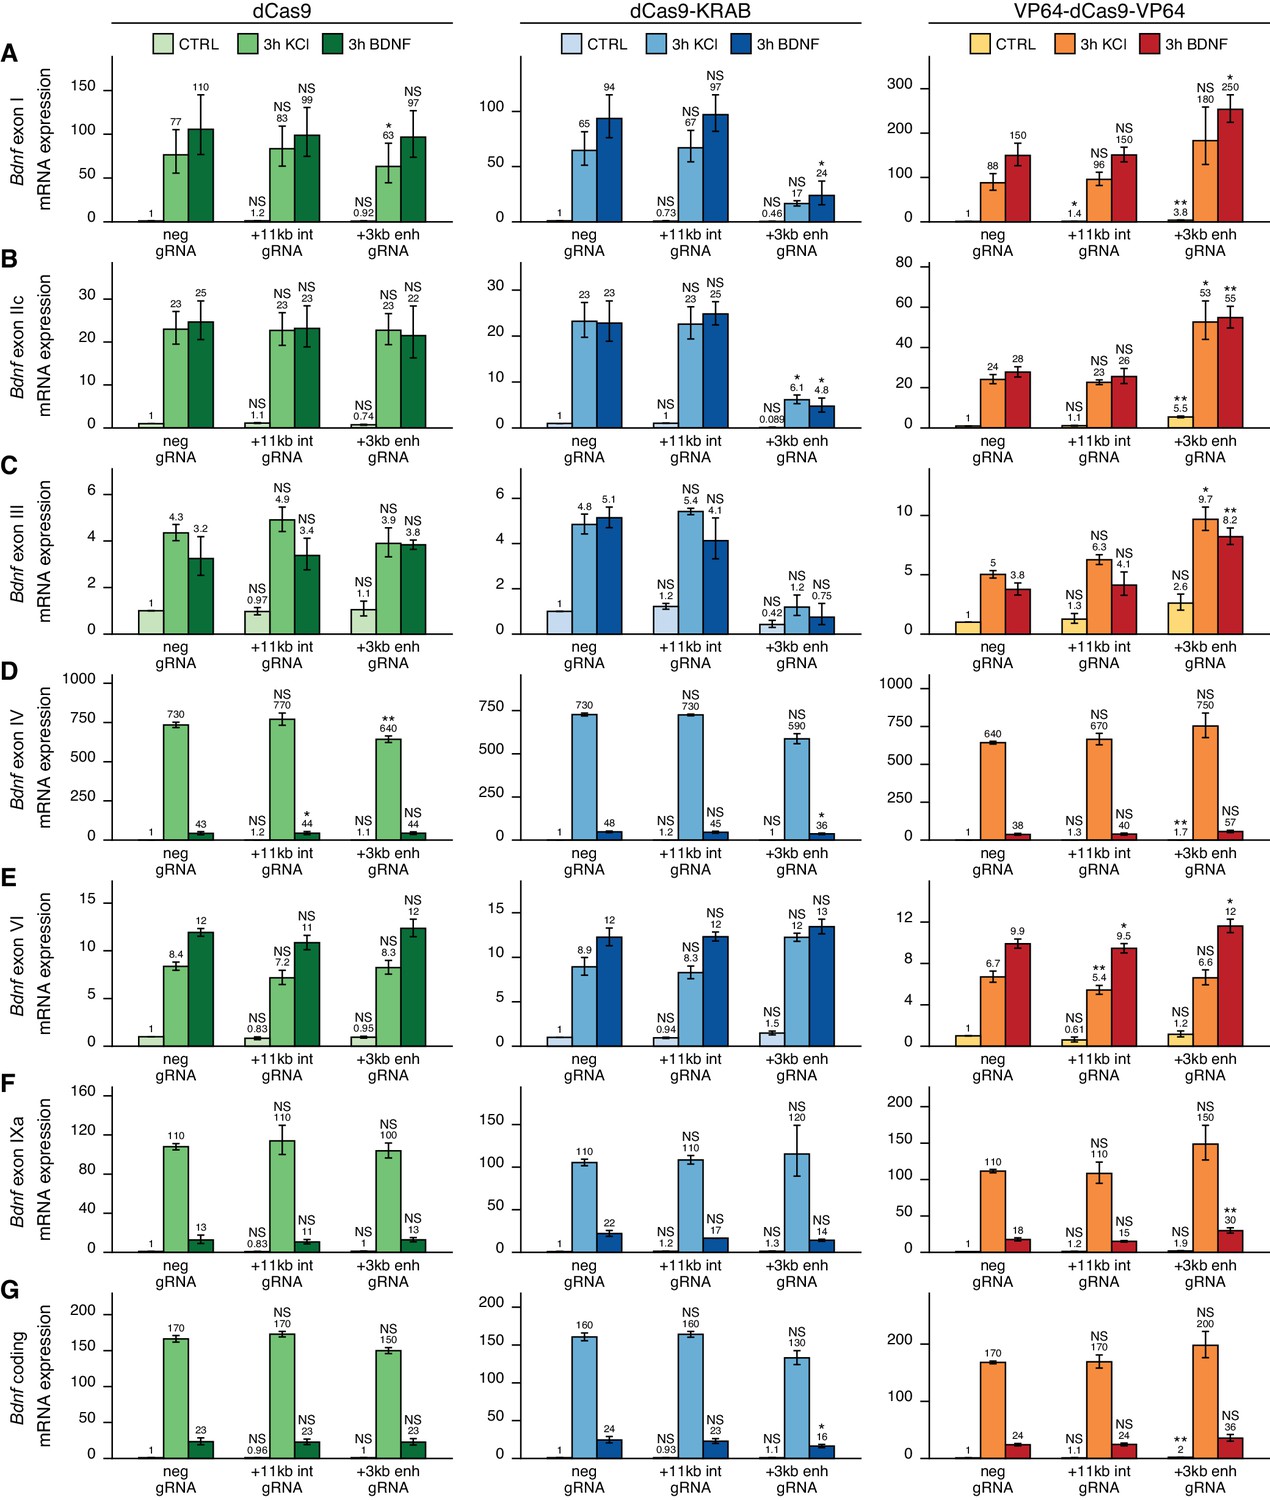
The +3 kb enhancer is a positive regulator of Bdnf exon I-, IIc-, and III-containing transcripts in rat cortical neurons.
Rat cultured cortical neurons were transduced at 0 DIV with lentiviral particles encoding either catalytically inactive Cas9 (dCas9, left panel, green), dCas9 fused with Krüppel-associated box domain (dCas9-KRAB, middle panel, blue), or 8 copies of VP16 activator domain (VP64-dCas9-VP64, right panel, orange), together with lentiviruses encoding either guide RNA that has no corresponding target sequence in the rat genome (neg gRNA), a mixture of four gRNAs directed to the putative +3 kb Bdnf enhancer (+3 kb enh gRNA), or a mixture of four gRNAs directed to +11 kb intronic region (+11 kb int gRNA). Transduced neurons were left untreated (CTRL) or treated with 50 ng/ml brain-derived neurotrophic factor (BDNF) or 25 mM KCl (with 5 µM D-APV) for 3 hr at 8 DIV. Expression levels of different Bdnf transcripts (A-F) or total Bdnf (G) were measured with RT-qPCR. mRNA expression levels are depicted relative to the expression of the respective transcript in untreated (CTRL) neurons transduced with negative guide RNA within each set (dCas9, dCas9-KRAB, or VP64-dCas9-VP64). The average mRNA expression of independent experiments is depicted above the columns. Error bars represent SEM (n = 3 independent experiments). Statistical significance was calculated between the respective mRNA expression levels in respectively treated neurons transduced with neg gRNA within each set (dCas9, Cas9-KRAB, or VP64-dCas9-VP64). NS: not significant. *p<0.05, **p<0.01, ***p<0.001 (paired two-tailed t-test).
Figure 4—figure supplement 1
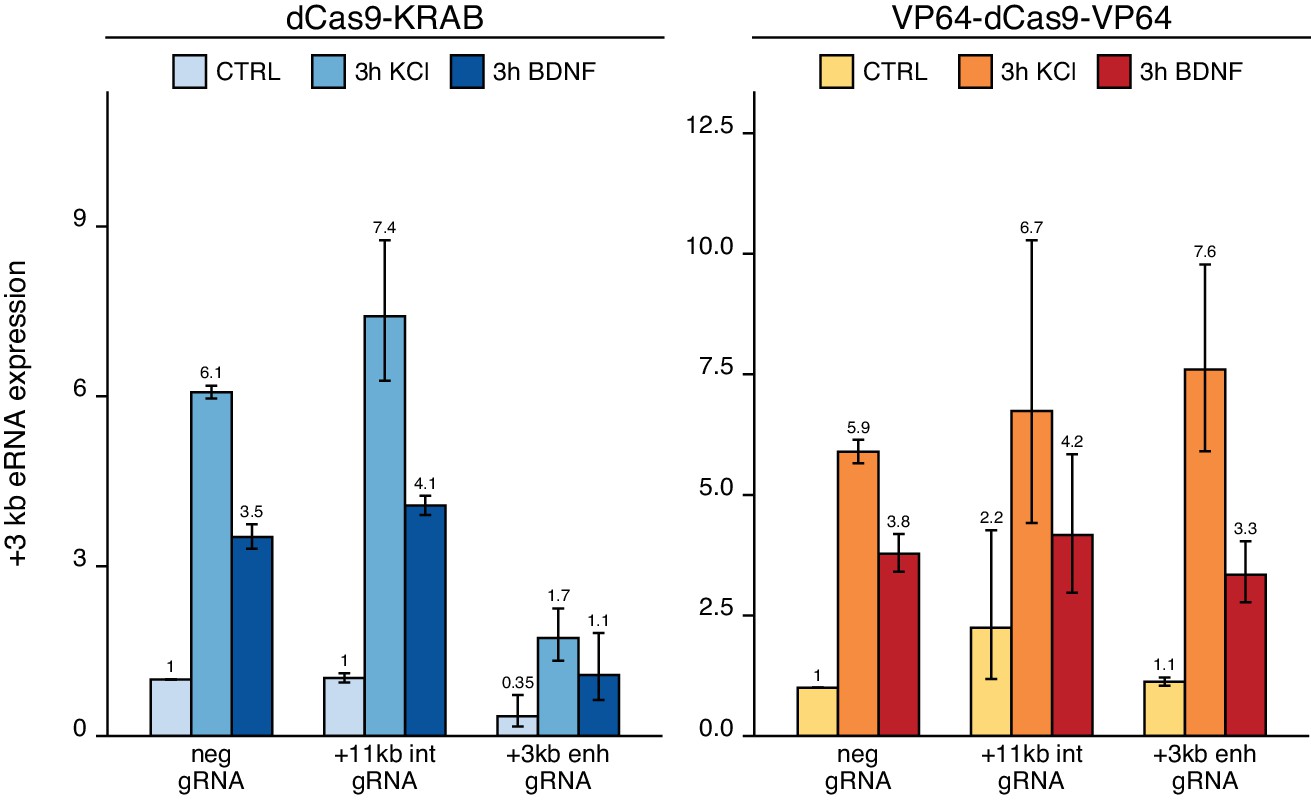
The +3 kb enhancer shows stimulus-dependent enhancer RNA (eRNA) transcription in neurons.
Measurement of +3 kb eRNA in CRISPRi and CRISPRa experiments in cultured neurons. Rat cultured cortical neurons were transduced at 0 DIV with lentiviral particles encoding either dCas9 fused with Krüppel-associated box domain (dCas9-KRAB, blue) or 8 copies of VP16 activator domain (VP64-dCas9-VP64, orange), together with lentiviruses encoding either guide RNA that has no corresponding target sequence in the rat genome (neg gRNA), a mixture of four gRNAs directed to the putative +3 kb Bdnf enhancer (+3 kb enh gRNA), or a mixture of four guide RNAs directed to +11 kb intronic region (+11 kb int gRNA). Transduced neurons were left untreated (CTRL) or treated with 50 ng/ml brain-derived neurotrophic factor (BDNF) or 25 mM KCl (with 5 µM D-APV) for 3 hr at 8 DIV. Expression levels of +3 kb eRNA were measured with RT-qPCR and normalized to Hprt1 expression levels. eRNA expression levels are depicted relative to the eRNA expression in untreated (CTRL) neurons transduced with negative guide RNA within each set (dCas9-KRAB or VP64-dCas9-VP64). The average eRNA expression of independent experiments is depicted above the columns. Error bars represent SEM (n = 2 independent experiments). No statistical analysis was performed.
Figure 4—figure supplement 2
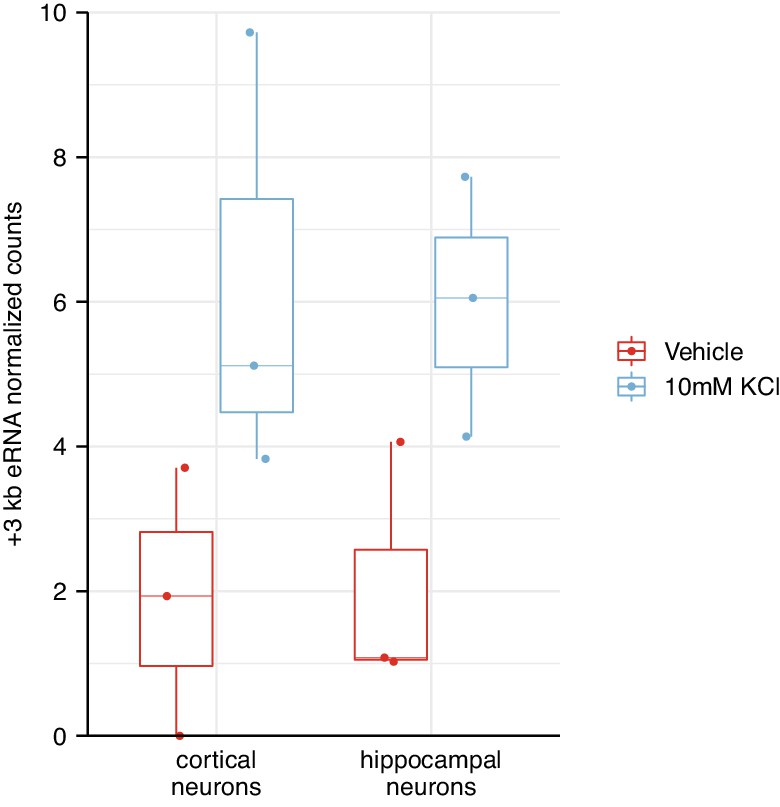
The +3 kb enhancer shows membrane depolarization-induced enhancer RNA (eRNA) transcription in rat cultured cortical and hippocampal neurons.
RNA-seq data from Carullo et al., 2020 was used to quantify the expression of the +3 kb region eRNA (see also Figure 1—figure supplement 1 for graphical representation). Rat cultured cortical and hippocampal neurons were treated with 10 mM KCl for 1 hr to induce membrane depolarization, after which RNA was extracted and subjected to sequencing. Only antisense eRNA could be quantified as the sense eRNA signal was masked by the expression of Bdnf pre-mRNA. Boxplots depict antisense eRNA levels as normalized counts. Each data point indicates individual biological replicate.
Figure 5 with 1 supplement
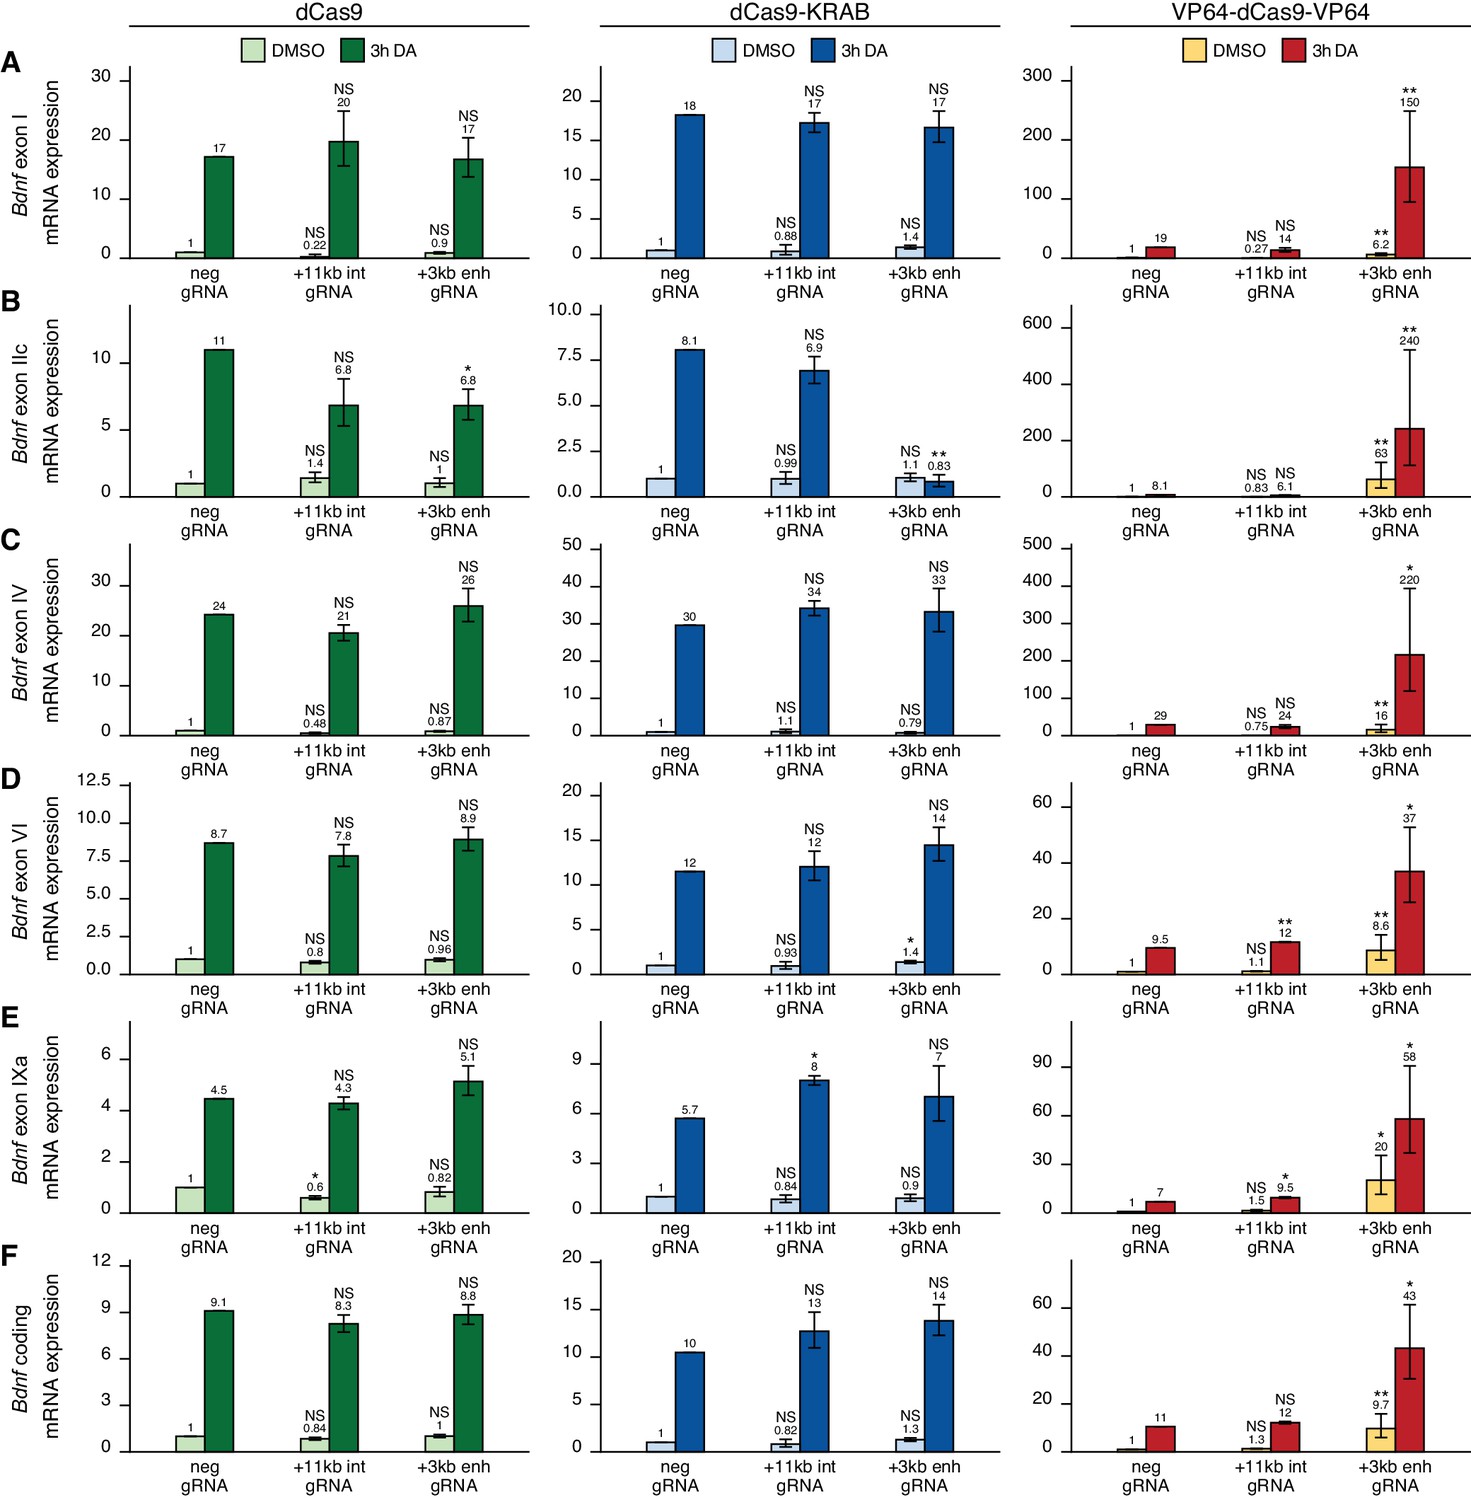
The +3 kb enhancer region is mainly inactive in rat cortical astrocytes.
Rat cultured cortical astrocytes were transduced at 7 DIV with lentiviral particles encoding either catalytically inactive Cas9 (dCas9, left panel, green), dCas9 fused with Krüppel-associated box domain (dCas9-KRAB, middle panel, blue), or 8 copies of VP16 activator domain (VP64-dCas9-VP64, right panel, orange), together with lentiviruses encoding either guide RNA that has no corresponding target sequence in the rat genome (neg gRNA), a mixture of four gRNAs directed to the putative +3 kb Bdnf enhancer (+3 kb enh gRNA), or a mixture of four guide RNAs directed to the + 11 kb intronic region (+11 kb int gRNA). Transduced astrocytes were treated with vehicle (CTRL) or with 150 µM dopamine (DA) for 3 hr at 15 DIV. Expression levels of different Bdnf transcripts (A-E) or total Bdnf (F) were measured with RT-qPCR. The levels of Bdnf exon III-containing transcripts were too low to measure reliably. mRNA expression levels are depicted relative to the expression of the respective transcript in astrocytes treated with vehicle (CTRL) transduced with negative guide RNA within each set (dCas9, dCas9-KRAB, or VP64-dCas9-VP64). The average mRNA expression of independent experiments is depicted above the columns. Error bars represent SEM (n = 3 independent experiments). Statistical significance was calculated between respective mRNA expression levels in respectively treated astrocytes transduced with neg gRNA within each set (dCas9, Cas9-KRAB, or VP64-dCas9-VP64). NS: not significant. *p<0.05, **p<0.01, ***p<0.001 (paired two-tailed t-test).
Figure 5—figure supplement 1
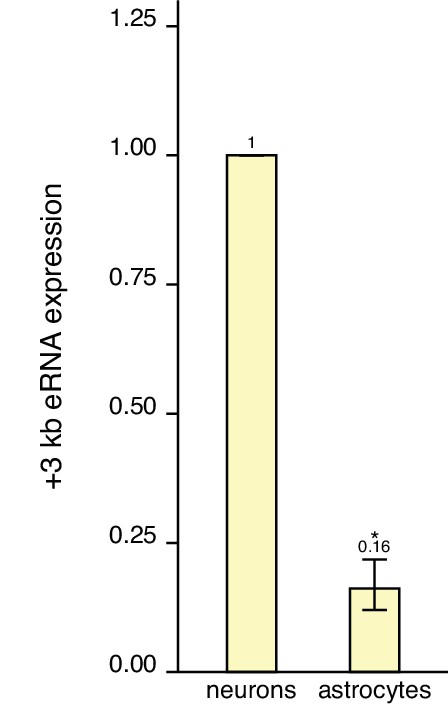
The +3 kb enhancer shows lower enhancer RNA (eRNA) expression in astrocytes than in neurons.
Comparison of +3 kb enhancer eRNA expression levels in rat cultured cortical neurons and astrocytes. eRNA expression from the antisense strand was measured using RT-qPCR, and unnormalized average Ct values were used for the analysis and transformed to linear scale for graphical representation. The +3 kb eRNA expression level in neurons was set as 1. The average eRNA expression of independent experiments is depicted above the columns. Error bars represent SEM (n = 3 independent experiments). *p<0.05 (paired two-tailed t-test).
Figure 6
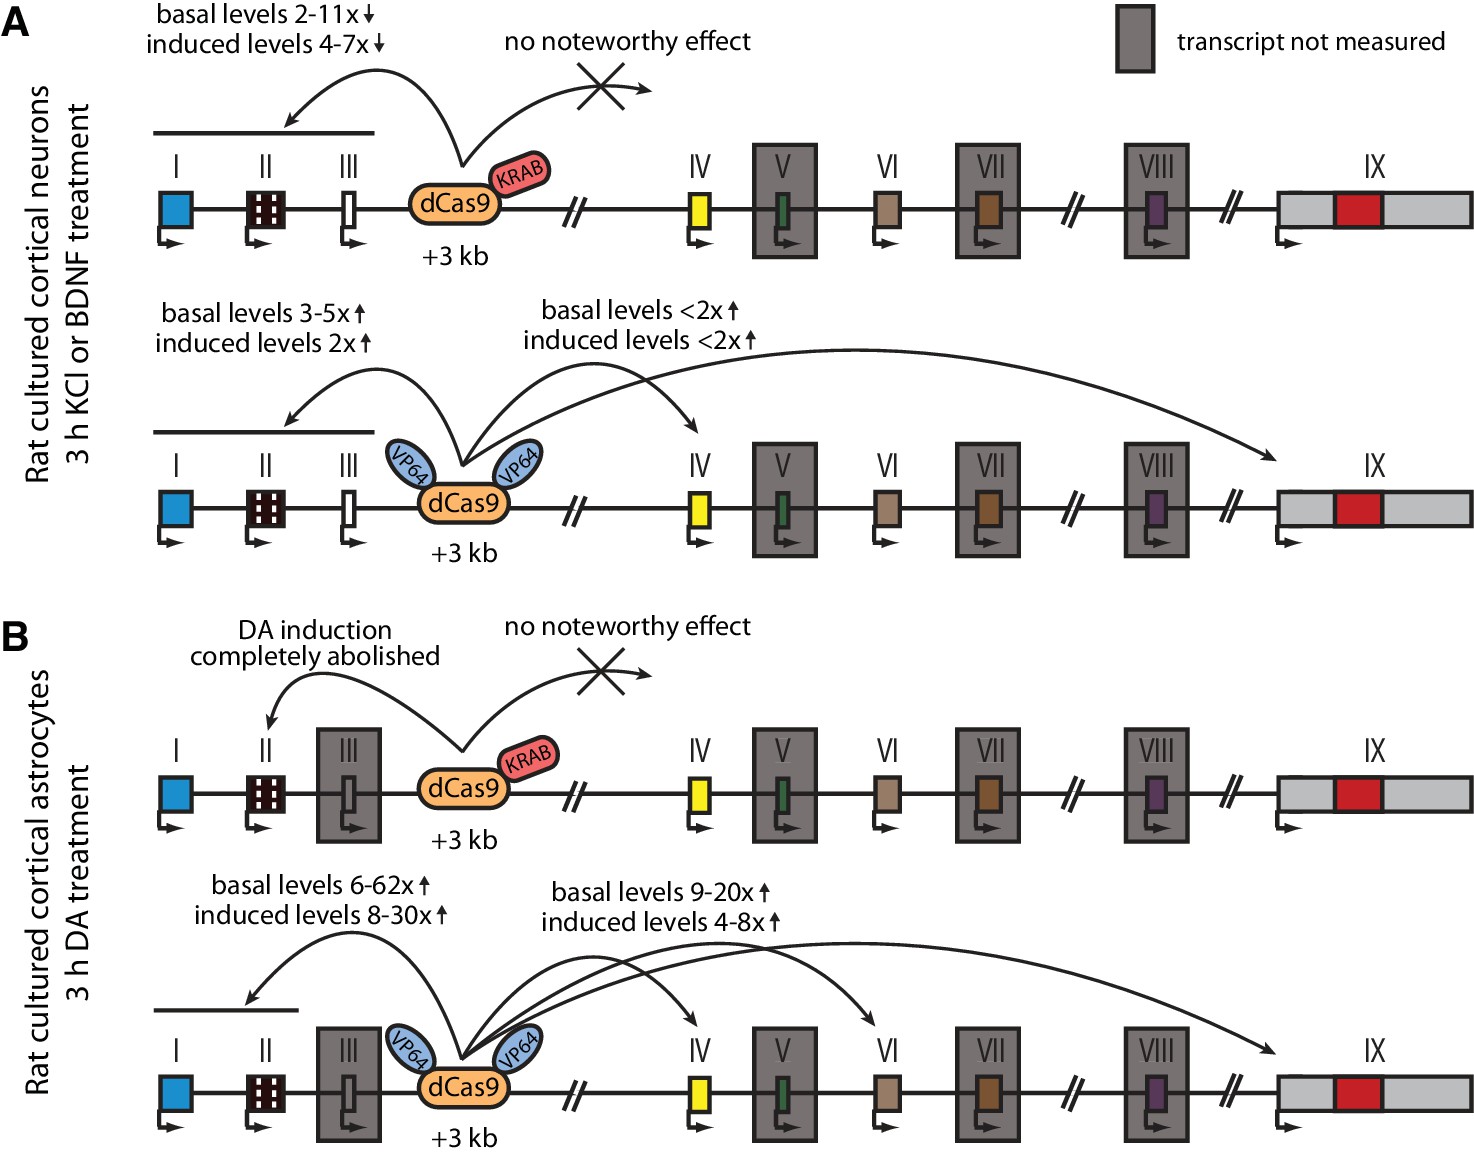
Summary of the CRISPRi and CRISPRa experiments with Bdnf +3 kb enhancer region in rat cultured cortical neurons and astrocytes.
Graphical representation of the main results shown in Figures 4 (A) and 5 (B). Different Bdnf exons are shown with boxes, and red box in exon IX indicates Bdnf coding region. Bdnf transcripts that were not measured or that had too low levels to measure reliably are indicated with a gray box around the respective 5' exon.
Figure 7 with 2 supplements

The deletion of the +3 kb enhancer region decreases the expression of Bdnf exon I-, IIc-, and III-containing transcripts in mouse embryonic stem cell (mESC)-derived neurons.
CRISPR/Cas9 system was used to generate mESC cell lines with ~300–500 bp deletions of the conserved core region of the +3 kb Bdnf enhancer. The obtained clonal cell lines containing intact +3 kb enhancer region (+/+), heterozygous deletion (+/–), or homozygous deletion (–/–) of the +3 kb enhancer region were differentiated into neurons using overexpression of Neurogenin2. After 12 days of differentiation, the cells were treated with vehicle (CTRL), 50 ng/ml brain-derived neurotrophic factor (BDNF) or 25 mM KCl together with 25 µM D-APV for 3 hr. The expression levels of different Bdnf transcripts (A-E) or total Bdnf (F) were measured using RT-qPCR. The levels of respective Bdnf transcripts measured in the parental cell line (also included as a data point in the +/+ group) were set as 1. All data points (obtained from independent cell clones and parental cell line) are depicted with circles. Box plot shows 25% and 75% quartiles, and the horizontal line shows the median value. N = 3–4 independent cell clones for each group. Statistical significance was calculated compared to the expression level of the respective transcript in the +/+ genotype group at respective treatment. NS: not significant. *p<0.05, **p<0.01, ***p<0.001 (equal variance unpaired t-test).
Figure 7—figure supplement 1
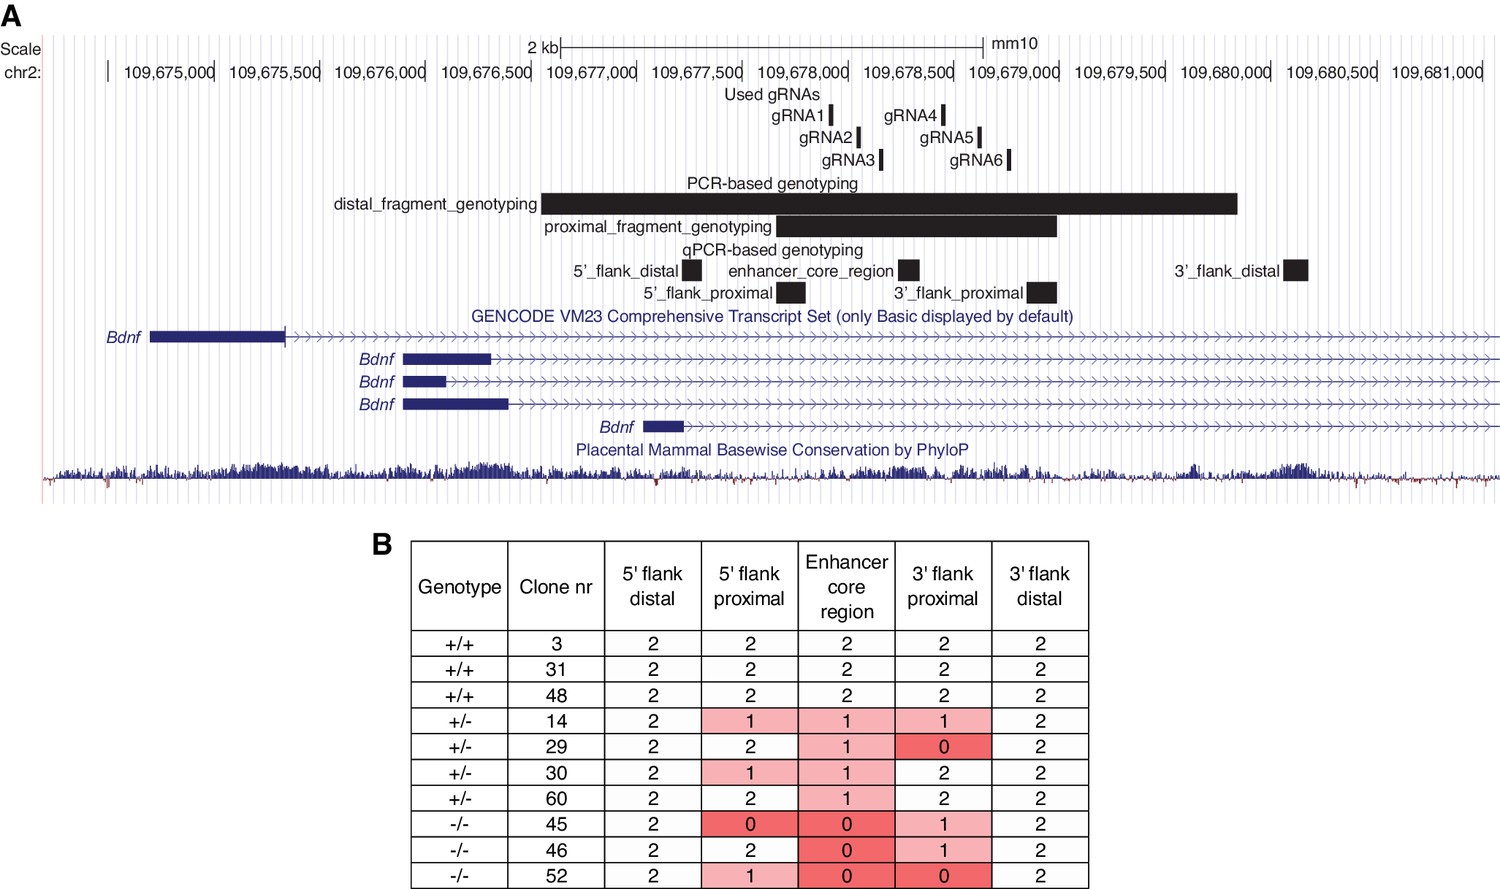
Verification of the deletion of the +3 kb enhancer region in mouse embryonic stem cell (mESC) clones.
(A) Genomic positions of the gRNA targeting sequences that were used for deleting the +3 kb enhancer region with CRISPR/Cas9, PCR amplicons used for agarose gel electrophoresis-based genotyping (results not shown), and qPCR amplicons used to determine copy numbers of the indicated regions. (B) Genotypes of the mESC clones used in this study determined by qPCR. The table shows copy numbers for the indicated regions. Only clones with intact 5' and 3' distal flanking regions were selected, and their genotype was assigned based on the copy number of the enhancer core region. Regions showing a deletion of one or two alleles are indicated with pink and red, respectively.
Figure 7—figure supplement 2
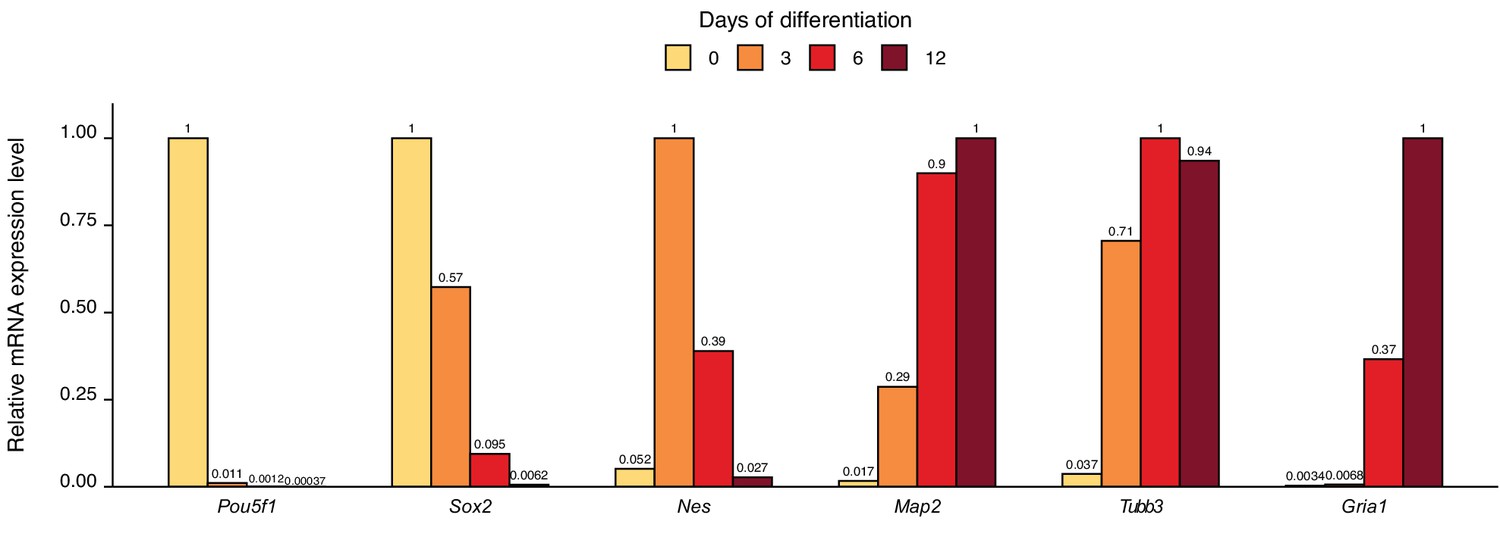
Characterization of mouse embryonic stem cell (mESC) differentiation into neurons.
A2Lox-Neurogenin2 mESCs were differentiated into neurons using doxycycline-induced expression of Neurogenin 2; RNA was extracted at the indicated days from the start of the differentiation; and RT-qPCR was used to measure mRNA levels of different stem cell and neuronal marker genes. Maximum expression level of the transcript during the differentiation time course was set as 1 for each transcript. Numbers above the columns indicate expression levels of the respective transcript. Note the decreasing expression of the stem cell markers Pou5f1 (encoding OCT4) and Sox2, transient upregulation of the neural progenitor marker Nes (encoding nestin), and increasing expression of neuronal markers Map2, Tubb3, and Gria1.
Figure 8 with 1 supplement
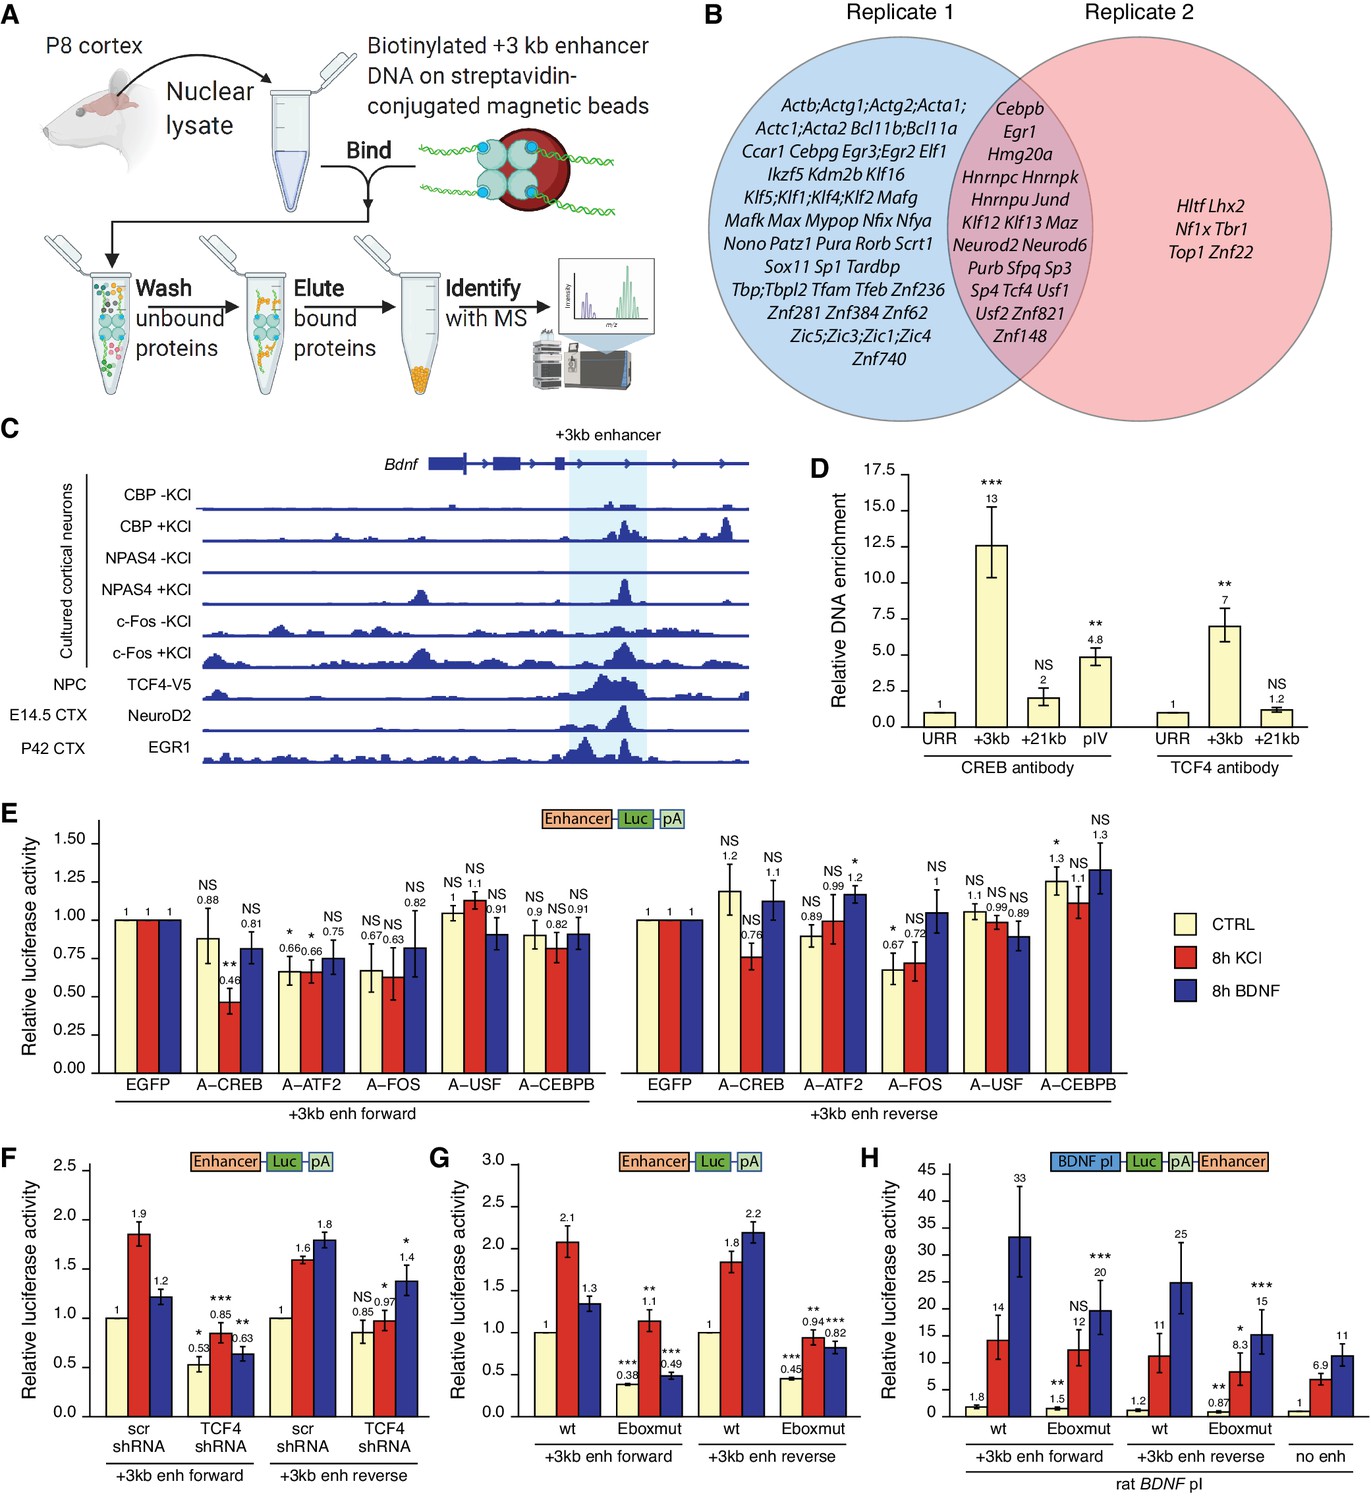
Various transcription factors, including CREB, AP-1 proteins, and E-box-binding transcription factors, regulate the activity of the +3 kb enhancer region.
(A) Schematic overview of the in vitro DNA pulldown assay to determine transcription factors binding to the +3 kb enhancer region. The illustration was created with BioRender.com. (B) Gene names of the transcription factors identified in the in vitro DNA pulldown assay in two biological replicates of postnatal day 8 (P8) rat cortices. Semicolon between gene names indicates uncertainty in the peptide to protein assignment between the genes separated by the semicolons. (C) Previously published ChIP-seq experiments showing binding of different transcription factors to the +3 kb enhancer region. (D) ChIP-qPCR assay in cultured cortical neurons at 8 DIV with anti-CREB or anti-TCF4 antibody. Enrichment is shown relative to the enrichment of unrelated region (URR) with the respective antibody. The +21 kb region (downstream of the Bdnf exon VII) was used as a negative control. pIV indicates Bdnf promoter IV region. (E–H) Rat cortical neurons were transfected at 5 DIV (F) or 6 DIV (E–H) with reporter constructs where the +3 kb enhancer region was cloned in front of the luciferase coding sequence (E–G, see also Figure 2A), or with reporter constructs where the +3 kb enhancer region was cloned downstream of the Bdnf promoter I-controlled firefly luciferase expression cassette (H, see Figure 3A). Schematic representations of the used reporter constructs are shown above the graphs, with Luc designating luciferase coding sequence and pA polyadenylation sequence. At 8 DIV, neurons were left untreated (CTRL) or treated with 25 mM KCl (with 5 µM D-APV) or 50 ng/ml brain-derived neurotrophic factor (BDNF) for the indicated time, after which luciferase activity was measured. Luciferase activity is depicted relative to the luciferase activity in respectively treated cells transfected with enhanced green fluorescent protein (EGFP)-encoding plasmid and the respective +3 kb enhancer construct (E), relative to the luciferase activity in untreated cells co-transfected with control shRNA (scr) and the respective +3 kb enhancer construct (F), relative to the luciferase activity in untreated cells transfected with the respective wild-type (wt) +3 kb enhancer construct (G), or relative to the luciferase activity in untreated cells transfected with rat Bdnf promoter I construct containing no enhancer region (H). Eboxmut indicates mutation of a putative E-box element in the +3 kb enhancer region. Numbers above the columns indicate average, error bars represent SEM (n = 4 [D, CREB antibody], n = 3 [D, TCF4 antibody], n = 5–6 [E], n = 4–5 [F], n = 4 [G], and n = 7 [H] independent experiments). Statistical significance was calculated compared to the ChIP enrichment of DNA at the URR region using respective antibody (D), compared to the luciferase activity in respectively treated cells transfected with the respective +3 kb enhancer construct and EGFP (E), scr shRNA (F), or the respective wt +3 kb enhancer construct (G, H). NS: not significant. *p<0.05, **p<0.01, ***p<0.001 (paired two-tailed t-test).
Figure 8—figure supplement 1
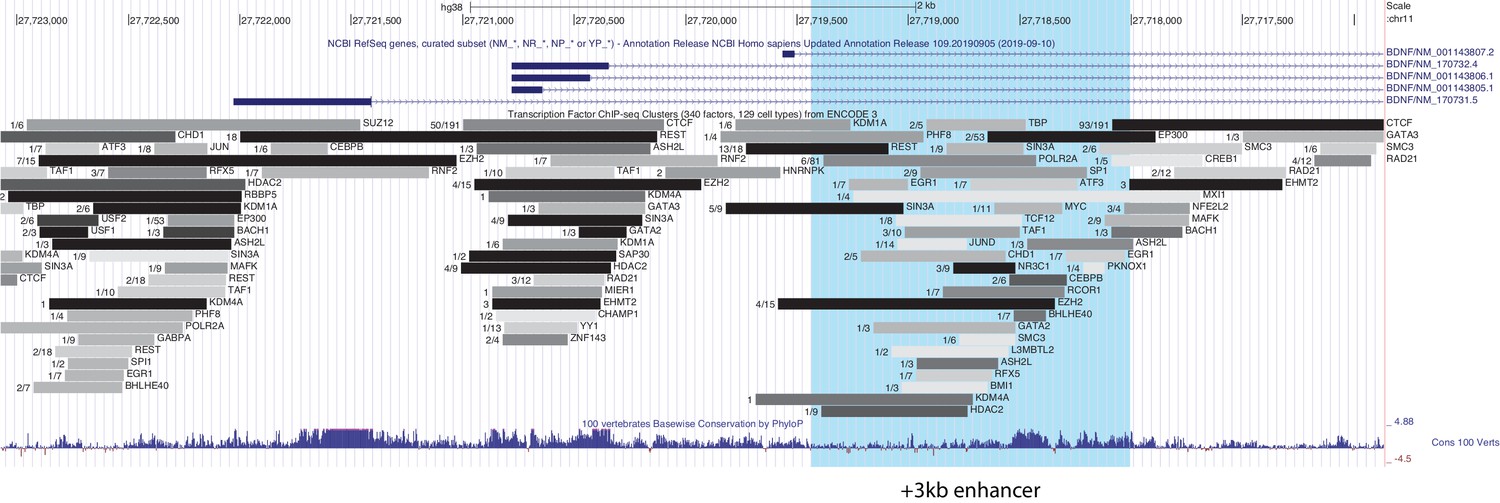
The +3 kb enhancer region binds various transcription factors in human cell lines.
UCSC Genome Browser was used to visualize ENCODE chromatin immunoprecipitation (ChIP-seq) data track ‘Transcription Factor ChIP-seq Peaks (340 factors in 129 cell types) from ENCODE 3 Data version: ENCODE 3 Nov 2018’ at the +3 kb enhancer region. Numbers indicate cell lines with binding of the indicated transcription factor/number of cell lines assayed for the binding of indicated transcription factor. The +3 kb enhancer region is shown in light blue.
Additional files
-
Supplementary file 1
List of used primers.
- https://cdn.elifesciences.org/articles/65161/elife-65161-supp1-v2.xlsx
-
Supplementary file 2
List of gRNA targeting sequences.
- https://cdn.elifesciences.org/articles/65161/elife-65161-supp2-v2.xlsx
-
Supplementary file 3
Mass-spectrometry results of the in vitro DNA pulldown experiment.
MaxQuant ProteinGroups tables of two biological replicates are shown in separate Excel sheets. Refer to the MaxQuant documentation (http://coxdocs.org/doku.php?id=maxquant:table:proteingrouptable) for detailed column descriptions.
- https://cdn.elifesciences.org/articles/65161/elife-65161-supp3-v2.xlsx
-
Transparent reporting form
- https://cdn.elifesciences.org/articles/65161/elife-65161-transrepform-v2.docx
Download links
A two-part list of links to download the article, or parts of the article, in various formats.
Downloads (link to download the article as PDF)
Open citations (links to open the citations from this article in various online reference manager services)
Cite this article (links to download the citations from this article in formats compatible with various reference manager tools)
Intronic enhancer region governs transcript-specific Bdnf expression in rodent neurons
eLife 10:e65161.
https://doi.org/10.7554/eLife.65161


