Neuropeptide ACP facilitates lipid oxidation and utilization during long-term flight in locusts
- State Key Laboratory of Integrated Management of Pest Insects and Rodents, Institute of Zoology, Chinese Academy of Sciences, China
- CAS Center for Excellence in Biotic Interactions, University of Chinese Academy of Sciences, China
- Beijing Institutes of Life Science, Chinese Academy of Sciences, China
Figures
Figure 1 with 7 supplements
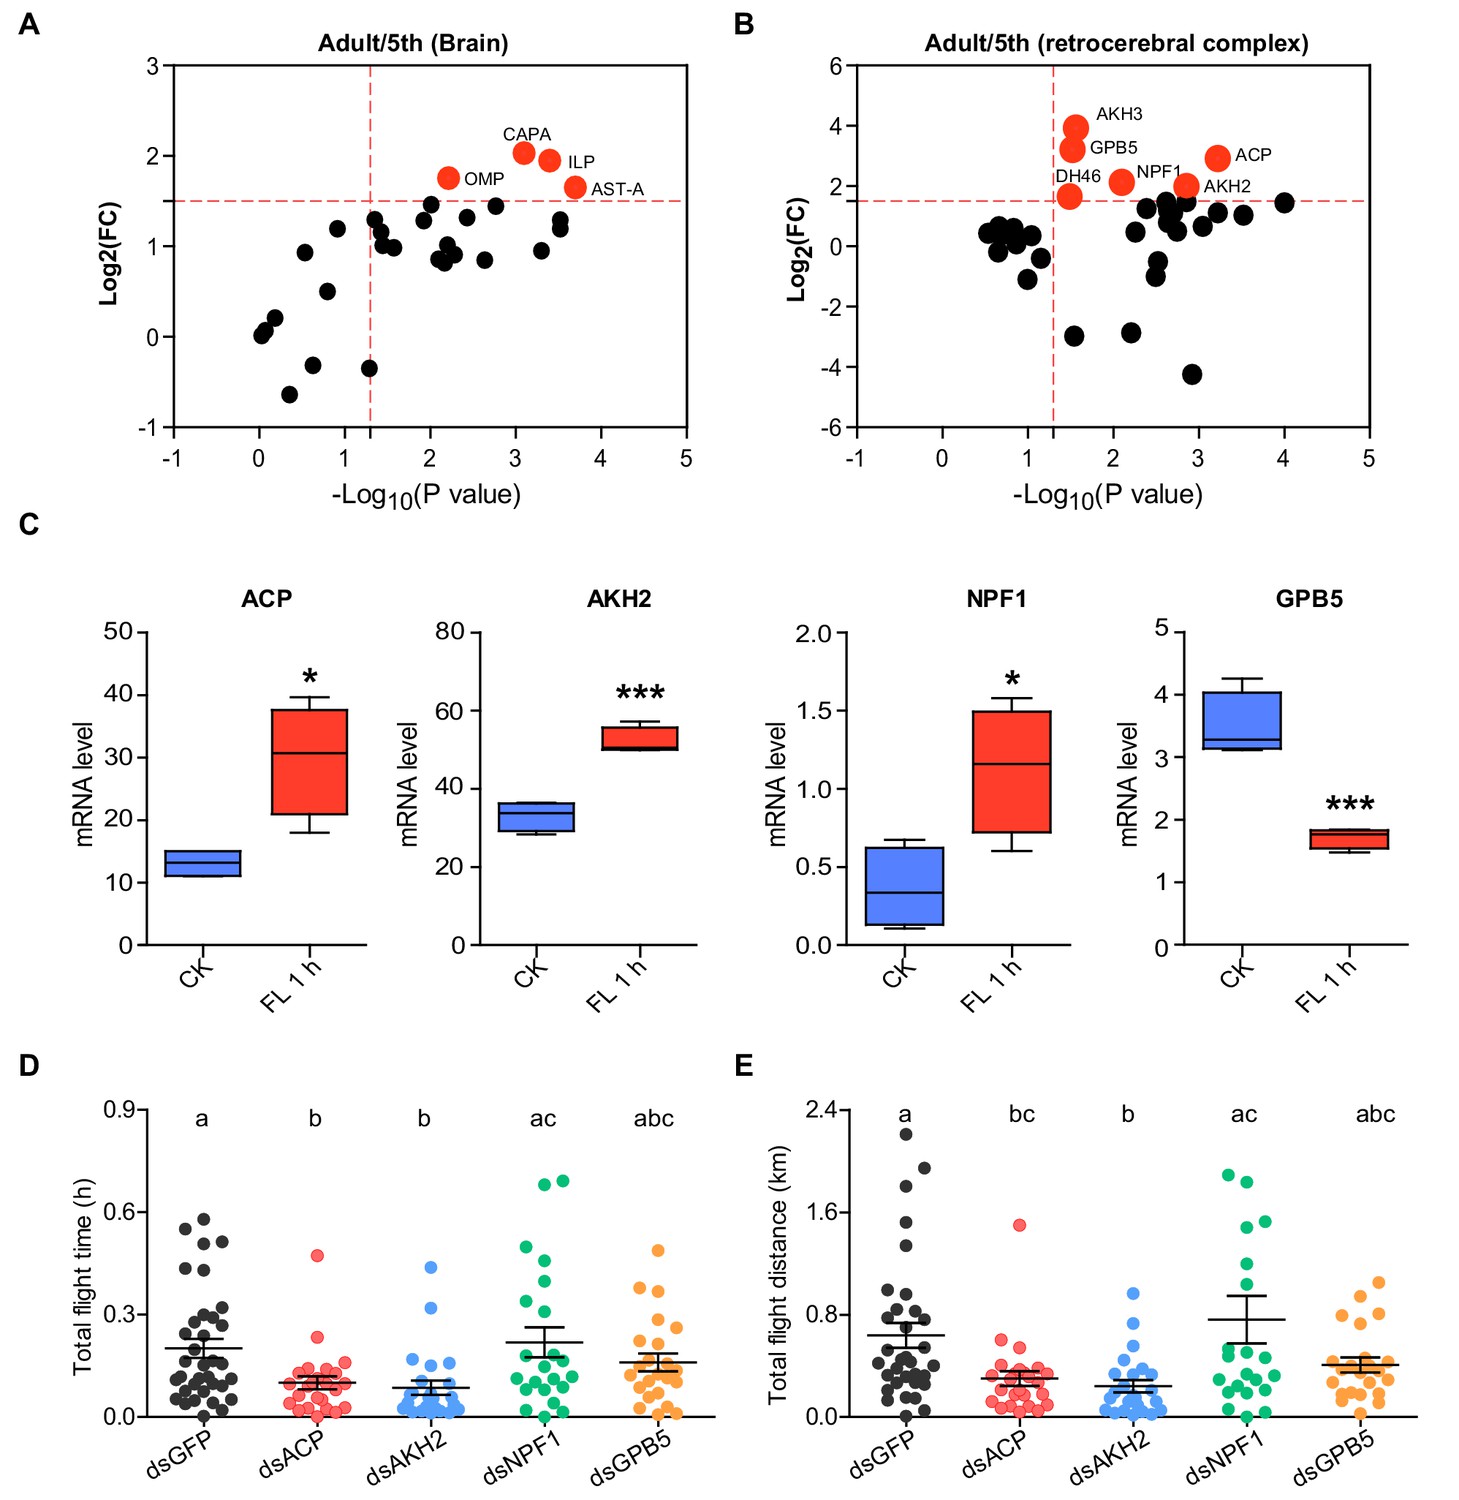
Identification of AKH/Corazonin-related neuropeptide (ACP) as a potential neuroendocrine modulator for flight activity in the locust.
Volcano plot of neuropeptidomes from (A) brains (Br) and (B) the retrocerebral complex (RC) of the final instar nymphs (5th) and mature adult locusts. Each circle represents a neuropeptide. Differential peptides with a Log2(FC) >1.5 and p value < 0.05 are highlighted in red. Data are from three biological replicates. (C) Expression levels of four neuropeptide precursor genes (ACP, AKH2, NPF1, and GPB5) in Br or RC after 1 h-sustained tethered flight (Student’s t-test, p=0.011, t = 3.619, df = 6 for ACP; p=0.0003, t = 7.394, df = 6 for AKH2; p=0.0194, t = 3.166, df = 6 for NPF1; p=0.0007, t = 6.451, df = 6 for GPB5, respectively, n = 4 biological replicates for each treatment, *p<0.05, ***p<0.001). CK indicates control, FL 1 h indicates 1h-sustained flight. (D) Total flight time and (E) total flight distance after the knockdown of four candidate neuropeptide precursor genes, ACP, AKH2, NPF1, and GPB5, in adult locusts. Columns labeled with different letters indicate that there is a significant difference between the two groups, columns contain same letters indicate no significance observed between the two groups (one-way ANOVA for D, F = 4.658, df = 4, p=0.0016; for E, F = 5.48, df = 4, p=0.0004; n = 30 (dsGFP), 25 (dsACP), 24 (dsAKH2), 22 (dsNPF1), and 23 (dsGPB5), respectively). Each blot represents a single individual. The mean ± SEM are shown. See Figure 1—source data 1 for details.
-
Figure 1—source data 1
Raw data for comparisons of peptide contents, gene expression, and flight activity.
- https://cdn.elifesciences.org/articles/65279/elife-65279-fig1-data1-v3.xlsx
Figure 1—figure supplement 1
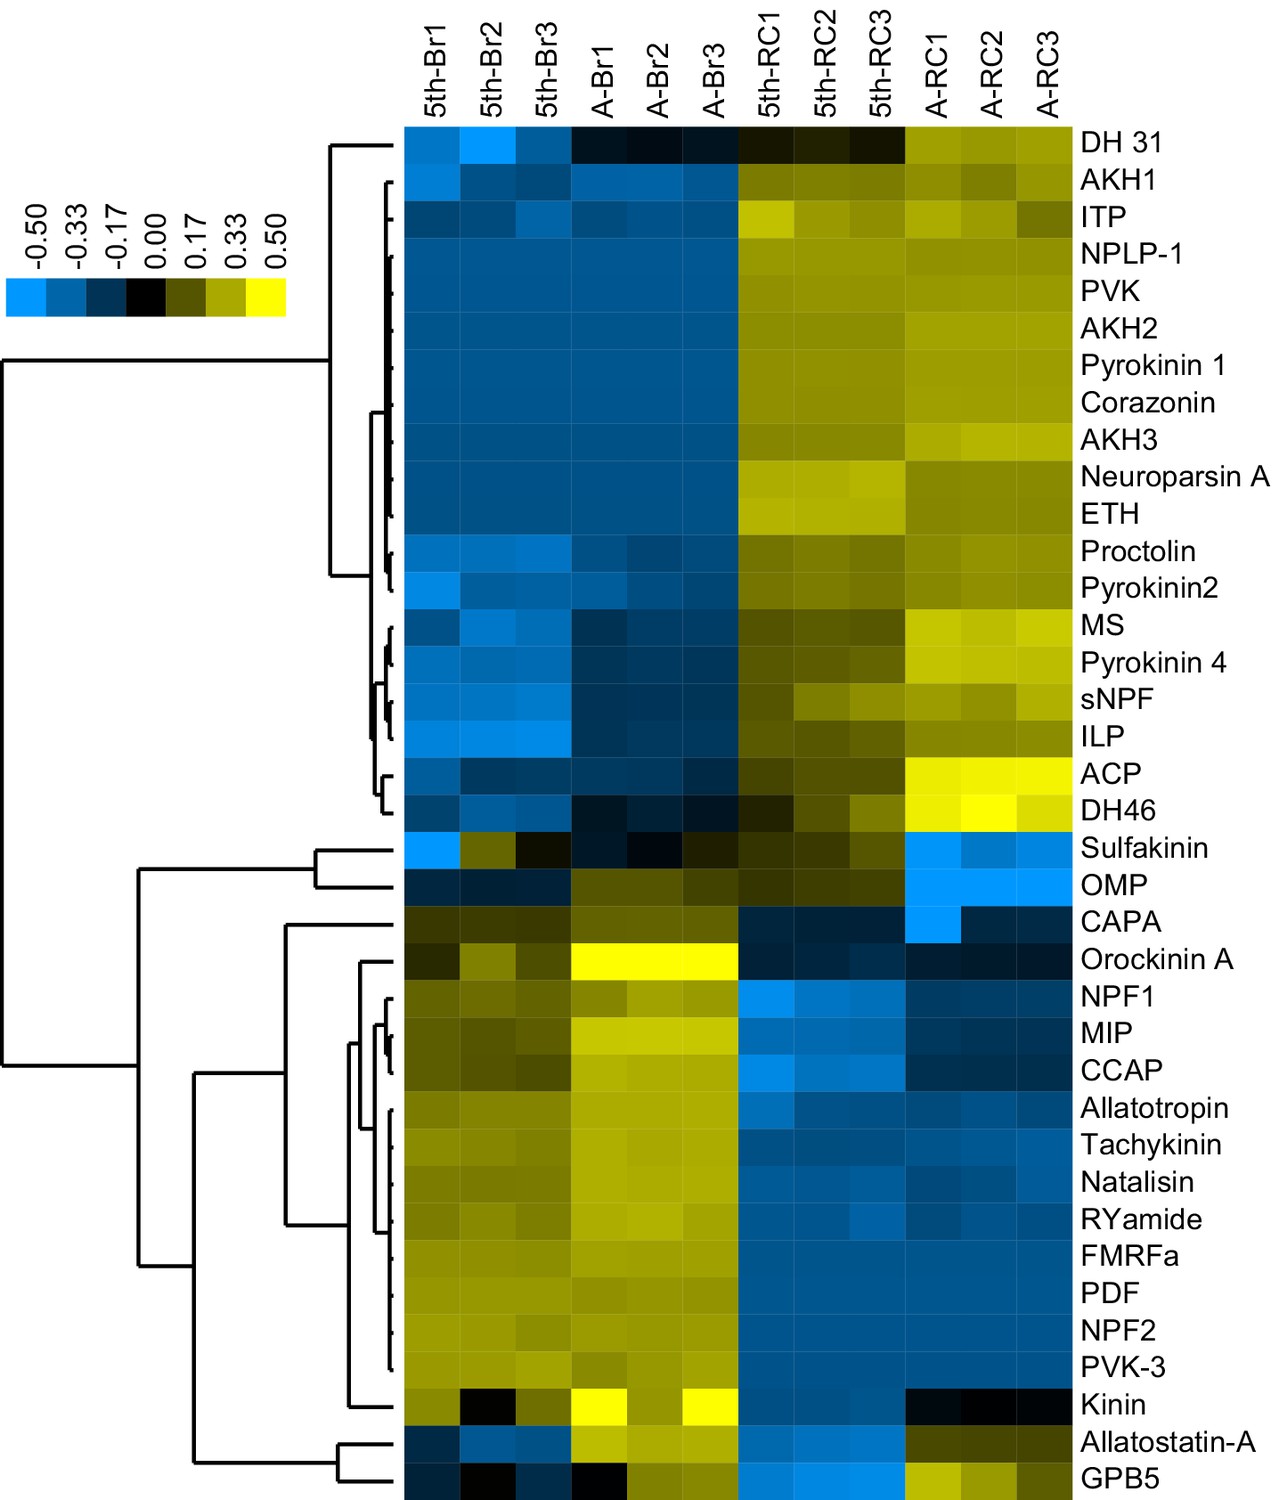
Tissue-specific abundance of neuropeptides identified in the neuropeptidome.
The abundant level of neuropeptides generated from 37 precursors were log transformed for heat map drawing. Unsupervised hierarchical clustering was performed using Clustal 3.0 under centered Pearson correlation and average linkage conditions; the results are presented by Java Treeview software. Detailed contents of neuropeptides see Figure 1—source data 1.
Figure 1—figure supplement 2
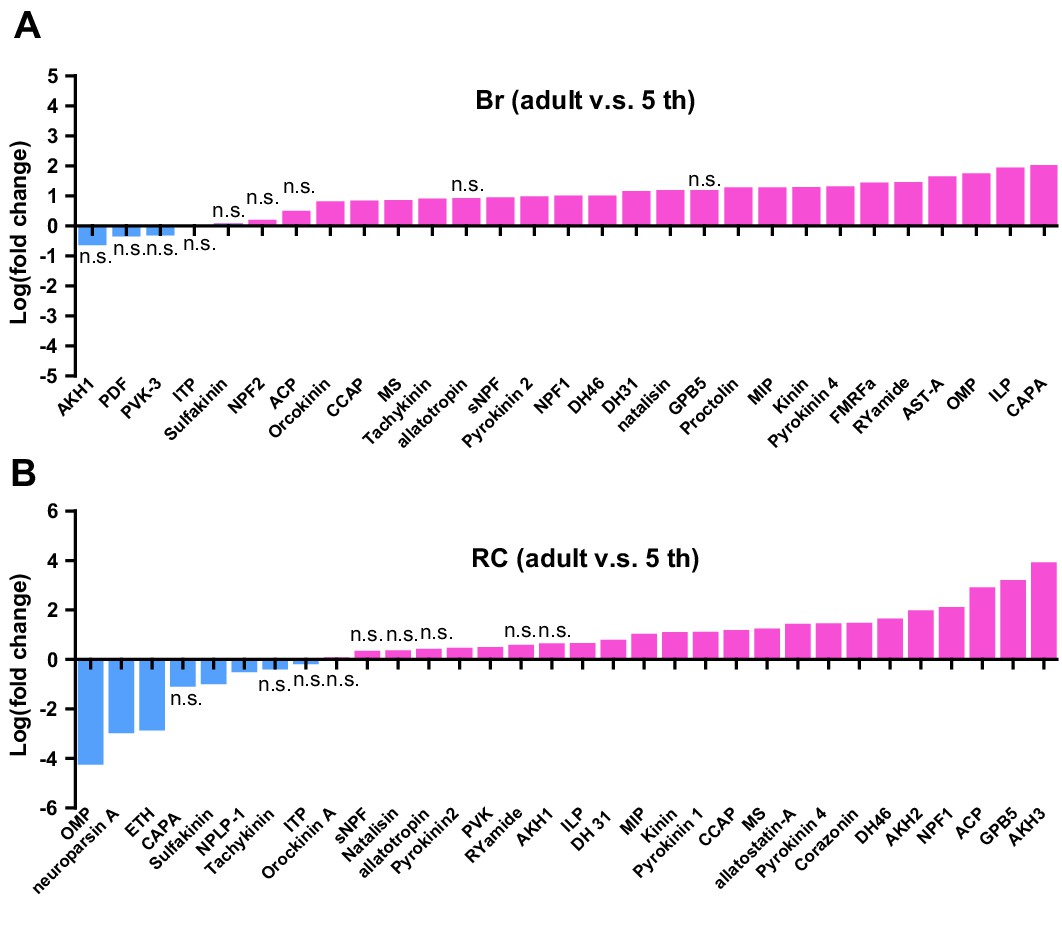
Comparison of neuropeptide abundance in Brain and retrocerebral complex between 5th instar nymphs and adult locusts.
Log2 (FC adult/5th) of neuropeptide abundances are shown in the figure. Each line represents the content of neuropeptides produced from a single precursor. n.s. indicates that the difference is not significant (Student’s t-test, n = 3 replicates). Detailed contents of neuropeptides see Figure 1—source data 1.
Figure 1—figure supplement 3
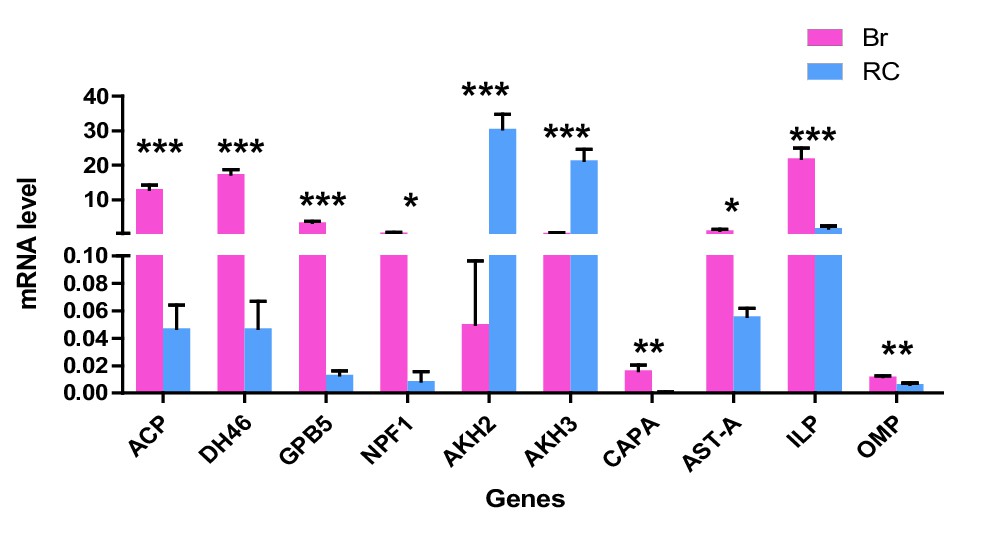
Expression levels of 10 neuropeptide precursor genes in Brain and retrocerebral complex of adult locusts.
The data are presented as the mean ± SEM (Student’s t-test, p<0.0001, t = 11.65, df = 6 for ACP, p<0.0001, t = 13.59, df = 6 for DH46; p<0.0001, t = 13.23, df = 6 for GPB5; p=0.013, t = 3.477, df = 6 for NPF1; p=0.0003, t = 7.266, df = 6 for AKH2; p=0.0005, t = 6.698, df = 6 for AKH3; p=0.0068, t = 4.039, df = 6 for CAPA; p=0.012, t = 3.547, df = 6 for AST-A; p=0.0005, t = 6.804, df = 6 for ILP; p=0.0013, t = 5.705, df = 6 for OMP, *p<0.05, **p<0.01, ***p<0.001, n = 4 replicates, eight locusts/replicate).
Figure 1—figure supplement 4
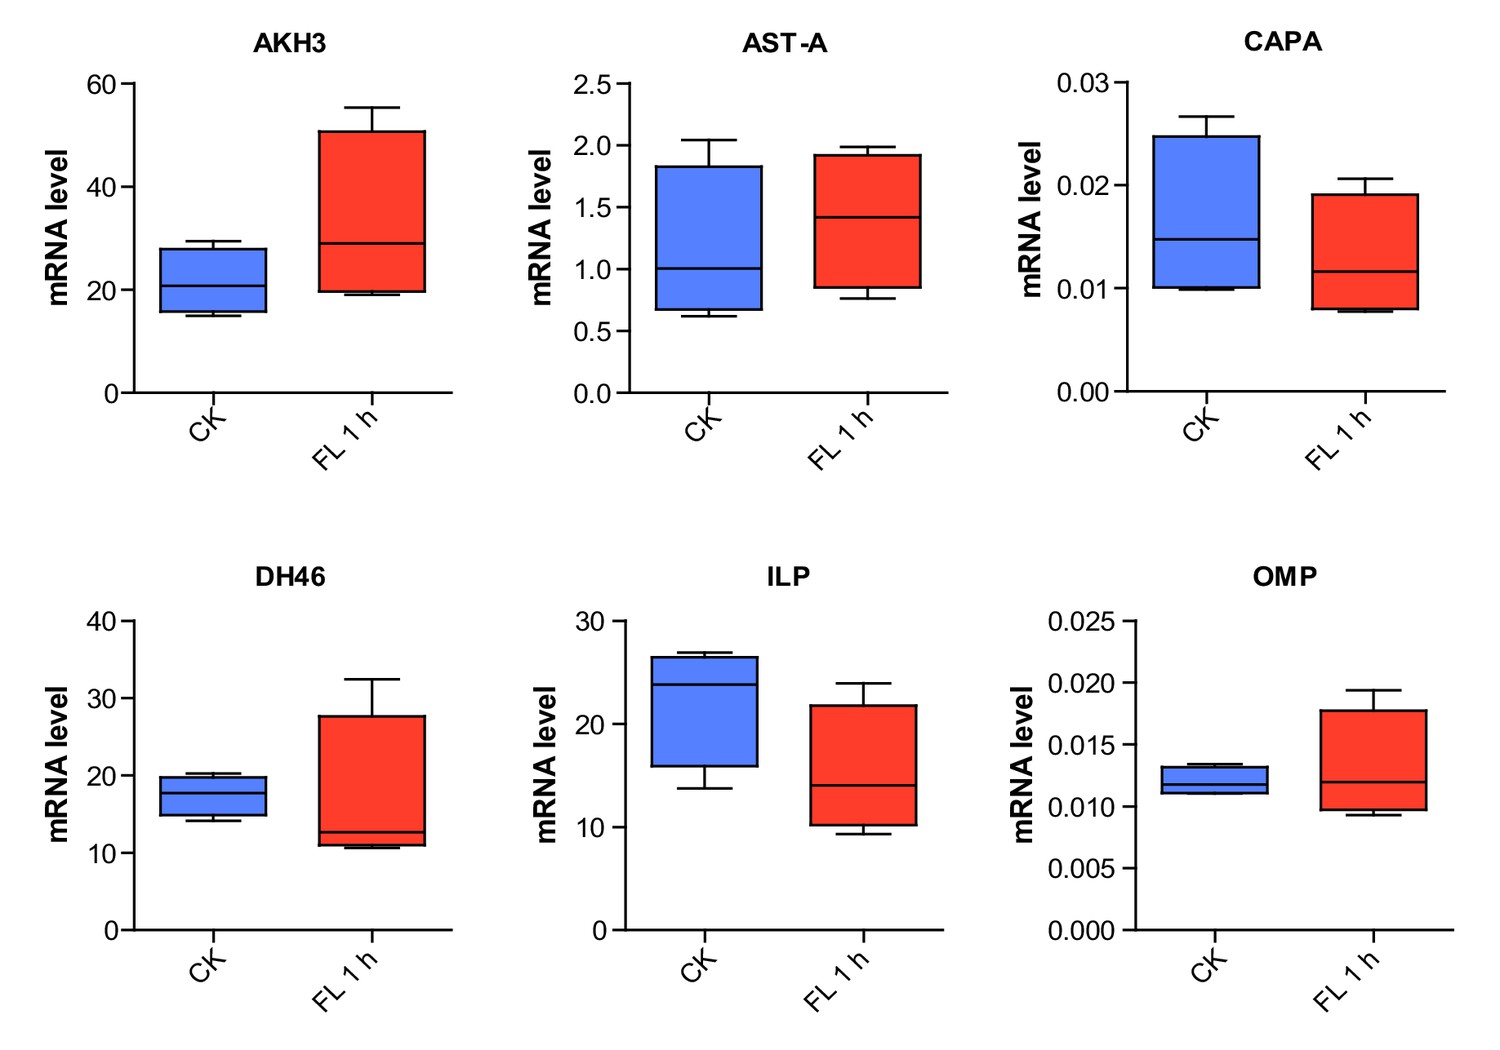
Expression levels of six neuropeptide precursor genes in Brain or retrocerebral complex upon 1 h-sustained flighting.
The data are presented as the mean ± SEM (Student’s t-test, p=0.242, t = 1.298, df = 6 for AKH3; p=0.606, t = 0.5436, df = 6 for AST-A; p=0.4925, t = 0.7307, df = 6 for CAPA; p=0.949, t = 0.06548, df = 6 for DH46; p=0.1633, t = 1.575, df = 6 for ILP; p=0.6338, t = 0.5017, df = 6 for OMP, n = 4 replicates, 8–10 locusts/replicate). CK indicates control, FL 1 h indicates 1h-sustained flight.
Figure 1—figure supplement 5
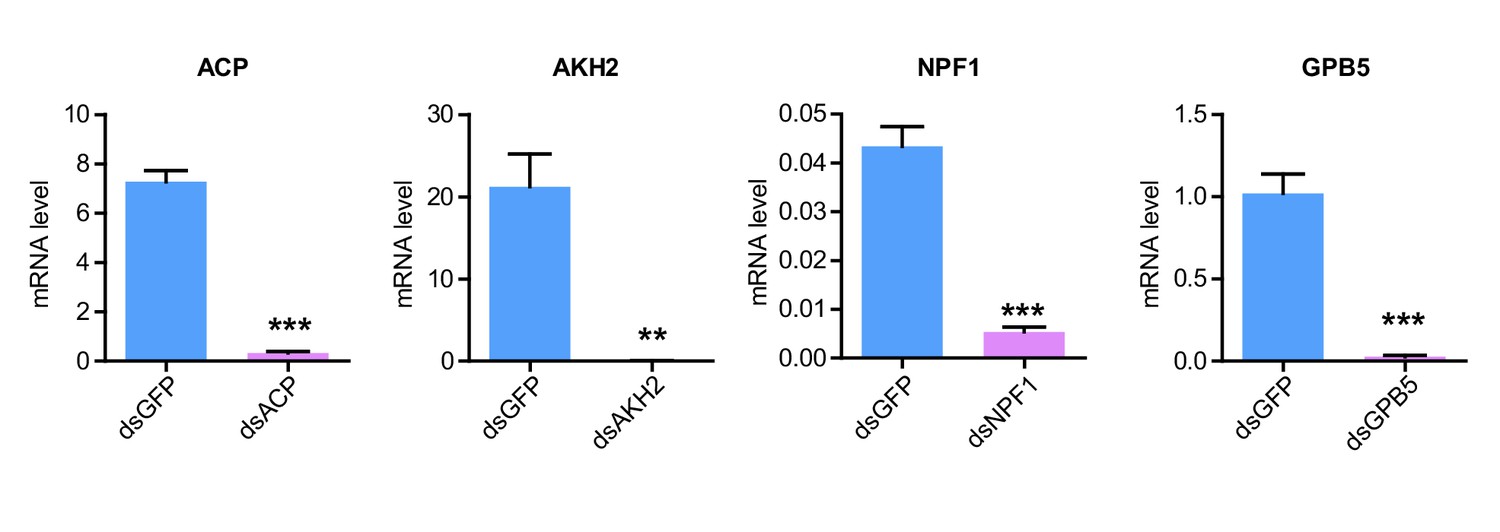
RNAi efficiency of four flight-related neuropeptide precursor genes examined by qPCR.
The data are presented as the mean ± SEM (Student’s t-test, p<0.0001, t = 15.17, df = 6 for ACP; p=0.0019, t = 5.274, df = 6 for AKH2; p<0.0001, t = 9.053, df = 6 for NPF1; p=0.0002, t = 8.403, df = 6 for GPB5, **p<0.01, ***p<0.001, n = 4 replicates, eight locusts/replicate).
Figure 1—figure supplement 6
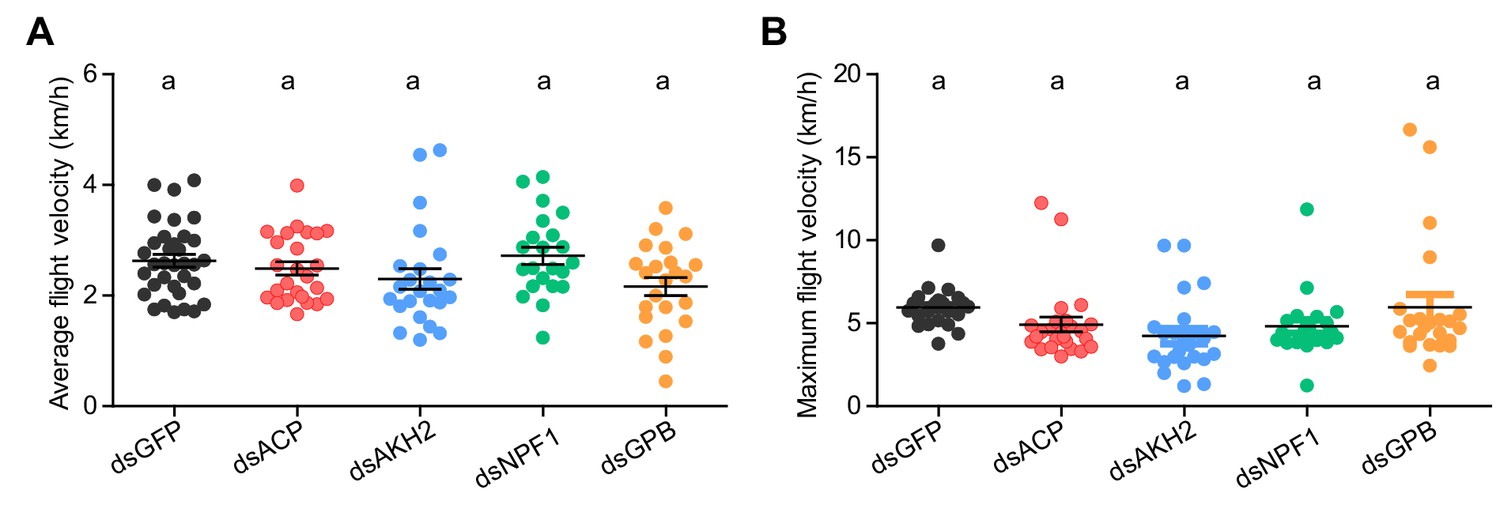
Measurement of (A) average flight velocity and (B) maximum flight velocity after the knockdown of four candidate neuropeptide precursor genes, ACP, AKH2, NPF1, and GPB, in adult locusts.
Significant differences between different groups are denoted by letters (one-way ANOVA, F = 2.365, df = 4, p=0.0566, for A; F = 2.423, df = 4, p=0.0522 for B). Each blot represents a single individual. The mean ± SEM are shown.
Figure 1—figure supplement 7
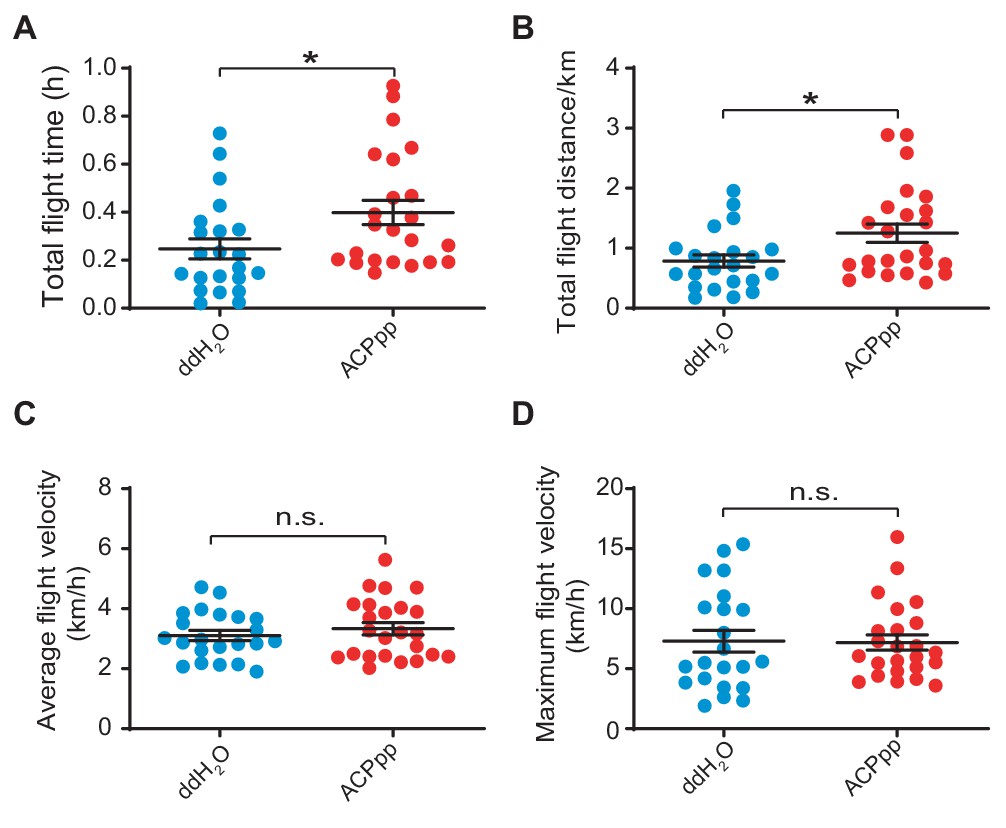
Measurement of (A) total flight time, (B) total flight distance, (C) average flight velocity, and (D) maximum flight velocity after the injection of synthetic ACP peptide in wide type locusts.
Each blot represents a single individual. The mean ± SEM are shown (Student’s t-test, p=0.0267, t = 0.8592, df = 44 for A; p=0.0186, t = 2.444, df = 44 for B; p=0.3949, t = 2.294, df = 44 for C; p=0.9154, t = 0.1069, df = 44 for D, *p<0.05). The mean ± SEM are shown. n.s. indicates that the difference is not significant.
Figure 2 with 4 supplements
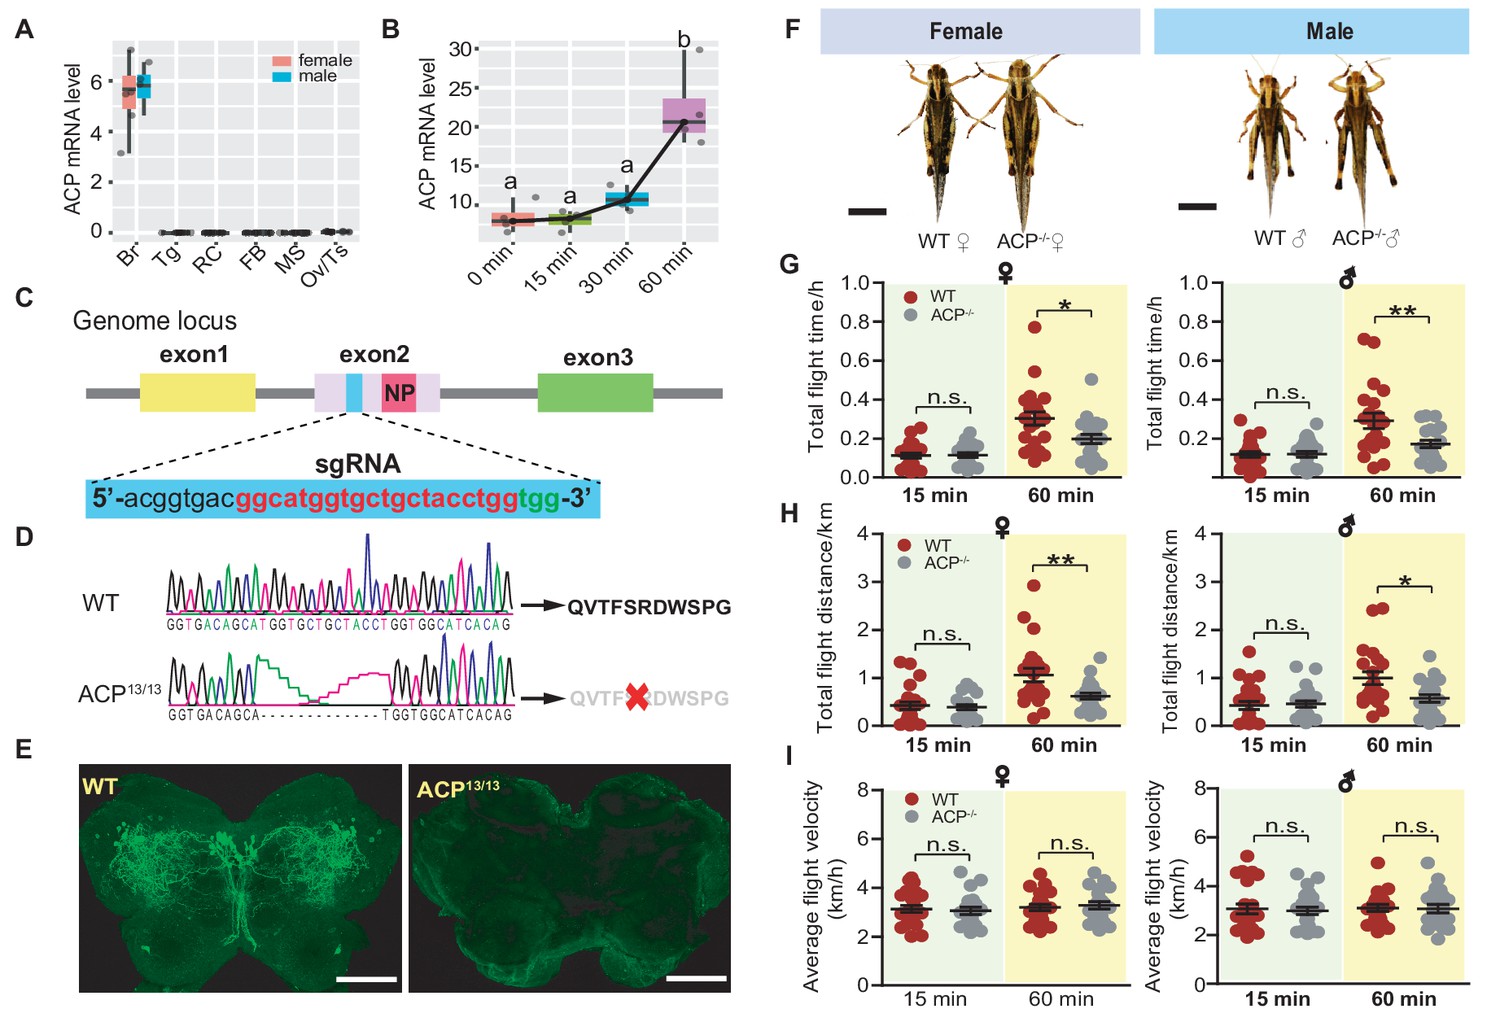
Functional role of ACP in long-term flight validated by CRISPR/Cas9 system-mediated gene knockout.
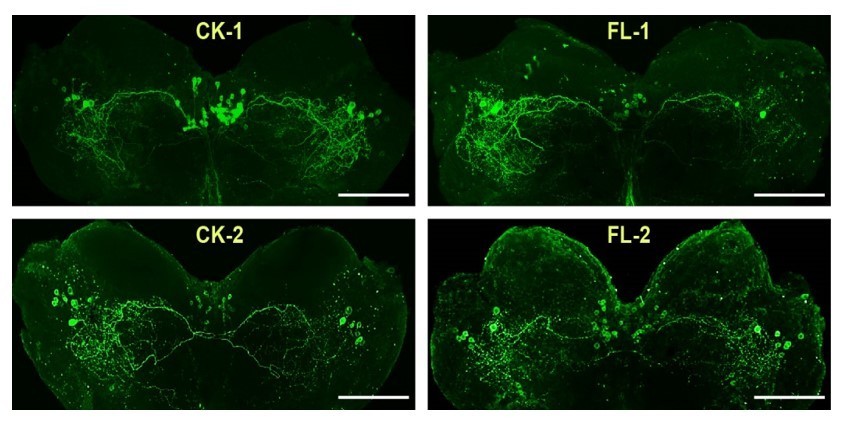
(A) Tissue-specific expression pattern of the ACP precursor gene in adult locusts analyzed by qPCR (n = 4 replicates, 6–8 locusts/replicate). Br, brain; RC, retrocerebral complex; FB, fat body; MS, muscle; Ov, ovary; Tg, thoracic ganglia. (B) Expression levels of the ACP gene in the brain during the time course of sustained flighting of adult locusts. The mRNA level of ACP significantly increased after 1 h of sustained flighting. Different letters indicate that there is a significant difference between the two groups (one-way ANOVA, F = 20.69, df = 3, p<0.0001, n = 4 replicates). (C) Gene structure and designed sgRNA-targeted site in exon 2 of the locust ACP gene. Three exons are represented in different colors. The sgRNA targeted site in exon two is highlighted in blue. The pink region in exon two indicates the mature ACP peptide-encoding region. (D) Genome PCR product sequencing of the wild-type (WT) and 13 bp-deletion ACP mutants (ACP13/13, referring to ACP-/- in the following section), which could not give rise to mature ACP peptide. (E) Detection of ACP peptide in WT and ACP-/- locusts by immunohistochemistry assay. The bar indicates 100 μm. (F) Morphology of females and males of WT and ACP-/- locusts. Both females and males of ACP mutant adults show increased body size compared to that of WT controls. Bars represent 1 cm. Measurement of (G) total flight time, (H) total flight distance, and (I) average flight velocity in females and males of WT and ACP-/- locusts. Each dot represents a single individual (Student’s t-test for G, p=0.8499, t = 0.1904, df = 44 for 15 min♀, p=0.0183, t = 2.460, df = 40 for 60 min♀; p=0.9504, t = 0.0626, df = 46 for 15 min♂, p=0.0088, t = 2.755, df = 40 for 60 min♂; For H, p=0.6416, t = 0.4687, df = 44 for 15 min♀, p=0.0097, t = 2.718, df = 40 or 60 min♀; p=0.7489, t = 0.332, df = 46 for 15 min♂, p=0.01, t = 2.704, df = 40 for 60 min♂; For I, p=0.6067, t = 0.5186, df = 44 for 15 min♀, p=0.654, t = 0.4516, df = 40 for 60 min♀; p=0.7644, t = 0.3015, df = 46 for 15 min♂, p=0.9122, t = 0.1109, df = 40 for 60 min♂; n = 23 (WT♀ 15 min), 23 (ACP-/-♀ 15 min), 22 (WT♀ 60 min), 20 (ACP-/-♀ 60 min), 24 (WT♂ 15 min), 24 (ACP-/-♂ 15 min), 21 (WT♂ 60 min), 21 (ACP-/-♂ 60 min), *p<0.05, **p<0.01, n.s. indicates not significant). See Figure 2—source data 1 for details.
-
Figure 2—source data 1
Raw data for gene expression and flight activity.
- https://cdn.elifesciences.org/articles/65279/elife-65279-fig2-data1-v3.xlsx
Figure 2—figure supplement 1
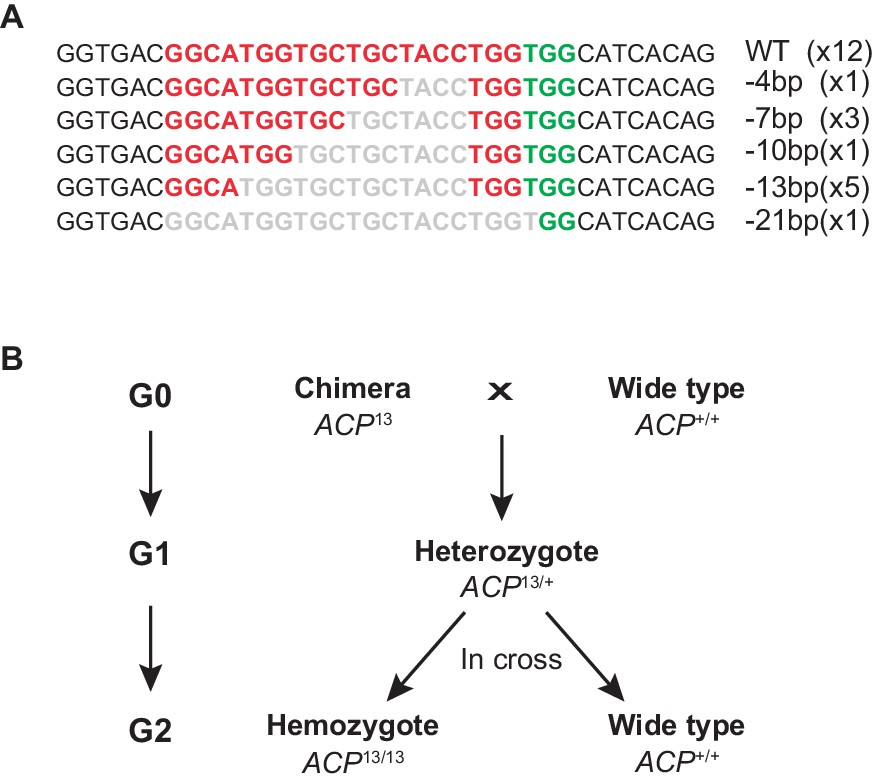
Construction of the ACP loss-of-function mutant line of the migratory locust.
(A) Determination of the gene type of the ACP mutation in the G0 generation by Sanger sequencing. (B) Schematic of screening strategies to obtain 13 bp-deleted homozygous ACP mutants.
Figure 2—figure supplement 2
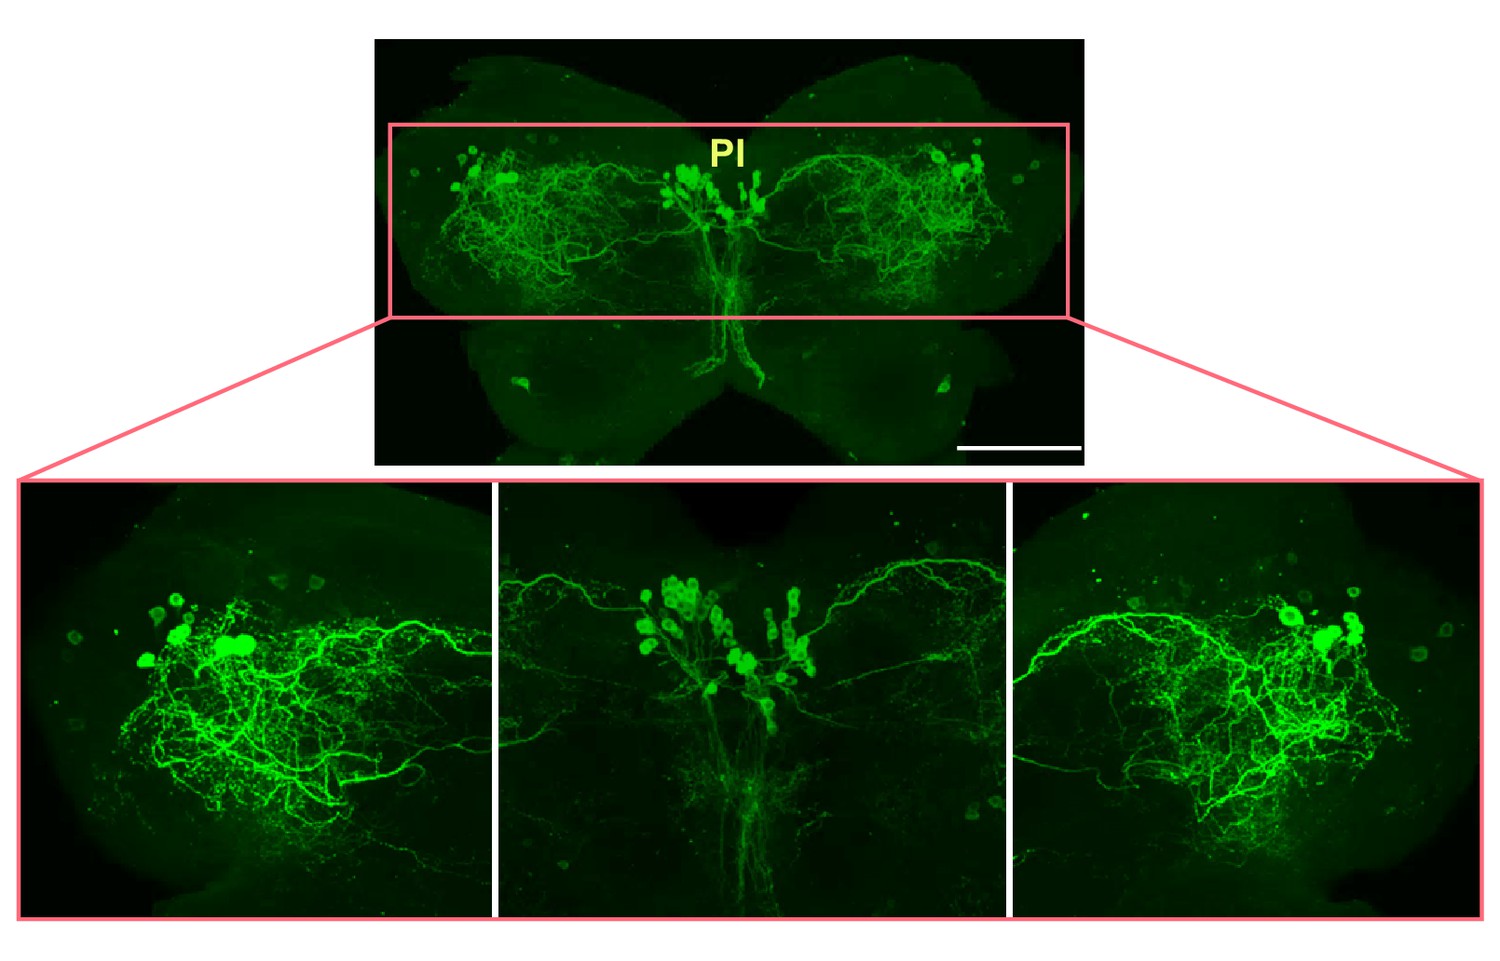
Localization of ACP peptide in the locust brain detected by IHC.
ACP peptide is abundantly detected in neurons in the pars intercerebralis (PI) and bilateral forebrain of the locust brain. Scale bars represent 100 μm.
Figure 2—figure supplement 3
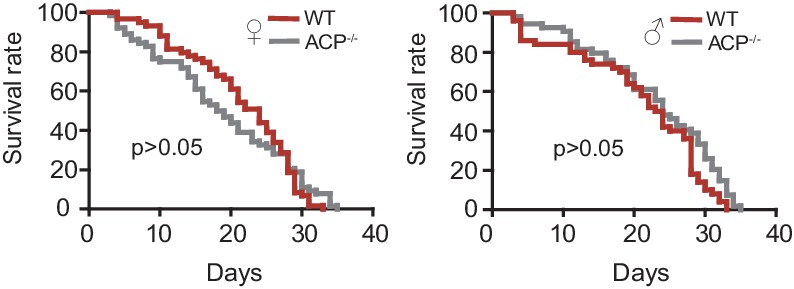
Survival rate of females and males of WT and ACP-/- locusts.
ACP mutants show a normal survival rate similar to that of WT locusts. Gehan-Breslow-Wilcoxon test, p=0.154 and 0.172 for females and males, respectively (n > 50).
Figure 2—figure supplement 4

Measurement of maximum flight velocity in (A) females and (B) males of WT and ACP-/- locusts.
Each dot represents a single individual (Student’s t-test for A, p=0.4996, t = 0.6808, df = 44 for 15 min ♀, p=0.5075, t = 0.6688, df = 40 for 60 min♀; p=0.9957, t = 0.005381, df = 46 for 15 min ♂, p=0.6497, t = 0.4577, df = 40 for 60 min ♂, n > 20, Student’s t-test, n.s. indicates not significant).
Figure 3 with 2 supplements

CRISPR/Cas9-mediated knockout of ACPR impairs long-term flight in the locust.
(A) Phylogenic relationship of AKHR, ACPR, CRZR from the migratory locust and their homologs from other representative insect species. The phylogenetic tree is constructed using the neighbor-joining method. The locust ACPR protein is evolutionarily divided into the insect ACPR cluster. (B) Tissue-specific expression pattern of ACPR in both female and male adult locusts. The data are presented as the mean ± SEM (one-way ANOVA, F = 27.08, df = 5, p<0.0001 for male; F = 73.02, df = 5, p<0.0001 for female, n = 4 replicates, 6–8 locusts/replicate). For both female and male adults, ACPR gene is highly expressed in fat body and muscle, compared with other tissues tested. Columns labeled with different letters in same color indicate that there is a significant difference between the two groups, columns contain same letters in same color indicate no significance observed between the two groups (red indicates female, green indicates male). Br, brain; RC, retrocerebral complex; FB, fat body; MS, muscle; Ov, ovary; Tg, thoracic ganglia. (C) Gene types of the ACPR mutation in the G0 generation determined by Sanger sequencing. (D) Sequencing of the wild-type (WT) and 13 bp-deletion homozygous ACPR mutants (ACPR13/13), which is predicted to produce a truncated protein that lacks the last four transmembrane domains. Measurement of (E) total flight time and (F) total flight distance in females and males of WT and ACP-/- locusts. Each dot represents a single individual (Student’s t-test for E, p=0.7536, t = 0.3153, df = 62 for 15 min♀, p=0.0157, t = 2485, df = 62 for 60 min♀; p=0.2481, t = 1.166, df = 63 for 15 min♂, p=0.0384, t = 2.115, df = 63 for 60 min♂; For F, p=0.0734, t = 1.821, df = 62 for 15 min♀, p=0.0016, t = 3.295, df = 62 or 60 min♀; p=0.1271, t = 1.546 df=63 for 15 min♂, p=0.0227, t = 2.336, df = 63 for 60 min♂; *p<0.05, **p<0.01, n.s. indicates not significant). See Figure 3—source data 1 for details.
-
Figure 3—source data 1
Raw data for gene expression and flight activity.
- https://cdn.elifesciences.org/articles/65279/elife-65279-fig3-data1-v3.xlsx
Figure 3—figure supplement 1
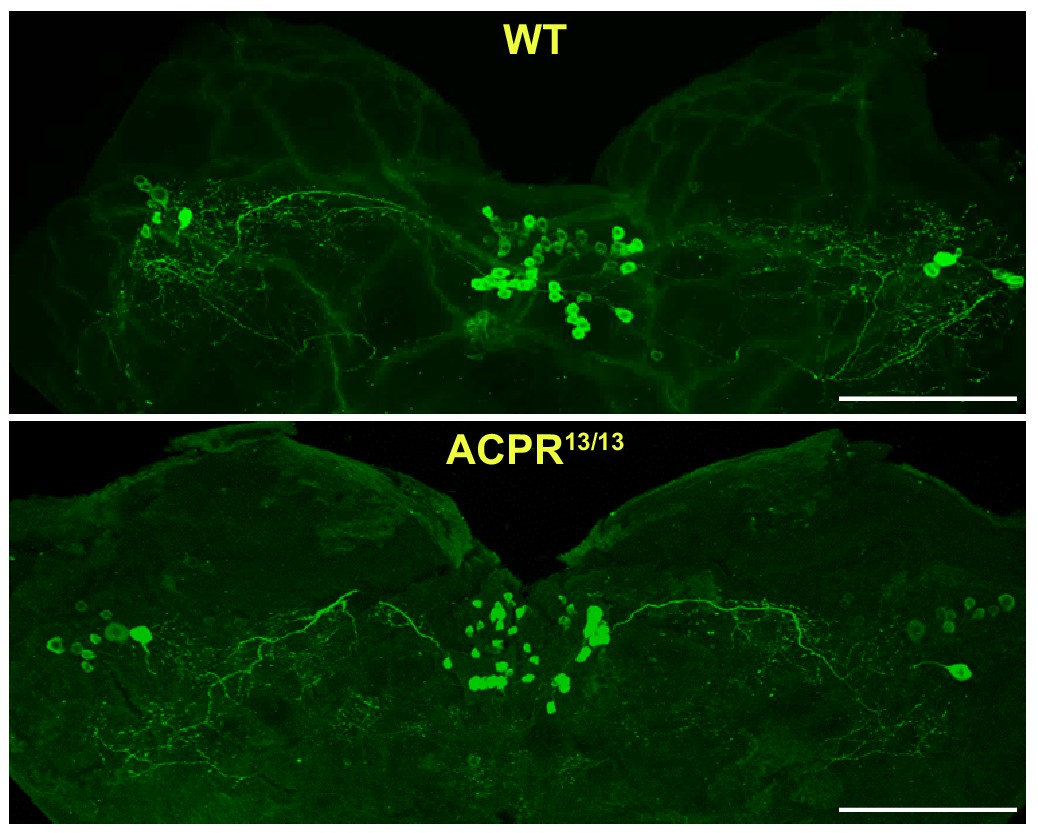
Immunostaining of ACP peptide in the brain of ACPR13/13 locusts.
Intense signal of ACP peptide is detected in the brain of ACPR mutants. Scale bars represent 100 μm.
Figure 3—figure supplement 2

Measurement of (A) average flight velocity and (B) maximum flight velocity in females and males of WT and ACPR13/13 locusts.
Each dot represents a single individual (Student’s t-test for A, p=0.2153, t = 1.252, df = 60 for 15 min ♀, p=0.1522, t = 1.45, df = 60 for 60 min♀; p=0.1556, t = 1.437, df = 63 for 15 min ♂, p=0.1055, t = 1.642, df = 63 for 60 min ♂, for B, p=0.8657, t = 0.1699, df = 60 for 15 min ♀, p=0.8319, t = 0.2132, df = 60 for 60 min♀; p=0.1044, t = 1.648, df = 63 for 15 min ♂, p=0.0852, t = 1.749, df = 63 for 60 min ♂).
Figure 4 with 4 supplements

Transcriptome analysis reveals significant downregulation of genes and pathways associated with lipid transport and oxidation in the flight muscle of ACP-/- locusts.
(A) Ven diagram of differentially expressed genes (DEGs) in flight muscle and fat body between WT and ACP-/- locusts. There were 212 upregulated and 349 downregulated genes in the flight muscle and 200 upregulated and 118 downregulated genes in the fat body of ACP mutants. (B) The representative enriched Kyoto Encyclopedia of Genes and Genomes (KEGG) terms of the DEGs in the flight muscle and fat body in WT and ACP-/- locusts. (C) Heat map of DEGs related to fatty acid transport, beta-oxidation, and oxidation phosphorylation in the flight muscle of WT and ACP-/- locusts. (D) Volcano plot of RNA-seq data from flight muscle of WT and ACP-/- locusts. Blue dots indicate DEGs, and the red dot indicates fatty acid-binding protein (FABP) that shows highly basic expression and fold change after ACP gene knockout. Validation of FBAP expression in the flight muscle of WT and ACP-/- locusts via (E) qPCR and (F) western blot. (Student’s t-test for E, p=0.0007, t = 5.756, df = 7, n = 4–5 biological replicates, ***p<0.001). (G) Heat map of beta-oxidation-related genes in flight muscle after FABP knockdown. See Figure 4—source data 1 for details.
-
Figure 4—source data 1
Raw data for RNA-seq and gene expression.
- https://cdn.elifesciences.org/articles/65279/elife-65279-fig4-data1-v3.xlsx
Figure 4—figure supplement 1
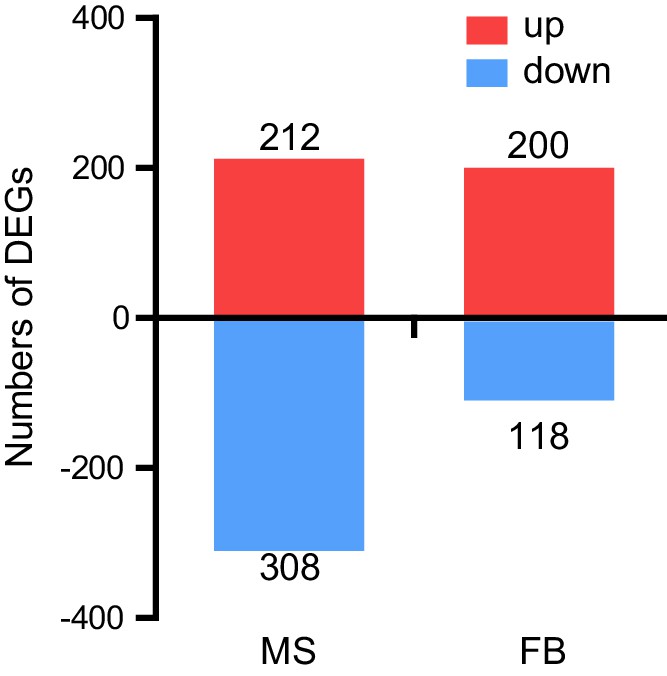
Numbers of differentially expressed genes in the flight muscle and fat body between WT control and ACP-/- locusts.
Red indicates upregulated, blue indicates downregulated.
Figure 4—figure supplement 2
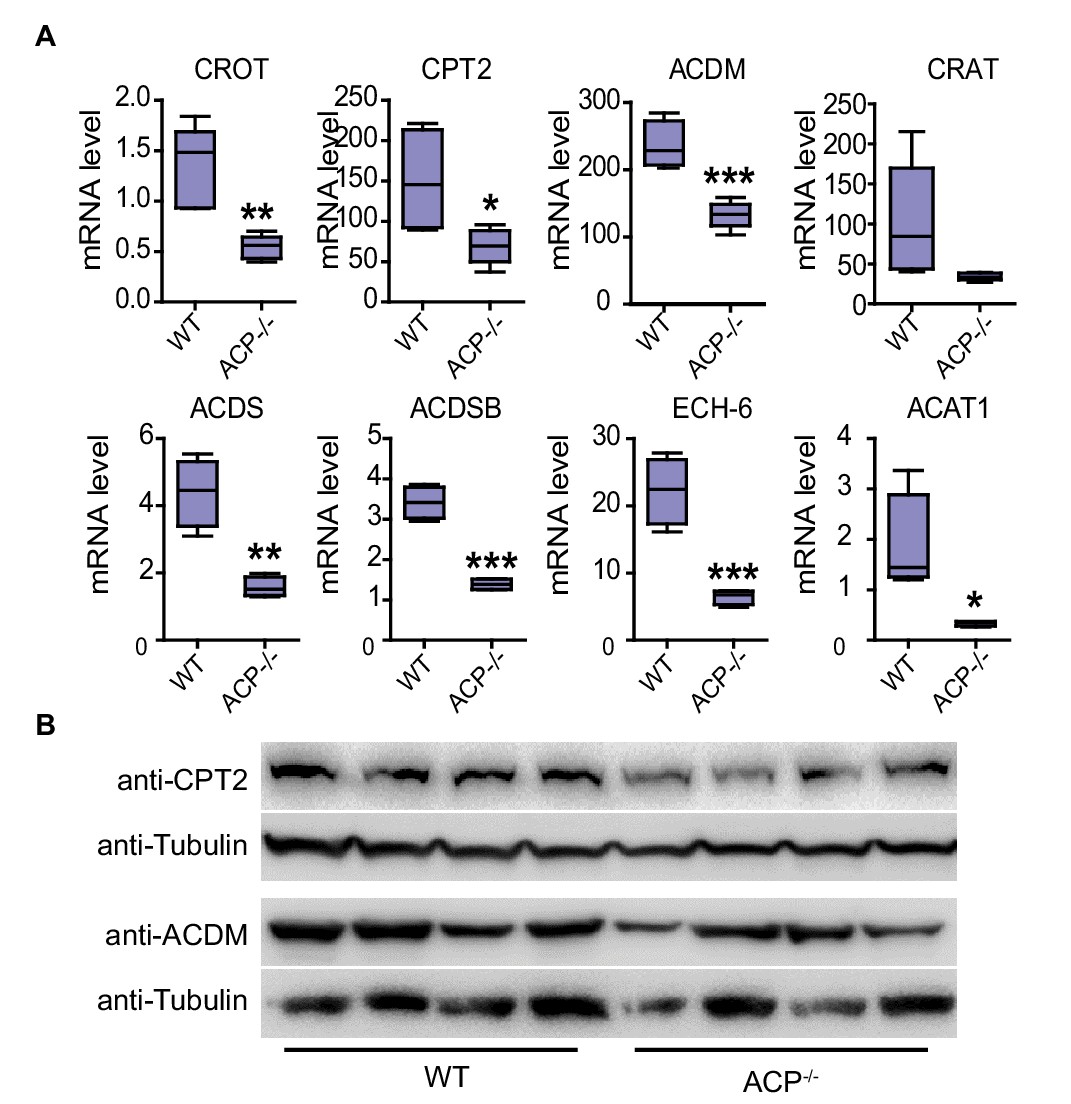
Expression levels of genes related to fatty acid transport and beta-oxidation are downregulated in the flight muscle of ACP-/- locusts.
(A) mRNA levels of eight genes related to fatty acid transport and metabolism in the flight muscle of WT and ACP-/- locusts examined by qPCR. The data are presented as the mean ± SEM (Student’s t-test, p=0.0026, t = 4.305, df = 8 for CROT; p=0.0332, t = 2.633, df = 7 for CPT2; p=0.0008, t = 5.58, df = 7 for ACDM; p=0.0659, t = 2.129, df = 8 for CRAT; p=0.0018, t = 5.322, df = 6 for ACDS; p<0.0001, t = 9.646, df = 6 for ACDSB, p=0.0008, t = 6.224, df = 6 for ECH-6; p=0.0232, t = 3.027, df = 6 for ACAT1, *p<0.05, **p<0.01, n = 4–5 replicates, 3–4 locusts/replicate). (B) Protein levels of CPT2 and ACDM in the flight muscle of WT and ACP-/- locusts detected by western blot (n = 4 replicates, 3–4 locusts/replicate).
Figure 4—figure supplement 3
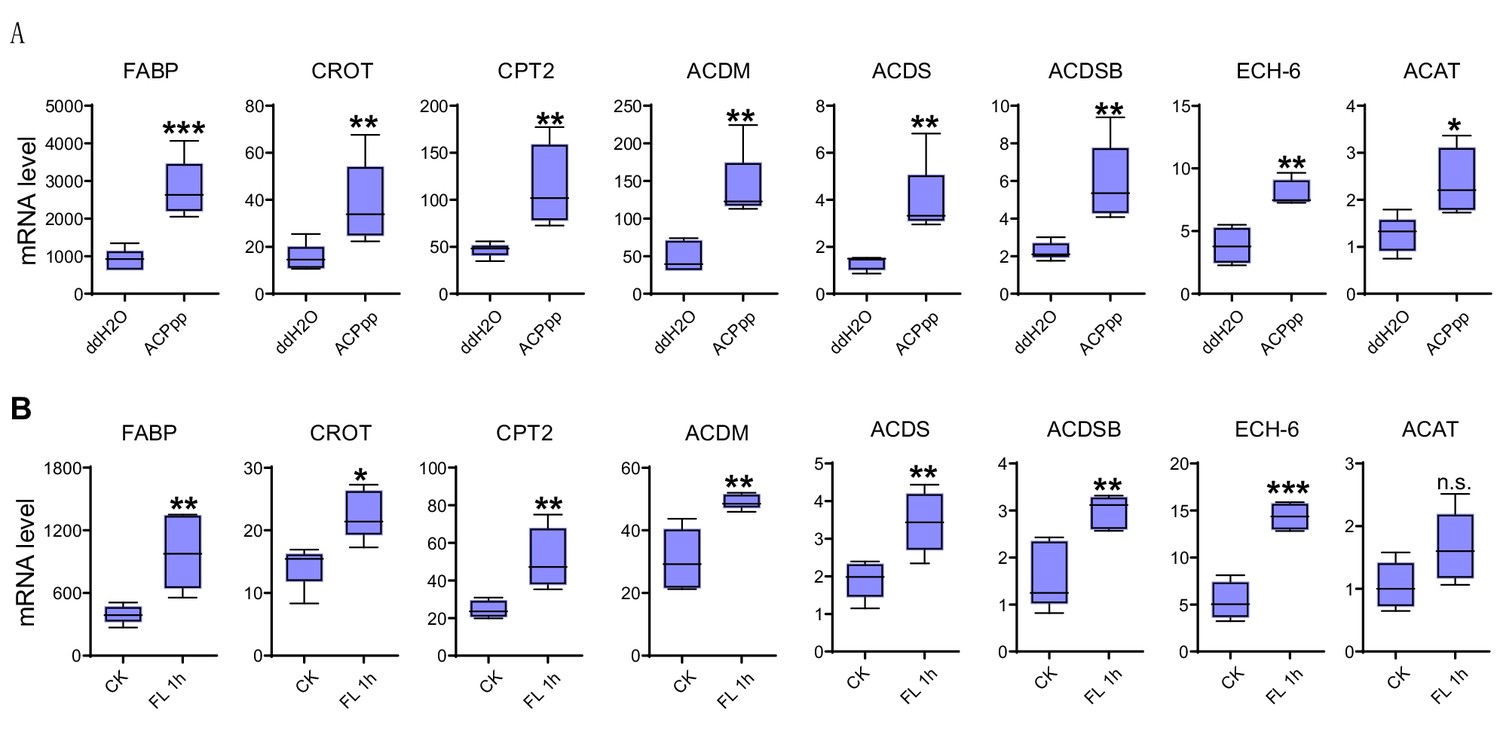
Expression levels of genes related to fatty acid transport and oxidation after ACP peptide injection and 1 h-sustained flight in WT locusts.
mRNA levels of eight genes related to fatty acid transport and oxidation in the flight muscle (A) after injection of ACP peptide and (B) 1 h-sustained flight. The data are presented as the mean ± SEM (Student’s t-test, p=0.001, 0.0079, 0.0085, 0.0039, 0.0077, 0.0058, 0.0049, and 0.0133 for A; p=0.0069, 0.026, 0.0074, 0.0069, 0.0035, 0.0048, 0.0004, and 0.08 for B, *p<0.05, **p<0.01, ***p<0.001, n = 5 replicates, 3–4 locusts/replicate). CK indicates control, FL 1 h indicates 1h-sustained flight.
Figure 4—figure supplement 4
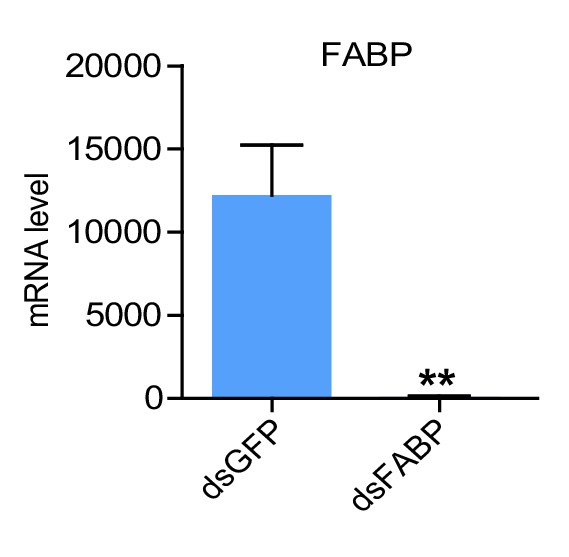
RNAi efficiency of FABP in the muscle examined by qPCR.
(Student’s t-test, p=0.0012, t = 4.038, df = 14, **p<0.01, n = 8 replicates, 3–4 locusts/replicate).
Figure 5 with 4 supplements
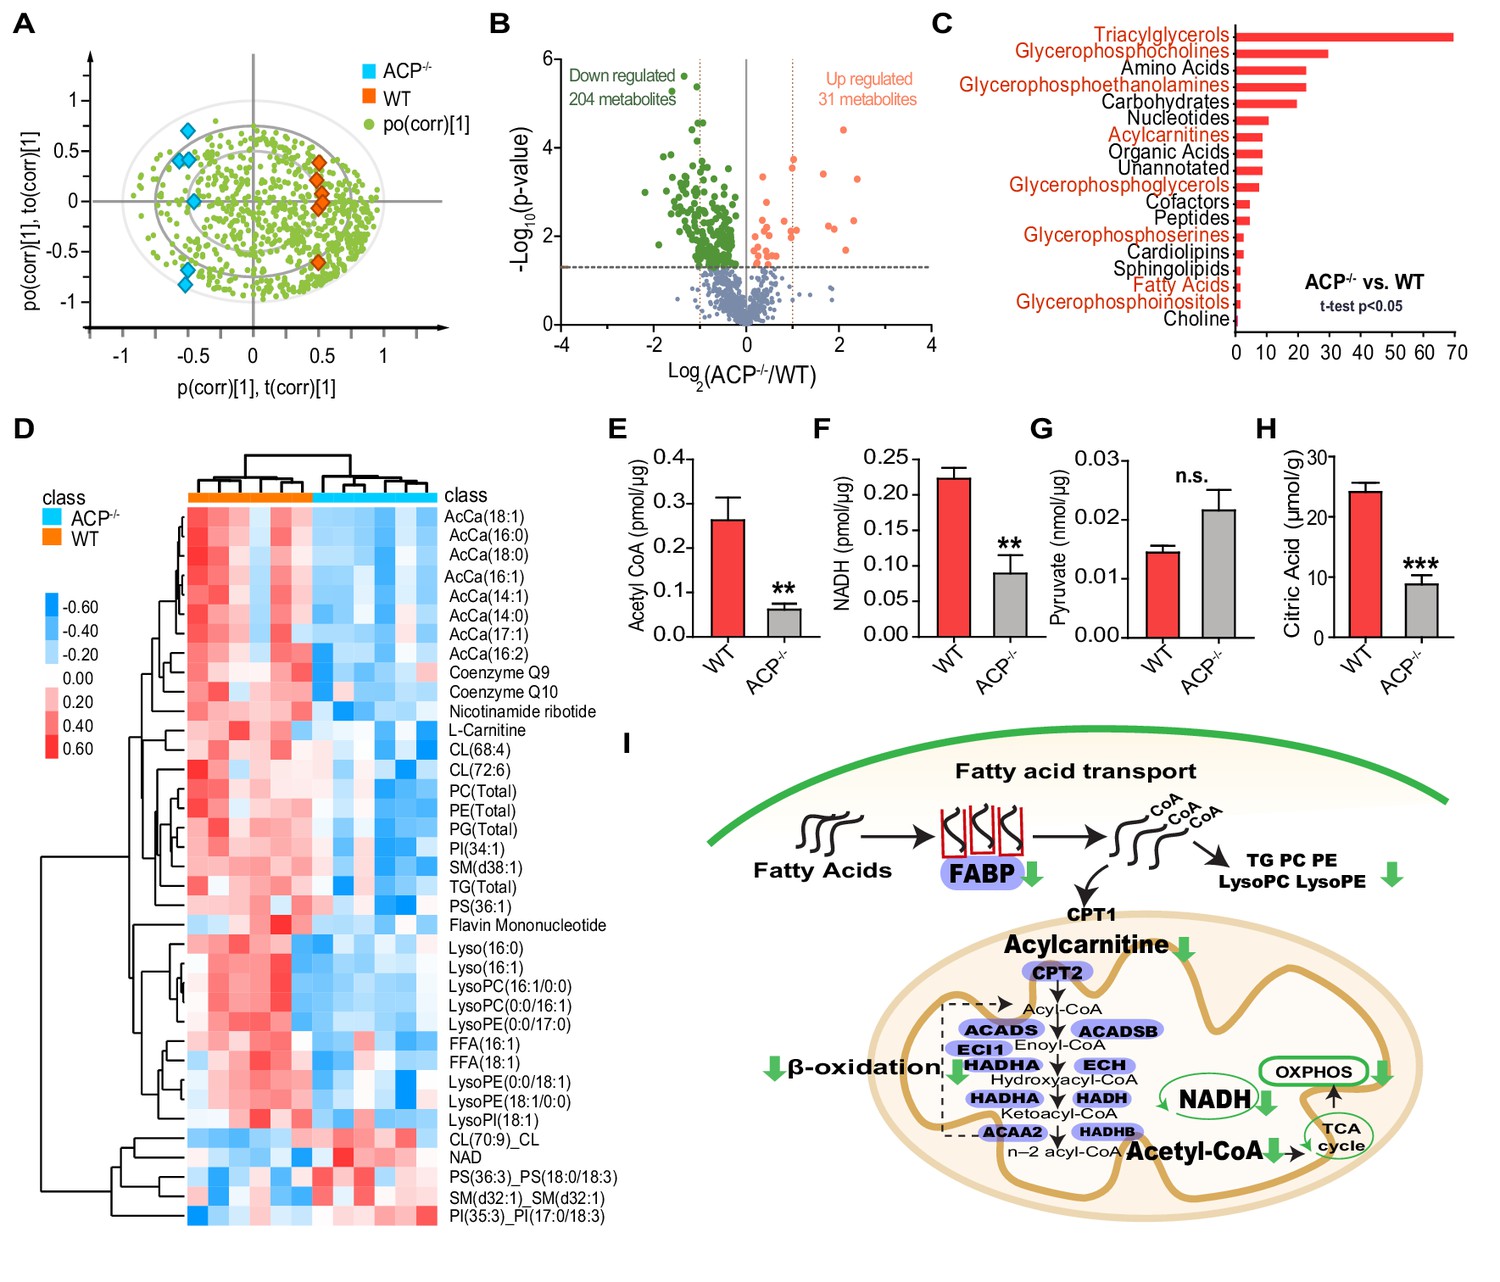
Metabolomic analysis reveals impaired lipid metabolism in the flight muscle of ACP mutants.
(A) Metabolite distribution in the flight muscle of WT and ACP-/- locusts, as determined by orthogonal partial least squares discriminant analysis (OPLS-DA). Red blocks indicate WT samples, blue blocks indicate ACP-/- samples. Each green dot indicates a single metabolite. (B) Volcano plot of the metabolome from flight muscle of WT and ACP-/- locusts. There were 31 upregulated and 204 downregulated metabolites in the flight muscle of ACP mutants compared to WT locusts. Metabolites with p values < 0.05 are highlighted in red (upregulated) and green (downregulated). (C) Chemical structure classification of differential metabolites between WT and ACP-/- samples. (D) Heat map of differential metabolites related to lipid metabolism, including acylcarnitine, triglyceride, phospholipid, and coenzyme. The contents of metabolites are highlighted in red (upregulated) and blue (downregulated). Abundance detection of (E) acetyl CoA, (F) NADH, (G) pyruvate, and (H) citric acid in the flight muscle of WT and ACP-/- locusts. (Student’s t-test for E, p=0.007, t = 3.472, df = 9, n = 6 (WT) and 5 (ACP-/-); for F, p=0.0022, t = 4.439, df = 8, n = 5 (WT) and 5 (ACP-/-); for G, p=0.0857, t = 1.959, df = 8, n = 5 (WT) and 5 (ACP-/-); for H, p=0.0001, t = 7.085 df=8, n = 5 (WT) and 5 (ACP-/-), **p<0.01, ***p<0.001). (I) Schematic diagram of the metabolic pathway combining the metabolomic and transcriptome analyses. The metabolites involved in fatty acid transport and subsequent oxidation are downregulated in the flight muscle of ACP mutants compared to WT locusts. Genes associated with lipid transport and oxidation are also presented (highlighted in purple). See Figure 5—source data 1 for details.
-
Figure 5—source data 1
Raw data for metabolic and metabolite contents.
- https://cdn.elifesciences.org/articles/65279/elife-65279-fig5-data1-v3.xlsx
Figure 5—figure supplement 1
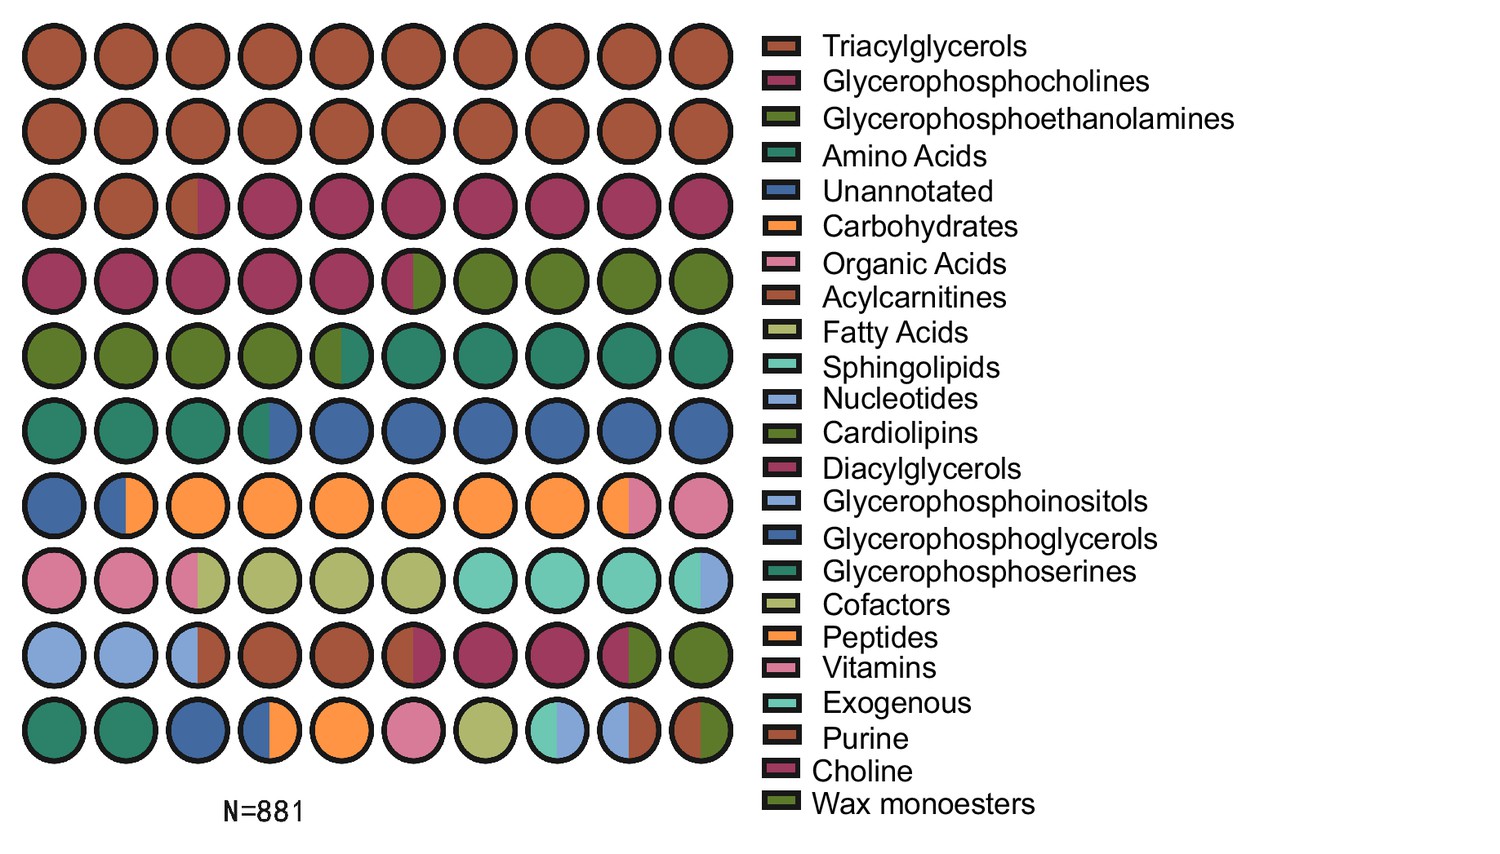
Pie chart of metabolite chemical classes structurally annotated in this experiment.
In total, 881 metabolites were characterized in 12 samples (n = 6 for both WT and ACP-/- samples).
Figure 5—figure supplement 2
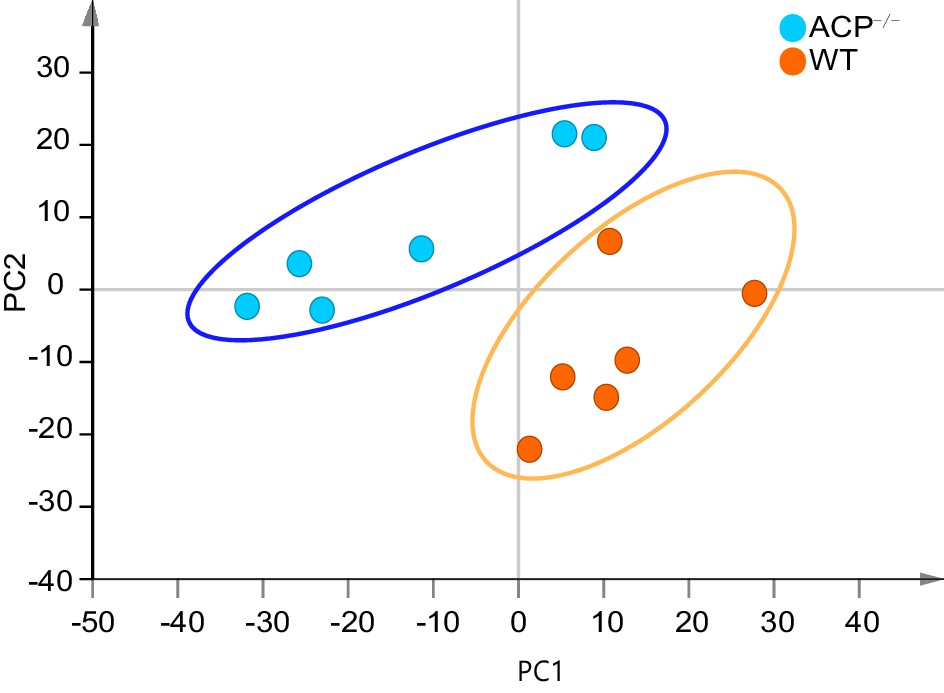
Unsupervised PCA score plots of metabolic phenotypes between the ACP-/- and WT groups.
Metabolomics data were log transformed and scaled to unit variance for modeling. Model parameter: R2X = 0.55 (cumulative variance proportion of three principal components).
Figure 5—figure supplement 3
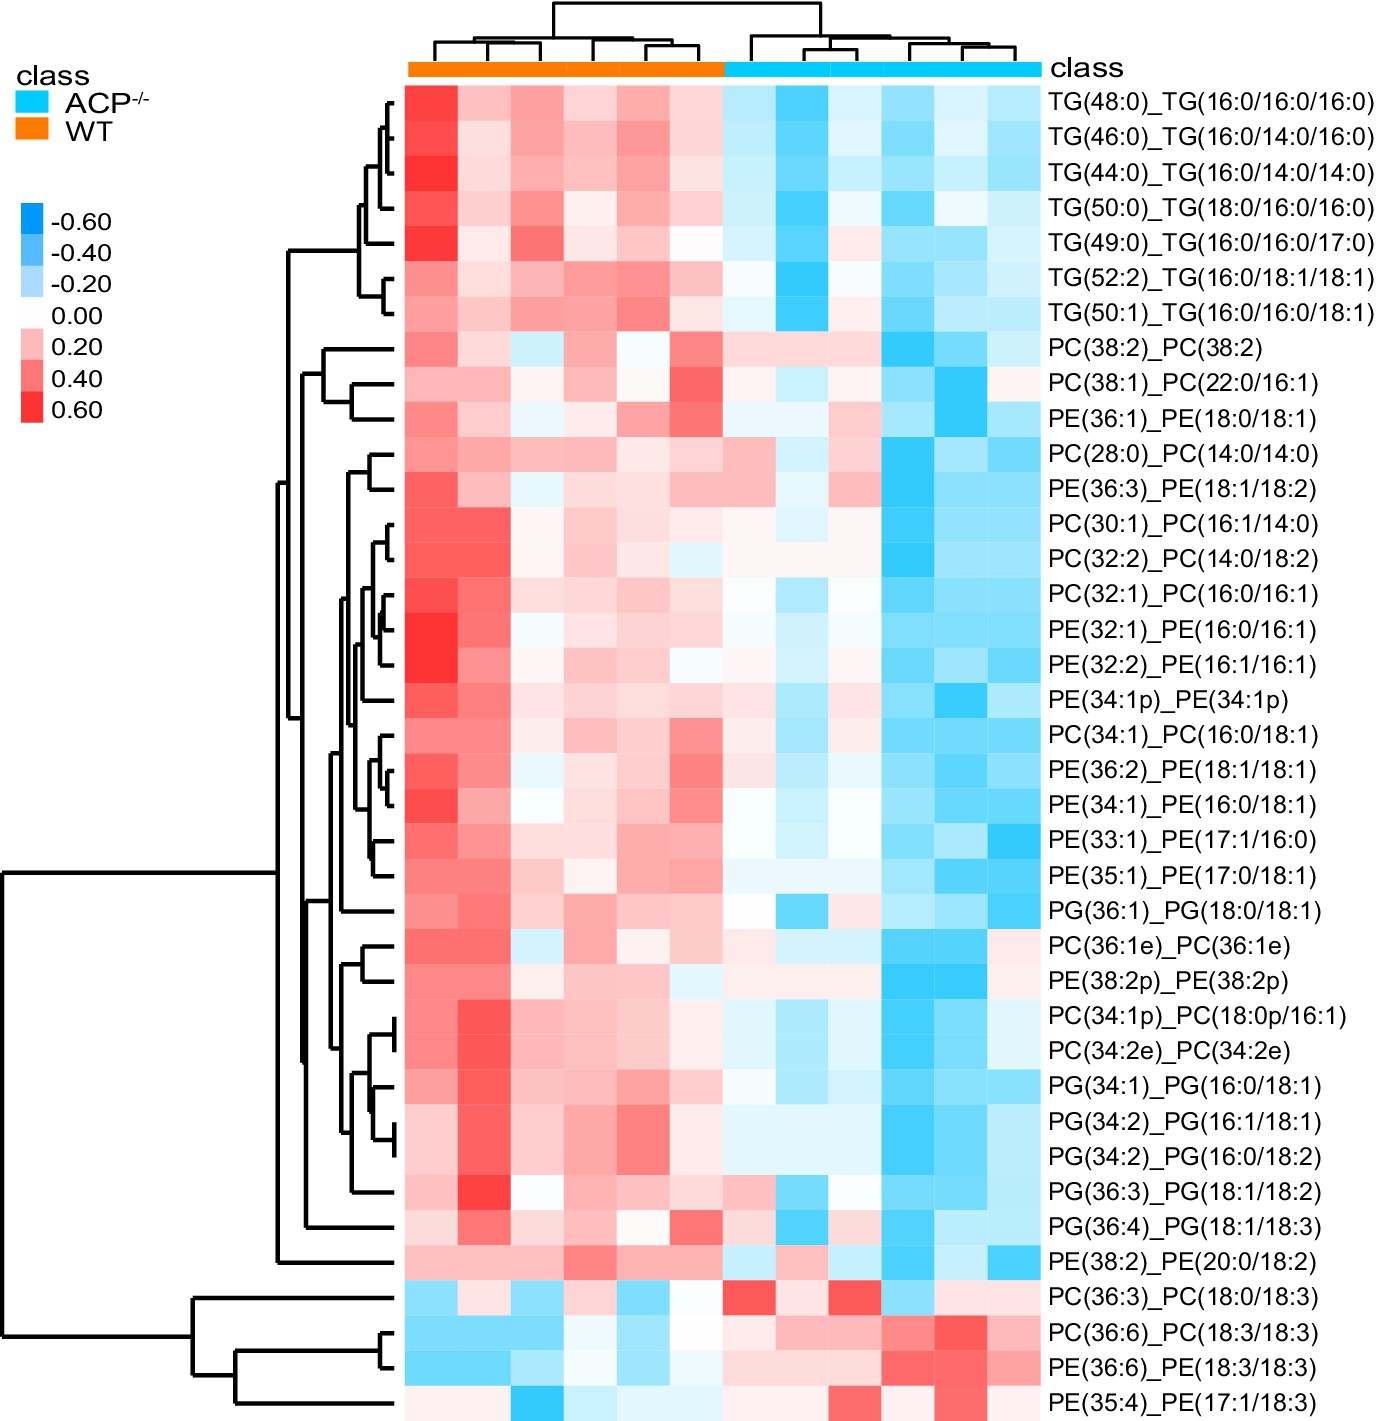
Heat map of TG, PC, and PE in the flight muscle of WT and ACP-/- locusts.
Content of metabolites are highlighted with red (upregulated) and blue (downregulated), respectively.
Figure 5—figure supplement 4
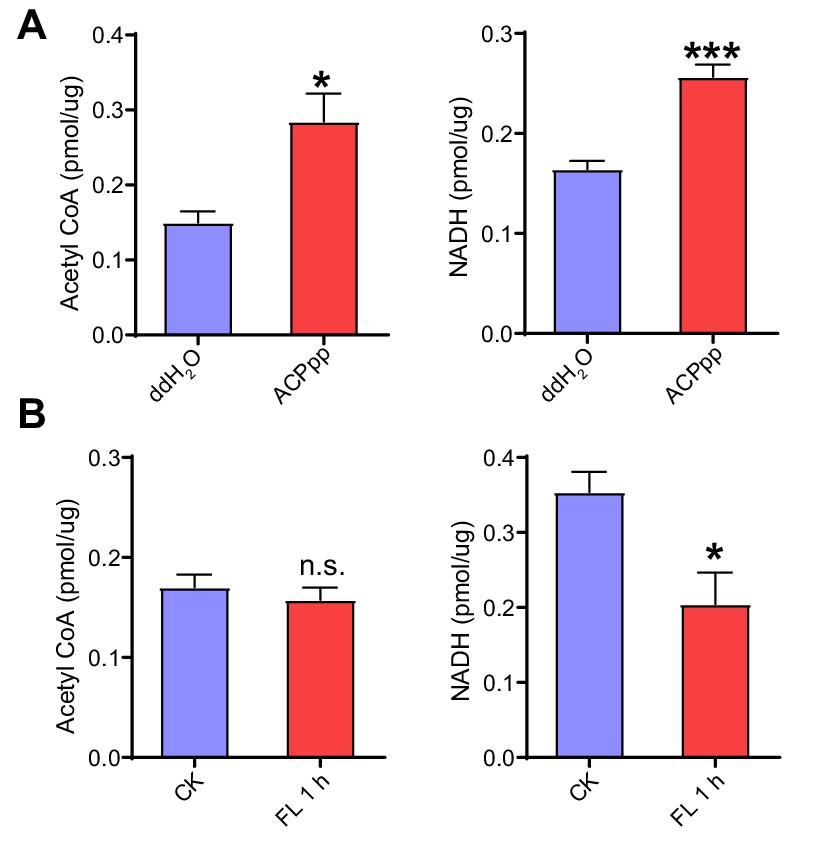
Measurements of acetyl CoA and NADH levels in the flight muscle after ACP peptide injection and 1 h-sustained flight in WT locusts.
(A) Abundance detection of acetyl CoA and NADH in the flight muscle after injection of ACP peptide in WT locusts. (B) Abundance detection of acetyl CoA and NADH in the flight muscle upon 1 h-sustained flight (Student’s t-test, p=0.0104 and 0.0002 for A; p=0.4967 and 0.0173 for B, *p<0.05, **p<0.01, ***p<0.001, n = 5 replicates, 3–4 locusts/replicate). Data are shown as mean ± SEM. CK indicates control, FL 1 hr indicates 1h-sustained flight.
Figure 6 with 1 supplement
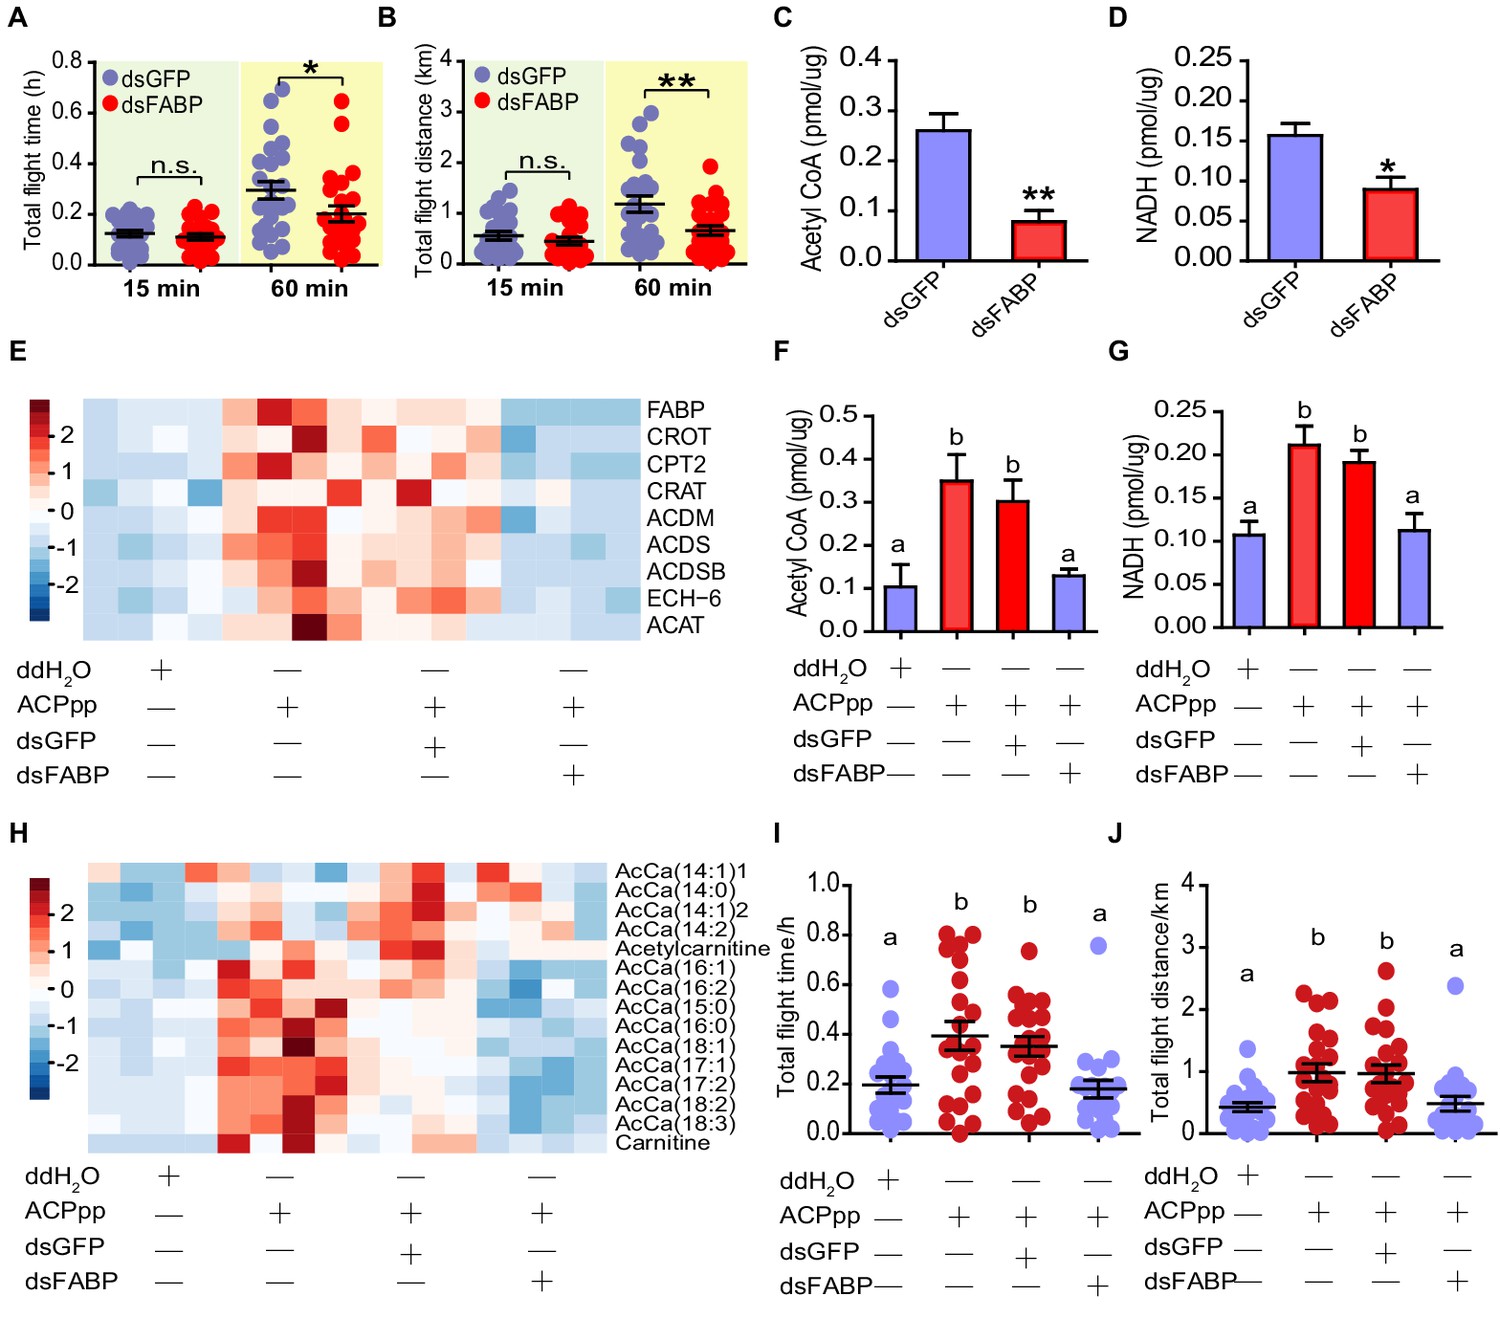
FABP mediates the regulatory effects of ACP on lipid metabolism and flight activity.
(A) Total flight time and (B) total flight distance after knockdown of FABP in adult locusts (Student’s t-test for A, p=0.451, t = 0.7609, df = 44, n = 24 (dsGFP) and 22 (dsFABP) for 15 min, p=0.021, t = 1.992, df = 48, n = 25 (dsGFP) and 25 (dsFABP) for 60 min; for B, p=0.337, t = 0.9713, df = 44, n = 24 (dsGFP) and 22 (dsFABP) for 15 min, p=0.007, t = 2.796, df = 48, n = 25 (dsGFP) and 25 (dsFABP) for 60 min, *p<0.05, **p<0.01). Measurement of (C) acetyl CoA and (D) NADH in the flight muscle after knockdown of FABP in adult locusts (Student’s t-test for C, p=0.0011, t = 4.499, df = 10, n = 6 (dsGFP) and 6 (dsFABP), for D, p=0.017, t = 3.124, df = 7, n = 5 (dsGFP) and 4 (dsFABP)). (E) Expression levels of beta-oxidation-related genes in flight muscle after FABP knockdown in ACP-/- locusts injected with ACP peptide. Unsupervised hierarchical clustering was performed using Clustal 3.0 under uncentered Pearson correlation and average linkage conditions; the results are presented by Java Treeview software. Measurement of (F) acetyl CoA, (G) NADH, and (H) acetyl carnitine in the flight muscle after knockdown of FABP in ACP-/- locusts injected with ACP peptide (one-way ANOVA for F, F = 7.143, df = 3, p=0.0026, n = 5, 5, 5, and six from left to right, respectively; for G, F = 8.673, df = 3, p=0.0012, n = 5, 5, 5, and five from left to right, respectively). Measurement of (I) total flight time and (J) total flight distance after knockdown of FABP in ACP-/- locusts preinjected with ACP peptide (one-way ANOVA for I, F = 6.274, df = 3, p=0.0007; for J, F = 5.93, df = 3, p=0.001, for both I and J, n = 20, 21, 21, and 20 from left to right, respectively). Different letters indicate that there is a significant difference between two groups. See Figure 6—source data 1 for details.
-
Figure 6—source data 1
Raw data for flight activity, metabolite contents, and gene expression.
- https://cdn.elifesciences.org/articles/65279/elife-65279-fig6-data1-v3.xlsx
Figure 6—figure supplement 1
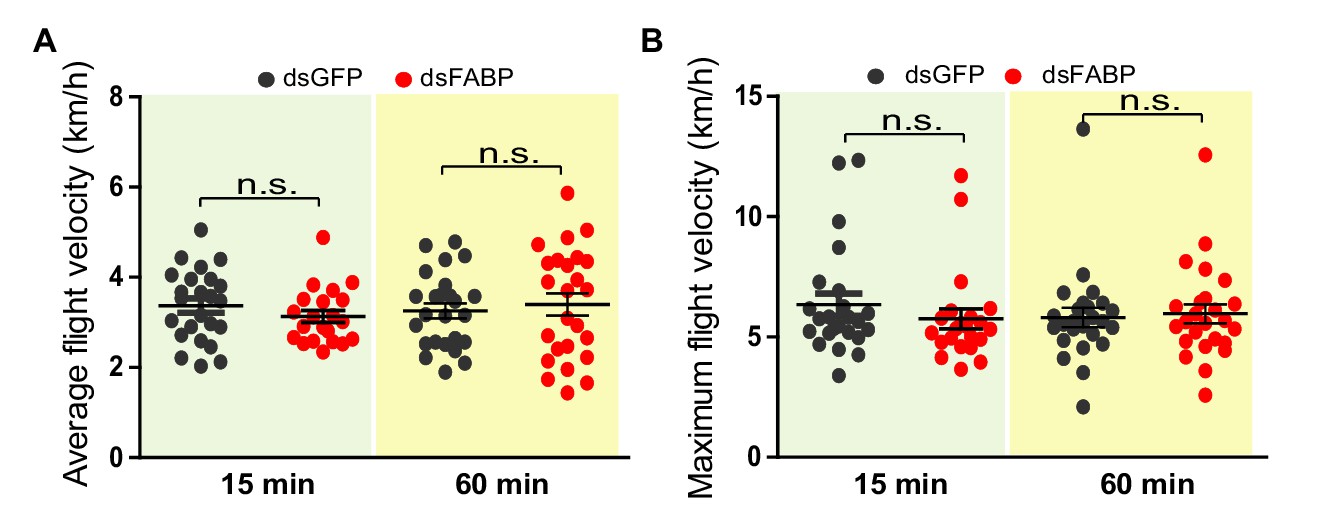
Flight speed measurement after knockdown of FABP in the locust.
Measurements of (A) average flight velocity and (B) maximum flight velocity after knockdown of FABP in the locust. Each dot represents a single individual (Student’s t-test, p=0.2705, t = 1.116, df = 43 for 15 min in A; p=0.6409, t = 0.4694, df = 48 for 60 min in A; p=0.3532, t = 0.9384, df = 44 for 15 min in B; p=0.7766, t = 0.2854, df = 48 for 60 min in B, n > 20, n.s. indicates not significant).
Figure 7
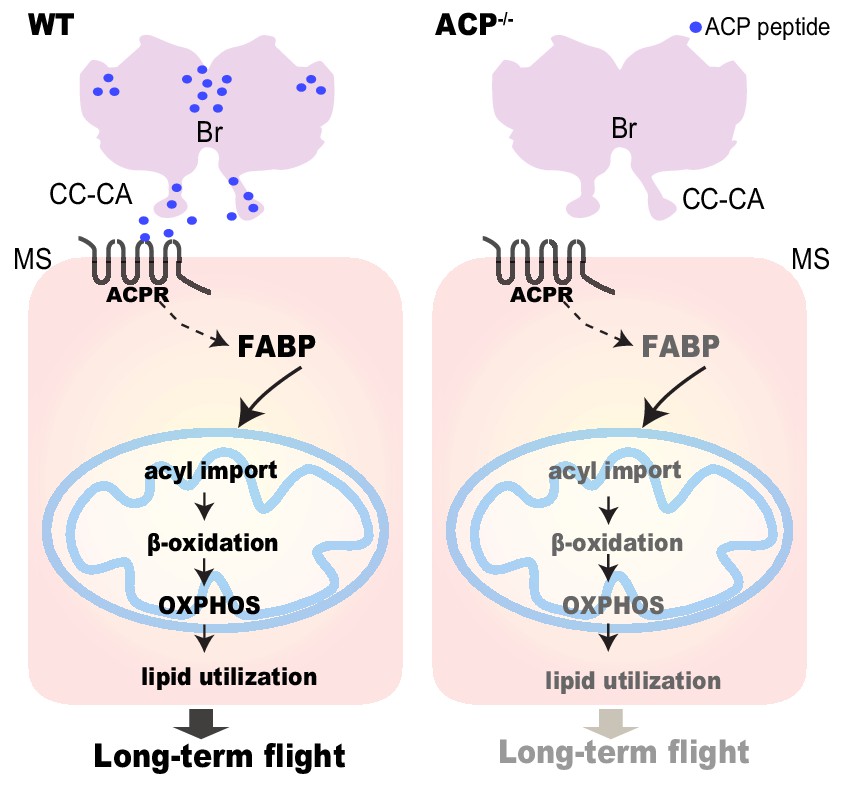
Schematic model showing that the neuropeptide.
ACP regulates long-term flight by affecting FABP-mediated fatty acid transport and subsequent β-oxidation in the flight muscle. Neuropeptide ACP is produced from the brain and could be secreted into the circulation through CC-CA. Fatty acid transport and lipid utilization are significantly downregulated in the flight muscle of the ACP mutant, thereby resulting in decreased prolonged flight performance.
Author response image 1
Author response image 2
Tables
Key resources table
| Reagent type (species) or resource | Designation | Source or reference | Identifiers | Additional information |
|---|---|---|---|---|
| Gene (Locust migratoria) | ACP | Yang et al., 2019 | http://www.locustmine.org:8080/locustmine (LOCMI05723) | |
| Gene (Locust migratoria) | ACPR | Yang et al., 2019 | http://www.locustmine.org:8080/locustmine (comp340809_c0_seq1) | |
| Genetic reagent (Locust migratoria) | GeneArtPrecision gRNA Synthesis Kit | ThermoFisher | A29377 | |
| Genetic reagent (Locust migratoria) | Cas9 protein | Invitrogen | A36496 | |
| Antibody | (anti-ACP rabbit polyclonal) | This paper | Produced by ABclone, China | (1:200) |
| Antibody | Alexa Fluor-488 goat anti-rabbit IgG | Life Technologies | Cat. A-11008 | (1:500) |
| Antibody | anti-FABP | This paper | Developed by ABclone, China | (1:5000) |
| Antibody | anti-CPT2 | Abcam | ab153869 | (1:1000) |
| Antibody | anti-ACDM | Abcam | ab92461 | (1:1000) |
| Antibody | Goat anti-rabbit IgG secondary antibody | EASYBIO | BE0101-100 | (1:5000) |
| Antibody | Polyclonal antibody against tubulin | This paper | Produced by ABclone, China | (1:5000) |
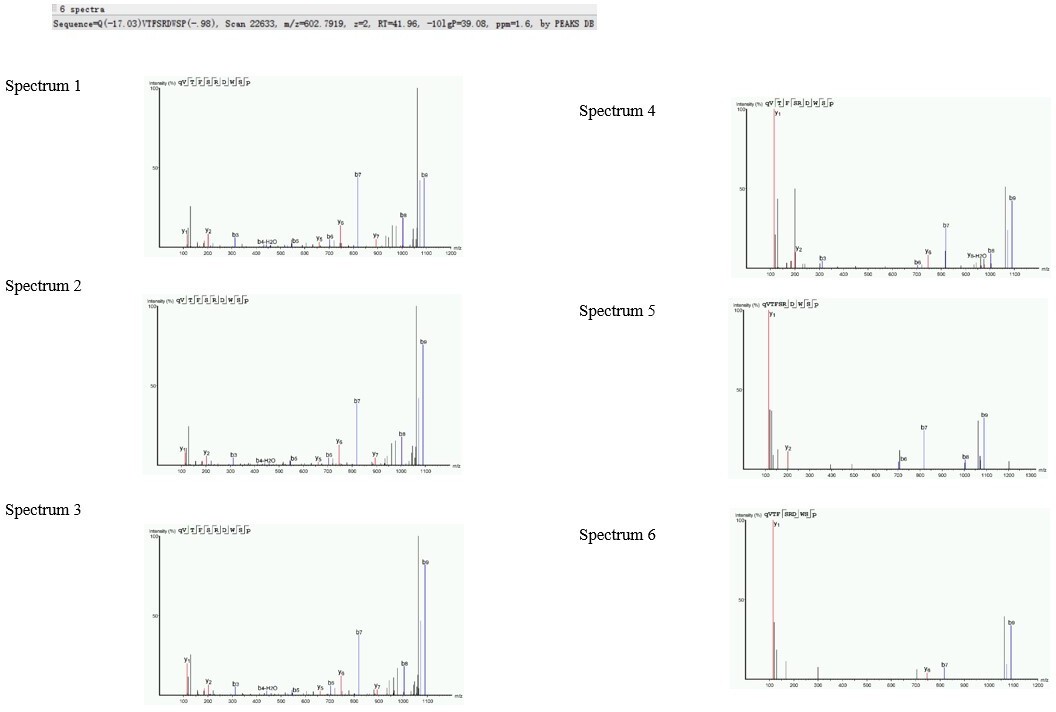
| Peptide, recombinant protein | ACP peptide | ABclone | pQVTFSRDWSPGamide | |
| Commercial assay or kit | Acetyl-CoA assay kit | Sigma-Aldrich | MAK039 | |
| Commercial assay or kit | NAD/NADH Assay Kit | Abcam | ab65348 | |
| Commercial assay or kit | Pyruvate Colorimetric/Fluorometric Assay Kit | BioVison | K609 | |
| Commercial assay or kit | Citric acid content detection kit | Solarbio | BC2150 | |
| Chemical compound, drug | LightCycler 480 SYBR Green I Master | Roche | 04887352001 | |
| Software, algorithm | GraphPad Prism 5 | GraphPad Software | RRID:SCR_002798 |
Additional files
-
Supplementary file 1
Neuropeptides identified in the brain and retrocerebral complex by peptidome.
- https://cdn.elifesciences.org/articles/65279/elife-65279-supp1-v3.xlsx
-
Supplementary file 2
Mutation efficiency of the ACP gene in G0 and G1 generation locusts.
- https://cdn.elifesciences.org/articles/65279/elife-65279-supp2-v3.docx
-
Supplementary file 3
Mutation efficiency of the ACPR gene in G0 and G1 generation locusts.
- https://cdn.elifesciences.org/articles/65279/elife-65279-supp3-v3.docx
-
Supplementary file 4
Primers for qPCR, gRNA synthesis, and RNAi experiment.
- https://cdn.elifesciences.org/articles/65279/elife-65279-supp4-v3.docx
-
Transparent reporting form
- https://cdn.elifesciences.org/articles/65279/elife-65279-transrepform-v3.pdf
Download links
A two-part list of links to download the article, or parts of the article, in various formats.
Downloads (link to download the article as PDF)
Open citations (links to open the citations from this article in various online reference manager services)
Cite this article (links to download the citations from this article in formats compatible with various reference manager tools)
Neuropeptide ACP facilitates lipid oxidation and utilization during long-term flight in locusts
eLife 10:e65279.
https://doi.org/10.7554/eLife.65279


