CTP and parS coordinate ParB partition complex dynamics and ParA-ATPase activation for ParABS-mediated DNA partitioning
- Laboratory of Molecular Biology, National Institute of Diabetes and Digestive and Kidney Diseases, National Institutes of Health, United States
- Biochemistry and Biophysics Center, National Heart, Lung, and Blood Institute, National Institutes of Health, United States
Figures
Figure 1
Schematic of flow cell setup for visualizing the binding and dissociation of fluorescent proteins on DNA-carpet.
ParAF-eGFP and ParBF-Alexa647 proteins were flowed over a dense carpet of nsDNA attached to the supported lipid bilayer coated surface of a flow cell. TIRF microscopy permits selective detection of the DNA-carpet bound proteins. Sample solution and wash buffer, as specified for each experiment, were infused via two syringes at different infusion rates from separate inlets into a Y-shaped flow cell. A laminar boundary separates the two solutions downstream of the flow convergence point at the Y-junction. At the midpoint across the flow channel, downstream but close to the flow convergence point where the observations are made, the DNA-carpet area is exposed to the syringe content of the higher infusion rate. When the infusion rates of the two syringes are switched, the laminar boundary moves across the observation area and the solution flowing over the area switches. By switching the infusion rates of the two syringes repeatedly, multiple DNA-carpet-bound protein complex assembly and wash cycles can be recorded.
Figure 2 with 4 supplements
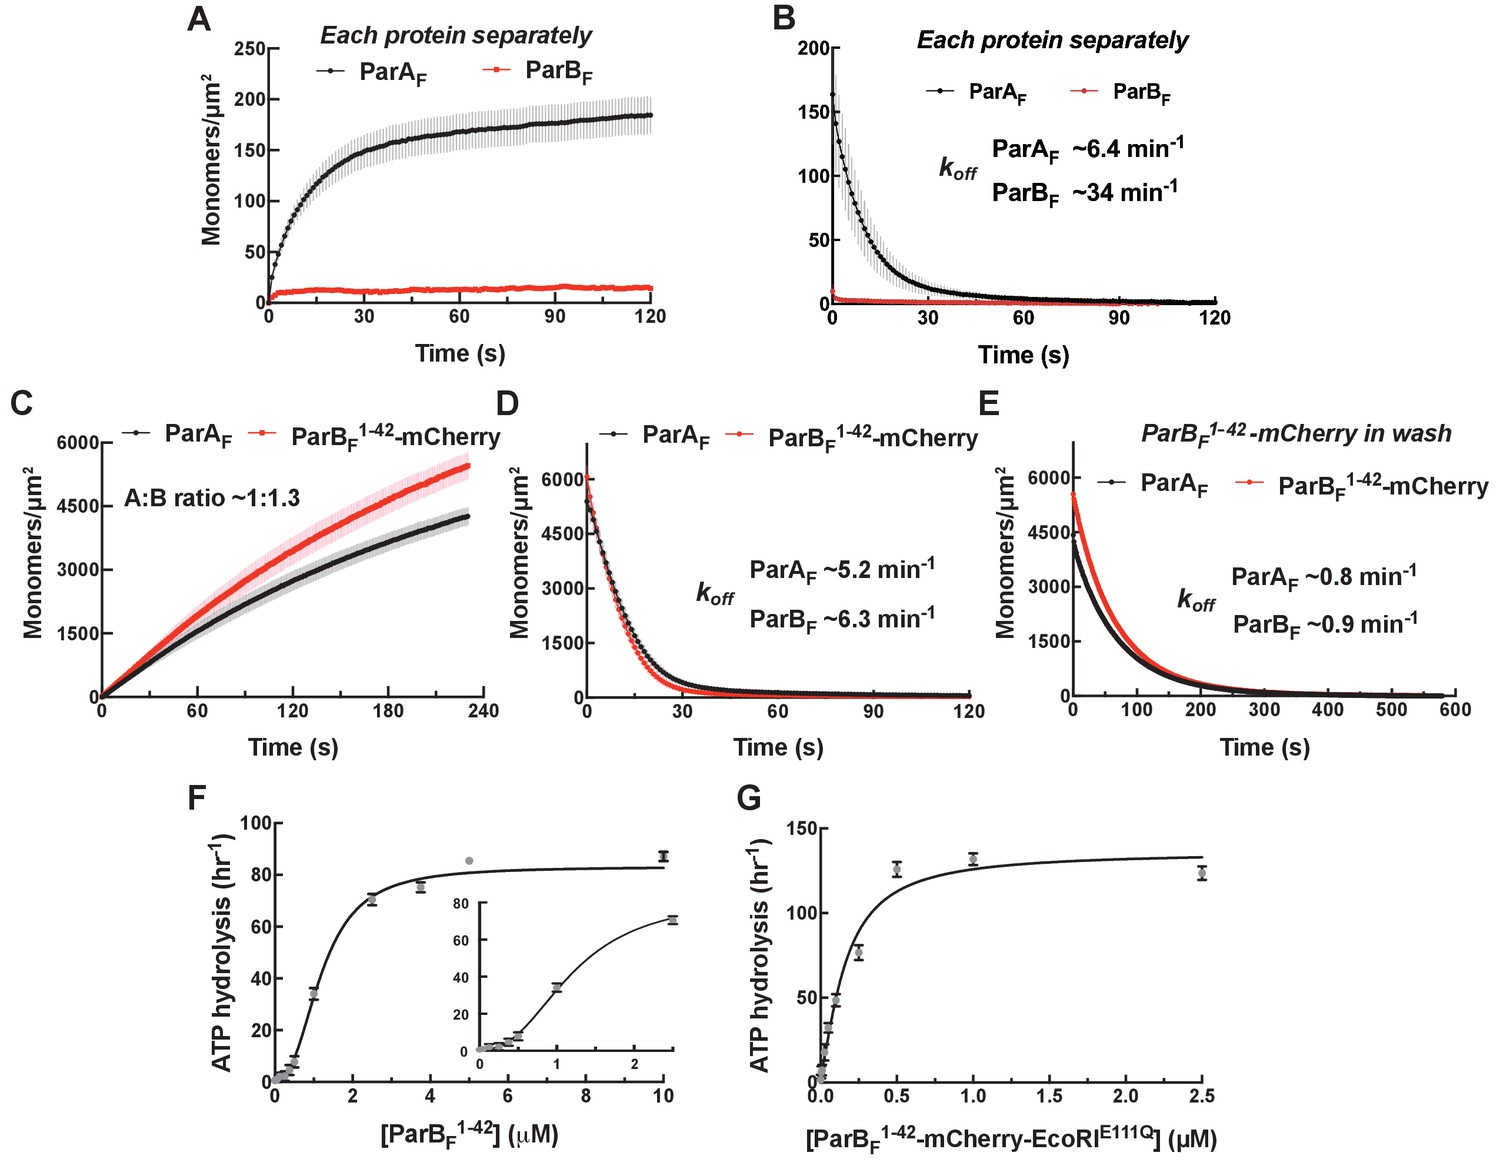
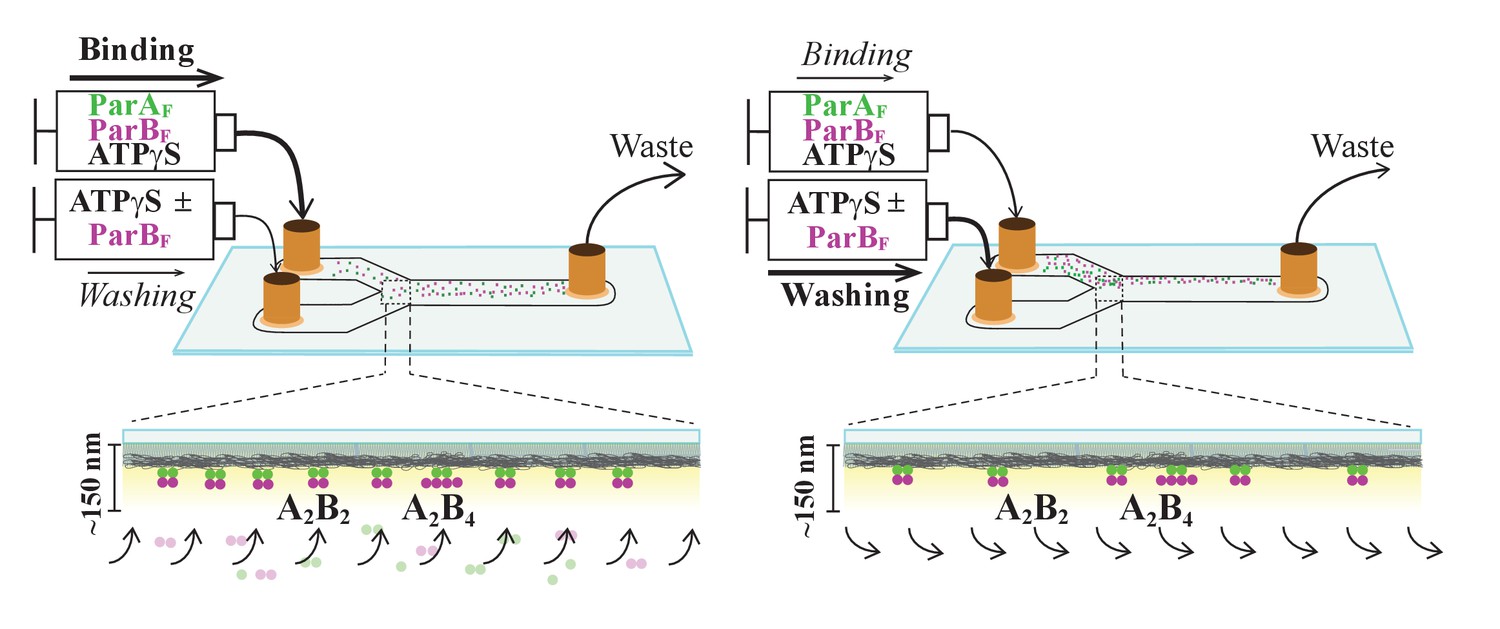
Monomeric ParBF1-42-mCherry can activate ParAF for nsDNA binding in the presence of ATPγS by forming a ~1:1 complex.
Protein sample solution in the presence of ATPγS (1 mM) was infused into nsDNA-carpeted flow cell at a constant flow to monitor the protein binding to the nsDNA, and the sample solution was switched to a wash buffer containing ATPγS to monitor protein dissociation from nsDNA. (A, B) Binding to, and dissociation from, nsDNA of ParAF-eGFP (1 μM) or ParBF-Alexa647 (2 μM) were measured separately. (C) ParBF1-42-mCherry (10 μM) and ParAF-eGFP (1 μM) preincubated with ATPγS were infused into the nsDNA-carpeted flow cell and (D) washed with buffer containing ATPγS. (E) The washing experiment of (D) was repeated with wash buffer containing ATPγS and ParBF1-42-mCherry (10 μM). For the parameters of the time courses of above experiments and subsequent experiments of the same type in this study, see Table 1. The ParBF:ParAF ratio was calculated from carpet-bound densities of the two proteins measured in parallel, and summarized in Table 1. (F) ParAF-ATPase activity (expressed as turnover rate per ParAF monomer) was measured in the presence of EcoRI-digested pBR322 DNA (60 μg/ml) and different concentrations of ParBF1-42. Inset shows a plot with expanded abscissa. (G) ParAF-ATPase activity was measured as above in the presence of dimeric ParBF1-42-mCherry-EcoRIE111Q. The parameters of ATPase stimulation curves in these and subsequent figures are summarized in Table 2.
Figure 2—figure supplement 1
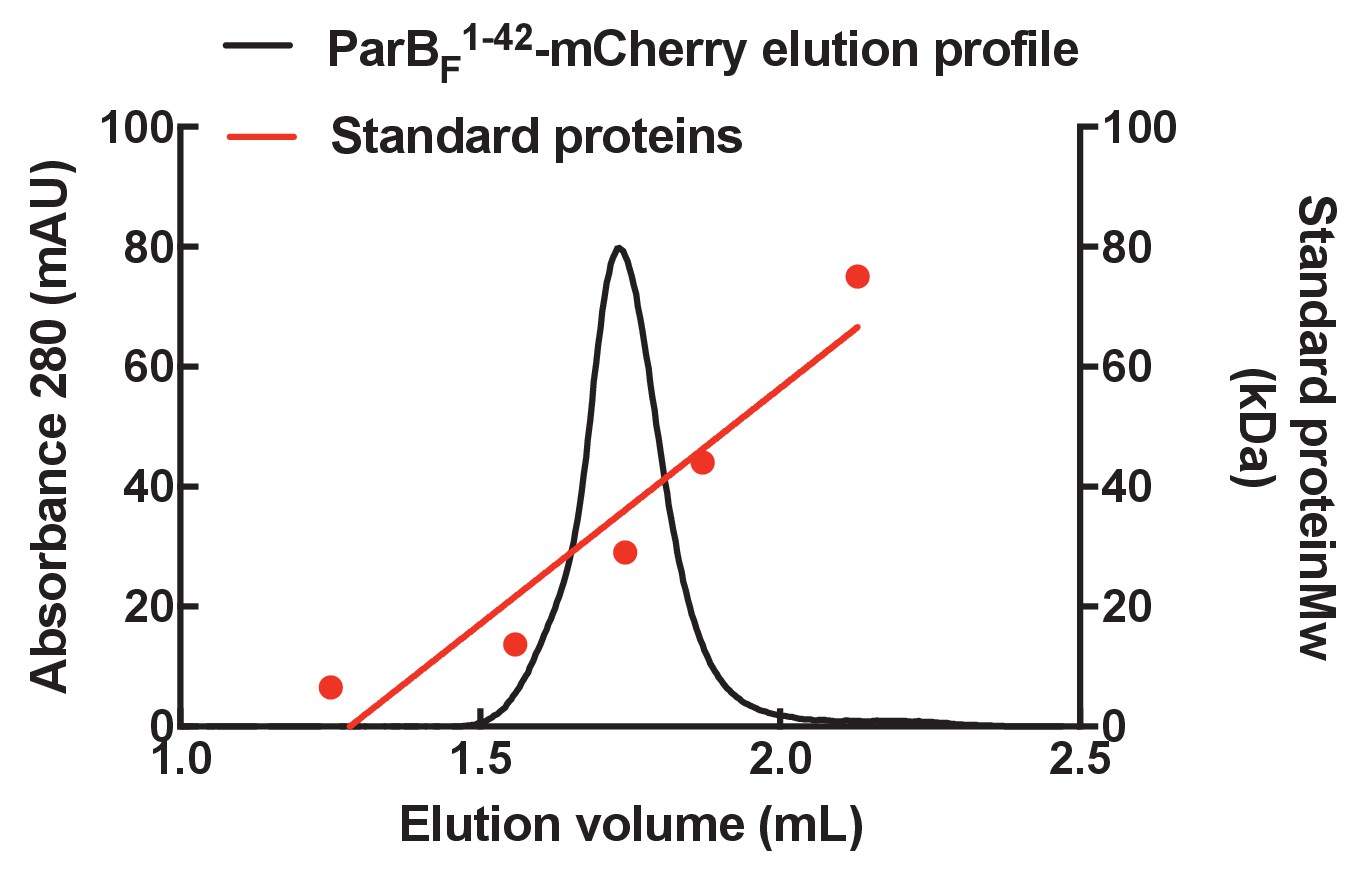
Gel filtration column elution profile of ParBF1-42-mCherry.
The elution profile of ParBF1-42-mCherry on a Superose 6 3.2/300 column (GE Healthcare) with a standard curve generated using a protein standards kit (GE Healthcare). The molecular weight of ParBF1-42-mCherry was estimated to be ~35 kDa, close to the predicted molecular weight for a monomer of ~33 kDa.
Figure 2—figure supplement 2
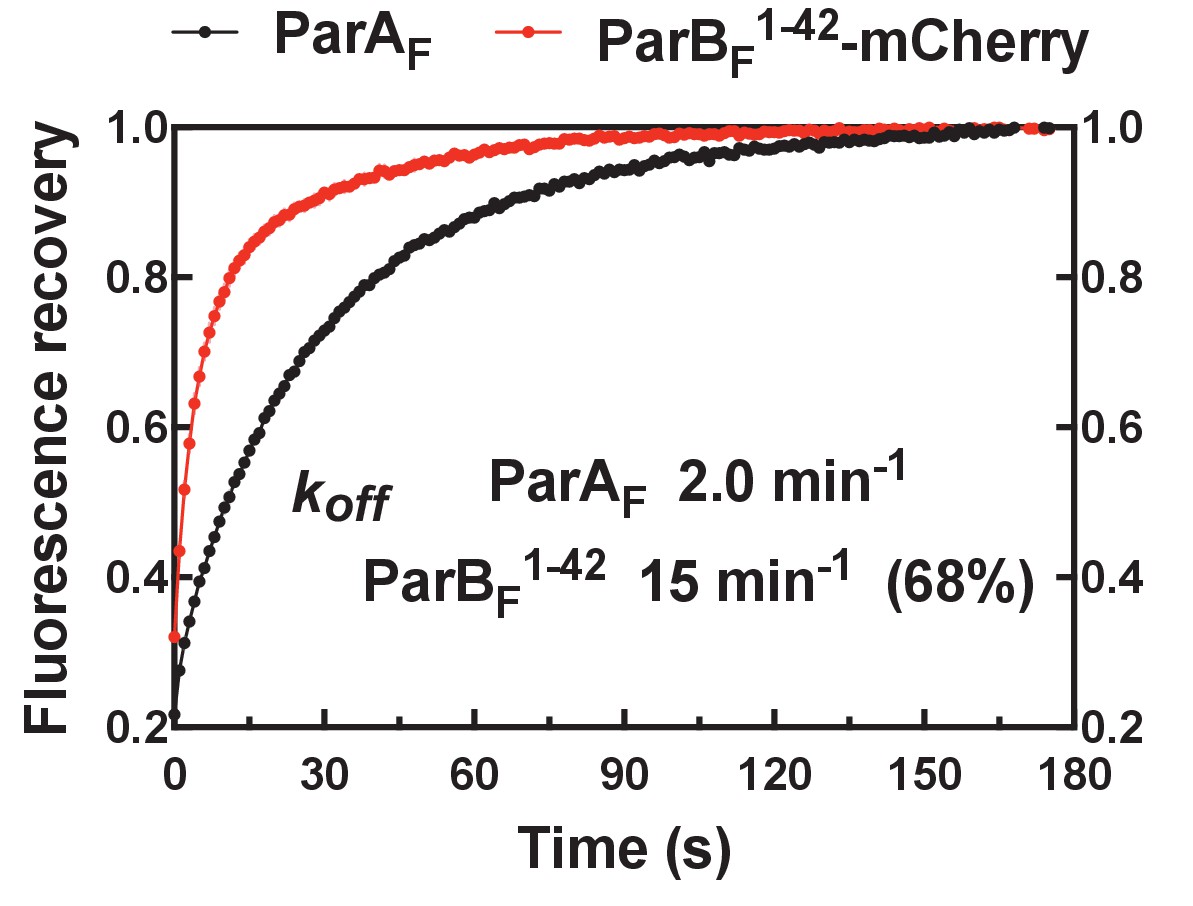
FRAP of ParAF-eGFP and ParBF1-42-mCherry on DNA-carpet.
ParBF1-42-mCherry exchanged significantly faster than ParAF after photo-bleaching. Data have been normalized to the maximum fluorescence recovery. The data were fitted to a single-exponential curve for ParAF and a double-exponential curve for ParBF, which was not well fit with a single-exponential recovery curve. ParAF recovered with kexcg ~2.0 min−1, and ParBF recovered with kexcg ~15 min−1 for the faster (68%), and ~2.0 min−1 for the slower, recovery components. Multi-exponential recovery kinetics can be explained by the relatively large bleached area causing variable diffusion distance for the unbleached molecules need to travel for full fluorescence recovery of the bleached area (this affects recovery of faster recovering components more significantly). An alternative explanation that assumes a 30% population of stable ParAF-ParBF1-42-mCherry complex is unlikely since the buffer wash experiment (Figure 2D) did not support the presence of such a species.
Figure 2—figure supplement 3
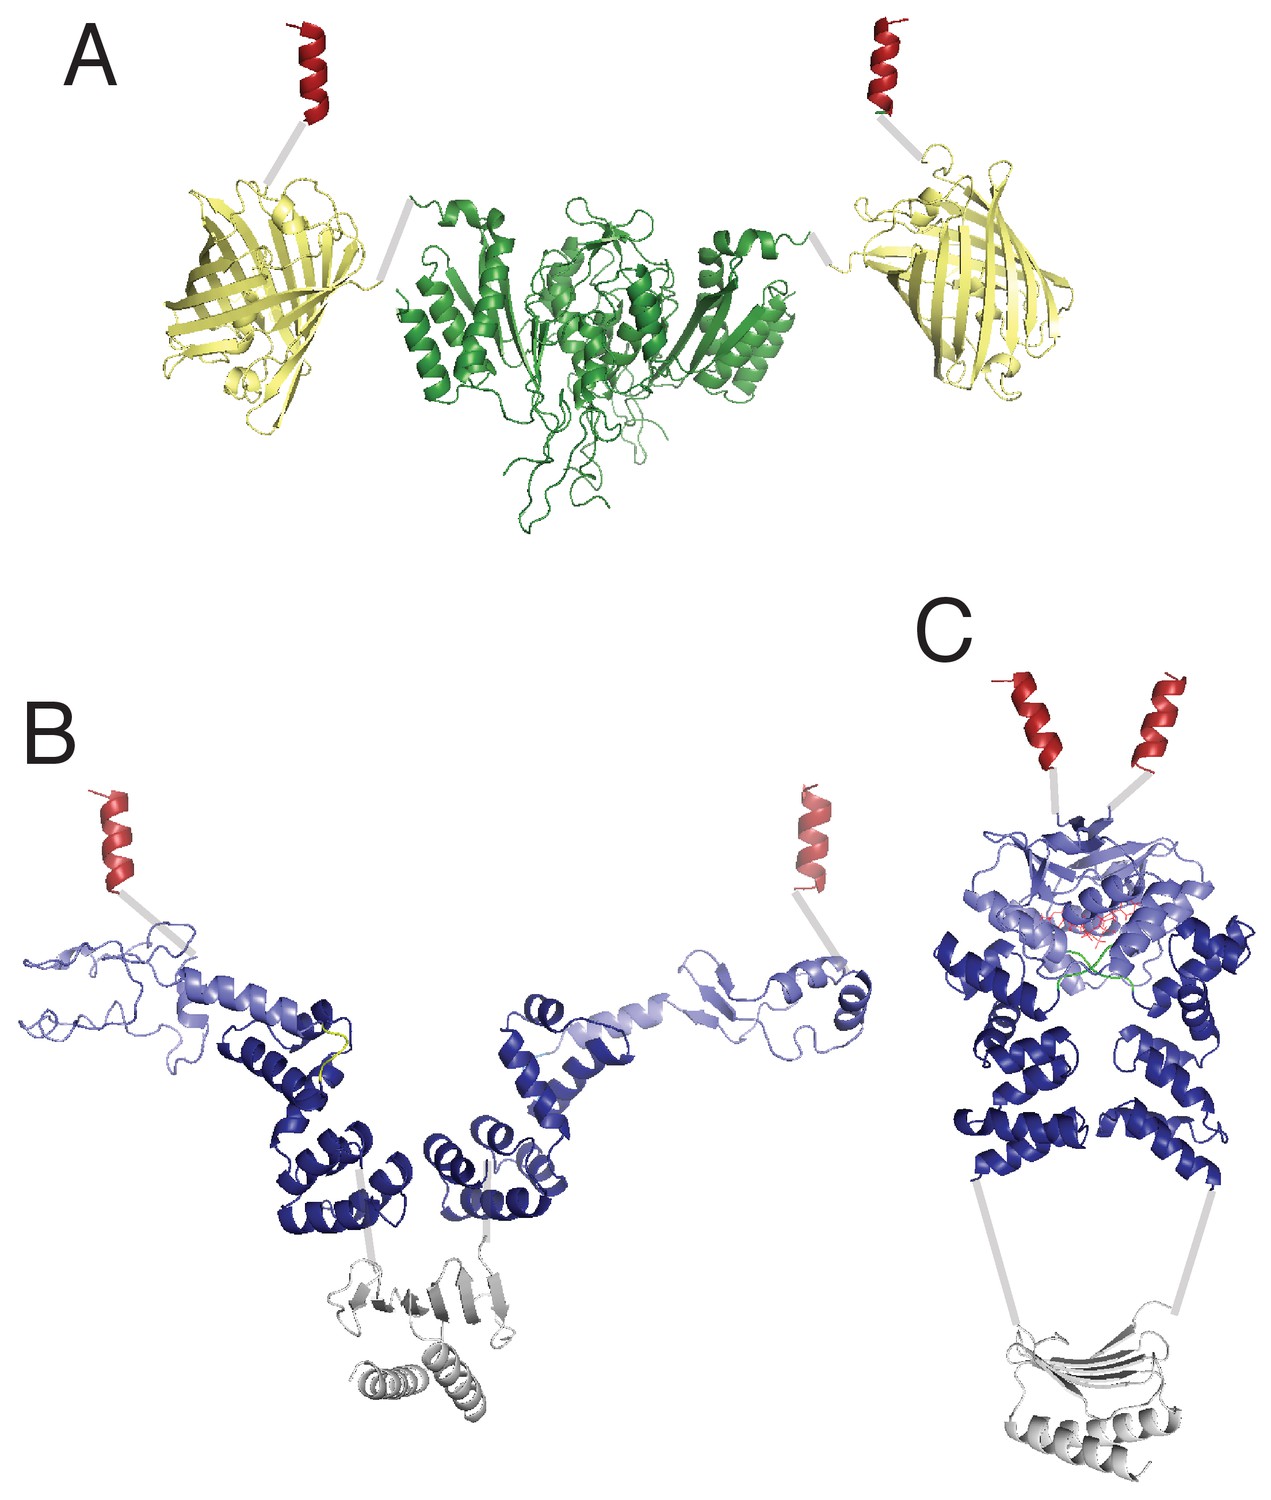
Comparison of possible structural domain arrangements of artificially dimeric ParBF1-42-mCherry-EcoRIE111Q.
(A) ParBF dimer structure in the absence (B) and presence (C) of C-nucleotide. This figure depicts montages of domain structures connected by gray lines representing presumed flexible linkers. The structures of the protein domains are based on the following PDB files: EcoR1 (dark green): 1qc9, mCherry (pale yellow): 2h5q, ParB dimerization domain (gray): 1zx4, ParB DNA-binding domain (dark blue) plus CTPase domain (pale blue) in the absence of C-nucleotide: 4umk, ParB DNA-binding domain plus CTPase domain bound to CDP: 6sdk. The dark red helix symbolizes the ParAF interaction domain, which is expected to form an α-helix upon binding ParAF. The domain arrangement in (B) is loosely based on the proposal by Chen et al., 2015, which is based on the SAXS envelope of ParBHp dimer in the absence of C-nucleotide.
Figure 2—figure supplement 4

ParAF ATPase stimulation by ParBF1-42-mCherry-EcoRIE111Q is not influenced by the addition of DNA fragment containing EcoRI recognition sequence.
(A) ParAF-ATPase activation curve of ParBF1-42-mCherry-EcoRIE111Q in the absence of the EcoRI sequence duplex (Figure 2G) is shown for comparison. (B) ParAF-ATPase activity was measured in the presence of EcoRI-digested pBR322 DNA (60 µg/ml), 77 bp duplex DNA fragment containing two EcoRI recognition sequences (5'-GAATTCCGAGTGGGACCGTGGTCCCAGTCTGATTATCAGACCGAGAATTCAAGTTGGGACCGTGGTCCCAAGAGAAT, plus complement; 1.5 µM) and different concentrations of dimeric ParBF1-42-mCherry-EcoRIE111Q.
Figure 3

ParBF1-42 R36A-mCherry dissociates faster from nsDNA-carpet-bound ParAF-ATPγS dimer, and ParAF-ATPase activation requires higher ParBF1-42 R36A concentration.
(A) ParBF1-42 R36A-mCherry (10 μM) and ParAF-eGFP (1 μM) preincubated with ATPγS were infused into the nsDNA-carpeted flow cell and then (B) washed with buffer containing ATPγS. (C) The washing experiment of B was repeated with buffer containing ATPγS and ParBF1-42 R36A-mCherry (10 μM). (D) ParAF-ATPase activity was measured in the presence of EcoRI-digested pBR322 DNA (60 μg/ml) as a function of ParBF1-42 R36A concentration. See Figure 2 legend and Tables 1 and 2 for additional details.
Figure 4 with 2 supplements

parSF DNA alters protein stoichiometry of the ParAF–ParBF complex formed prior to ATP hydrolysis and the extent of ParAF-ATPase activation by ParBF.
(A) ParAF-eGFP (1 μM) and ParBF-Alexa647 (2 μM) preincubated with ATPγS were infused into the nsDNA-carpeted flow cell and then (B) washed with buffer containing ATPγS. (C, D) As (A) and (B) except the sample included the 24 bp parSF DNA fragment (1.1 μM). (E) ParAF-ATPase activity was measured in the presence of EcoRI-digested pBR322 DNA (60 μg/ml), different concentrations of ParBF and either a parSF-DNA fragment or a DNA fragment with a scrambled sequence (1.1-fold higher concentrations than the ParBF dimers). See Figure 2 legend and Tables 1 and 2 for additional details.
Figure 4—figure supplement 1
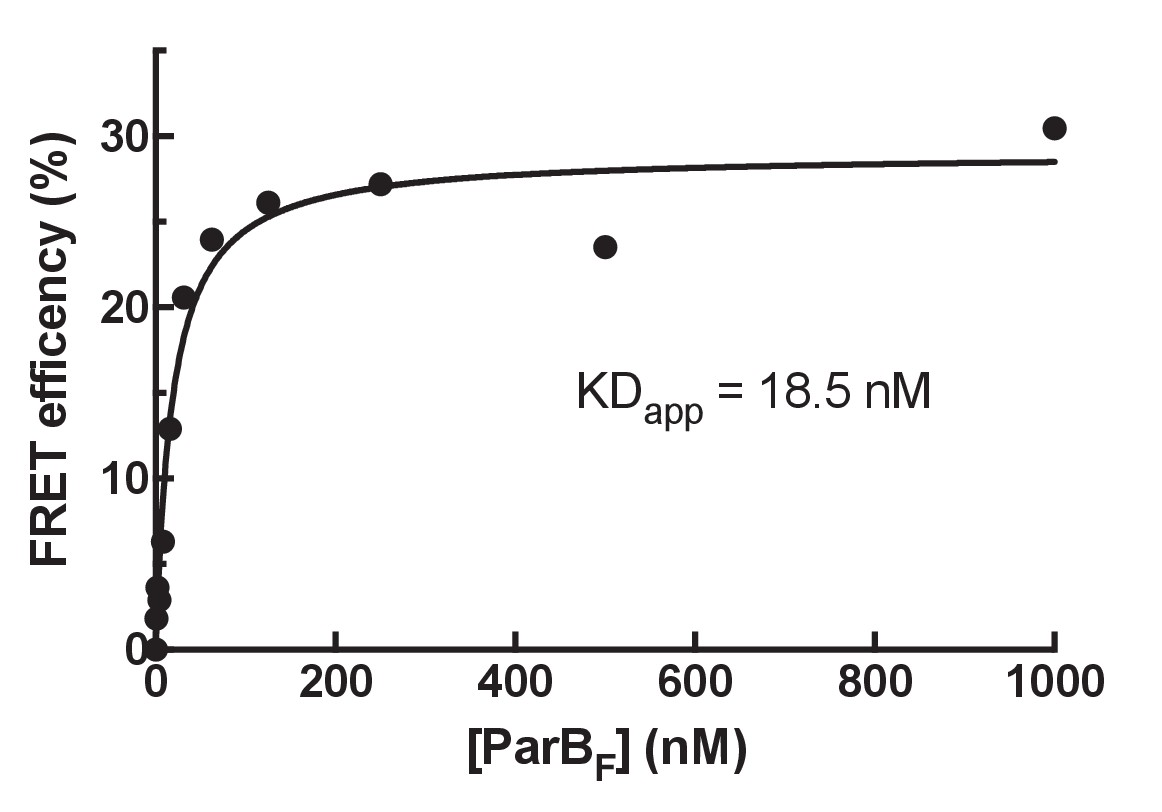
Determination of ParBF monomer-dimer KD by FRET.
In order to estimate the KD for dimerization of ParBF two batches of protein were separately labeled with Alexa 488 or Alexa 594 then mixed at equal concentrations, the sum of which are shown on the x-axis. The FRET efficiency was measured using a fluorescence plate reader (Clariostar Plus, BMG Labtech). Assuming the observed FRET efficiency linearly correlates with the fraction of the protein in the dimer state, the apparent KD for dimerization of ParBF was estimated to be ~18.5 nM.
Figure 4—figure supplement 2

Mutation of a BoxII residue R121A does not affect the affinity of ParBFR121A for parSF, but neither the protein stoichiometry of the ParAF-ParBFR121A complex assembled on nsDNA prior to ATP hydrolysis, nor the extent of ParAF-ATPase activation by ParBFR121A is impacted by the presence of parSF.
ParAF (1 μM) and ParBF R121A (2 μM) were preincubated in the presence of ATPγS either without (A) or together with 24 bp parSF DNA fragment (1.1 μM, C), infused into to the DNA-carpeted flow cell and washed with buffer containing ATPγS (B, D). (E) ParAF ATPase activation by ParBFR121A was measured in the presence of EcoRI-digested pBR322 DNA (60 μg/ml) and different concentrations of ParBFR121A either in the absence (black line) or presence (red line) of parSF (at 10% excess of the dimer concentrations of ParBFR121A). (F) The binding of ParBF or ParBFR121A to 0.1 nM P32-labeled 24 bp parSF DNA (left) or to 0.1 nM P32-labeled 24 bp scrambled DNA (right) was measured by EMSA. A 4–12% gradient acrylamide gel was run in 1× TBE + 5 mM Mg2Ac at 4°C for 1 hr, 150 V. The gels were quantified (bottom) to estimate the parS binding KD of ParBF and ParBFR121A.
Figure 5 with 2 supplements
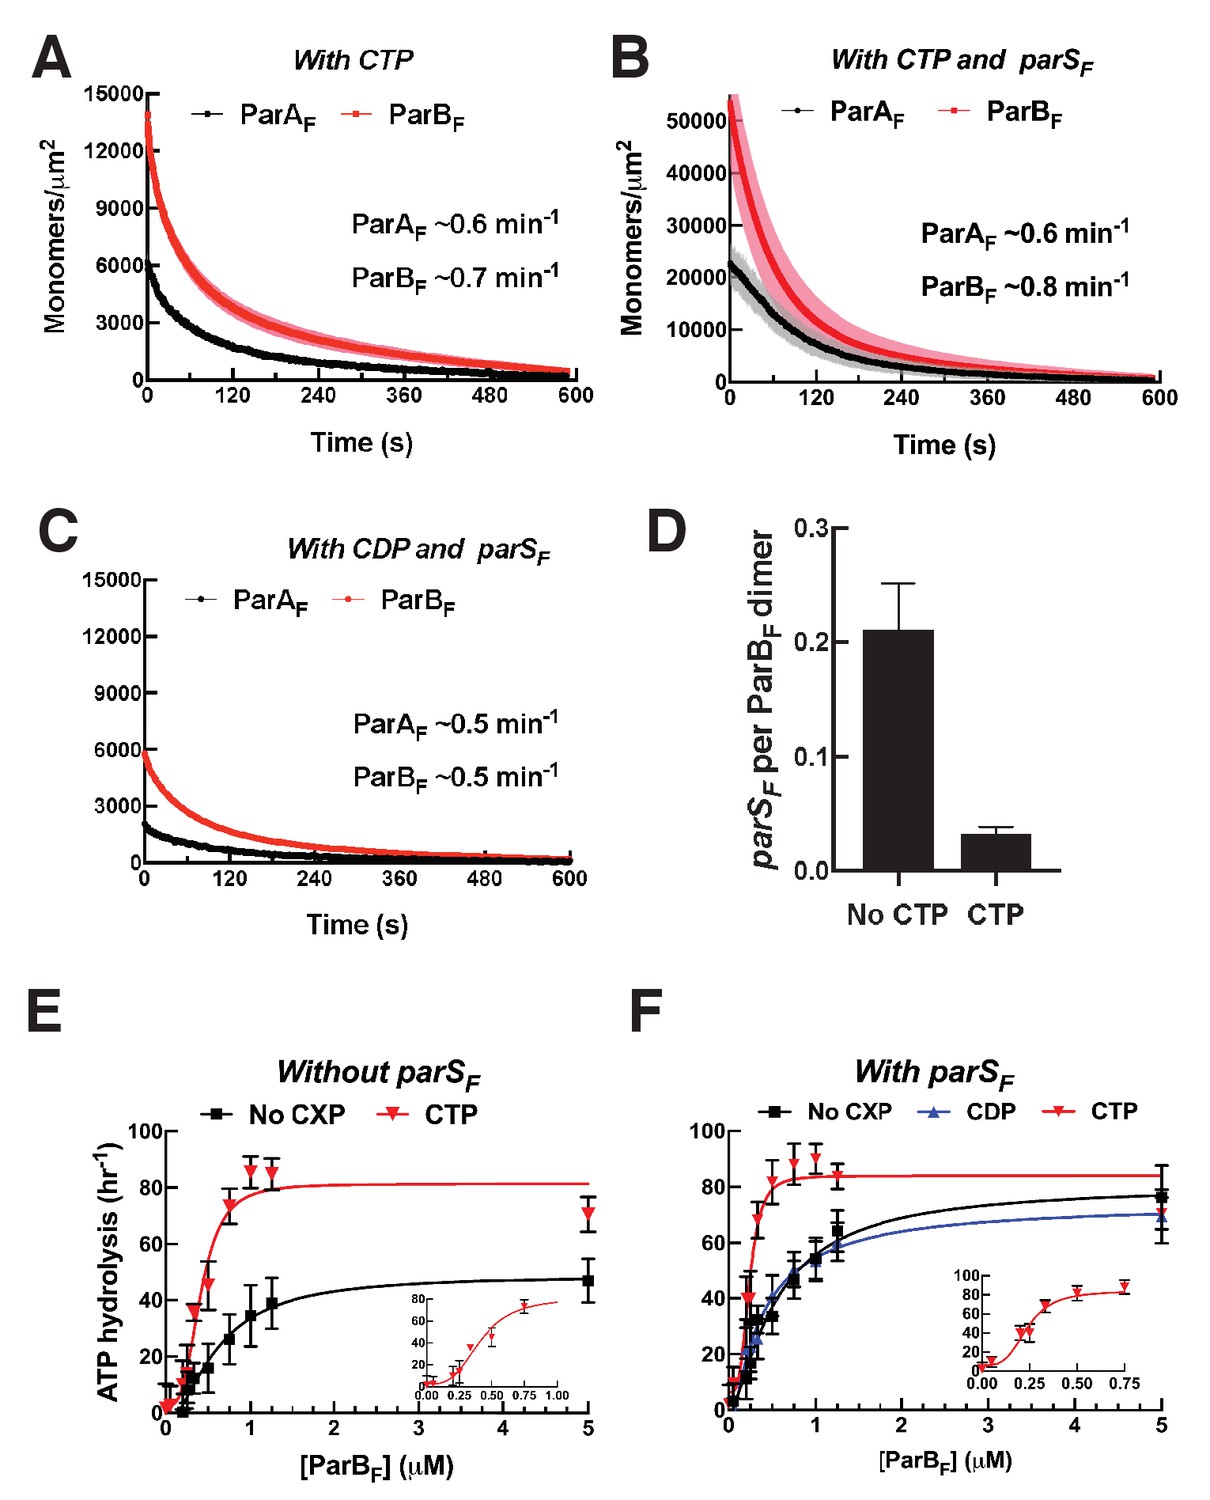
CTP and parSF together alter interactions between ParBF and ParAF dimers.
(A) ParAF-eGFP (1 μM) and ParBF-Alexa647 (2 μM) preincubated with ATPγS and CTP (2 mM) were infused into the nsDNA-carpeted flow cell and then washed with buffer containing ATPγS and CTP. (B) As in (A), except a 24 bp parSF fragment (1.1 μM) was added to the sample mixture. (C) As in (B), except CTP was replaced by CDP. For binding curves, see Figure 5—figure supplement 1A–C. (D) ParAF (1 μM), ParBF-Alexa647 (2 μM) and Alexa488-labeled 24 bp parSF fragment (1.1 μM) preincubated with ATPγS or ATPγS plus CTP (2 mM) were infused into the nsDNA-carpeted flow cell and after 240 s, the ratio of the carpet-bound parSF fragment and ParBF dimer was measured. (E) ParAF-ATPase activity was measured in the presence of EcoRI-digested pBR322 DNA (60 μg/ml), different concentrations of ParBF and either no C-nucleotide or 2 mM CTP. Inset shows data in the presence of CTP with expanded abscissa. (F) As in (E) except the reactions also contained 24 bp parSF fragment (1.1-fold higher concentrations than ParBF dimers). Inset shows data in the presence of parSF and CTP with expanded abscissa. See Figure 2 legend and Tables 1 and 2 for additional details.
Figure 5—figure supplement 1
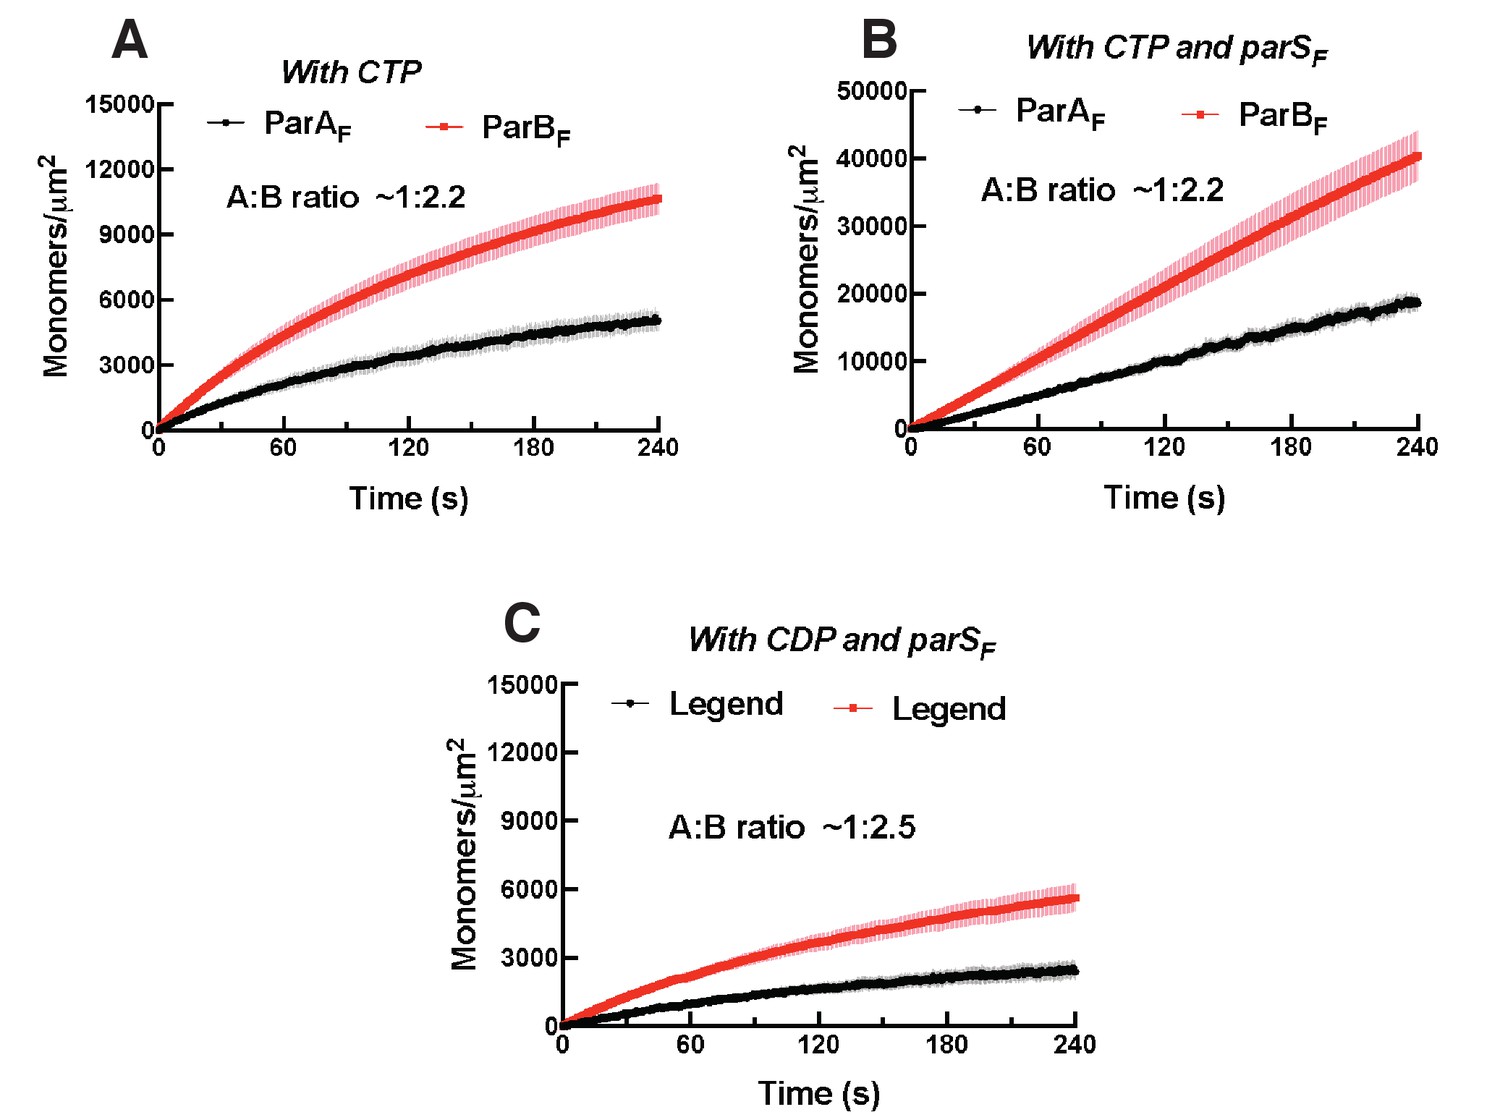
Binding curves for ParAF and ParBF with CDP or CTP associating with the DNA-carpet.
(A) ParAF-eGFP (1 μM) and ParBF-Alexa647 (2 μM) preincubated in the presence of ATPγS and 2 mM CTP were infused into the nsDNA-carpeted flow cell. (B) ParAF-eGFP (1 μM) and ParBF-Alexa647 (2 μM) preincubated in the presence of 24 bp parSF DNA fragment (1.1 μM), ATPγS and 2 mM CTP were infused into the nsDNA-carpeted flow cell. (C) ParAF-eGFP (1 μM) and ParBF-Alexa647 (2 μM) preincubated in the presence of 24 bp parSF DNA fragment (1.1 μM), ATPγS and 2 mM CDP were infused into the nsDNA-carpeted flow cell.
Figure 5—figure supplement 2

Nucleotide specificity and CTPase activity of ParBF in the presence of different concentrations of CTP, in the presence or absence of parSF.
(A) NTPase activities of ParBF (0.84 μM) in the presence of 100 μM ribonucleoside triphosphates were measured in the CTPase buffer (Materials and Methods). (B) The CTP hydrolysis initial rate by ParBF (0.84 μM) was measured at different CTP concentrations to estimate the apparent CTP KM with or without 100 nM parSF (24 bp duplex with one copy of ParBF binding consensus sequence). (C) parSF concentration dependence of the CTPase activity of ParBF (0.84 μM, 100 μM CTP). Pronounced sigmoidal parSF concentration dependency of the CTPase stimulation was observed. This is in contrast to the hyperbolic parSBsu concentration dependency reported for ParBBsu (Soh et al., 2019). The mechanistic reason for this concentration dependency is currently under investigation. (D) CDP used in this study contained a compound that can be hydrolyzed by ParBF to release Pi. Time course of Pi production from 1 mM CDP in the presence of 0.84 μM ParBF is compared to reactions containing 5–150 μM CTP.
Figure 6 with 3 supplements
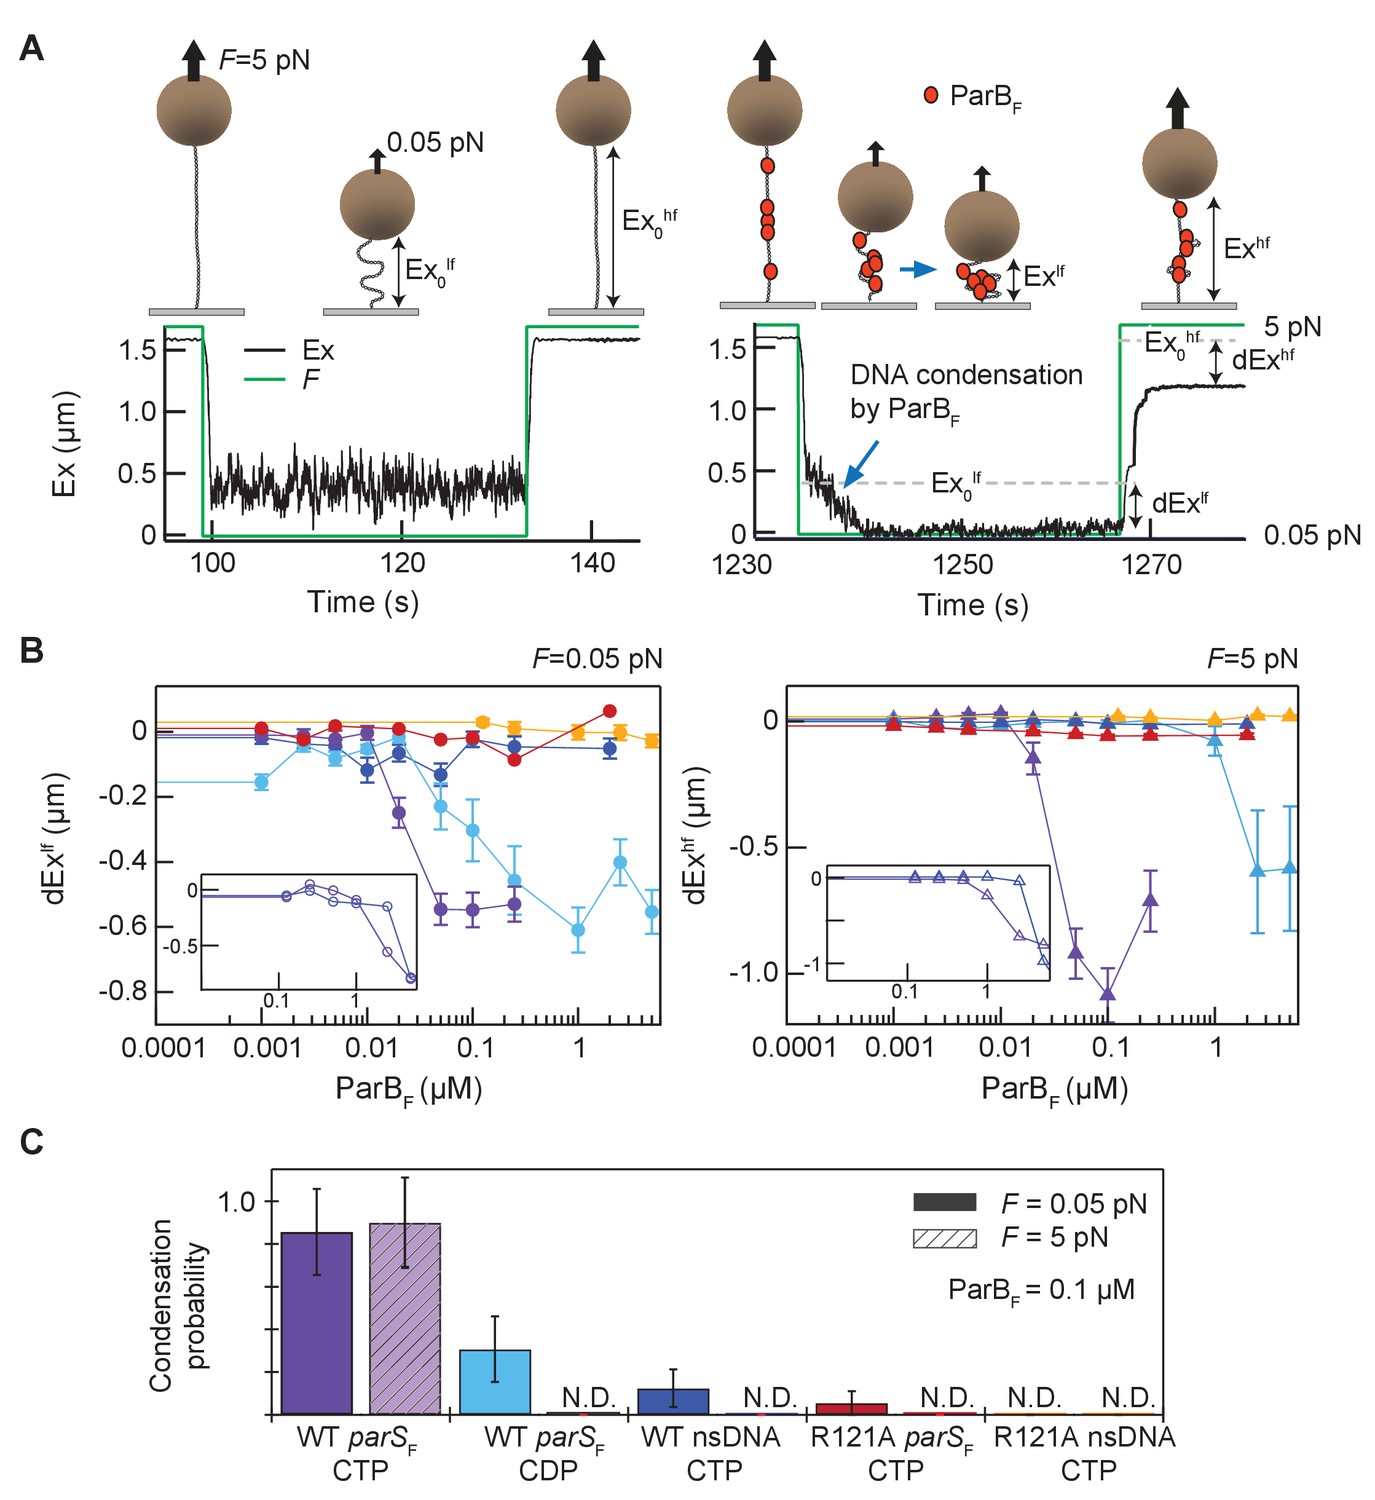
Magnetic tweezers measurements of parSF and CTP-dependent DNA condensation by ParBF.
(A) Schematic showing the magnetic tweezers DNA condensation assay. One end of a 5 kb DNA molecule is attached to the surface of a flow-cell and the free end is attached to a 1 µm magnetic bead (brown sphere). The DNA extension (Ex) was measured by tracking the bead height above the cover glass surface at two different forces; 0.05 pN (low force, lf), and 5 pN (high force, hf). The extent of DNA condensation was estimated from the difference in DNA extension with and without ParBF. (B) Changes in extension at low force (dExlf = Exlf– Ex0lf), left panel, and at high force (dExhf = Exhf− Ex0hf), right panel, for seven different conditions plotted as a function of ParBF concentration. The extension values were the averages of the last 5 s of the extension at low force (circles) and the first 5 s of the extension at high force (triangles). Error bars represent standard error of means (SEM). Different conditions are color coded as follows. Purple: parSF-DNA tether with WT ParBF and CTP; light blue: parSF-DNA tether with WT ParBF and CDP; dark blue: nsDNA tether with WT ParBF and CTP; red: parSF-DNA tether with ParBFR121A and CTP; orange: nsDNA tether with ParBFR121A and CTP. For comparison with condensation in the presence of CTP, dEx data of parSF-DNA tether (purple) and nsDNA tether (blue) with WT ParBF without CTP are displayed (inset, open circles for 0.05 pN, triangle for 5 pN respectively). (C) The condensation probabilities at 0.1 µM ParBF for five different conditions at 0.05 pN and 5 pN. The condensation probability was calculated by dividing the number of DNA tethers that exhibited DNA condensation by the total number of DNA tethers for each measurement condition. Except for parSF-DNA with WT ParBF and CTP, all conditions show either minimal or negligible condensation probabilities. The different conditions are color-coded as indicated in (B), and the diagonal stripes indicates probabilities at 5 pN. Error bars represent standard error of means (SEM).
Figure 6—figure supplement 1

Stepwise de-condensation of condensed DNA tethers in the presence of CDP or CTP by tensile force: condensation observed in the presence of CDP is unstable.
(A) The extension of 6 DNA tethers containing parSF sequences (colored solid lines, left y-axis) were simultaneously measured at a force (green solid line, right y-axis) of 0.05 pN after the introduction of ParBF (0.1 µM) and CTP (1 mM). The tethers remained condensed for at least 85 s after the force was increased to 5 pN. Most increases in extension took place in discrete steps. (B) The same measurement as in (A) except that the DNA was condensed with 10-fold more ParBF (1 µM) with CDP (1 mM). DNA condensation in the presence of CDP was quickly reversed under high force (5 pN). After the force was increased to 5 pN (time 0), the extension of all five DNA tethers increased to their full decondensed length (dashed line) within ~5 s.
Figure 6—figure supplement 2
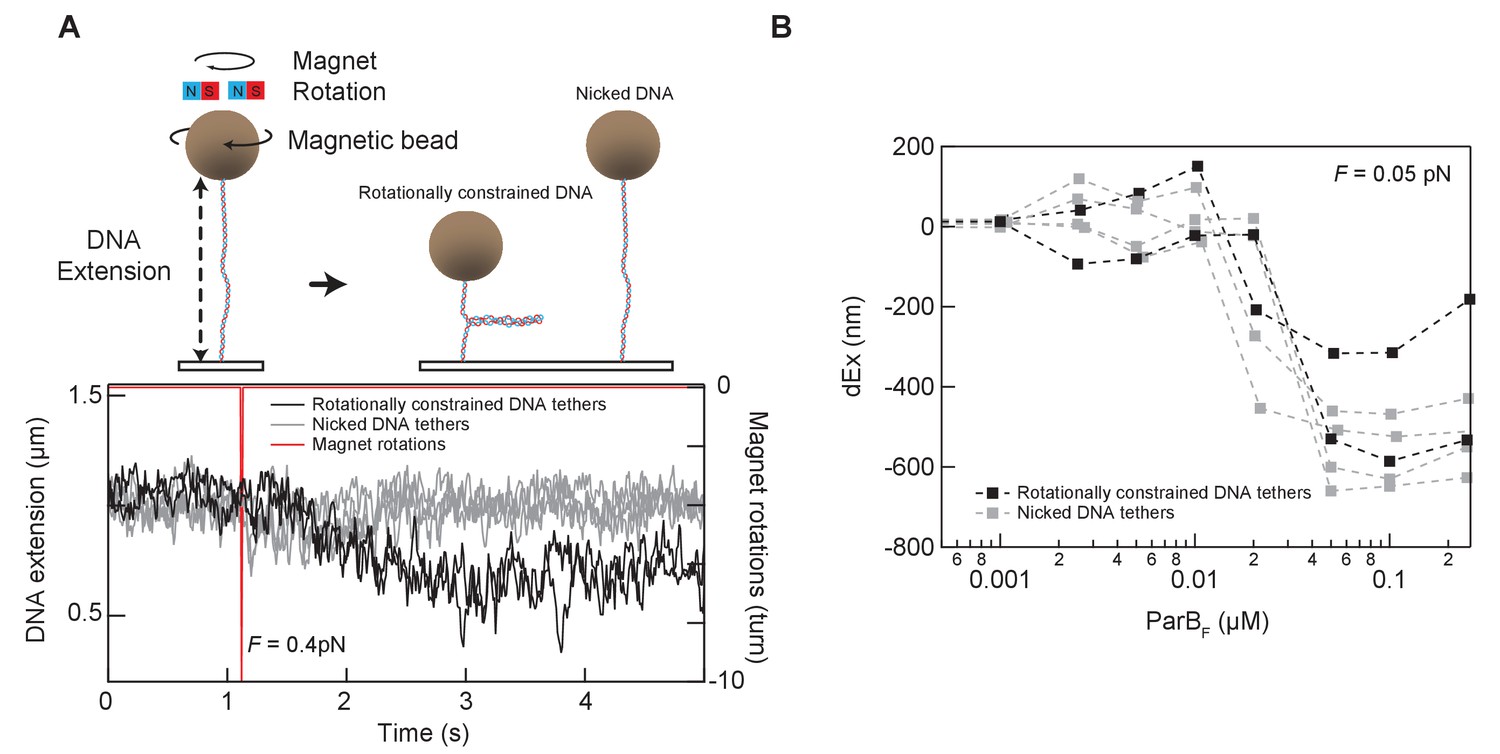
Tether condensation by ParBF is comparable for topologically constrained (supercoilable) and unconstrained (nicked) DNA.
(A) The DNA tethers used for the condensation experiments were a mixture of torsionally constrained and unconstrained. Prior to condensation measurements, the magnetic beads attached to the end of the DNA molecules were rotated by rotating the external magnets in the magnetic tweezer instrument. Rotationally constrained DNA molecules are supercoiled by rotating the magnet, resulting in the formation of a plectoneme and a decrease in the extension of the DNA molecule. Torsionally unconstrained (typically nicked) DNA molecules are insensitive to the bead rotation and remain at the same extension (top). An example of this in situ discrimination between torsionally constrained and unconstrained DNA tethers is shown in the graph displaying the extension of six DNA molecules (bottom). The DNA extension decreased for two of the six DNA molecules after imposing −10 turns, indicating that these two molecules are rotationally constrained (left panel bottom). (B) Condensation, as measured by the change in extension reduction as a function of ParBF concentration, is comparable for the topologically constrained (black squares) and unconstrained (gray squares) DNA molecules.
Figure 6—figure supplement 3
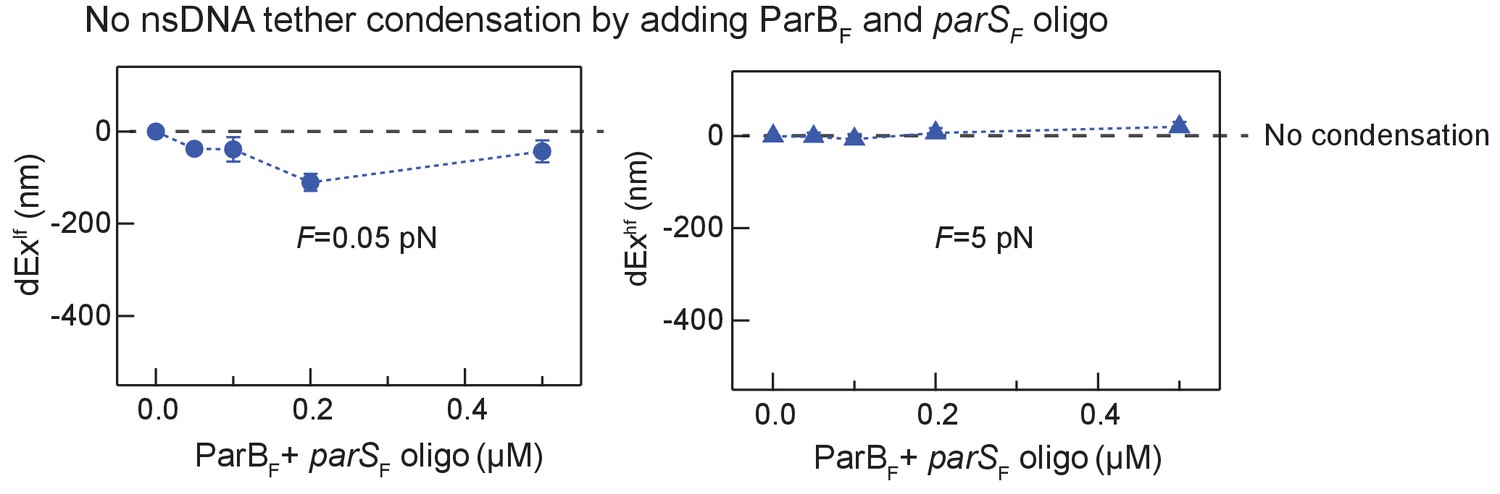
DNA tethers without parSF sequence are not condensed by ParBF and parSF in trans in the presence of CTP.
DNA tethers that did not contain a parSF site were not significantly condensed by the addition of parSF DNA fragment in trans with ParBF in the presence of CTP. The decreases in extension at 0.05 pN (blue circle, left panel) and 5 pN (blue triangle, right panel) are plotted as a function of the concentration of ParB and parSF, which were added together at stoichiometric concentrations.
Figure 7
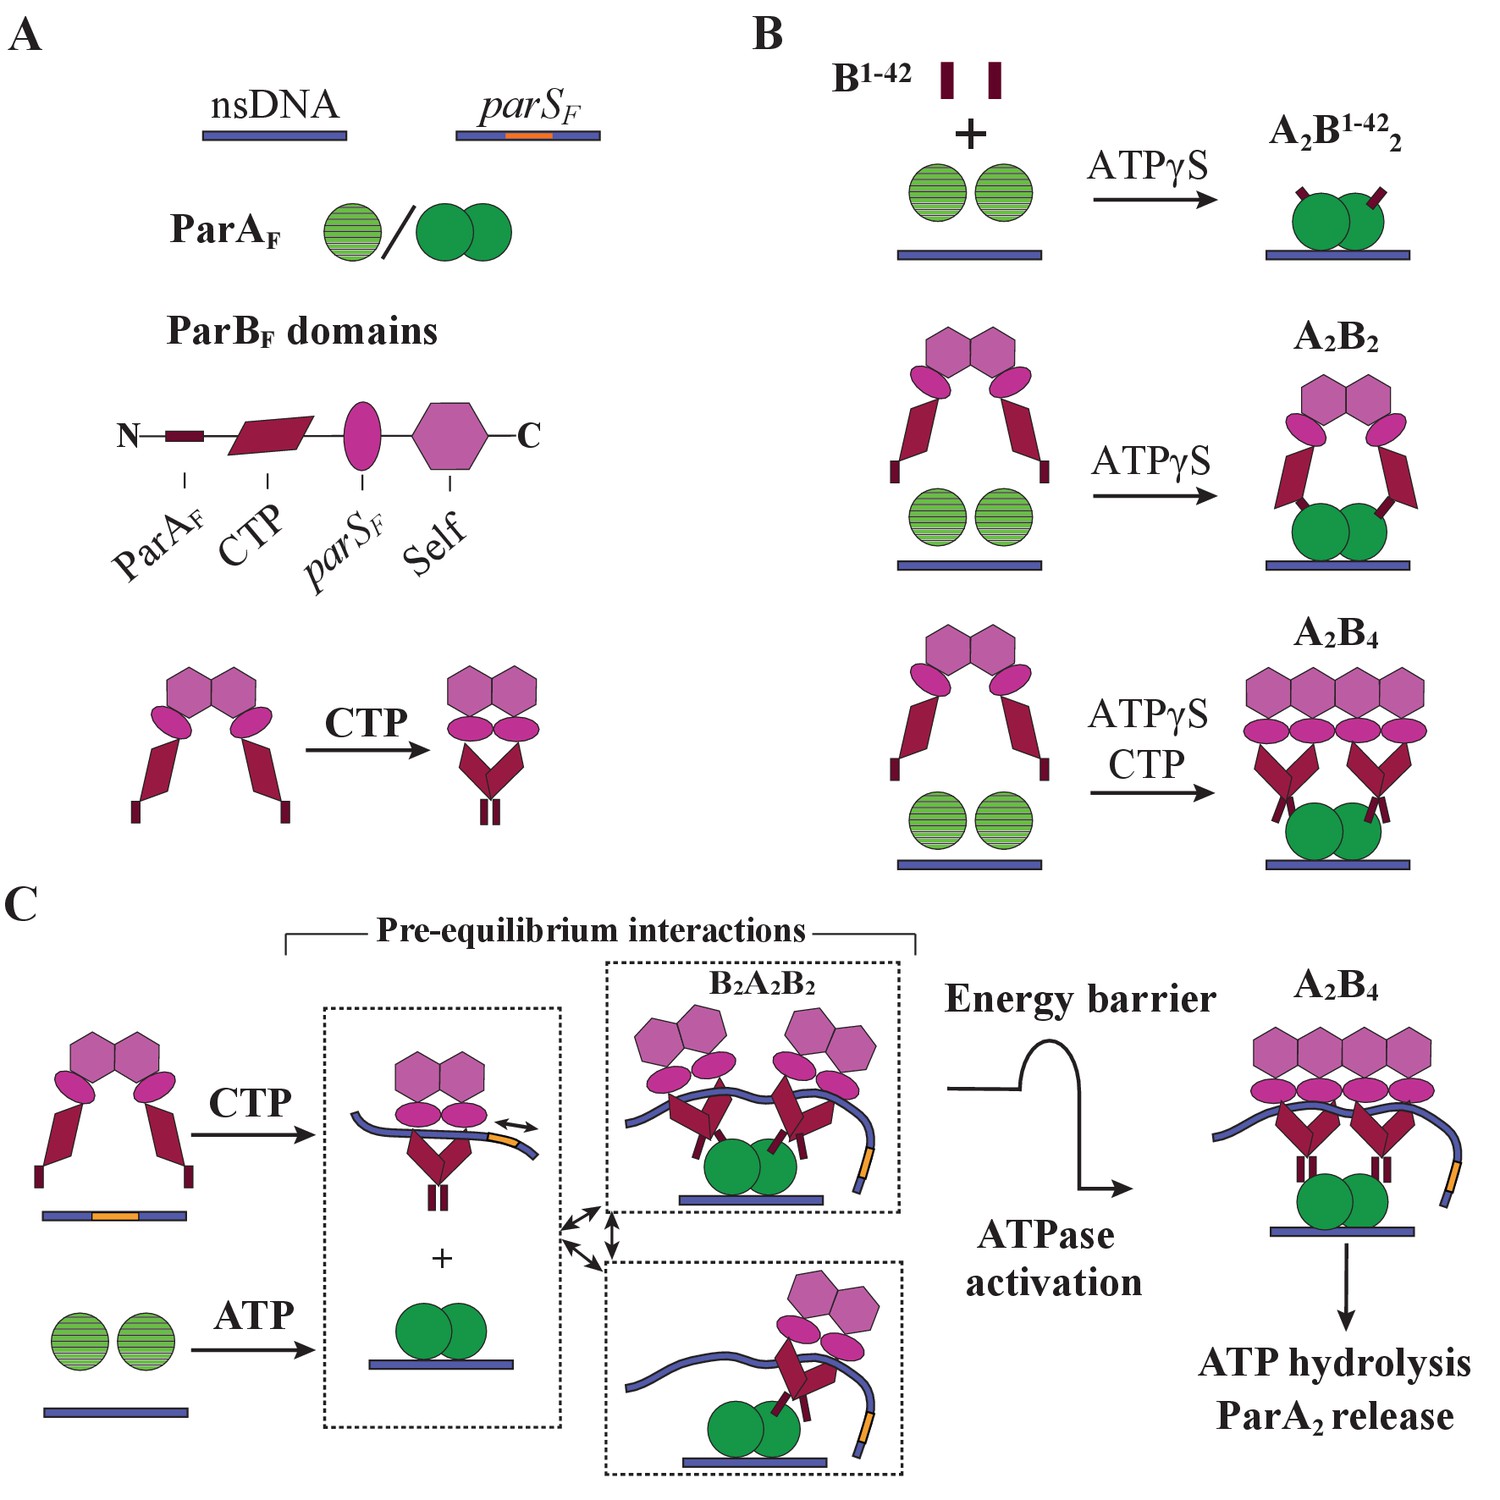
Cartoon of the proposed pre-ATPase-activation complexes of ParAF and ParBF.
(A) Pictograms of nsDNA, parSF-DNA, ParAF monomer/dimer and ParBF domains with binding ligand designations. The CTPase domains of a ParBF dimer fold forming a single globular domain on binding CTP, bringing the two ParAF-binding domains into close proximity. (B) ParAF-binding domain, ParBF1-42 alone can convert ParAF monomers to DNA-binding-competent dimers in the presence of ATPγS by forming an A2B1-422 complex (top). ParBF dimers in the absence of CTP convert ParAF monomers to DNA-binding-competent dimers in the presence of ATPγS by straddling a ParAF dimer to form an A2B2 complex (middle). In the presence of CTP, the close proximity of the ParAF-binding domains of the ParBF dimer prevents A2B2 complex formation and instead an A2B4 complex assembles on nsDNA in the presence of ATPγS (bottom). (C) In the presence of parSF and CTP, ParBF dimers load on to the parSF-DNA and spread to adjacent DNA regions while adopting a state that enables faster assembly of A2B4 complexes. Considering the requirements for efficient partition complex motion by diffusion-ratchet mechanism based on the chemophoretic principle of force generation, we propose a significant energy barrier that slows the formation of the ATP hydrolysis-competent A2B4 complex. This energy barrier partially decouples ParAF–ParBF association–dissociation dynamics from ATP hydrolysis, which triggers ParAF dissociation from the nucleoid.
Tables
Table 1
Apparent disassembly or exchange rate constants (min−1) and ParBF/ParAF ratio from fits of TIRFM wash and FRAP experiments.
The apparent dissociation (or FRAP) rate constants (koff) were obtained for individual time-trajectories by single-exponential curve fitting (except ** where the rate of the faster decay, (68 ± 0.5%) of a double-exponential fit is shown), and the mean and SEM for the set of independent experiments are shown (except * where standard deviation among non-independent repeats within an experiment is shown). (N is the number of separate experiments, with total number of binding/wash cycles for repeated data collection in parenthesis.) ParA:ParB ratios were calculated from the final phase of the individual association time-trajectories (except *** where it was based on the beginning part of the washing phase in the presence of ParBF1-42 R36A), and the mean and SEM for the set of independent experiments are shown in italics. N.D., not done.
| ParAF | ParAF + ParBF1-42 | ParAF + ParBF1-42 R36A | FRAP | ParAF + ParBF | ParAF + ParBF + CDP | ParAF + ParBF + CTP | ParAF + ParBFR121A | |||||||||
|---|---|---|---|---|---|---|---|---|---|---|---|---|---|---|---|---|
| Protein Measured | ParAF | ParAF | ParBF1-42 | ParAF | ParBF1-42 R36A | ParAF | ParBF1-42 | ParAF | ParBF | ParAF | ParBF | ParAF | ParBF | ParAF | ParBFR121A | |
| - parSF | koff | 6.4± 0.6 N=4 (12) | 5.2± 0.2 N=2 (9) | 6.3± 0.3 N=2 (9) | 29± 2 N=3 (9) | 52± 4 N=3 (9) | 2.0± 0.08 N=3 (11) | 15.3± 2.1** N=3 (12) | 0.93± 0.07 N=2 (6) | 0.89± 0.09 N=2 (6) | N.D. | N.D. | 0.63± 0.04 N=2 (7) | 0.65± 0.10 N=2(7) | 0.89± 0.01 N=3 (8) | 0.78± 0.05 N=3 (8) |
| A:B | 1 : 1.27 ± 0.06 N=2 (8) | 1 : 0.92 ± 0.02*** N=3 (9) | 1 : 1.10 ± 0.13 N=3 (9) | 1 : 2.16 ± 0.15 N=3 (10) | 1 : 0.99 ± 0.01 N=3 (8) | |||||||||||
| + parSF | koff | N.D. | N.D. | N.D. | N.D. | 0.95± 0.04 N=2 (6) | 0.82± 0.01 N=2 (6) | 0.46± 0.02 N=2 (7) | 0.53± 0.01 N=2 (7) | 0.60± 0.08 N=2 (5) | 0.83± 0.12 N=2 (6) | 0.91± 0.01 N=3 (8) | 0.78± 0.04 N=3 (8) | |||
| A:B | 1 : 2.17 ± 0.40 N=3 (9) | 1 : 2.53 ± 0.07 N=2 (6) | 1 : 2.16 ± 0.27 N=2(6) | 1 : 1.12 ± 0.01 N=3 (12) | ||||||||||||
| ParBF or ParBF1-42 R36Ain wash | koff | N.D. | 0.84± 0.01* N=1 (3) | 0.89± 0.02* N=1 (3) | 1.8± 0.4 N=3 (9) | 1.8± 0.4 N=3 (9) | N.D. | N.D. | N.D. | N.D. | N.D. | |||||
Table 2
ATPase fit parameters.
ATPase measurements were performed with ParAF (1 μM) and different mutants of ParBF, 60 μg/ml EcoRI-digested pBR322 DNA plus Scram- or parSF-DNA fragment and CTP or CDP, as indicated in the column headings. Assays were repeated ‘N’ times, each data set of an assay was fit after subtraction of background measured without ParAF to a modified Hill equation: v − v0 = (vmax [B]n) / (KAn + [B]n), and the mean and standard error of the mean (SEM) of the fit parameters for the N measurements are shown. For [B] on the x-axis, total ParBF concentration was used instead of free ParBF concentration due to technical issues in estimating the free ParBF concentration and the meanings of KA and the cooperativity factor (n) here differ from those in the standard adaptation of the Hill equation. vmax is the maximum stimulated ParAF ATPase turnover rate, KA is the apparent total concentration of ParBF necessary for half maximum stimulation, and n is the apparent cooperativity coefficient.
| ParBF | ParBF CTP | ParBF CDP | ParBFR121A | ParBF1-42 | ParBF1-42 R36A | ParBF1-42-mCherry-EcoRIE111Q | |||||
|---|---|---|---|---|---|---|---|---|---|---|---|
| DNA cofactor Number of exp. | Scram N = 6 | parSF N = 6 | Scram N = 3 | parSF N = 3 | parSF N = 3 | Scram N = 3 | parSF N = 3 | N = 6 | N = 3 | Scram N = 3 | EcoRI DNA N = 2 |
| vmax (hr−1) | 54 ± 5 | 79 ± 2 | 79 ± 8 | 78 ± 8 | 87 ± 5 | 60 ± 5 | 62 ± 5 | 83 ± 3 | 38 ± 2 | 131 ± 13 | 125 ± 9 |
| KA (µM) | 0.53 ± 0.09 | 0.59 ± 0.03 | 0.41 ± 0.05 | 0.24 ± 0.02 | 0.34 ± 0.04 | 0.86 ± 0.1 | 1.1 ± 0.1 | 1.2 ± 0.1 | 108 ± 13 | 0.16 ± 0.04 | 0.16 ± 0.03 |
| Cooperativity coefficient (n) | 1.2 ± 0.2 | 1.4 ± 0.1 | 3.3 ± 1.0 | 3.6 ± 0.2 | 1.1 ± 0.1 | 2.5 ± 0.6 | 1.6 ± 0.3 | 2.5 ± 0.3 | 1.5 ± 0.2 | 1.4 ± 0.3 | 1.4 ± 0.2 |
Key resources table
| Reagent type (species) or resource | Designation | Source or reference | Identifiers | Additional information |
|---|---|---|---|---|
| Strain, strain background (Escherichia coli) | BL21 DE3 AI | Invitrogen | C607003 | Protein expression strain |
| Recombinant DNA reagent | pET11a | EMD Millipore | 9436 | Protein expression vector |
| Recombinant DNA reagent | pET28a-parSF | This work | Tether DNA PCR template | |
| Recombinant DNA reagent | pET28a | EMD Millipore | 69865 | Tether DNA PCR template |
| Recombinant DNA reagent | pBlueScript II KS(+) | Agilent | 212207 | Tether DNA PCR template |
| Recombinant DNA reagent | pX7 | Vecchiarelli et al., 2013 | ParAFoverexpression plasmid | |
| Recombinant DNA reagent | pX2 | Vecchiarelli et al., 2013 | ParAF-eGFP overexpression plasmid | |
| Recombinant DNA reagent | pX8 | Vecchiarelli et al., 2013 | ParBFoverexpression plasmid | |
| Recombinant DNA reagent | pET11a-ParBFR121A | This work | ParBFR121overexpression plasmid | |
| Recombinant DNA reagent | pET11a-ParBF1-42-mCherry | This work | ParBF1-42-mCherry overexpression plasmid | |
| Recombinant DNA reagent | pET11a-ParBF1-42 R36A-mCherry | This work | ParBF1-42 R36A-mCherry overexpression plasmid | |
| Recombinant DNA reagent | pET11a-ParBF1-42-mCherry-EcoRIE111Q | This work | ParBF1-42-mCherry-EcoRIE111Qoverexpression plasmid | |
| Sequence-based reagent | parSF DNA | This work | 5'-AGTCTGGGACCACGGTCCCACTCG | |
| Sequence-based reagent | parSF DNA Alexa 488 | This work | 5'-Alexa488-(HNS)-AGTCTGGGACCACGGTCCCACTCG | |
| Sequence-based reagent | parSF DNA complement strand | This work | 5'-CGAGTGGGACCGTGGTCCCAGACT | |
| Sequence-based reagent | Scrambled seq DNA | This work | 5'-AGTCTGCAGCTACTATACCACTCG | |
| Sequence-based reagent | Scrambled seq DNA complement strand | This work | 5'-CGAGTGGTATAGTAGCTGCAGACT | |
| Sequence-based reagent | EcoR1 sequence + strand | This work | 5'-GAATTCCGAGTGGGACCGTGGTCCCAGTCTGATTATCAGACCGAGAATTCAAGTTGGGACCGTGGTCCCAAGAGAAT | |
| Sequence-based reagent | EcoR1 sequence - strand | This work | 5’-ATTCTCTTGGGACCACGGTCCCAACTTGAATTCTCGGTCTGATAATCAGACTGGGACCACGGTCCCACTCGGAATTC | |
| Sequence-based reagent | 5 kb DNA primer1 | Seol and Neuman, 2011 | 5'- GCTGGGTCTCGGTTGTTCCCTTTAGTGAGGGTTAATTG | |
| Sequence-based reagent | 5 kb DNA primer2 | Seol and Neuman, 2011 | 5'- GCTGGGTCTCGTGGTTTCCCTTTAGTGAGGGTTAATTG | |
| Sequence-based reagent | DNA handle primer1 | Seol and Neuman, 2011 | 5'- GGACCTGCTTTCGTTGTGGCGTAATCATGGTCATAG | |
| Sequence-based reagent | DNA handle primer2 | Seol and Neuman, 2011 | 5'- GGGTCTCGTGGTTTATAGTCCTGTCGGGTTTC | |
| Peptide, recombinant protein | ParBF1-42 | This work | MKRAPVIPKHTLNTQPVEDTSLSTPAAPMVDSLIARVGVMAR | |
| Peptide, recombinant protein | ParBF1-42 R36A | This work | MKRAPVIPKHTLNTQPVEDTSLSTPAAPMVDSLIAAVGVMAR | |
| Chemical compound, drug | ATP | Millipore-Sigma | A2383 | |
| Chemical compound, drug | GTP | Millipore-Sigma | G8877 | |
| Chemical compound, drug | UTP | Thermo Scientific | J23160 | |
| Chemical compound, drug | CTP | Millipore-Sigma | C1506 | |
| Chemical compound, drug | CDP | Millipore-Sigma | C9755 | 2–3% possible contamination of ParBF-CTPase substrate detected |
| Chemical compound, drug | γ32P-ATP | Perkin-Elmer | NEG002A250UC | |
| Chemical compound, drug | Dynabeads MyOne Streptavidin T1 | Invitrogen | 65601 | |
| Chemical compound, drug | Alexa Fluor 488 C5 Maleimide | Thermo Fisher | A10254 | |
| Chemical compound, drug | Alexa Fluor 594 C5 Maleimide | Thermo Fisher | A10256 | |
| Chemical compound, drug | Alexa Fluor 647 C2 Maleimide | Thermo Fisher | A20347 | |
| Chemical compound, drug | Antifoam Y-40 emulsion | Sigma | A5758 | |
| Chemical compound, drug | EDTA-free Sigmafast protease inhibitor cocktail tablet | Sigma | S8830 | |
| Chemical compound, drug | DOPC | Avanti polar lipids | 850375C | |
| Chemical compound, drug | DOPE-Biotin | Avanti polar lipids | 850149P | |
| Chemical compound, drug | Biotin-14-dCTP | Thermo Fisher | 19518018 | |
| Chemical compound, drug | Biotin-16-dUTP | Roche | 11093070910 | |
| Chemical compound, drug | Digoxigenin-11-dUTP | Roche | 11093088910 | |
| Commercial assay or kit | EnzChek Phosphate assay kit | Thermo Fisher | E6646 | |
| Software, algorithm | Prism 8 | GraphPad | Prism 8 | Used for curve fitting, and fitting parameters and their error estimation. |
| Software, algorithm | Igro Pro 7 | Wavemetrics | Igro Pro | Used for single molecule data analysis. |
| Software, algorithm | LabVIEW | National Instruments | LabView NXG Full | Used for instrumental control in single molecule experiments. |
| Software, algorithm | Metamorph 7 | Molecular Devices | Metamorph 7 | Used for TIRF michroscope data acquisition. |
| Software, algorithm | ImageJ/Fiji | National Institutes of Health | ImageJ | Used for TIRF michroscope image analysis. |
| Other (Instrument) | Prism type TIRF microscope | In house Ivanov and Mizuuchi, 2010; Vecchiarelli et al., 2013 | Used for ParAF-ParBF complex assembly-disassembly experiments. | |
| Other (Instrument) | Magnetic tweezers | In house Seol and Neuman, 2011 and Seol et al., 2016 | Used for taking single molecule measurements of enzyme binding on 5 kb DNA. | |
| Other (Instrument) | Plate reader | BMG Labtech | Clariostar Plus | Used for FRET-based ParBF dimerization KD and CTP hydrolysis assays using EnzChek Phosphate assay kit |
Additional files
-
Source data 1
Excel file containing all source data.
One Excel file with 19 sheets: Numerical data for Figure 2A-E, Figure 2F,G, Figure 2—figure supplement 2, Figure 2—figure supplement 4, Figure 3A-C, Figure 3D, Figure 4A-D, Figure 4E, Figure 4—figure supplement 1B, Figure 4—figure supplement 2A-D, Figure 5A-D, Figure 5E,F, Figure 5—figure supplement 1B, Figure 5—figure supplement 2, Figure 6A, Figure 6B - left, Figure 6B - right, Figure 6C, Figure 6—figure supplement 1A, Figure 6—figure supplement 1B, Figure 6—figure supplement 2, Figure 6—figure supplement 3.
- https://cdn.elifesciences.org/articles/65651/elife-65651-data1-v2.xlsx
-
Transparent reporting form
- https://cdn.elifesciences.org/articles/65651/elife-65651-transrepform-v2.docx
Download links
A two-part list of links to download the article, or parts of the article, in various formats.
Downloads (link to download the article as PDF)
Open citations (links to open the citations from this article in various online reference manager services)
Cite this article (links to download the citations from this article in formats compatible with various reference manager tools)
CTP and parS coordinate ParB partition complex dynamics and ParA-ATPase activation for ParABS-mediated DNA partitioning
eLife 10:e65651.
https://doi.org/10.7554/eLife.65651


