CTP and parS coordinate ParB partition complex dynamics and ParA-ATPase activation for ParABS-mediated DNA partitioning
- Laboratory of Molecular Biology, National Institute of Diabetes and Digestive and Kidney Diseases, National Institutes of Health, United States
- Biochemistry and Biophysics Center, National Heart, Lung, and Blood Institute, National Institutes of Health, United States
Abstract
ParABS partition systems, comprising the centromere-like DNA sequence parS, the parS-binding ParB-CTPase, and the nucleoid-binding ParA-ATPase, ensure faithful segregation of bacterial chromosomes and low-copy-number plasmids. F-plasmid partition complexes containing ParBF and parSF move by generating and following a local concentration gradient of nucleoid-bound ParAF. However, the process through which ParBF activates ParAF-ATPase has not been defined. We studied CTP- and parSF-modulated ParAF–ParBF complex assembly, in which DNA-bound ParAF-ATP dimers are activated for ATP hydrolysis by interacting with two ParBF N-terminal domains. CTP or parSF enhances the ATPase rate without significantly accelerating ParAF–ParBF complex assembly. Together, parSF and CTP accelerate ParAF–ParBF assembly without further significant increase in ATPase rate. Magnetic-tweezers experiments showed that CTP promotes multiple ParBF loading onto parSF-containing DNA, generating condensed partition complex-like assemblies. We propose that ParBF in the partition complex adopts a conformation that enhances ParBF–ParBF and ParAF–ParBF interactions promoting efficient partitioning.
Introduction
Faithful segregation of replicated chromosomes is essential for efficient proliferation of cells. Accordingly, many bacteria are equipped with active chromosome and plasmid partition systems belonging to the ParABS family (Baxter and Funnell, 2014; Lutkenhaus, 2012; Vecchiarelli et al., 2012). Basic ParABS systems comprise two proteins, ParA and ParB, and a centromere-like, cis-acting DNA element called parS. The ParA proteins of this family are ATPases with a characteristic deviant Walker-A motif (Motallebi-Veshareh et al., 1990) and bind non-specific DNA (nsDNA) in an ATP-dependent manner by forming a DNA binding-competent dimer (Davey and Funnell, 1994; Leonard et al., 2005; Vecchiarelli et al., 2010). Accordingly, ParA proteins localize to the bacterial chromosome (the nucleoid) in vivo (Ebersbach and Gerdes, 2004; Hatano et al., 2007; Lim et al., 2014).
ParB is typically a dimeric sequence-specific DNA binding protein that binds tightly to the parS consensus sequences that mark the DNA cargo to be partitioned (Bouet et al., 2000; Mori et al., 1989; Pillet et al., 2011; Taylor et al., 2015). Most ParABS systems have multiple copies of a ParB dimer binding consensus sequence that collectively constitute a parS site. F-plasmid has a parS sequence cluster (parSF, also called sopC) composed of 12 repeats of a 16 bp consensus sequence, each separated by 27 base-pair spacer sequences (Helsberg and Eichenlaub, 1986). The ParBs of known chromosomal and plasmid Par systems such as P1 and F bind to parS via a helix-turn-helix motif (Schumacher and Funnell, 2005; Schumacher et al., 2010). These HTH–ParB proteins also associate with several kilobases of DNA surrounding a parS site in vivo in a proximity-dependent manner without obvious sequence specificity (Breier and Grossman, 2007; Murray et al., 2006; Rodionov et al., 1999; Sanchez et al., 2015). This activity, known as ParB spreading, is believed to be essential for proper function of these systems (Breier and Grossman, 2007; Graham et al., 2014) and results in the formation of a large nucleo-protein complex (the partition complex) around the parS site on the DNA to be partitioned. Mutations in the B. subtilis parB gene blocking spreading and causing partition deficiency have been identified within the Box II region (GXRR) of the N-terminal domain (Breier and Grossman, 2007; Graham et al., 2014), a highly conserved motif among HTH–ParB homologues (Yamaichi and Niki, 2000). Recently, several groups reported that HTH–ParB proteins have CTPase activity and the Box II residues play key roles in CTP binding and hydrolysis, suggesting that ParB spreading is driven by an active process dependent on energy derived from CTP hydrolysis (Jalal et al., 2020; Osorio-Valeriano et al., 2019; Soh et al., 2019).
ParB interacts with ParA via its N-terminal region (Ravin et al., 2003) and activates nsDNA-bound ParA dimer’s ATPase, releasing it from DNA (Ah-Seng et al., 2009; Davis et al., 1992; Scholefield et al., 2011; Watanabe et al., 1992). In the absence of ParB stimulation, the ATP turnover of ParA is low, typically around one ATP per hour (Ah-Seng et al., 2009; Davis et al., 1992; Fung et al., 2001; Scholefield et al., 2011). Because of this slow basal ATPase rate, and since the majority of cellular ParB molecules is concentrated at the partition complexes due to ParB spreading, ATP hydrolysis by ParA and dissociation from the nucleoid is expected to occur principally in the vicinity of partition complexes. Biochemical studies of P1 ParA ATPase showed a significant time delay before activation of ParA for DNA binding after ATP binding, predicting a significant free bulk-diffusion period for ParA before reactivation for nsDNA binding (Vecchiarelli et al., 2010). This, along with in vivo imaging observations (Hatano et al., 2007; Ringgaard et al., 2009), led to a prediction that the nucleoid proximal to a partition complex would become depleted of ParA (the ParA depletion zone) and the proposal of a diffusion-ratchet model for plasmid segregation by the ParABS system (Vecchiarelli et al., 2010).
The diffusion-ratchet model is based on the premise that the nucleoid-bound ParA-ATPase activation by plasmid-bound ParB generates a local ParA depletion zone on the nucleoid, forming a nucleoid-bound ParA concentration gradient around the partition complex (Hu et al., 2017; Vecchiarelli et al., 2010). The interaction of plasmid-bound ParB with the ParA gradient on the nucleoid results in a cargo position-dependent free-energy difference (Sugawara and Kaneko, 2011). Binding of ParB to ParA reduces the system free-energy, therefore moving the cargo to a higher ParA concentration lowers the system free-energy. This cargo position-dependent free-energy difference translates to a directional motive force on the ParB bound cargo. The generation of sufficient cargo motive force to overcome thermal diffusion was demonstrated in cell-free reconstitution experiments showing that a bead coated with parSF-containing DNA is driven across an nsDNA-coated flow cell surface in the presence of ParAF, ParBF, and ATP (Vecchiarelli et al., 2014). In some in vivo time-lapse imaging experiments, ParA has been observed to undergo pole-to-pole oscillations along the length of a nucleoid with a partition complex chasing the receding edge of a ParA distribution zone on the nucleoid, further supporting the diffusion-ratchet model (Hatano et al., 2007; Ringgaard et al., 2009). Variations of this model have also been proposed (Le Gall et al., 2016; Lim et al., 2014; McLeod et al., 2017).
Generating persistent directional motion by the diffusion-ratchet model requires a balance between the ParA–ParB association/dissociation dynamics prior to ATP hydrolysis and the steps and kinetic parameters that govern ATP hydrolysis. For example, if every ParA–ParB association resulted in instantaneous ATP hydrolysis and dissolution of the ParA–ParB bonds linking the partition complex (cargo) and the nucleoid, no cargo driving force would result. Conversely, if each bond persisted too long, the cargo would remain immobile on the nucleoid (Hu et al., 2017). However, the detailed biochemical reaction steps leading to ParB activation of DNA-bound ParA-ATPase and the subsequent release of ParA have not been determined.
In order to advance our quantitative understanding of the ParABS system mechanism, we investigated the assembly and disassembly kinetics of ParAF–ParBF complexes that form prior to ATP hydrolysis using F-plasmid ParAFBFSF (also called SopA/B/C) as a model system. Employing a TIRF microscopy-based nsDNA-carpet assay (Vecchiarelli et al., 2013), we first examined the stoichiometry of the nsDNA-bound ParAF–ParBF complexes that accumulate in the absence of ATP hydrolysis. We investigated impacts of different ParBF-cofactors (parSF and CTP) or ParBF mutations that hinder ParBF dimerization, parSF-binding, CTPase activity, or ParAF ATPase activation. We then studied how the same set of cofactors or ParBF mutations influenced ParAF-ATPase activation by ParBF. Our results showed that ParBF formed complexes with nsDNA-bound ParAF in which both ParBF-interacting faces of the ParAF dimers were occupied by the N-terminal ParAF-activation domain of ParBF. All such complexes observed in the presence of ATPγS exhibited similar, slow dissociation kinetics from nsDNA compared to ParAF dimers in the absence of ParBF so long as both ParBF-interacting faces of the ParAF dimers were occupied by ParBF N-terminal domains. Binding of ParBF N-terminal domains at both ParBF interaction faces is also necessary for efficient ATPase activation of nsDNA-bound ParAF dimers. Strikingly, the ParBF cofactors, CTP and parSF, acted synergistically to accelerate the assembly of pre-ATP hydrolysis ParBF–ParAF complexes on nsDNA. In addition, a magnetic tweezers-based DNA condensation assay revealed that stable DNA condensation by ParBF required both CTP and parSF. These observations suggested that CTP and parSF promote both ParAF–ParBF and ParBF–ParBF interactions. The compaction of parSF-containing DNA by ParBF in the presence of CTP recapitulated the salient features of the condensed ParB spreading partition complex observed in vivo, suggesting that ParBF in the presence of parSF and CTP closely reflects the functional state of ParBF in the partition complexes in vivo. Interestingly, ParBF in these conditions accelerated ATP turnover by the nsDNA-bound ParAF no more than twofold compared to ParBF without parSF and CTP, to a modest ~80 h−1. These findings have important implications for the diffusion-ratchet model of F-plasmid partition by the ParABS system.
Results
Here, we investigated the ParA–ParB interactions that lead to accelerated ATP hydrolysis by ParA and how they are impacted by parSF and CTP. First, we addressed the nature of nsDNA-bound ParAF–ParBF complexes. In the presence of ATP, ParAF forms DNA binding-competent dimers and binds the nsDNA-carpet without ParBF. Upon forming a complex with ParBF, ParAF becomes activated for ATP hydrolysis and the complex rapidly disassembles (Vecchiarelli et al., 2013), impeding characterization of the complex. Therefore, we studied DNA-bound ParAF–ParBF complexes that accumulate prior to ATP hydrolysis by using non-hydrolysable ATPγS. ParAF is not expected to form DNA binding competent dimers efficiently in the presence of ATPγS based on the study of the closely related ParAP1 ATPase (Vecchiarelli et al., 2010). However, we found ParBF promotes conversion of ParAF to a DNA binding competent state in the presence of ATPγS (see below). Hence, in this study, we infused ParAF-eGFP and ParBF-Alexa647, or other fluorescent-labeled ParBF variants, preincubated at room temperature for 10 min with ATPγS into an nsDNA-carpeted flow cell and quantified the densities of the two DNA-associated proteins by imaging the flow cell surface with TIRF microscopy (Figure 1). ParAF alone at the concentration used here (1 μM, all protein concentrations are expressed as monomer concentrations) does not efficiently bind DNA in the presence of ATPγS as expected, and only low-level steady state density (less than ~200 monomers per μm2) of ParAF-eGFP was detected on the DNA-carpet (Figure 2A,B). The observed DNA dissociation rate constant of ParAF-ATPγS (~6 min−1) is similar to that of ParAF-ATP estimated by FRAP or by washing the flow-cell with nsDNA-containing buffer (~4.5–6 min−1, Vecchiarelli et al., 2013). ParBF-Alexa647 (2 μM) did not bind the DNA-carpet to a significant level in the 300 mM K-glutamate buffer used in this experiment.
Figure 1
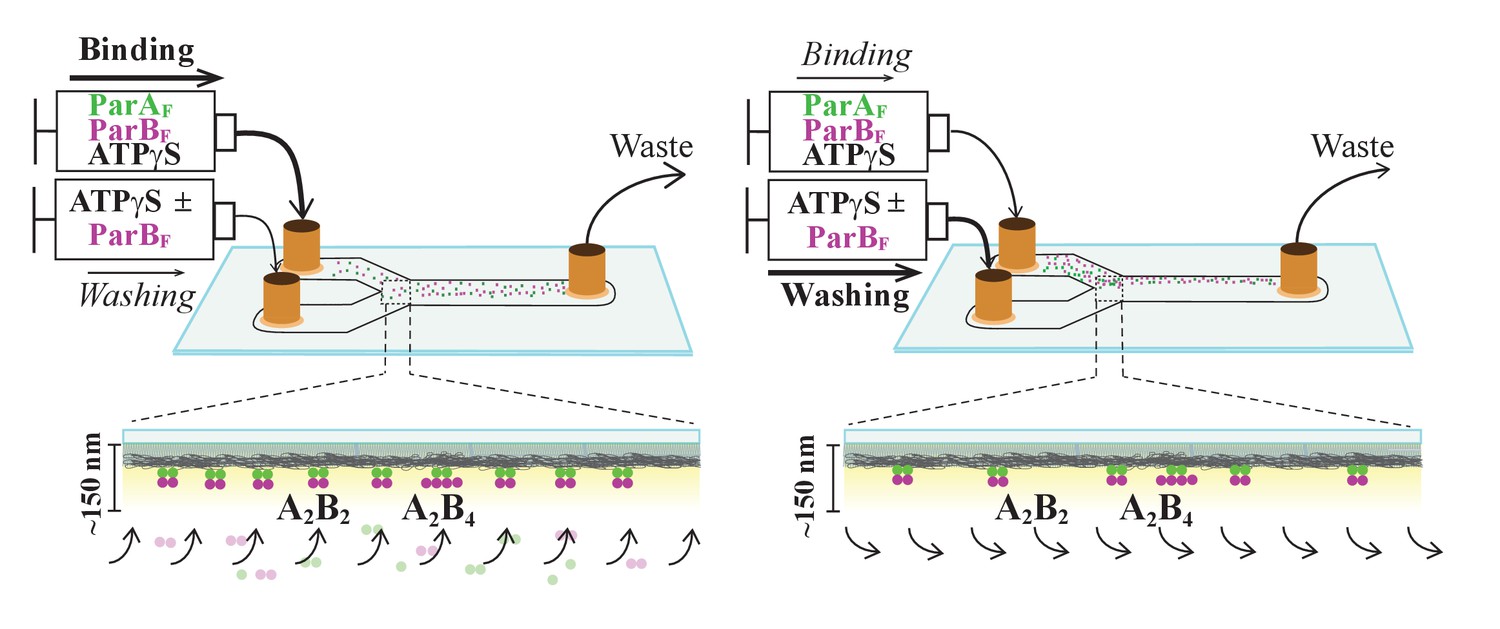
Schematic of flow cell setup for visualizing the binding and dissociation of fluorescent proteins on DNA-carpet.
ParAF-eGFP and ParBF-Alexa647 proteins were flowed over a dense carpet of nsDNA attached to the supported lipid bilayer coated surface of a flow cell. TIRF microscopy permits selective detection of the DNA-carpet bound proteins. Sample solution and wash buffer, as specified for each experiment, were infused via two syringes at different infusion rates from separate inlets into a Y-shaped flow cell. A laminar boundary separates the two solutions downstream of the flow convergence point at the Y-junction. At the midpoint across the flow channel, downstream but close to the flow convergence point where the observations are made, the DNA-carpet area is exposed to the syringe content of the higher infusion rate. When the infusion rates of the two syringes are switched, the laminar boundary moves across the observation area and the solution flowing over the area switches. By switching the infusion rates of the two syringes repeatedly, multiple DNA-carpet-bound protein complex assembly and wash cycles can be recorded.
Figure 2 with 4 supplements see all
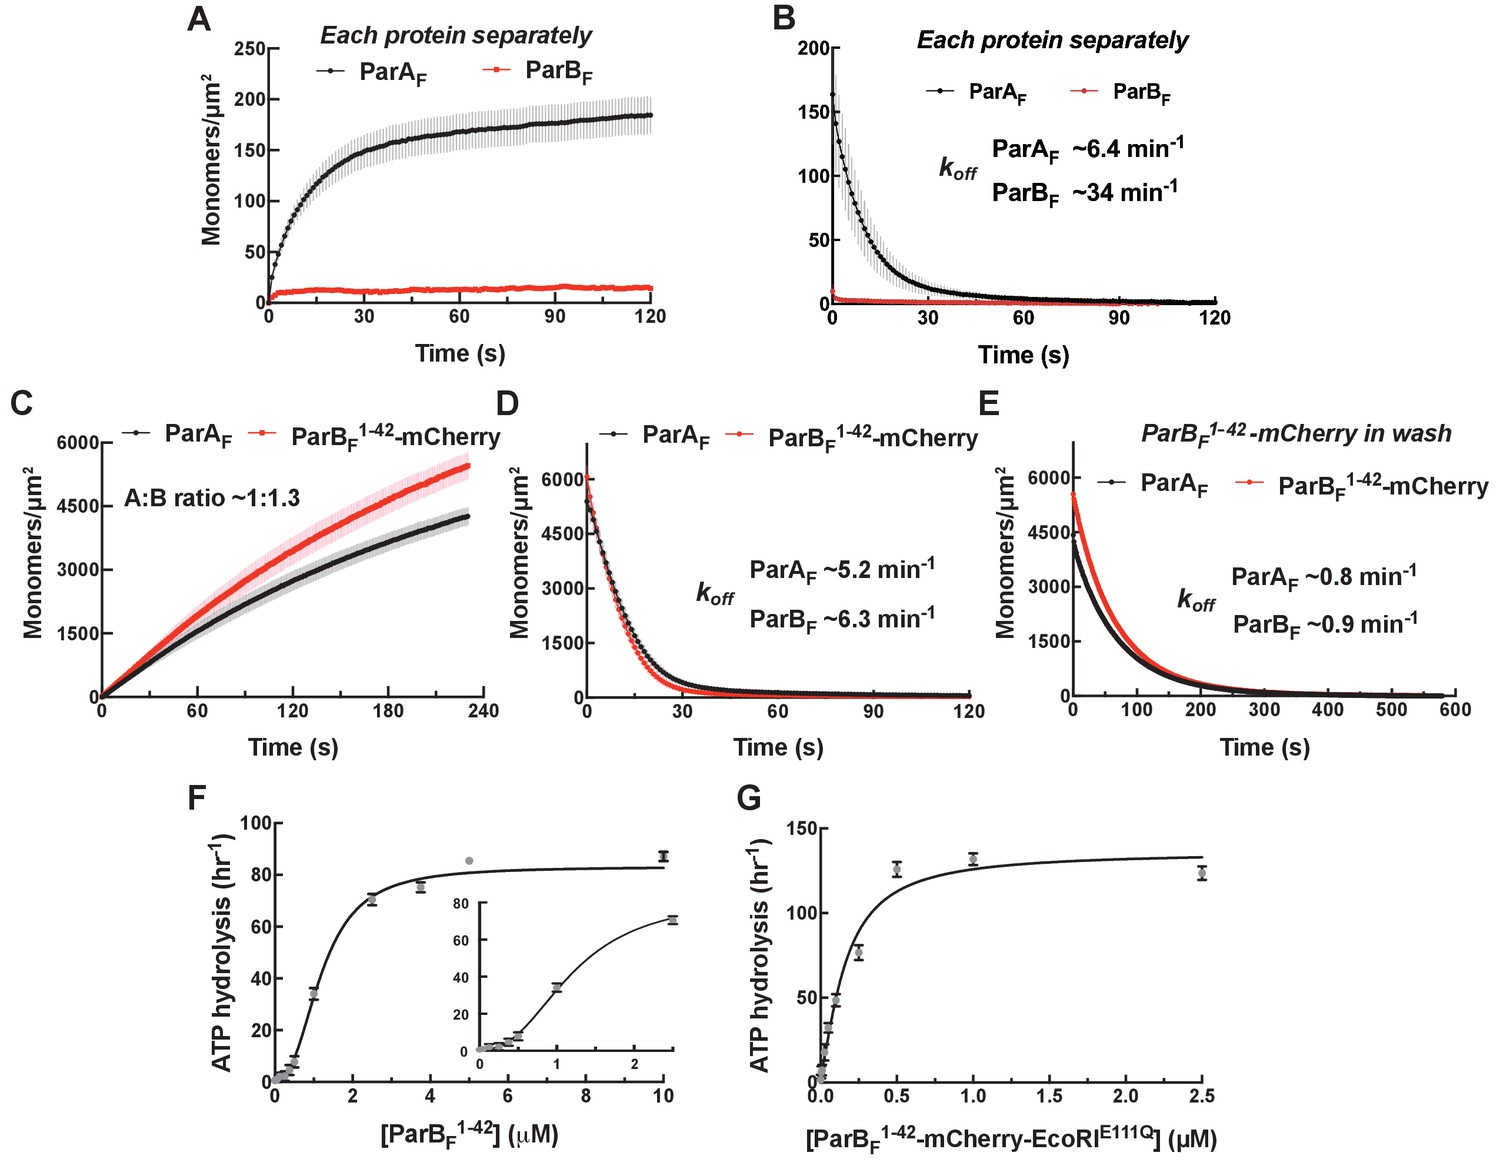
Monomeric ParBF1-42-mCherry can activate ParAF for nsDNA binding in the presence of ATPγS by forming a ~1:1 complex.
Protein sample solution in the presence of ATPγS (1 mM) was infused into nsDNA-carpeted flow cell at a constant flow to monitor the protein binding to the nsDNA, and the sample solution was switched to a wash buffer containing ATPγS to monitor protein dissociation from nsDNA. (A, B) Binding to, and dissociation from, nsDNA of ParAF-eGFP (1 μM) or ParBF-Alexa647 (2 μM) were measured separately. (C) ParBF1-42-mCherry (10 μM) and ParAF-eGFP (1 μM) preincubated with ATPγS were infused into the nsDNA-carpeted flow cell and (D) washed with buffer containing ATPγS. (E) The washing experiment of (D) was repeated with wash buffer containing ATPγS and ParBF1-42-mCherry (10 μM). For the parameters of the time courses of above experiments and subsequent experiments of the same type in this study, see Table 1. The ParBF:ParAF ratio was calculated from carpet-bound densities of the two proteins measured in parallel, and summarized in Table 1. (F) ParAF-ATPase activity (expressed as turnover rate per ParAF monomer) was measured in the presence of EcoRI-digested pBR322 DNA (60 μg/ml) and different concentrations of ParBF1-42. Inset shows a plot with expanded abscissa. (G) ParAF-ATPase activity was measured as above in the presence of dimeric ParBF1-42-mCherry-EcoRIE111Q. The parameters of ATPase stimulation curves in these and subsequent figures are summarized in Table 2.
The N-terminus of ParBF alone enhances DNA binding activity of ParAF
We first examined if the N-terminal ParAF-activation domain of ParBF (ParBF1-42) alone can induce the ParAF conformational changes necessary for DNA binding in the presence of ATPγS. The activation domain includes Arginine 36, which is critical for activation of ParAF ATPase (Ah-Seng et al., 2009; Leonard et al., 2005), but lacks the CTPase (AA63-155), parSF-binding (AA160-272), and dimerization (AA276-323) domains. For these experiments, we used ParBF1-42 fused to the N-terminus of mCherry (ParBF1-42-mCherry). This protein is a monomer in solution as judged by its elution profile on a gel filtration column (Figure 2—figure supplement 1). ParBF1-42-mCherry (10 μM) and ParAF-eGFP (1 μM) bound the DNA-carpet together in the presence of ATPγS to a density of ~5000 monomers/μm2 maintaining ~1:1 stoichiometry (Figure 2C). When washed with a buffer containing ATPγS, ParBF1-42-mCherry dissociated first, with an apparent dissociation rate constant of ~5.7 min−1, closely followed (within a few seconds) by ParAF-eGFP dissociation (Figure 2D). On the other hand, when the wash buffer contained 10 μM ParBF1-42-mCherry and ATPγS, both proteins dissociated together, significantly slower than ParAF-eGFP bound to the DNA-carpet alone, with an apparent rate constant of ~0.9 min−1, maintaining ~1:1 stoichiometry (Figure 2E). After essentially complete dissociation of ParAF-eGFP from the DNA-carpet, 10 μM ParBF1-42-mCherry present in the wash solution showed no significant binding to the DNA-carpet, indicating low intrinsic affinity of this protein for DNA. FRAP measurements of ParAF-eGFP—ParBF1-42-mCherry bound in steady state to the DNA-carpet in the presence of ATPγS also indicated rapid exchange of ParBF1-42-mCherry (Figure 2—figure supplement 2). Thus, at saturating ParBF1-42-mCherry concentration, a ParAF—ATPγS dimer is bound by two molecules of ParBF1-42-mCherry occupying both sides of the ParAF dimer. The data also indicate that ParAF dimers adopt a state of slowed dissociation from nsDNA when both of the ParBF-interacting faces are occupied by the ParBF N-terminal domain. The nsDNA dissociation rate constants of ParAF—ParBF complexes (including those involving ParBF variants) and ParBF:ParAF stoichiometry reported above and in the following sections are summarized in Table 1.
Table 1
Apparent disassembly or exchange rate constants (min−1) and ParBF/ParAF ratio from fits of TIRFM wash and FRAP experiments.
The apparent dissociation (or FRAP) rate constants (koff) were obtained for individual time-trajectories by single-exponential curve fitting (except ** where the rate of the faster decay, (68 ± 0.5%) of a double-exponential fit is shown), and the mean and SEM for the set of independent experiments are shown (except * where standard deviation among non-independent repeats within an experiment is shown). (N is the number of separate experiments, with total number of binding/wash cycles for repeated data collection in parenthesis.) ParA:ParB ratios were calculated from the final phase of the individual association time-trajectories (except *** where it was based on the beginning part of the washing phase in the presence of ParBF1-42 R36A), and the mean and SEM for the set of independent experiments are shown in italics. N.D., not done.
| ParAF | ParAF + ParBF1-42 | ParAF + ParBF1-42 R36A | FRAP | ParAF + ParBF | ParAF + ParBF + CDP | ParAF + ParBF + CTP | ParAF + ParBFR121A | |||||||||
|---|---|---|---|---|---|---|---|---|---|---|---|---|---|---|---|---|
| Protein Measured | ParAF | ParAF | ParBF1-42 | ParAF | ParBF1-42 R36A | ParAF | ParBF1-42 | ParAF | ParBF | ParAF | ParBF | ParAF | ParBF | ParAF | ParBFR121A | |
| - parSF | koff | 6.4± 0.6 N=4 (12) | 5.2± 0.2 N=2 (9) | 6.3± 0.3 N=2 (9) | 29± 2 N=3 (9) | 52± 4 N=3 (9) | 2.0± 0.08 N=3 (11) | 15.3± 2.1** N=3 (12) | 0.93± 0.07 N=2 (6) | 0.89± 0.09 N=2 (6) | N.D. | N.D. | 0.63± 0.04 N=2 (7) | 0.65± 0.10 N=2(7) | 0.89± 0.01 N=3 (8) | 0.78± 0.05 N=3 (8) |
| A:B | 1 : 1.27 ± 0.06 N=2 (8) | 1 : 0.92 ± 0.02*** N=3 (9) | 1 : 1.10 ± 0.13 N=3 (9) | 1 : 2.16 ± 0.15 N=3 (10) | 1 : 0.99 ± 0.01 N=3 (8) | |||||||||||
| + parSF | koff | N.D. | N.D. | N.D. | N.D. | 0.95± 0.04 N=2 (6) | 0.82± 0.01 N=2 (6) | 0.46± 0.02 N=2 (7) | 0.53± 0.01 N=2 (7) | 0.60± 0.08 N=2 (5) | 0.83± 0.12 N=2 (6) | 0.91± 0.01 N=3 (8) | 0.78± 0.04 N=3 (8) | |||
| A:B | 1 : 2.17 ± 0.40 N=3 (9) | 1 : 2.53 ± 0.07 N=2 (6) | 1 : 2.16 ± 0.27 N=2(6) | 1 : 1.12 ± 0.01 N=3 (12) | ||||||||||||
| ParBF or ParBF1-42 R36Ain wash | koff | N.D. | 0.84± 0.01* N=1 (3) | 0.89± 0.02* N=1 (3) | 1.8± 0.4 N=3 (9) | 1.8± 0.4 N=3 (9) | N.D. | N.D. | N.D. | N.D. | N.D. | |||||
ParAF ATPase activation requires binding of two copies of ParBF N-terminal domain to the ParAF dimer
ParBF1-42 stimulated ParAF-ATPase (1 μM) with a clear sigmoidal ParBF1-42 concentration dependence and a half-maximum activation concentration of ~1.2 μM (Figure 2F; Table 2). Thus, monomeric ParBF1-42 appears to activate ParAF-ATPase when it binds on both sides of the DNA-bound ParAF dimers. To test whether the observed sigmoidal concentration dependence is due to the monomeric nature of ParBF1-42, we prepared the N-terminal region of ParBF fused to mCherry and the nuclease activity deficient EcoRIE111Q, ParBF1-42-mCherry-EcoRIE111Q (see Figure 2—figure supplement 3A). This construct, with expected EcoRI dimerization KD < 20 pM (Modrich and Zabel, 1976), efficiently activated ParAF-ATPase at least to a similar maximum rate as ParBF1-42, but with a Khalf of ~0.15 μM, ~eight fold lower than ParBF1-42, and displayed no noticeable sigmoidal concentration dependence (Figure 2G). Potential binding of the inactive EcoRI domain to DNA did not appear to influence the ATPase activation properties of this construct; addition of EcoRI-binding DNA fragment in the reaction did not impact the ATPase activation (Figure 2—figure supplement 4). Based on these results, we conclude that both ParBF-binding faces of a ParAF dimer must be occupied by ParBF N-termini for stimulation of its ATPase activity.
Table 2
ATPase fit parameters.
ATPase measurements were performed with ParAF (1 μM) and different mutants of ParBF, 60 μg/ml EcoRI-digested pBR322 DNA plus Scram- or parSF-DNA fragment and CTP or CDP, as indicated in the column headings. Assays were repeated ‘N’ times, each data set of an assay was fit after subtraction of background measured without ParAF to a modified Hill equation: v − v0 = (vmax [B]n) / (KAn + [B]n), and the mean and standard error of the mean (SEM) of the fit parameters for the N measurements are shown. For [B] on the x-axis, total ParBF concentration was used instead of free ParBF concentration due to technical issues in estimating the free ParBF concentration and the meanings of KA and the cooperativity factor (n) here differ from those in the standard adaptation of the Hill equation. vmax is the maximum stimulated ParAF ATPase turnover rate, KA is the apparent total concentration of ParBF necessary for half maximum stimulation, and n is the apparent cooperativity coefficient.
| ParBF | ParBF CTP | ParBF CDP | ParBFR121A | ParBF1-42 | ParBF1-42 R36A | ParBF1-42-mCherry-EcoRIE111Q | |||||
|---|---|---|---|---|---|---|---|---|---|---|---|
| DNA cofactor Number of exp. | Scram N = 6 | parSF N = 6 | Scram N = 3 | parSF N = 3 | parSF N = 3 | Scram N = 3 | parSF N = 3 | N = 6 | N = 3 | Scram N = 3 | EcoRI DNA N = 2 |
| vmax (hr−1) | 54 ± 5 | 79 ± 2 | 79 ± 8 | 78 ± 8 | 87 ± 5 | 60 ± 5 | 62 ± 5 | 83 ± 3 | 38 ± 2 | 131 ± 13 | 125 ± 9 |
| KA (µM) | 0.53 ± 0.09 | 0.59 ± 0.03 | 0.41 ± 0.05 | 0.24 ± 0.02 | 0.34 ± 0.04 | 0.86 ± 0.1 | 1.1 ± 0.1 | 1.2 ± 0.1 | 108 ± 13 | 0.16 ± 0.04 | 0.16 ± 0.03 |
| Cooperativity coefficient (n) | 1.2 ± 0.2 | 1.4 ± 0.1 | 3.3 ± 1.0 | 3.6 ± 0.2 | 1.1 ± 0.1 | 2.5 ± 0.6 | 1.6 ± 0.3 | 2.5 ± 0.3 | 1.5 ± 0.2 | 1.4 ± 0.3 | 1.4 ± 0.2 |
ParBF1-42 R36A forms a rapidly disassembling complex with ParAF on the DNA carpet
An R36A mutation was reported to significantly compromise ParBF’s ability to activate ParAF’s ATPase (Ah-Seng et al., 2009). To test whether this mutation affected ParBF’s ability to form a complex with ParAF we repeated the experiments shown in Figure 2C–E using ParBF1-42 R36A- mCherry. ParBF1-42R36A- mCherry and ParAF-eGFP bound with an approximately 1:1 stoichiometry, similar to ParBF1-42- mCherry but reached a steady-state density on the DNA-carpet of less than 10% of the density observed with ParBF1-42- mCherry (Figure 3A). When washed with buffer containing ATPγS, ParBF1-42 R36A- mCherry dissociated first followed by ParAF, similar to the results obtained with ParBF1-42- mCherry but ParBF1-42 R36A-mCherry dissociated ~10-fold faster, followed by dissociation of ParAF-eGFP within a few seconds (Figure 3B). When the wash buffer also contained 10 μM ParBF1-42 R36A-mCherry the two proteins dissociated in parallel maintaining ~1:1 stoichiometry (Figure 3C). Together these observations indicate that ParBFR36A interacts with ParAF, but with a much faster dissociation rate constant compared to wild-type ParBF. ParBF1-42 R36A could activate ParAF-ATPase with an increased half-saturation concentration of 108 µM, approximately 100-fold higher than ParBF1-42 (Figure 3D). These results explain the puzzling report that while the R36A mutation severely compromised activation of ParAF-ATPase by ParBF, it did not impede oscillation of ParAF on the nucleoid, and only mildly reduced plasmid stability (Ah-Seng et al., 2013). At the interface between the ParAF-bound nucleoid and partition complexes containing many ParBF dimers, the local ParBF concentration is expected to be sufficiently high for this mutant protein to activate ParAF-ATPase to effectively generate a ParAF depletion zone and motive force driving the partition complex as indicated by the repeated oscillation of the nucleoid-bound ParAF distribution.
Figure 3

ParBF1-42 R36A-mCherry dissociates faster from nsDNA-carpet-bound ParAF-ATPγS dimer, and ParAF-ATPase activation requires higher ParBF1-42 R36A concentration.
(A) ParBF1-42 R36A-mCherry (10 μM) and ParAF-eGFP (1 μM) preincubated with ATPγS were infused into the nsDNA-carpeted flow cell and then (B) washed with buffer containing ATPγS. (C) The washing experiment of B was repeated with buffer containing ATPγS and ParBF1-42 R36A-mCherry (10 μM). (D) ParAF-ATPase activity was measured in the presence of EcoRI-digested pBR322 DNA (60 μg/ml) as a function of ParBF1-42 R36A concentration. See Figure 2 legend and Tables 1 and 2 for additional details.
ParAF and ParBF bind to and dissociate from nsDNA together in the presence of ATPγS with ~1:1 stoichiometry
When ParAF-eGFP and full-length ParBF-Alexa647 were incubated together at 1 µM and 2 µM, respectively, in the presence of ATPγS, they bound to the DNA-carpet in parallel maintaining ~1:1 stoichiometry up to a density of ~5000 monomers/μm2 (Figure 4A). They also dissociated from the DNA-carpet in parallel, maintaining ~1:1 stoichiometry, when washed with a buffer containing ATPγS, with an apparent dissociation rate constant of approximately ~1 min−1 (Figure 4B). These results show that ParAF and ParBF form a hetero-tetramer containing two monomers each of ParAF and ParBF (A2B2), or larger oligomers composed of the hetero-tetramers, that binds as a unit on nsDNA in the presence of ATPγS.
Figure 4 with 2 supplements see all

parSF DNA alters protein stoichiometry of the ParAF–ParBF complex formed prior to ATP hydrolysis and the extent of ParAF-ATPase activation by ParBF.
(A) ParAF-eGFP (1 μM) and ParBF-Alexa647 (2 μM) preincubated with ATPγS were infused into the nsDNA-carpeted flow cell and then (B) washed with buffer containing ATPγS. (C, D) As (A) and (B) except the sample included the 24 bp parSF DNA fragment (1.1 μM). (E) ParAF-ATPase activity was measured in the presence of EcoRI-digested pBR322 DNA (60 μg/ml), different concentrations of ParBF and either a parSF-DNA fragment or a DNA fragment with a scrambled sequence (1.1-fold higher concentrations than the ParBF dimers). See Figure 2 legend and Tables 1 and 2 for additional details.
Full-length ParBF, which forms dimer with apparent KD of ~ 19 nM (Figure 4—figure supplement 1), activated ParAF-ATPase in the presence of nsDNA to ~50 hr−1 without significant sigmoidal concentration dependence (Figure 4E). Based on the results of experiments with monomeric ParBF1-42 proteins described earlier, we conclude that a single dimer of full-length ParBF can straddle an nsDNA-bound ParAF dimer, permitting the two N-termini to interact with both of the ParBF-binding faces of the ParAF dimer to activate the ATPase.
In the presence of parSF, ParBF forms a 2:1 complex with ParAF
We next asked if ParBF bound to parSF interacts differently with ParAF on the DNA-carpet. We preincubated ParAF-eGFP, ParBF-Alexa647, ATPγS and a 24 bp duplex DNA fragment containing a single parSF consensus sequence, at a slight molar excess over ParBF dimer, for 10 min at room temperature. At the concentrations used, most of the ParBF dimers are expected to be bound to parSF. When infused into the DNA-carpeted flow cell, ParAF-eGFP and ParBF-Alexa647 bound to and dissociated from the carpet with a stoichiometry of ~1:2 (Figure 4C,D), in sharp contrast to the ~1:1 stoichiometry without parSF DNA. The kinetic parameters of the complex assembly and disassembly were not significantly affected. These results demonstrate that ParAF and ParBF form a complex of one ParAF dimer and two ParBF dimers (A2B4) in the presence of parSF.
Does the change in protein stoichiometry caused by parSF translate to different levels of ParAF-ATPase activation? A previous study, comparing plasmid DNA with and without parSF as the cofactor, showed that ParBF activates ParAF-ATPase a few-fold more efficiently in the presence of plasmid DNA containing a full parSF site (Ah-Seng et al., 2009). We titrated ParBF in the presence of ParAF, pBR322 DNA, and 24 bp parSF duplex at a stoichiometric excess concentration over the ParBF dimer. In the presence of parSF DNA, ParBF activated ParAF-ATPase to a maximum turnover rate of ~80 hr−1, a ~60% increase compared to reactions where the parSF fragment was replaced with a scrambled sequence fragment (Figure 4E). These results indicate that a single parSF DNA-bound ParBF dimer cannot straddle an nsDNA-bound ParAF dimer to activate the ATPase, but by binding two ParBF dimers the ATPase activation level reaches slightly higher level than in the absence of parSF DNA.
We note that ParBFR121A, harboring a mutation in the conserved Box II region of the CTPase domain, neither exhibited a change in the ParBF/ParAF complex stoichiometry, nor a change in the ParBF-stimulated ATP turnover, in response to parSF (Figure 4—figure supplement 2), suggesting that the effects of parSF binding described above are mediated through conformational changes in the CTPase domain (see below for further discussion).
CTP alters the complex formed between ParAF and ParBF in a manner similar to parSF and accelerates complex formation in the presence of parSF
ParB proteins have recently been reported to have CTPase activity that is coupled with changes in their DNA binding properties and refolding of the CTPase domains into a globular dimeric structure in the presence of CTP (Soh et al., 2019; Osorio-Valeriano et al., 2019) from the more extended and poly-dispersed structure in the absence of nucleotide (Chen et al., 2015). We therefore decided to test whether the addition of CTP influences the ParAF–ParBF complex formed on the DNA-carpet in the presence of ATPγS. When ParAF-eGFP and ParBF-Alexa647 were incubated together in the presence of ATPγS (1 mM) and CTP (2 mM), they bound to and dissociated from the nsDNA-carpet with a stoichiometry of ~1:2 (Figure 5A, Figure 5—figure supplement 1A). The assembly kinetics of the carpet-bound complex was roughly the same as in the absence of CTP; however, the apparent dissociation rate constant during buffer wash was slightly but reproducibly slower by a factor of roughly two at ~0.6 min−1. When parSF was included together with CTP, the rate of A2B4 complex assembly on the DNA-carpet increased several-fold, the binding density of the complex on the DNA-carpet reached a correspondingly higher level, and the two proteins dissociated from the DNA-carpet maintaining a ~1:2 stoichiometry with apparent dissociation rate constant similar to that in the absence of parSF (Figure 5B, Figure 5—figure supplement 1B). When CTP was replaced by CDP in the presence of parSF, although the ParBF/ParAF ratio remained above 2, unlike in the presence of CTP, the complex assembly rate did not increase (Figure 5C, Figure 5—figure supplement 1C), thus behaving similarly to the reaction in the presence of parSF alone.
Figure 5 with 2 supplements see all
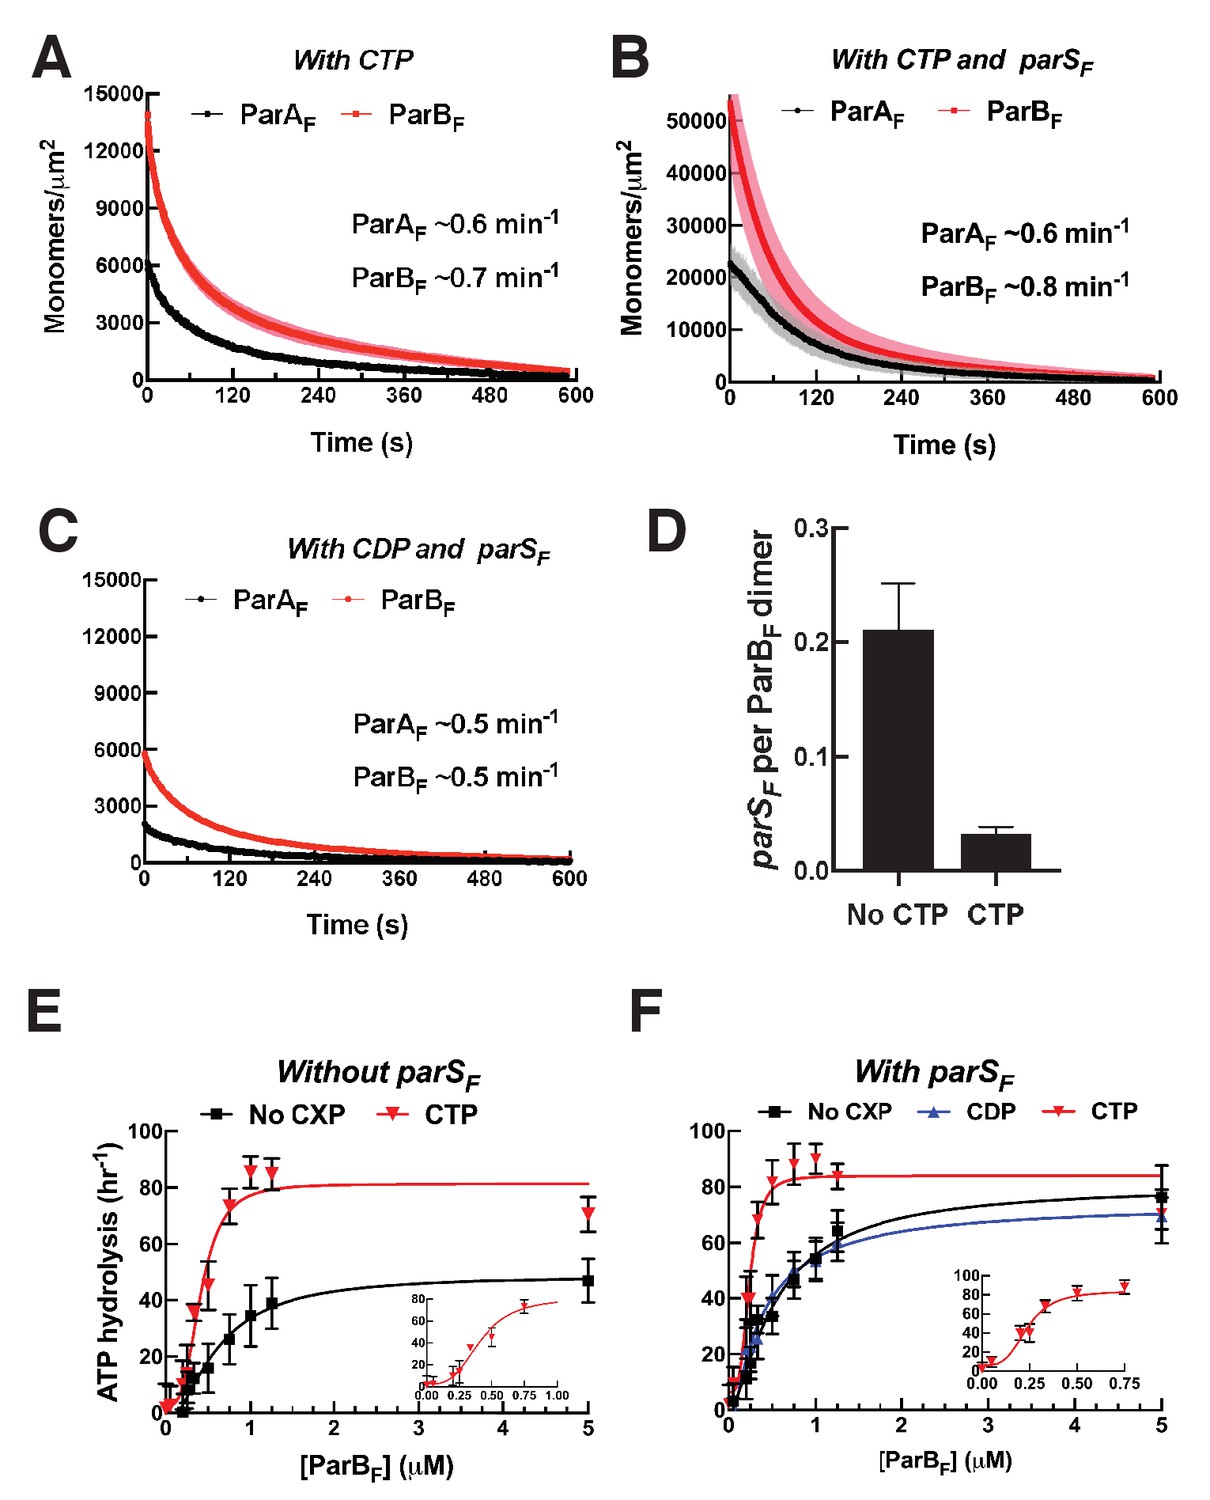
CTP and parSF together alter interactions between ParBF and ParAF dimers.
(A) ParAF-eGFP (1 μM) and ParBF-Alexa647 (2 μM) preincubated with ATPγS and CTP (2 mM) were infused into the nsDNA-carpeted flow cell and then washed with buffer containing ATPγS and CTP. (B) As in (A), except a 24 bp parSF fragment (1.1 μM) was added to the sample mixture. (C) As in (B), except CTP was replaced by CDP. For binding curves, see Figure 5—figure supplement 1A–C. (D) ParAF (1 μM), ParBF-Alexa647 (2 μM) and Alexa488-labeled 24 bp parSF fragment (1.1 μM) preincubated with ATPγS or ATPγS plus CTP (2 mM) were infused into the nsDNA-carpeted flow cell and after 240 s, the ratio of the carpet-bound parSF fragment and ParBF dimer was measured. (E) ParAF-ATPase activity was measured in the presence of EcoRI-digested pBR322 DNA (60 μg/ml), different concentrations of ParBF and either no C-nucleotide or 2 mM CTP. Inset shows data in the presence of CTP with expanded abscissa. (F) As in (E) except the reactions also contained 24 bp parSF fragment (1.1-fold higher concentrations than ParBF dimers). Inset shows data in the presence of parSF and CTP with expanded abscissa. See Figure 2 legend and Tables 1 and 2 for additional details.
Next, we asked if the parSF DNA fragment was incorporated in the A2B4 complexes assembled in its presence. The experiments in the presence of parSF were repeated in the presence or absence of CTP with ParAF (1 μM), ParBF-Alexa647 (2 μM) and Alexa488-parSF (1.1 μM), and the nsDNA-carpet-bound ratio of parSF and ParBF after 240 s sample infusion was measured (Figure 5D). The observed parSF/(ParBF)2 ratio in the absence of CTP was ~0.2, while in the presence of CTP, the ratio was only ~0.04. Thus, whereas the assembly of the A2B4 complex involving CTP-ParBF was accelerated by parSF, a very small fraction of the resulting complex contained the parSF-DNA fragment, indicating that parSF plays a catalytic role in the activation of CTP-ParBF and accelerated assembly of the A2B4 complex. This parallels the observation that a much lower concentration of parSF fully activated the CTPase activity of ParBF (Figure 5—figure supplement 2C) as has also been shown for ParBBsu (Soh et al., 2019).
ParBF activates ParAF-ATPase to the full extent without parSF in the presence of CTP
The maximum ParBF activation of ParAF-ATPase in the presence of CTP, with or without parSF, was comparable to that of parSF-bound ParBF in the absence of CTP (Figure 5E,F). The half-saturation concentration of ParBF in the presence of parSF and CTP was significantly lower than in the absence of CTP (~0.24 μM vs ~0.6 μM). Combined with the observation of faster assembly of the complex on the DNA-carpet, a likely possibility is that in the presence of CTP and parSF, the ParBF dimer adopts a unique state that interacts with ParAF dimers with a higher association rate constant. We note that the ParAF-ATPase assays in this study measured radioactive γ-phosphate release from γ-32P-ATP, avoiding potential technical complications associated with ATPase measurements in the presence of CTP.
We next measured the ParBF-CTPase activity to estimate the apparent KM and kcat of ParBF for CTP hydrolysis in the presence and absence of parSF. ParBF had negligible activity for all NTPs other than CTP (Figure 5—figure supplement 2A), and the CTP hydrolysis rate increased with a hyperbolic CTP concentration dependence, which could be fit with the Michaelis–Menten equation with apparent KM of ~8 μM and ~18 μM and maximum turnover rates of ~14 h−1 and ~44 h−1 in the absence and presence of parSF DNA, respectively (Figure 5—figure supplement 2B). Thus, 2 mM CTP used in the experiments of Figure 5 should have remained saturating ParBF for the duration of the reaction. Stimulation of the CTPase activity by parSF exhibited a pronounced sigmoidal concentration dependence approaching saturation at ~ 60 nM, well below the ParBF concentration in the reaction (0.84 μM) (Figure 5—figure supplement 2C).
During these experiments, which were prompted by a reviewer’s comment, we also attempted to characterize the interaction between CDP and ParBF, but discovered that the CDP used here contained ~2% contamination of a compound that released Pi upon incubation with ParBF (Figure 5—figure supplement 2D). The results shown in Figure 5C and Figure 5F suggest this contamination did not strongly influence the reactions involving CDP, considering that they generally paralleled the results obtained in the absence of C-nucleotides with only minor deviations. However, this contamination prevented us from accurately determining the affinity of ParBF for CDP.
In the presence of CTP, ParBF condenses DNA carrying parSF in cis
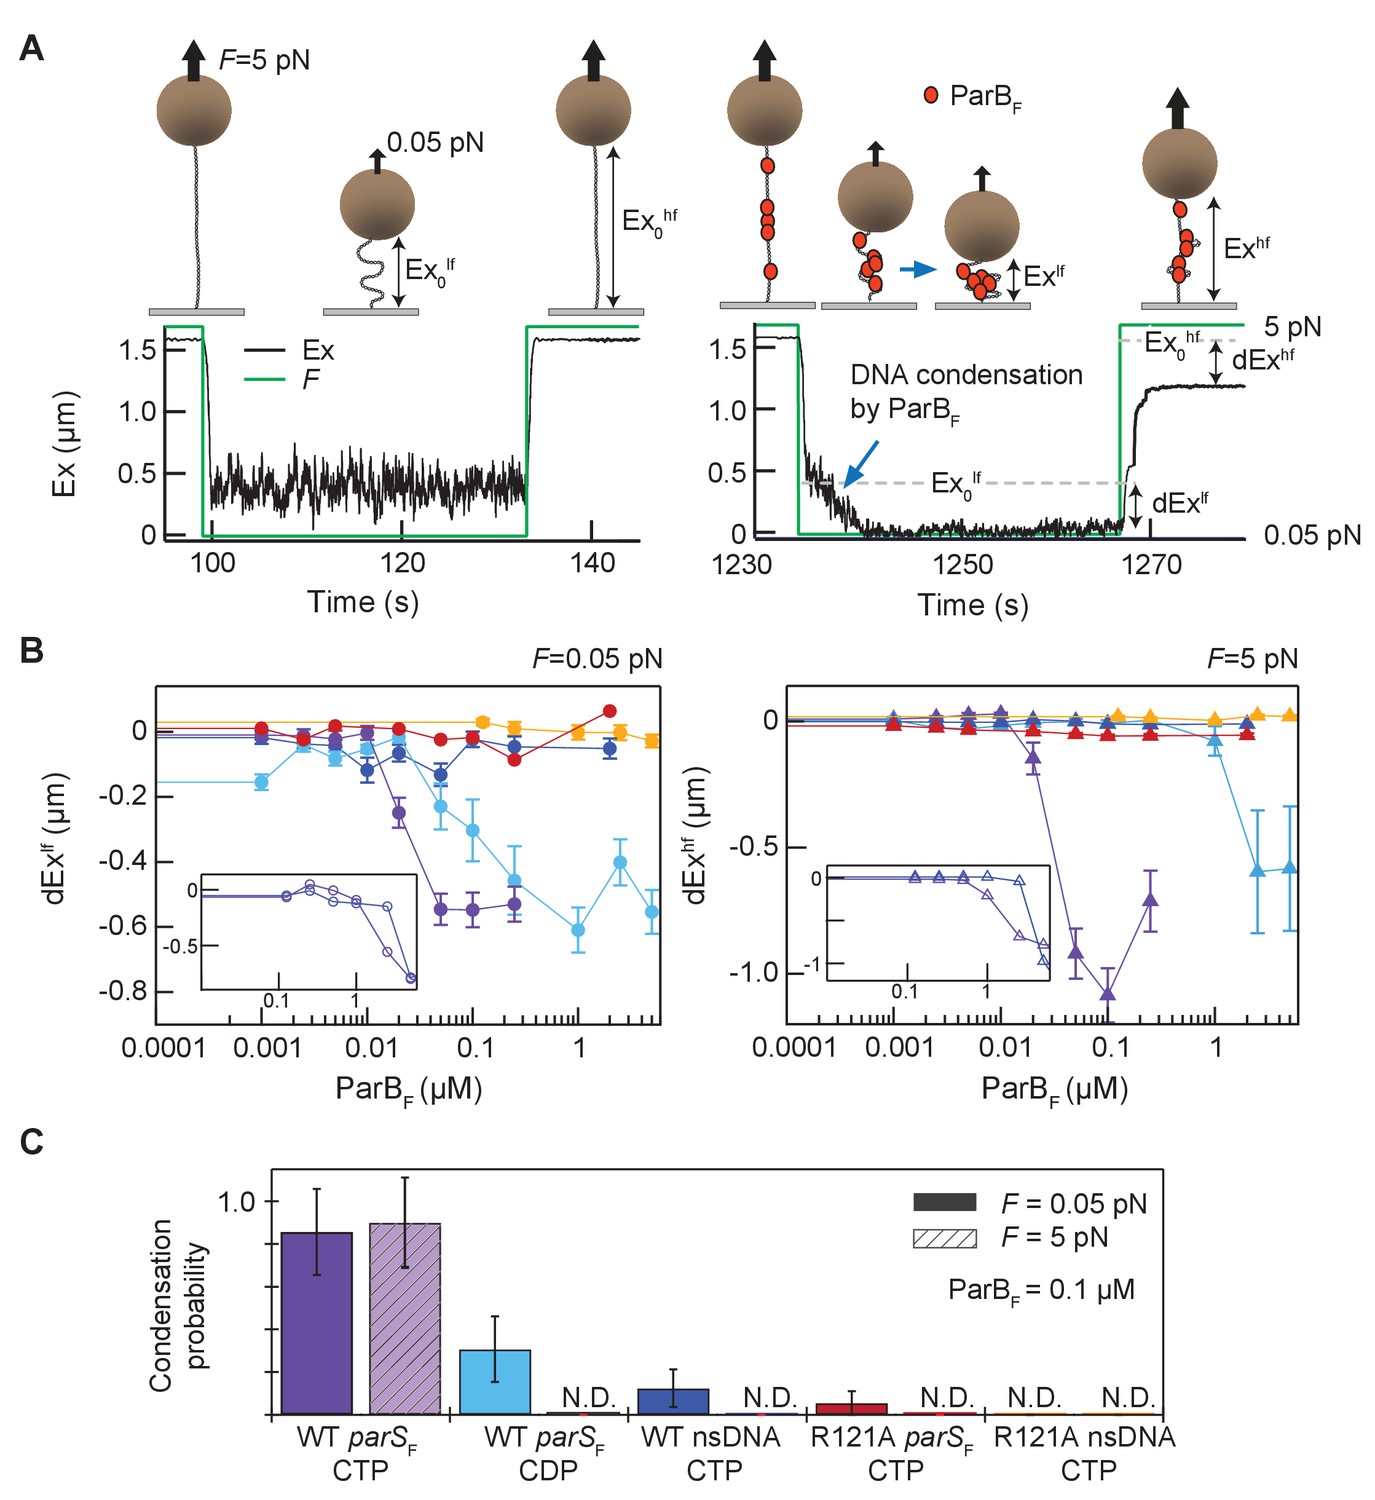
The recently discovered CTP and parS-dependent ParB conformational change appears to promote ParB parS-DNA binding and spreading (Soh et al., 2019), impacting ParB-DNA partition complex assembly. In vivo, spreading ParB forms condensed foci around parS sites indicating that parS-driven ParB spreading likely occurs in cis. Nonetheless, the possibility that parS can trigger ParB spreading in trans has not been tested in vitro. Previous studies reported DNA condensation by B. subtilis ParB via ParB–ParB interactions, but these studies were conducted in the absence of CTP and did not observe a strong effect of parS in cis (Graham et al., 2014; Song et al., 2017; Taylor et al., 2015). To see if parSF can act in trans and to characterize how parSF and CTP influence ParBF–DNA interactions in vitro, we conducted single-molecule DNA pulling experiments employing magnetic tweezers. ParBF at various concentrations was infused into a flow cell containing ~5 kbp DNA tethers that anchored magnetic beads to the coverslip surface (Figure 6A). The tethers contained either 12 parSF consensus sequence repeats at their midpoints (parSF-DNA), or no parSF sequence (nsDNA). The protein sample was infused while the DNA tethers were stretched at 5 pN force, preventing DNA condensation. To allow DNA condensation by bound ParBF molecules, the force was dropped to 0.05 pN and the tether extension was monitored for 30 s. To assess the stability of DNA condensation by ParBF dimers, tether extension was monitored after increasing the force to 5 pN. In the absence of CTP, we only observed condensation at very high concentrations of ParBF (>5 µM) and did not see a significant difference between parSF-containing and non-specific tethers (Figure 6B inset). However, in the presence of CTP, 50 nM ParBF robustly condensed parSF-containing DNA tethers (Figure 6B purple). These condensed protein-DNA complexes resisted 5 pN extension force, requiring many minutes at 5 pN tension to de-condense (Figure 6—figure supplement 1A). The slow de-condensation took place through a series of abrupt steps, which we interpret as stepwise opening of large DNA loops held by multiple ParBF–ParBF interactions (Figure 6—figure supplement 1A). Condensation was comparable for DNA molecules that were topologically constrained, i.e., could be supercoiled, or unconstrained (nicked), suggesting that condensation is not a consequence of topological changes in the DNA caused by ParBF translocating away from parSF sites (Figure 6—figure supplement 2). We observed some condensation events with parSF containing tethers in the presence of CDP, but these events were rarer, required higher ParBF concentrations, and were almost completely de-condensed within 5 s of raising the force to 5 pN, in stark contrast to condensation in the presence of CTP (Figure 6B, light blue, Figure 6—figure supplement 1B). Since this experiment was also carried out using CDP that contained a compound hydrolysable by ParBF, contribution of this compound to the limited tether condensation cannot be ruled out. In contrast, ParBF was unable to substantially condense DNA tethers lacking parSF sequences, even in the presence of CTP, and rare condensation events were quickly reversed by the application of 5 pN force (Figure 6B, dark blue). Addition of parSF-containing DNA fragments together with ParBF and CTP did not rescue the inability to condense tethers lacking parSF, indicating that parSF cannot act in trans to promote ParB spreading and condensation of DNA molecules (Figure 6—figure supplement 3). Together these results indicate that parSF mediates loading of multiple CTP-bound ParBF dimers in cis onto the DNA-tethers and these ParBF dimers are capable of forming DNA looping bridges likely via inter-dimer interactions to form a condensed partition complex-like structure. As expected, ParBFR121A bearing a mutation at the critical Box II residue in the CTPase domain was unable to condense DNA to a significant degree even with parSF containing tethers (Figure 6B, red). We propose that stable DNA condensation by ParBF is mediated by CTPase domain dimerization and requires both parSF and CTP at moderate ParBF concentrations (~100 nM) (Figure 6C).
Figure 6 with 3 supplements see all
Magnetic tweezers measurements of parSF and CTP-dependent DNA condensation by ParBF.
(A) Schematic showing the magnetic tweezers DNA condensation assay. One end of a 5 kb DNA molecule is attached to the surface of a flow-cell and the free end is attached to a 1 µm magnetic bead (brown sphere). The DNA extension (Ex) was measured by tracking the bead height above the cover glass surface at two different forces; 0.05 pN (low force, lf), and 5 pN (high force, hf). The extent of DNA condensation was estimated from the difference in DNA extension with and without ParBF. (B) Changes in extension at low force (dExlf = Exlf– Ex0lf), left panel, and at high force (dExhf = Exhf− Ex0hf), right panel, for seven different conditions plotted as a function of ParBF concentration. The extension values were the averages of the last 5 s of the extension at low force (circles) and the first 5 s of the extension at high force (triangles). Error bars represent standard error of means (SEM). Different conditions are color coded as follows. Purple: parSF-DNA tether with WT ParBF and CTP; light blue: parSF-DNA tether with WT ParBF and CDP; dark blue: nsDNA tether with WT ParBF and CTP; red: parSF-DNA tether with ParBFR121A and CTP; orange: nsDNA tether with ParBFR121A and CTP. For comparison with condensation in the presence of CTP, dEx data of parSF-DNA tether (purple) and nsDNA tether (blue) with WT ParBF without CTP are displayed (inset, open circles for 0.05 pN, triangle for 5 pN respectively). (C) The condensation probabilities at 0.1 µM ParBF for five different conditions at 0.05 pN and 5 pN. The condensation probability was calculated by dividing the number of DNA tethers that exhibited DNA condensation by the total number of DNA tethers for each measurement condition. Except for parSF-DNA with WT ParBF and CTP, all conditions show either minimal or negligible condensation probabilities. The different conditions are color-coded as indicated in (B), and the diagonal stripes indicates probabilities at 5 pN. Error bars represent standard error of means (SEM).
Discussion
In this report, we characterized facets of the ParAF–ParBF interaction leading to the assembly of the nsDNA-bound ParAF–ParBF complex that is required to activate ParAF for ATP hydrolysis and dissociation from nsDNA under the influences of parSF and CTP (summarized in Figure 7). Our results indicate that both ParBF binding faces of the nsDNA-bound ParAF dimers must be occupied by a ParBF N-terminal domain for ATPase activation (Figures 2C–G and 7B). In principle, two copies of the ParBF N-terminal domain activating a ParAF dimer could belong to one ParBF dimer as seen in the absence of CTP or parSF (Figures 4A,B and 7B, middle). However, most ParBF dimers in partition complexes in vivo are likely in the CTP- and parSF-activated state, spreading over a parSF-proximal DNA region. CTP or parSF binding alters the ParBF dimer structure to prevent a single ParBF dimer from providing both copies of the N-terminal domain to occupy both binding faces of a ParAF dimer, necessitating two ParBF dimers, each providing one N-terminal domain to a ParAF dimer (Figures 4C,D, 5, and 7B, bottom). Strikingly, parSF together with CTP significantly increased the A2B4 complex assembly rate on nsDNA without strongly affecting its disassembly rate. Although we have not analyzed the full kinetic details of the process that leads to ATPase activation by ParBF, we propose that a moderately slow transition separates formation of the ATPase-activated A2B4 complex from the rapidly reversible ParAF–ParBF interaction processes. Such a local slow step would partially decouple the reversible ParAF–ParBF interaction dynamics from the irreversible ATP hydrolysis, thereby promoting dynamic interactions between the nucleoid and partition complex that facilitate partitioning via the diffusion-ratchet mechanism as elaborated below.
Figure 7
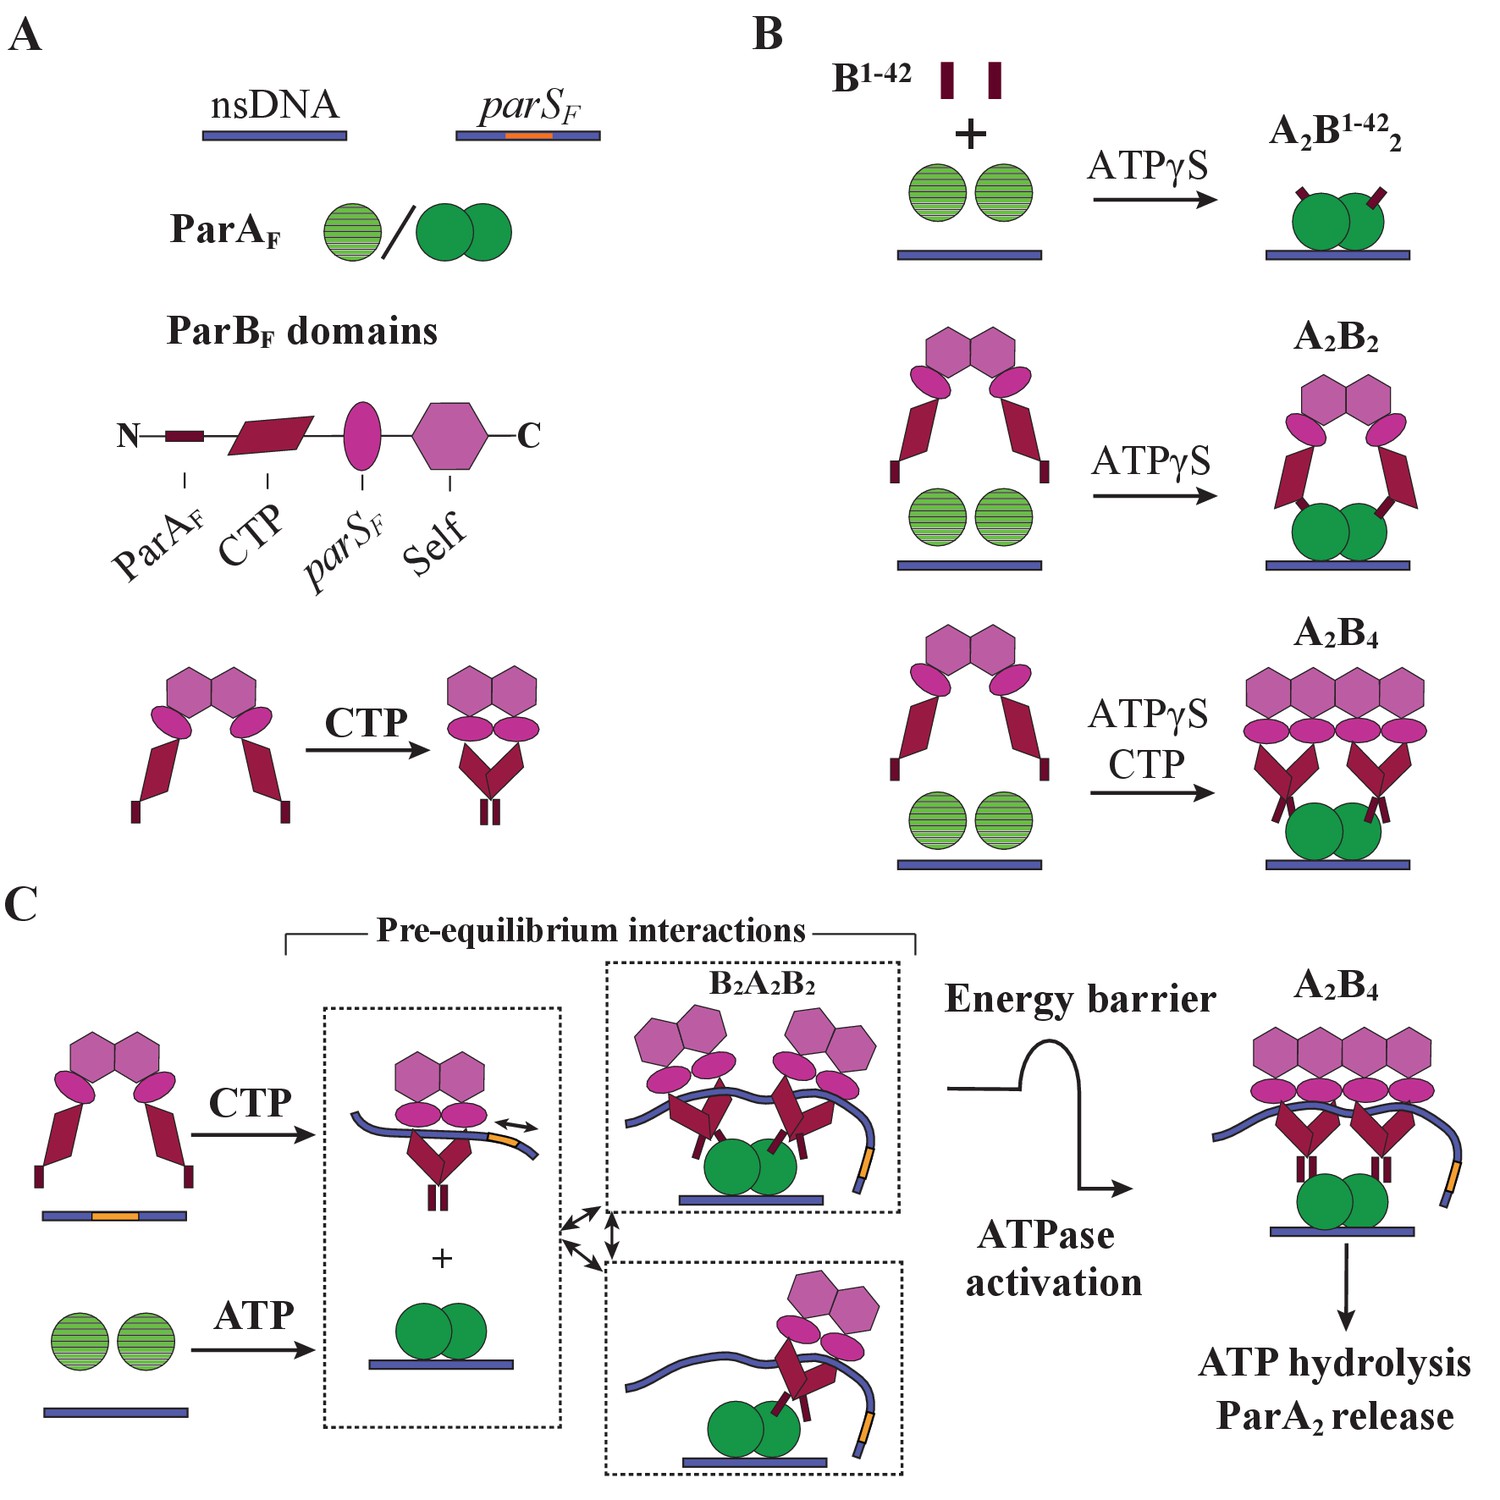
Cartoon of the proposed pre-ATPase-activation complexes of ParAF and ParBF.
(A) Pictograms of nsDNA, parSF-DNA, ParAF monomer/dimer and ParBF domains with binding ligand designations. The CTPase domains of a ParBF dimer fold forming a single globular domain on binding CTP, bringing the two ParAF-binding domains into close proximity. (B) ParAF-binding domain, ParBF1-42 alone can convert ParAF monomers to DNA-binding-competent dimers in the presence of ATPγS by forming an A2B1-422 complex (top). ParBF dimers in the absence of CTP convert ParAF monomers to DNA-binding-competent dimers in the presence of ATPγS by straddling a ParAF dimer to form an A2B2 complex (middle). In the presence of CTP, the close proximity of the ParAF-binding domains of the ParBF dimer prevents A2B2 complex formation and instead an A2B4 complex assembles on nsDNA in the presence of ATPγS (bottom). (C) In the presence of parSF and CTP, ParBF dimers load on to the parSF-DNA and spread to adjacent DNA regions while adopting a state that enables faster assembly of A2B4 complexes. Considering the requirements for efficient partition complex motion by diffusion-ratchet mechanism based on the chemophoretic principle of force generation, we propose a significant energy barrier that slows the formation of the ATP hydrolysis-competent A2B4 complex. This energy barrier partially decouples ParAF–ParBF association–dissociation dynamics from ATP hydrolysis, which triggers ParAF dissociation from the nucleoid.
The clearest indication that both ParBF-interacting faces of the nsDNA-bound ParAF dimer must be occupied by the N-terminal domain of ParBF for ATPase activation came from experiments using artificial ParBF constructs. We showed that monomeric ParBF1-42 stimulates ParAF ATPase with a clear sigmoidal concentration dependence, indicating that one molecule of ParBF1-42 binding to one side of a ParAF dimer cannot fully activate the ParAF ATPase (Figure 2F). When ATP hydrolysis was blocked by using non-hydrolysable ATPγS, ParBF1-42-mCherry formed an equimolar complex with ParAF (Figure 2C–E). Thus, the ParAF forms a complex with ParBF1-42-mCherry bound at both ParBF-interacting faces of the ParAF dimer prior to ATP hydrolysis (Figure 7B; top). Consistently, an artificially dimeric ParBF1-42 construct, ParBF1-42-mCherry-EcoRIE111Q, efficiently activated ParAF-ATPase with hyperbolic concentration dependence (Figure 2G).
In the absence of CTP or parSF, the ParBF dimer is held together by the C-terminal self-dimerization domain (Figure 7A, bottom) with dimerization KD of ~19 nM (Figure 4—figure supplement 1). In this state, the N-terminal halves of the monomers are thought to be separate from each other according to the SAXS envelope of the structure (Chen et al., 2015; also see Figure 2—figure supplement 3B). Thus, one dimer could straddle a ParAF dimer with each N-terminal ParAF-interaction domain interacting with one of the two faces of a ParAF dimer (Figure 7B, middle).
In contrast, when bound by CTP the CTPase domains in a ParBF dimer fold to form a single globular domain (Figure 7A, bottom) (Soh et al., 2019; see Figure 2—figure supplement 3C). The two ParAF-interaction domains emanating from this dimeric domain are unlikely to reach both sides of a ParAF dimer, necessitating an A2B4 complex for ATPase activation (Figure 7B, bottom). In theory, it is possible that a chain of (A2B2)n might form, but the 1:2 protein stoichiometry observed in the presence of ATPγS indicates such a configuration is unfavored. A2B4 complexes formed in the presence of CTP and parSF DNA fragments contained almost no parSF DNA fragments (Figure 5D). This is consistent with the notion that after binding parSF, CTP-ParBF dimers convert to a low parSF-affinity state while remaining topologically bound to the DNA and spreading to surrounding DNA regions (Soh et al., 2019). The A2B4 complex formed in the presence of parSF DNA fragments, even without CTP, contained significantly less than a stoichiometric amount of parSF fragment (Figure 5D). This suggests that association with nsDNA-bound ParAF dimer lowers the affinity of ParBF for parSF, perhaps shifting the structure closer toward parSF-activated ParBF-CTP.
The ParB:ParA stoichiometry change from 1:1 to 2:1 caused by parSF (Figure 4C,D) did not occur with the Box II mutant ParBFR121A (Figure 4—figure supplement 2). It is possible that when a ParBF dimer binds parSF, the adjacent CTPase domains of the two monomers adopt a mutually interacting folded state akin to the CTP-bound state even without CTP, promoting a Box II dependent dimerized domain structure. This may disfavor formation of the A2B2 complex, favoring the A2B4 complex that was observed.
All the A2B2 and A2B4 complexes we observed in the presence of ATPγS dissociated from nsDNA more slowly (koff = 0.5–1 min−1; Source data 1) compared to ParAF in the absence of ParBF (~6 min−1; Figure 2B). For the case of monomeric ParBF1-42, which dissociated from ParAF more rapidly, the presence of 10 μM ParBF1-42 in the wash buffer restored the low apparent nsDNA dissociation rate constant of the complex (Figure 2E). Nevertheless, ParAF dimers in these complexes appear to be primed for further conformational change toward less stably DNA-associated state. Upon dissociation of ParBF1-42 from the A2B1-422 complex, ParAF dissociated from the DNA-carpet within a second or so, much faster than the ATPγS-ParAF-dimer that has not yet formed a A2B2 or A2B4 complex (Figures 2D and 3B).
Our single-molecule DNA condensation measurements indicate that CTP-bound ParBF dimers are activated by contacting parSF to load in cis onto the parSF-carrying DNA in numbers exceeding the copy number of the parSF-consensus sequence (ParB spreading) as shown by others for chromosomal ParBs (Jalal et al., 2020; Soh et al., 2019), and condense the DNA forming an in vivo partition complex-like structure (Figure 6). Although the magnetic tweezers instrument used in this study did not allow direct measurement of the number of ParBF molecules contained in the condensed DNA, the large number of de-condensation steps observed when high tension was applied is consistent with the presence of a large number of ParBF dimers in the condensed DNA (Figure 6, Figure 6—figure supplement 1A). CDP failed to support efficient condensation of parSF-carrying DNA by ParBF and the limited condensation observed, which could be due to the contaminating material in the CDP used, was disrupted far more readily than CTP-supported condensates (Figure 6, Figure 6—figure supplement 1B). Our results show that DNA-condensation is caused by ParBF–ParBF interactions forming DNA-looping bridges without requiring other protein factors. Combined with evidence indicating that parSF-activated ParBF–CTP adopts a unique conformational state (Soh et al., 2019), we favor the view that DNA-bridging capability, mediated by inter-dimer ParBF interaction, is another attribute of this ParBF state.
Our observation indicates that the state of ParBF discussed above is maintained after release from parSF-containing DNA. ParBF associates with nsDNA-bound ParAF dimers forming the A2B4 complex with a faster apparent assembly rate in the presence of parSF and CTP together than with either CTP or parSF alone. This observation is consistent with the decreased half-saturation concentration in the ATPase activation assay (Figure 5F, Table 2). According to the sliding clamp model of spreading ParB–CTP dimers proposed by Soh et al., 2019, ParBF–CTP dimers loaded onto a short parSF DNA fragments would quickly slide off the DNA as shown by Jalal et al., 2020. Since our ATPase activation assay and the DNA-carpet-bound A2B4 complex assay in the presence of CTP and parSF were done using a short linear parSF DNA fragment, the parSF-activated state of the ParBF–CTP dimers we described in this study must remain in this ‘activated’ state for an extended period after sliding off the parSF fragment. Accordingly, the A2B4 complexes bound to the DNA-carpet in the presence of CTP, ATPγS and parSF fragments contained almost no parSF fragments (Figure 5D). Thus, parSF acts as a catalyst to convert ParBF–CTP dimers from a pre-activation state to an activated state capable of faster A2B4 complex assembly. This notion is also consistent with the observation that significantly less than a stoichiometric concentration of parS DNA relative to ParB is sufficient for full activation of the ParB CTPase (Figure 5—figure supplement 2C; Soh et al., 2019). Although the ParBF dimers in this activated state failed to load efficiently onto DNA lacking parSF sequences in trans (Figure 6—figure supplement 3), in the absence of contrary evidence, the parsimonious assumption is that this ParBF dimer retains the conformation of spreading ParBF dimers that remain loaded on the parSF-containing DNA in cis. Thus, we propose that the functional properties of ParBF we observed in the presence of CTP and parSF, both in facilitating assembly of A2B4 complexes and in activating ParAF-ATPase, reflect those of the majority of ParBF dimers in partition complexes in vivo.
Our study, together with previous studies, indicates that the ATP turnover rates of ParABS systems are slow because of multiple, slow kinetic steps. These slow steps are strategically placed in the reaction pathway in order to tune the system and drive the motion of the partition complex through the diffusion-ratchet mechanism (Sugawara and Kaneko, 2011; Vecchiarelli et al., 2010). Even at saturating concentrations of ParBF in the parSF-activated CTP-bound state, the maximum ATP turnover rate of ParAF remained modest (~80 ATP/ParAF-monomer/hour; Figure 5). The slow reactivation of ParA nucleoid binding after ATP hydrolysis likely dominates the overall ATPase cycle time (Vecchiarelli et al., 2010). The presence of a large fraction of ParAF in the DNA-unbound state during the steady-state ATPase assay was evidenced by the fact that the half-saturation concentration of ParBF (in the presence of CTP and parSF) forming the A2B4 complex was ~0.2 μM, while the total ParAF concentration was 1 μM, suggesting less than ~20% of ParAF was in the nsDNA-bound state ready to interact with ParBF. In vivo the reactivation rate is likely lower since nucleoid-bound ParA is only fully activated on encountering the partition complex, which lowers the concentration of ParA in the cytosol waiting to be reactivated. The lower precursor concentration slows the nucleoid rebinding rate of ParA non-linearly because reactivation involves a relatively fast nucleotide-dependent reversible ParA dimerization with apparent KD of ~2 μM, followed by a slow conformational step. This makes the process dimerization-limited at lower precursor ParA concentrations according to the study of ParAP1 (Vecchiarelli et al., 2010). Whereas this slow ParA reactivation and rebinding process, which allows the maintenance of the nucleoid-bound ParA concentration gradient (Hu et al., 2017), is a critical element of chemophoresis driven motility, the rate of ParA-ATPase activation by ParB is another important factor. In particular, efficient chemophoresis force generation relies on ParAF–ParBF interactions achieving a local quasi-equilibrium prior to ATP hydrolysis (Sugawara and Kaneko, 2011). Therefore, we speculate that there is a significant energy barrier associated with the conformational transition of a ParAF–ParBF complex to achieve ATPase activation (Figure 7C). The resulting local time delay, in addition to the fact that two ParB dimers are required to bind a ParA dimer to activate its ATPase, would partially decouple the pre-ATP hydrolysis ParAF–ParBF reversible interaction steps from the ATP hydrolysis step. This delay would in turn permit ParB–ParA binding to approach local quasi-equilibrium, increasing the efficiency of ParA distribution gradient sensing and motive force generation by the partition complex. In addition, this slow activation step would prevent possible over-depletion of the local nucleoid-bound ParAF as the partition complex establishes the ParAF depletion zone.
Disassembly of the ATP-bound A2B4 complex might be slow prior to ATP hydrolysis considering the stability of the complexes in the presence of ATPγS. Thus, we propose the energy barrier postulated above is positioned immediately prior to formation of this complex rather than between this complex assembly and ATP hydrolysis. A slow step after formation of the stable complex would prolong the lifetime of the link between the nucleoid and the partition complex impeding partition complex motion without permitting the reversible ParAF–ParBF interaction to approach equilibrium. We consider this conformational transition is likely the step synergistically accelerated by CTP and parSF. We note that CTP-activated ParBF stimulates ParAF ATPase with sigmoidal concentration dependence (Figure 5E,F, Table 2), suggesting two ParBF dimers separately bind a ParAF dimer during a pre-equilibrium binding phase, forming a transient B2A2B2 complex. We imagine the slow conformational step proposed here might be assisted by the property of the CTP/parSF-activated ParBF dimers that promotes inter-dimer interactions as suggested by the magnetic-tweezers experiments, stabilizing the interaction between the two ParBF dimers within a complex, depicted as conversion of B2A2B2 complex to A2B4 complex in Figure 7C. This might explain the higher assembly rate and stability of the complex formed with parSF-activated ParBF-CTP. Yet, CTP and parSF DNA do not significantly increase the ATP turnover rate of ~80 h−1, indicating that the proposed kinetic delay time must be a small fraction of the ATPase cycle time (~45 s), for which we believe the rate limiting step resides in the reactivation process of ParA for nsDNA binding after ATP hydrolysis (Vecchiarelli et al., 2010). Assembly of the A2B1-422 complex perhaps does not experience this time delay due to fewer steric constraints, but ParBF1-42 dissociates more readily compared to full-length ParBF. If two CTP-bound and parSF-activated ParBF dimers independently associating with a nucleoid-bound ParAF-ATP dimer is important for efficient partition complex motive force generation by the chemophoretic principle as proposed above, one might be able to design a mutant ParBF that can activate ParAF-ATPase by forming an A2B2 complex even in the presence of CTP, which would significantly affect plasmid partition efficiency. Efforts to generate such ParBF mutants are currently under way.
This study demonstrates how parSF, along with CTP, has wide-reaching roles in the F-plasmid ParABS system; not only in ParBF’s ability to spread from parSF and promote ParBF–ParBF interactions for partition complex compaction, but also in ParBF dimer interactions with ParAF. However, we still need to investigate how the ParBF CTPase activity is impacted by parSF in different states of the ParBF–parSF complex and its interaction with the ParAF-DNA complex. More generally, in order to understand how the system is orchestrated to achieve system dynamics that result in robust plasmid segregation, improved understanding of the microscopic kinetic parameters is essential. Many details of the system dynamics still remain to be addressed to understand the full picture of the ParABS partition mechanism.
Materials and methods
Key resources table
| Reagent type (species) or resource | Designation | Source or reference | Identifiers | Additional information |
|---|---|---|---|---|
| Strain, strain background (Escherichia coli) | BL21 DE3 AI | Invitrogen | C607003 | Protein expression strain |
| Recombinant DNA reagent | pET11a | EMD Millipore | 9436 | Protein expression vector |
| Recombinant DNA reagent | pET28a-parSF | This work | Tether DNA PCR template | |
| Recombinant DNA reagent | pET28a | EMD Millipore | 69865 | Tether DNA PCR template |
| Recombinant DNA reagent | pBlueScript II KS(+) | Agilent | 212207 | Tether DNA PCR template |
| Recombinant DNA reagent | pX7 | Vecchiarelli et al., 2013 | ParAFoverexpression plasmid | |
| Recombinant DNA reagent | pX2 | Vecchiarelli et al., 2013 | ParAF-eGFP overexpression plasmid | |
| Recombinant DNA reagent | pX8 | Vecchiarelli et al., 2013 | ParBFoverexpression plasmid | |
| Recombinant DNA reagent | pET11a-ParBFR121A | This work | ParBFR121overexpression plasmid | |
| Recombinant DNA reagent | pET11a-ParBF1-42-mCherry | This work | ParBF1-42-mCherry overexpression plasmid | |
| Recombinant DNA reagent | pET11a-ParBF1-42 R36A-mCherry | This work | ParBF1-42 R36A-mCherry overexpression plasmid | |
| Recombinant DNA reagent | pET11a-ParBF1-42-mCherry-EcoRIE111Q | This work | ParBF1-42-mCherry-EcoRIE111Qoverexpression plasmid | |
| Sequence-based reagent | parSF DNA | This work | 5'-AGTCTGGGACCACGGTCCCACTCG | |
| Sequence-based reagent | parSF DNA Alexa 488 | This work | 5'-Alexa488-(HNS)-AGTCTGGGACCACGGTCCCACTCG | |
| Sequence-based reagent | parSF DNA complement strand | This work | 5'-CGAGTGGGACCGTGGTCCCAGACT | |
| Sequence-based reagent | Scrambled seq DNA | This work | 5'-AGTCTGCAGCTACTATACCACTCG | |
| Sequence-based reagent | Scrambled seq DNA complement strand | This work | 5'-CGAGTGGTATAGTAGCTGCAGACT | |
| Sequence-based reagent | EcoR1 sequence + strand | This work | 5'-GAATTCCGAGTGGGACCGTGGTCCCAGTCTGATTATCAGACCGAGAATTCAAGTTGGGACCGTGGTCCCAAGAGAAT | |
| Sequence-based reagent | EcoR1 sequence - strand | This work | 5’-ATTCTCTTGGGACCACGGTCCCAACTTGAATTCTCGGTCTGATAATCAGACTGGGACCACGGTCCCACTCGGAATTC | |
| Sequence-based reagent | 5 kb DNA primer1 | Seol and Neuman, 2011 | 5'- GCTGGGTCTCGGTTGTTCCCTTTAGTGAGGGTTAATTG | |
| Sequence-based reagent | 5 kb DNA primer2 | Seol and Neuman, 2011 | 5'- GCTGGGTCTCGTGGTTTCCCTTTAGTGAGGGTTAATTG | |
| Sequence-based reagent | DNA handle primer1 | Seol and Neuman, 2011 | 5'- GGACCTGCTTTCGTTGTGGCGTAATCATGGTCATAG | |
| Sequence-based reagent | DNA handle primer2 | Seol and Neuman, 2011 | 5'- GGGTCTCGTGGTTTATAGTCCTGTCGGGTTTC | |
| Peptide, recombinant protein | ParBF1-42 | This work | MKRAPVIPKHTLNTQPVEDTSLSTPAAPMVDSLIARVGVMAR | |
| Peptide, recombinant protein | ParBF1-42 R36A | This work | MKRAPVIPKHTLNTQPVEDTSLSTPAAPMVDSLIAAVGVMAR | |
| Chemical compound, drug | ATP | Millipore-Sigma | A2383 | |
| Chemical compound, drug | GTP | Millipore-Sigma | G8877 | |
| Chemical compound, drug | UTP | Thermo Scientific | J23160 | |
| Chemical compound, drug | CTP | Millipore-Sigma | C1506 | |
| Chemical compound, drug | CDP | Millipore-Sigma | C9755 | 2–3% possible contamination of ParBF-CTPase substrate detected |
| Chemical compound, drug | γ32P-ATP | Perkin-Elmer | NEG002A250UC | |
| Chemical compound, drug | Dynabeads MyOne Streptavidin T1 | Invitrogen | 65601 | |
| Chemical compound, drug | Alexa Fluor 488 C5 Maleimide | Thermo Fisher | A10254 | |
| Chemical compound, drug | Alexa Fluor 594 C5 Maleimide | Thermo Fisher | A10256 | |
| Chemical compound, drug | Alexa Fluor 647 C2 Maleimide | Thermo Fisher | A20347 | |
| Chemical compound, drug | Antifoam Y-40 emulsion | Sigma | A5758 | |
| Chemical compound, drug | EDTA-free Sigmafast protease inhibitor cocktail tablet | Sigma | S8830 | |
| Chemical compound, drug | DOPC | Avanti polar lipids | 850375C | |
| Chemical compound, drug | DOPE-Biotin | Avanti polar lipids | 850149P | |
| Chemical compound, drug | Biotin-14-dCTP | Thermo Fisher | 19518018 | |
| Chemical compound, drug | Biotin-16-dUTP | Roche | 11093070910 | |
| Chemical compound, drug | Digoxigenin-11-dUTP | Roche | 11093088910 | |
| Commercial assay or kit | EnzChek Phosphate assay kit | Thermo Fisher | E6646 | |
| Software, algorithm | Prism 8 | GraphPad | Prism 8 | Used for curve fitting, and fitting parameters and their error estimation. |
| Software, algorithm | Igro Pro 7 | Wavemetrics | Igro Pro | Used for single molecule data analysis. |
| Software, algorithm | LabVIEW | National Instruments | LabView NXG Full | Used for instrumental control in single molecule experiments. |
| Software, algorithm | Metamorph 7 | Molecular Devices | Metamorph 7 | Used for TIRF michroscope data acquisition. |
| Software, algorithm | ImageJ/Fiji | National Institutes of Health | ImageJ | Used for TIRF michroscope image analysis. |
| Other (Instrument) | Prism type TIRF microscope | In house Ivanov and Mizuuchi, 2010; Vecchiarelli et al., 2013 | Used for ParAF-ParBF complex assembly-disassembly experiments. | |
| Other (Instrument) | Magnetic tweezers | In house Seol and Neuman, 2011 and Seol et al., 2016 | Used for taking single molecule measurements of enzyme binding on 5 kb DNA. | |
| Other (Instrument) | Plate reader | BMG Labtech | Clariostar Plus | Used for FRET-based ParBF dimerization KD and CTP hydrolysis assays using EnzChek Phosphate assay kit |
Plasmids and constructs for protein expression
Request a detailed protocolAll expression open-reading frames were synthesized and subcloned into pET11a (Genscript). ParAF, ParAF-eGFP, ParBF, ParBFR121, ParBF1-42-mCherry, ParBF1-42 R36A-mCherry, and ParBF1-42-mCherry-EcoRIE111Q constructs were made with a hexa-histidine tag on their C-terminus. Protein fusions were made with a SGGG linker between fused domains, with exception of ParBF1-42-mCherry-EcoRIE111Q, which had a 4× (SGGG) linker between ParBF1-42 and mCherry. ParBF1-42 and ParBF1-42 R36A were synthesized de novo (Genscript).
Oligonucleotides
The 24 bp double-stranded DNA fragments containing the parSF consensus sequence and a scrambled sequence used in this study were as follows: 5'-AGT CTG GGA CCA CGG TCC CAC TCG; 5' -AGT CTG CAG CTA CTA TAC CAC TCG, respectively, and their complements. The fluorescently labeled parSF substrate was synthesized with Alexa-488 NHS coupled with the 5' of the forward strand by the manufacturer (IDT).
Protein purification and fluorescent labeling
Request a detailed protocolFor expression of proteins 5 ml of an overnight culture of BL21 DE3 AI (Invitrogen), E. coli cells transformed with the desired plasmid were inoculated into 500 ml Terrific Broth (Teknova) supplemented with 100 μg/ml carbenicillin, antifoam Y-40 emulsion (Sigma), 1 g/l NaCl, 0.7 g/l Na2SO4, 2.6 g/l NH4Cl, and 0.24 g/l MgSO4. The cultures were incubated at 37°C in 2.5 l Fernbach flasks and shaken at 120 rpm until they reached an OD600 of 1.8. Cultures were chilled on ice before they were induced by the addition of 1 mM IPTG and 0.2% l-arabinose. Following induction, cultures were incubated at 16°C for 16 hr, and cells were harvested by centrifugation at 6000 × g for 15 min at 4°C. Cell pellets were frozen in liquid nitrogen and stored at −80°C.
Frozen cells were thawed and resuspended to a density of 1 g cell pellet/10 ml in lysis buffer (ParAF, ParAF-eGFP, and ParBF1-42-mCherry-EcoRIE111Q: 25 mM Tris–HCl pH 8, 1 M NaCl, 20 mM imidazole, 2 mM β-mercaptoethanol, 10% glycerol; ParBF and ParBFR121A: 10 mM Sodium Phosphate buffer pH 7, 1 M NaCl, 20 mM Imidazole, 2 mM β-mercaptoethanol, 10% glycerol; ParBF1-42-mCherry and ParBF1-42/R36A-mCherry: 25 mM HEPES.KOH pH 7.5, 150 mM NaCl, 6 M guanidinium chloride, 20 mM Imidazole, 2 mM β-mercaptoethanol, 10% glycerol) containing EDTA-free Sigmafast protease inhibitor cocktail tablet (Sigma) using a homogenizer. Lysozyme and benzonase (Sigma) were added to a concentration of 1 mg/ml and 50 u/ml, respectively, and the cells were lysed via a microfluidizer. Cell debris were pelleted by centrifugation at 142,000 × g for 45 min at 4°C, and the supernatant passed through a 0.22 μm filter.
Lysate was loaded on to a 5 ml HisTrap HP cassette (GE Healthcare) equilibrated in lysis buffer. The cassette was then washed with 10 column volumes of lysis buffer followed by 10 column volumes HisTrap buffer (as lysis buffer without guanidinium hydrochloride and with the following NaCl concentrations: ParAF proteins, 200 mM; ParBF proteins, 150 mM), and the protein eluted with a gradient from 20 to 500 mM imidazole over 10 column volumes using an AKTA Pure (GE Healthcare).
All proteins except ParBF1-42-mCherry and ParBF1-42 R36A-mCherry were then subjected to ion-exchange chromatography. The peak fractions from the HisTrap column were pooled and slowly diluted whilst stirring with a Mono Q/S-buffer (as lysis buffer without imidazole or NaCl, but with 0.1 mM EDTA pH 8) until the conductivity of the sample was as follows: 18 mS/cm for ParAF proteins, 5 mS/cm for ParBF1-42-mCherry-EcoRIE111Q, and 15 mS/cm for all other ParBF proteins. The conductivity of the samples was monitored using a conductivity meter (Hanna). The sample was loaded onto either a 1 ml Mono Q (ParAF proteins and ParBF1-42-mCherry-EcoRIE111Q) or Mono S (other ParBF proteins) 5/50 GL ion exchange column (GE Healthcare) pre-equilibrated with Mono Q/S-buffer containing a NaCl concentration to match the conductivity of the sample. The column was then washed with 10 column volumes of Mono Q/S-buffer + NaCl. The protein was eluted with a gradient up to 500 mM NaCl over 10 column volumes.
Finally, all protein samples were purified by size-exclusion chromatography. The peak fractions from the previous column were pooled and diluted 50:50 with concentration buffer (25 mM HEPES.KOH pH 7.5, 2 M NaCl, 2 mM β-mercaptoethanol, 10% glycerol) and concentrated to ~2 ml using a Centriprep 10 kDa spin concentrator (Millipore). The sample was then injected onto an S200 16/600 size exclusion column (GE Healthcare) pre-equilibrated in gel filtration buffer (25 mM HEPES-KOH pH 7.5, 0.1 mM EDTA pH 8, 0.5 mM TCEP and 10% glycerol with 600 mM KCl for ParAF proteins and 150 mM KCl for ParBF proteins). Peak fractions were then pooled and concentrated to ~100 µM (~5–10 mg/ml) as determined by UV 280 nm absorbance before being aliquoted, frozen in liquid nitrogen, and stored at –80°C. Protein aliquots were used once and not subjected to freeze-thaw cycles.
To produce fluorescently labeled ParBF and ParBF R121A, ParBF protein was buffer exchanged into gel filtration buffer without reducing agent and incubated with a twofold molar excess of Alexa Fluor 647 C2 Maleimide (Thermo Fisher) for 30 min at room temperature. The reaction was then quenched by the addition of DTT to a final concentration of 10 mM. The protein solution was then filtered through a 0.22 μm filter and free dye removed by buffer exchange into gel filtration buffer in Amicon ultra 10 kDa spin concentrator (Millipore). The extent of labeling was estimated based on absorbance at 280 and 647 nm.
Assaying contaminating activities in the protein preparations
Request a detailed protocolProteins purified by the above protocol had no significant DNA endonuclease activity. After 16 hr incubation of supercoiled pBR322 with 2 µM ParAF and/or 10 µM ParBF at 37°C in ATPase buffer (see below), no linear DNA was observed and less than 10% of the supercoiled plasmid was converted to a nicked-circular form. The contaminating ATPase activity for all ParBF proteins was less than 2 mol ATP per mol ParBF per hour, as determined by the ATPase assay protocol detailed below.
ATPase activity assays
Request a detailed protocolSteady-state ATPase activity was measured as described (Vecchiarelli et al., 2016) with modifications. ATP to be used for ATPase activity assays was purified after diluting 20 μCi ATP γ-P32 (Perkin-Elmer) in 100 µl of 100 mM unlabeled ATP (Sigma) by passing through a 3 ml P2 resin size-exclusion column equilibrated with a buffer containing 50 mM HEPES·KOH pH 7.5, 150 mM KCl, and 0.1 mM EDTA. The purity of fractions was determined by TLC. One microliter of each fraction was spotted on to a 10 × 8 cm piece of TLC PEI Cellulose F paper (Millipore) 1 cm above the bottom of the paper and developed for 10 min using 400 mM NaH2PO4 pH 3.6 as the solvent. The fractions containing the minimum contamination of P32-Pi were pooled and their concentration determined by spectrometry before storage at −20°C.
ParAF ATPase activity was measured in the presence of the combinations and concentrations of proteins and DNA cofactors specified in the main text in ATPase buffer (50 mM HEPES·KOH pH 7.5, 150 mM KCl, 5 mM MgCl2, 0.5 mM TCEP, and 1 mM ATP γ-P32). Reactions were incubated at 37°C for 4 hr and stopped by the addition of an equal volume of 1 M formic acid. The increase of P32-Pi was measured by TLC using PEI Cellulose F paper as detailed above.
ParBF NTPase activity assays
Request a detailed protocolSteady-state ParBF CTPase activity was measured in CTPase buffer containing 50 mM Tris–HCl pH 7.5, 100 mM NaCl, 2 mM MgCl2, 1 mM DTT, 100 μg/ml BSA, 200 μM MESG (EnzChek probe), 1 U/ml of purine nucleotide phosphorylase, and ParBF, parSF DNA, and CTP at concentrations specified in the figure, following the protocol of the supplier of the EnzChek phosphate assay kit (ThermoFisher). Reactions were typically repeated three times using 96-well microtiter plates and the 360 nm absorption signal increase was monitored at 0.5–1 min intervals using Clariostar Plus plate reader (BMG Labtech). The absorption signal increase after subtraction of background time course in the absence of enzyme was converted to released Pi concentration increase based on phosphate titration measurements. The CTP hydrolysis rate was calculated from the initial slope of the time course curve, which typically started after ~7 min deadtime for the plate setting up. Substrate specificity was examined comparing Pi release from four ribonucleoside triphosphates. Attempt to examine inhibition of the CTPase activity by CDP or to detect CDP binding to ParBF was postponed when the CDP used in this study was found to release Pi upon incubation with ParBF. CDP obtained from two additional suppliers also generated similar quantities of Pi upon incubation with ParBF.
TIRF microscopy
Request a detailed protocolThe general design of the TIRF microscopy setup was essentially as previously described (Ivanov and Mizuuchi, 2010; Vecchiarelli et al., 2013). A prism-type TIRFM system was built around an Eclipse Ti microscope (Nikon) with a 40× objective (S Fluor, 40×/1.30 oil, Nikon) and two-color images captured by an Andor DU-897E camera through a dxcr630 insert DualView (Photometrics) with the following settings: 3 MHz digitizer (gray scale); 5.2 pre-amplifier gain, 2 MHz vertical shift speed; +one vertical clock range; electron-multiplying gain 30; EM CCD temperature set at −90°C; baseline clamp ON; and exposure time 100 ms.
The excitation for ParAF-eGFP and Alexa647-ParBF were provided by a 488 nm diode-pumped solid-state laser (Sapphire, Coherent) and a 633 nM HeNe laser (Research Electro-Optics), respectively. The TIRF illumination had an elliptical Gaussian shape in the field of view therefore intensity data for DNA-carpet-bound ParAF-eGFP and Alexa647-ParBF signals were taken at or near the middle of the illumination profile.
Movies were acquired using Metamorph 7 (Molecular Devices) and transferred to ImageJ (National Institutes of Health) for analysis.
Flow cells were assembled using fused silica microscope slides with pre-drilled inlet/outlet ports (Esco products), #1 glass cover slips (24 × 50 mm, Thermo Fisher) and 0.001’-thick acrylic transfer tape (3M). The fused silica slide was cleaned by soaking overnight in a solution of Nochromix (Sigma)-sulfuric acid, followed by extensive rinsing with de-ionized water, drying by blowing nitrogen gas, followed by oxygen plasma treatment (South Bay Technology Inc). The Y-shaped flow path pattern was cut out of the transfer tape using a laser cutter before the flow cell assembly. Nanoports (Idex) were attached to the fused silica slide for the inlet and outlet tube connections using Norland Optical Adhesive (Thorlabs), cured by 365 nm UV light. The assembled flow cells were then baked at 80°C with gentle compression for 2 hr.
To assemble a DNA-carpet in a flow cell, small unilamellar vesicles (SUVs) of 1,2-dioleoyl-sn-glycero-3-phosphocholine (DOPC) and 1,2-dioleoyl-sn-glycero-3-phosphoethanolamine-N-(biotinyl) (DOPE-Biotin) (Avanti Polar Lipids) were prepared as follows. 0.5 ml of DOPC (25 mg/ml chloroform) was mixed with 5 μl of DOPE-biotin (25 mg/ml chloroform) in a glass test tube and most of the solvent removed via evaporation under a nitrogen flow. The remaining solvent was removed by drying in a SpeedVac (Savant) at 42°C for 1 hr followed by a further 1 hr at room temperature. 2.5 ml of degassed TK150 buffer (25 mM Tris–HCl pH 7.5, 150 mM KCl) was then added, and the lipids stored and covered under nitrogen gas overnight. The lipids were then resuspended by vortexing and sonicated (70–80 watts, 30 s on, 10 s off) in a cup horn with water chiller set to 16°C (QSonica) until transparent. The resulting solution of SUVs was then filtered through a 0.22 μm filter, aliquoted, and stored under nitrogen gas at 4°C for up to 4 weeks.
To prepare biotinylated salmon sperm DNA for DNA-carpets 10 mg/ml salmon sperm DNA (Thermo Fisher) was sonicated for 5 min (110 watts, 10 s on, 10 s off) to produce short fragments. Sonicated salmon sperm DNA was then diluted to 1 mg/ml in Terminal Transferase buffer (NEB) with 0.25 mM CoCl2, 40 μM Biotin-14-dCTP (Thermo Fisher), and 1 unit/μl Terminal Transferase (NEB). The DNA was incubated at 37°C for 30 min, and then the reaction stopped by heat inactivation at 75°C for 20 min. Free Biotin-14-dCTP was removed by extensive buffer exchange with TE buffer (10 mM Tris–HCl pH 8, 0.1 mM EDTA) in a 100 kDa Amicon Ultra spin concentrator (Millipore). The biotinylated DNA was then concentrated to ~10 mg/ml and stored at −20°C until needed.
To assemble a DNA-carpet, the DOPC–DOPE-biotin SUV solution was diluted to 1 mg/ml in 500 μl degassed TN150MC buffer (25 mM Tris–HCl pH7.5, 150 mM NaCl, 5 mM MgCl2, 0.1 mM CaCl2) and warmed to 37°C. Approximately 300 μl of SUV solution was then infused into a pre-warmed flow cell and incubated at 37°C for 1 hr. Excess SUVs were washed out with 500 μl warmed, degassed TN150MC buffer at 100 μl/min. 300 μl of a solution of 1 mg/ml neutravidin (Thermo Fisher) in warmed, degassed TN150MC buffer was then infused at a rate of 100 μl/min into the flow cell and incubated at 37°C for 30 min. Excess neutravidin was washed out with TN150MC buffer as above, and the flow cell infused with 100 μl of a solution containing 1 mg/ml biotinylated sonicated salmon sperm DNA (as prepared above) in warmed, degassed TN150MC buffer, and incubated at 37°C for 30 min. The ports of the flow cell were sealed with parafilm and stored at 4°C for up to a week.
Prior to use, excess DNA was removed by infusion of 300 μl 0.22 μm filtered and degassed TIRFM buffer (50 mM HEPES–KOH pH 7.5, 300 mM K-glutamate, 50 mM NaCl, 10 mM MgCl2, 0.1 mM CaCl2, 2 mM DTT, 0.1 mg/ml α-casein, 0.6 mg/ml ascorbic acid, 10% glycerol) with addition of 1 mg/ml α-casein and 1 mM ATPγS and the flow cell incubated at room temperature for 30 min.
Conversion of the fluorescence signal detected in TIRF microscopy to the DNA-carpet-bound protein densities was done following the procedure described in the legend of Figure 2—figure supplement 4 in Vecchiarelli et al., 2016.
Fluorescence recovery after photobleaching (FRAP)
Request a detailed protocolFor FRAP experiments, 488 nm solid-state and 630 nm diode lasers were focused to the back focal plane of the objective through an appropriate dichroic mirror (Di01-R405/488/561/635-25x36, Semrock) through the objective lens to illuminate a ~5 or ~10 μm (for 488 nm or 630 nm, respectively) diameter spot in the center of the sample area. The laser power was adjusted for ~80% bleaching with 5 s exposure for the eGFP or Alexa 647 signals, and four cycles of bleaching/recovery were recorded for each sample and averaged.
Magnetic tweezers-based DNA condensation assay
Request a detailed protocolThe magnetic tweezers setup and assays conducted with it were performed as previously described (Seol and Neuman, 2011; Seol et al., 2016).
The ability of ParBF to condense parSF-containing DNA (spDNA) was tested by a custom-built magnetic tweezers setup. In brief, two permanent magnets were used to apply force to micron-sized magnetic beads individually tethered to the coverslip of a one inlet flow cell by 5 kb pET28a plasmid-derived DNA tethers. The distance the magnets were held from the beads, and hence the force exerted upon them was controlled by a linear motor that vertically positions the magnets.
Five kilo-base DNA substrates were generated by PCR using either pET28a-parSF plasmid (for parSF-containing DNA) or pET28a as templates. pET28-parSF DNA plasmid was generated by cloning 570 bp DNA segment containing 12 repeats of parSF native sequence from F-plasmid into pET28a between the BamHI and SphI restriction sites.
Primers used for the PCR contained an extra non-complementary 15 nt at their 5' ends to encode BsaI restriction sites. The PCR yields a 5.2 kb product incorporating two BsaI restriction sites at its termini. Digestion of this product was followed by ligation with 500 bp DNA ‘handles’ containing either multiple biotin or digitoxin labels. These handles were also generated by Taq-based PCR using pBlueScript II KS as the template, pBlueScript II KS forward (5'- GCT GGG TCT CGG TTG TTC CCT TTA GTG AGG GTT AAT TG) and pBlueScript II KS reverse (5'- GCT GGG TCT CGT GGT TTC CCT TTA GTG AGG GTT AAT TG) primers and either 60 µM biotin-16-dUTP or digoxigenin-11-dUTP (Roche). This results in a 5 kb DNA tether, which can be attached to a streptavidin-coated magnetic bead at one end and an anti-digoxigenin coverslip surface at the other.
ParBF samples were prepared in modified ATPase buffer (50 mM HEPES.KOH pH 7.5, 100 mM KCl, 5 mM MgCl2, 2 mM DTT, 10 mg/ml BSA, and 0.1% Tween-20) and infused into a flow cell containing tethered magnetic beads held at 5 pN of force. After the chamber was filled, the flow was stopped, and the force reduced to 0.05 pN. The height of beads was tracked by analysis of diffraction rings generated by illumination of the beads from above and observed with an objective positioned below the flow cell. The extent of condensation by ParB was monitored by the decrease in the height of the beads at 0.05 and 5 pN as compared to controls without protein.
Data availability
All data generated or analysed during this study are included in the manuscript and supporting files. Source data files have been provided for all relevant figures.
References
-
Dual role of DNA in regulating ATP hydrolysis by the SopA partition proteinJournal of Biological Chemistry 284:30067–30075.https://doi.org/10.1074/jbc.M109.044800
-
Plasmid partition mechanismsMicrobiology Spectrum 2:1.https://doi.org/10.1128/microbiolspec.PLAS-0023-2014
-
Stoichiometry of P1 plasmid partition complexesJournal of Biological Chemistry 275:8213–8219.https://doi.org/10.1074/jbc.275.11.8213
-
The P1 plasmid partition protein ParA. A role for ATP in site-specific DNA bindingJournal of Biological Chemistry 269:29908–29913.https://doi.org/10.1016/S0021-9258(18)43967-1
-
Biochemical activities of the parA partition protein of the P1 plasmidMolecular Microbiology 6:1141–1147.https://doi.org/10.1111/j.1365-2958.1992.tb01552.x
-
ParB spreading requires DNA bridgingGenes & Development 28:1228–1238.https://doi.org/10.1101/gad.242206.114
-
Twelve 43-base-pair repeats map in a cis-acting region essential for partition of plasmid mini-FJournal of Bacteriology 165:1043–1045.https://doi.org/10.1128/jb.165.3.1043-1045.1986
-
Brownian ratchet mechanism for faithful segregation of Low-Copy-Number plasmidsBiophysical Journal 112:1489–1502.https://doi.org/10.1016/j.bpj.2017.02.039
-
Bacterial partition complexes segregate within the volume of the nucleoidNature Communications 7:12107.https://doi.org/10.1038/ncomms12107
-
The ParA/MinD family puts things in their placeTrends in Microbiology 20:411–418.https://doi.org/10.1016/j.tim.2012.05.002
-
A three-dimensional ParF meshwork assembles through the nucleoid to mediate plasmid segregationNucleic Acids Research 45:3158–3171.https://doi.org/10.1093/nar/gkw1302
-
EcoRI endonuclease. Physical and catalytic properties of the homogenous enzymeJournal of Biological Chemistry 251:5866–5874.https://doi.org/10.1016/S0021-9258(17)33032-6
-
Purification and characterization of SopA and SopB proteins essential for F plasmid partitioningJournal of Biological Chemistry 264:15535–15541.https://doi.org/10.1016/S0021-9258(19)84863-9
-
A family of ATPases involved in active partitioning of diverse bacterial plasmidsMolecular Microbiology 4:1455–1463.https://doi.org/10.1111/j.1365-2958.1990.tb02056.x
-
Centromere binding specificity in assembly of the F plasmid partition complexNucleic Acids Research 39:7477–7486.https://doi.org/10.1093/nar/gkr457
-
Bidirectional replication from an internal ori site of the linear N15 plasmid prophageNucleic Acids Research 31:6552–6560.https://doi.org/10.1093/nar/gkg856
-
Insight into F plasmid DNA segregation revealed by structures of SopB and SopB-DNA complexesNucleic Acids Research 38:4514–4526.https://doi.org/10.1093/nar/gkq161
-
Magnetic tweezers for single-molecule manipulationMethods in Molecular Biology 783:265–293.https://doi.org/10.1007/978-1-61779-282-3_15
-
A network of Cis and trans interactions is required for ParB spreadingNucleic Acids Research 45:7106–7117.https://doi.org/10.1093/nar/gkx271
-
Specific and non-specific interactions of ParB with DNA: implications for chromosome segregationNucleic Acids Research 43:719–731.https://doi.org/10.1093/nar/gku1295
-
Surfing biological surfaces: exploiting the nucleoid for partition and transport in BacteriaMolecular Microbiology 86:513–523.https://doi.org/10.1111/mmi.12017
-
ATPase activity of SopA, a protein essential for active partitioning of F plasmidMolecular and General Genetics MGG 234:346–352.https://doi.org/10.1007/BF00538693
Article and author information
Author details
Funding
NIDDK (Intramural Research Fund)
- Kiyoshi Mizuuchi
NHLBI (Intramural Research Fund)
- Keir C Neuman
The funders had no role in study design, data collection and interpretation, or the decision to submit the work for publication.
Acknowledgements
We are grateful to helpful suggestions and discussion of our colleagues Barbara Funnell, David Lane, Michiyo Mizuuchi, Andrea Volante, Min Li, Masaki Osawa, William Carlquist, and Shannon Mckie, to Esme Neuman for help in preparation of Figures 1 and 7, and to Min Li for help in preparation of Figure 2—figure supplement 3. We thank Stephan Gruber and his colleagues for sharing their findings with us prior to publication. This work was supported by the intramural research fund for National Institute of Diabetes and Digestive and Kidney Diseases (KM), and the National Heart, Lung, and Blood Institute (KCN), National Institutes of Health, Department of Human Services.
Copyright
This is an open-access article, free of all copyright, and may be freely reproduced, distributed, transmitted, modified, built upon, or otherwise used by anyone for any lawful purpose. The work is made available under the Creative Commons CC0 public domain dedication.
Metrics
-
- 1,400
- views
-
- 175
- downloads
-
- 46
- citations
Views, downloads and citations are aggregated across all versions of this paper published by eLife.
Citations by DOI
-
- 46
- citations for umbrella DOI https://doi.org/10.7554/eLife.65651
Download links
A two-part list of links to download the article, or parts of the article, in various formats.
Downloads (link to download the article as PDF)
Open citations (links to open the citations from this article in various online reference manager services)
Cite this article (links to download the citations from this article in formats compatible with various reference manager tools)
CTP and parS coordinate ParB partition complex dynamics and ParA-ATPase activation for ParABS-mediated DNA partitioning
eLife 10:e65651.
https://doi.org/10.7554/eLife.65651


