Quantifying absolute gene expression profiles reveals distinct regulation of central carbon metabolism genes in yeast
- Department of Biology and Biological Engineering, Chalmers University of Technology, Sweden
- Novo Nordisk Foundation Center for Biosustainability, Chalmers University of Technology, Sweden
- Proteomics Core Facility, Sahlgrenska Academy, University of Gothenburg, Sweden
- Novo Nordisk Foundation Center for Biosustainability, Technical University of Denmark, Denmark
- BioInnovation Institute, Denmark
Figures
Figure 1 with 2 supplements
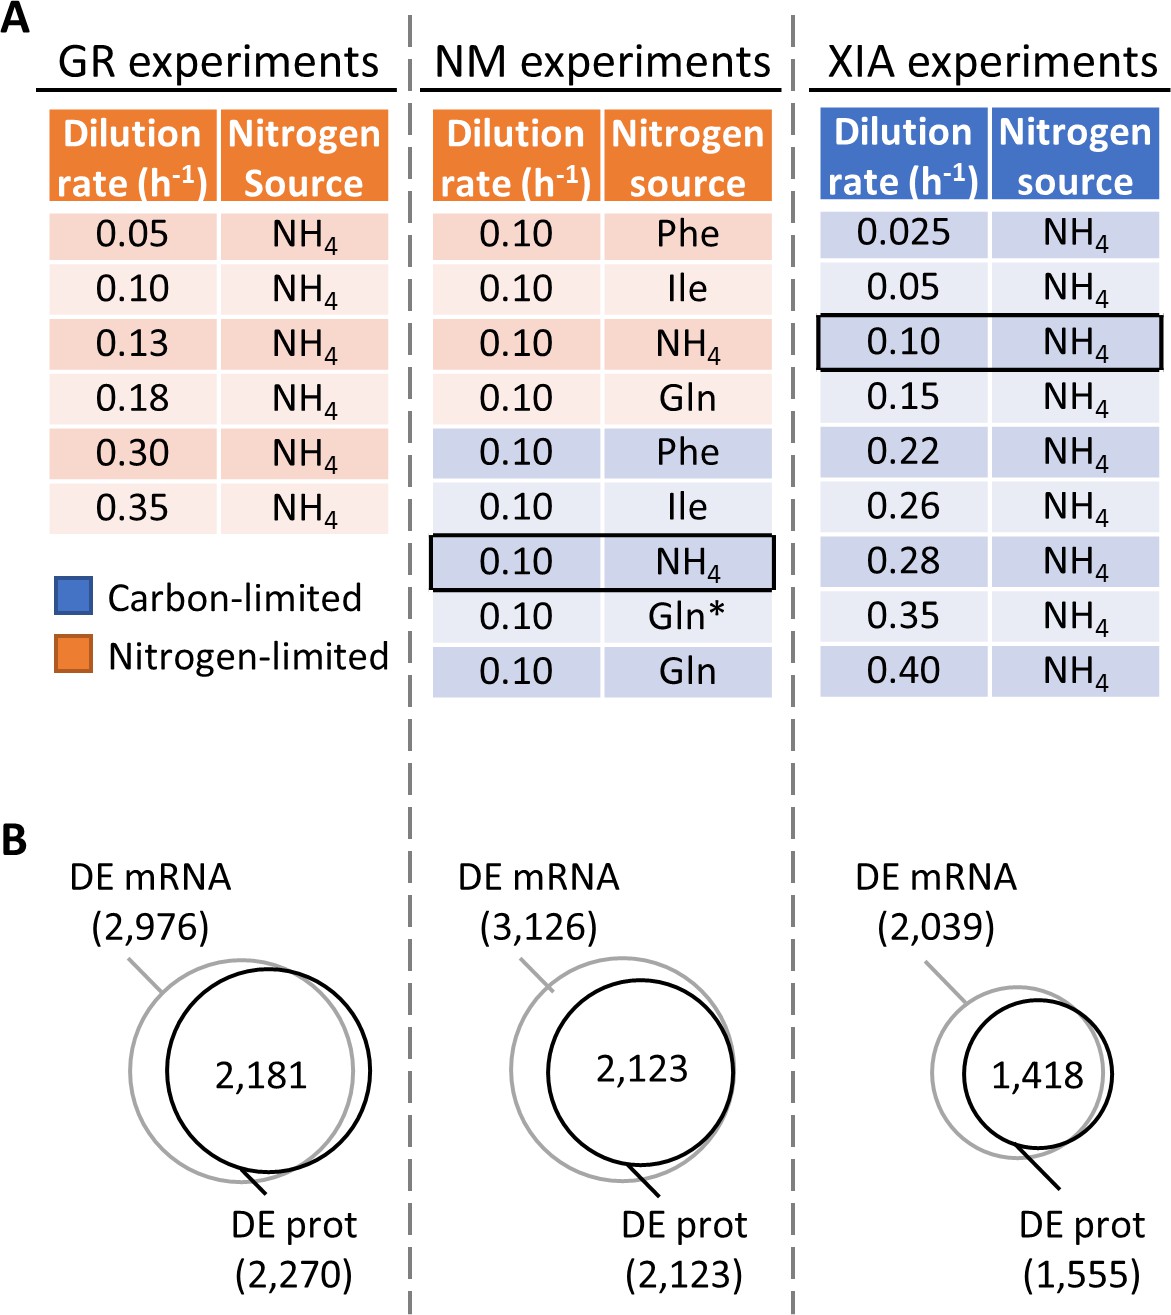
Regulation of gene expression by the physiological state of the cell.
(A) Experimental design to orthogonally probe the effects of growth rate and nitrogen metabolism on gene expression. Cells were grown in chemostats at controlled growth rates and media composition. GR, growth rate; NM, nitrogen metabolism; (Xia, 2019a; Xia, 2019b). In NM experiments, carbon-limited conditions (blue rows), the ‘Gln’ condition, and the ‘Gln*’ condition differ in the concentration of Gln and glucose in the chemostat feed media; see Supplementary file 1a for full details. Rows in black boxes represent a duplicated condition between the chemostats performed in this study and in Xia, 2019a; Xia, 2019b. (B) Number of differentially expressed (DE; FDR < 0.01 by one-way ANOVA) genes at mRNA and protein (prot) levels in the GR experiments, NM experiments, and XIA experiments, showing that a large number of genes are regulated by growth rate and nitrogen metabolism.
Figure 1—figure supplement 1
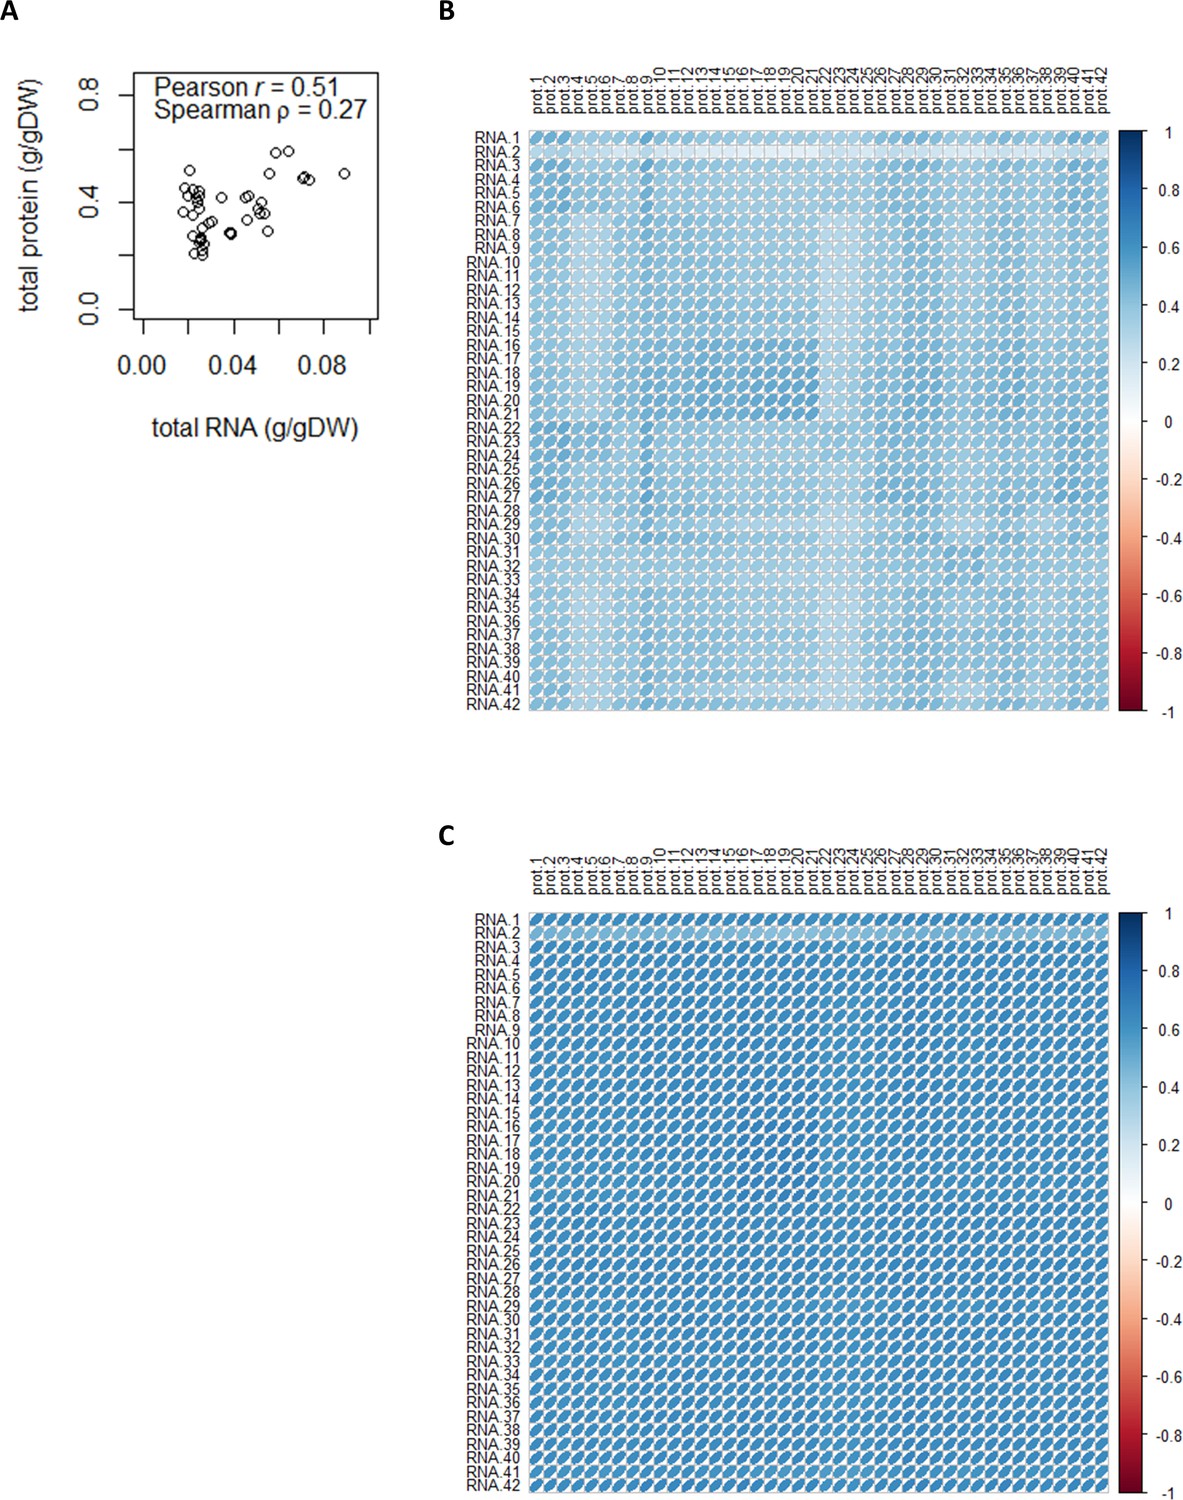
Total and sample-wise protein–mRNA correlations.
(A) Correlation between total protein content and total mRNA content (g/gDW). (B) Sample-wise proteome–transcriptome Pearson correlations. The median Pearson r is 0.40. See Supplementary file 1a for sample ID and full details of chemostat conditions. (C) Sample-wise proteome–transcriptome Spearman correlations. The median Spearman ρ is 0.63. See Supplementary file 1a for sample ID and full details of chemostat conditions.
Figure 1—figure supplement 2

Measured absolute quantity of proteins and transcripts for subunits of protein complexes.
(A) Measured absolute quantities of proteins (pink) and transcripts (blue) for ribosome. The abundance of pairs of paralogs (e.g. RPS14A and RPS14B) are summed. (B) Measured absolute quantities of proteins (pink) and transcripts (blue) for proteasome. (C) Measured absolute quantities of proteins (pink) and transcripts (blue) for f1f0 ATP synthase. Shown are absolute abundance of the subunits after normalization to the stoichiometry (e.g. ATP1 and ATP2 are resent at three subunits per complex; the absolute abundance is therefore divided by 3). The protein abundance of ATP15 and TIM11 are ~4 orders of magnitude lower than the abundance of other subunits, likely reflecting the difficulty in extracting and quantifying membrane-embedded proteins. (D) Measured absolute quantities of proteins (pink) and transcripts (blue) for V-ATPase. Shown are absolute abundance of the subunits after normalization to the stoichiometry.
Figure 2 with 1 supplement
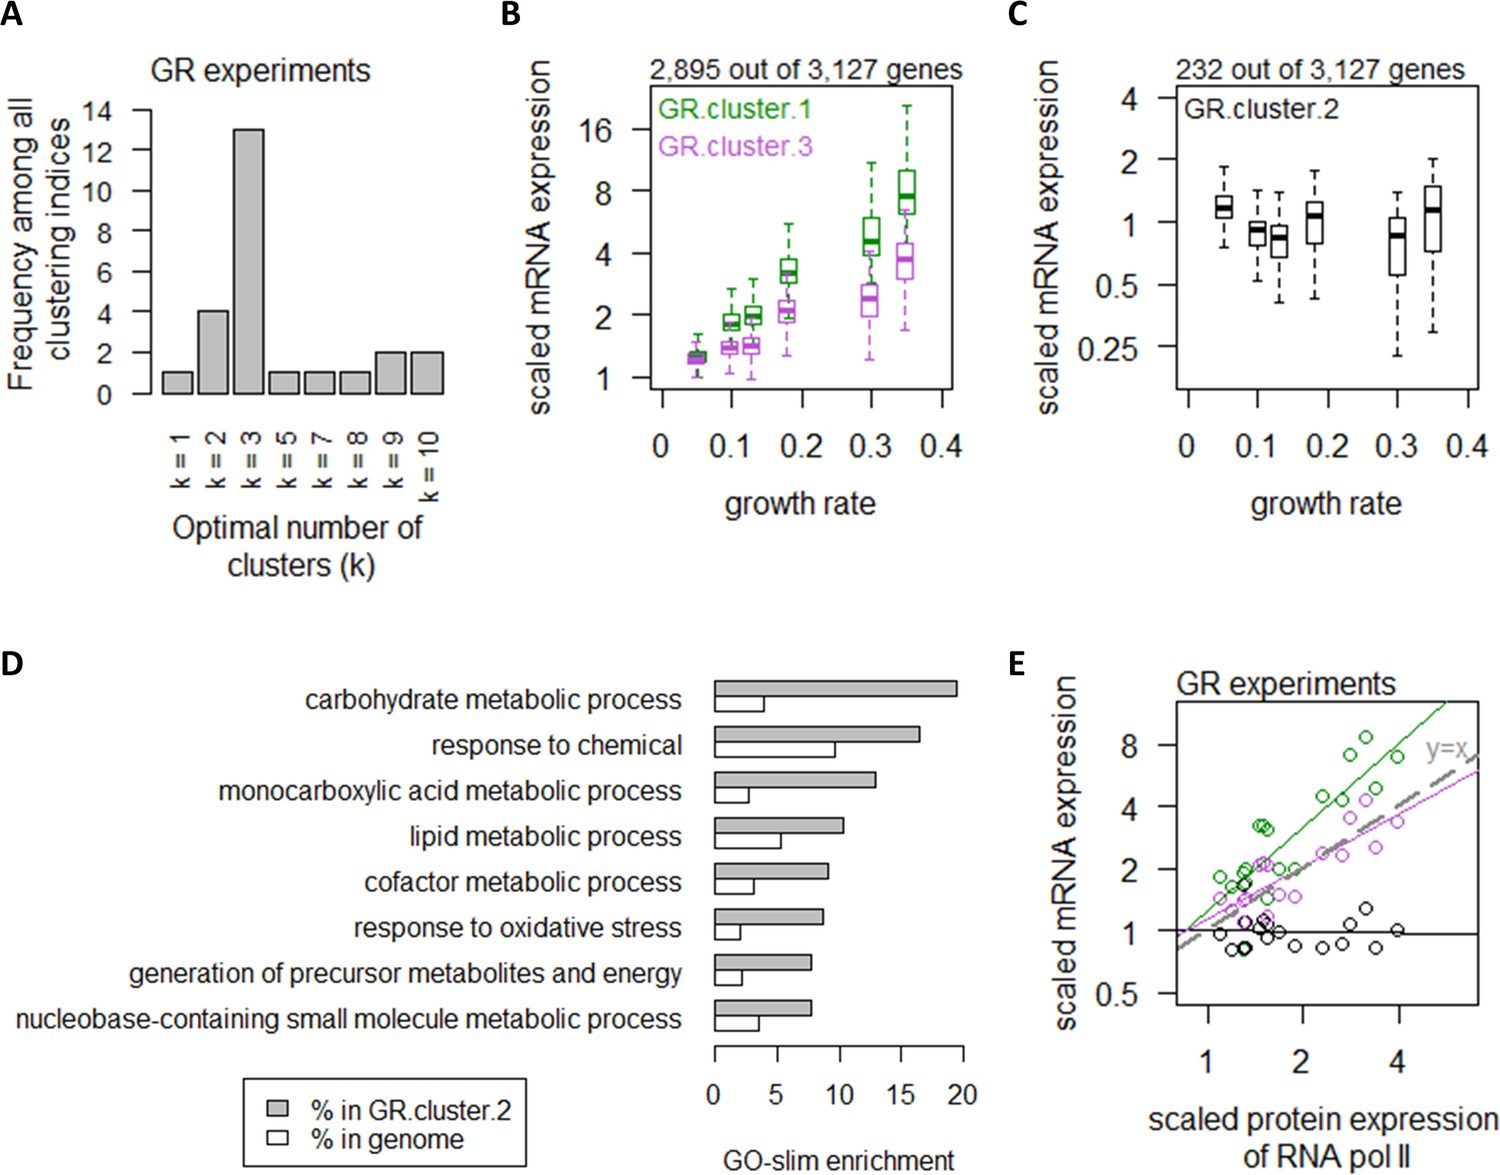
Growth rate regulates a large number of transcripts with exceptions in central carbon metabolism.
(A) Using 25 clustering indices, we found that most indices suggest an optimal number of three clusters for transcript abundance in the GR experiments. (B) Abundance of transcripts in GR.cluster.1 (green) and GR.cluster.3 (purple). Center line, median; box limits, upper and lower quartiles; whiskers, 1.5× interquartile range. (C) Abundance of transcripts in GR.cluster.2. Center line, median; box limits, upper and lower quartiles; whiskers, 1.5× interquartile range. (D) GO-slim enrichment of genes in GR.cluster.2 showing enrichment in GO-slim terms related to CCM, among others. (E) Expression of RNA polymerase II protein abundance and mRNA abundance of the three clusters in the GR experiments. Colors are as (B) and (C). Median mRNA expression values in each cluster and median protein expression of RNA polymerase II are shown. Gray dashed line represents y=x.
Figure 2—figure supplement 1
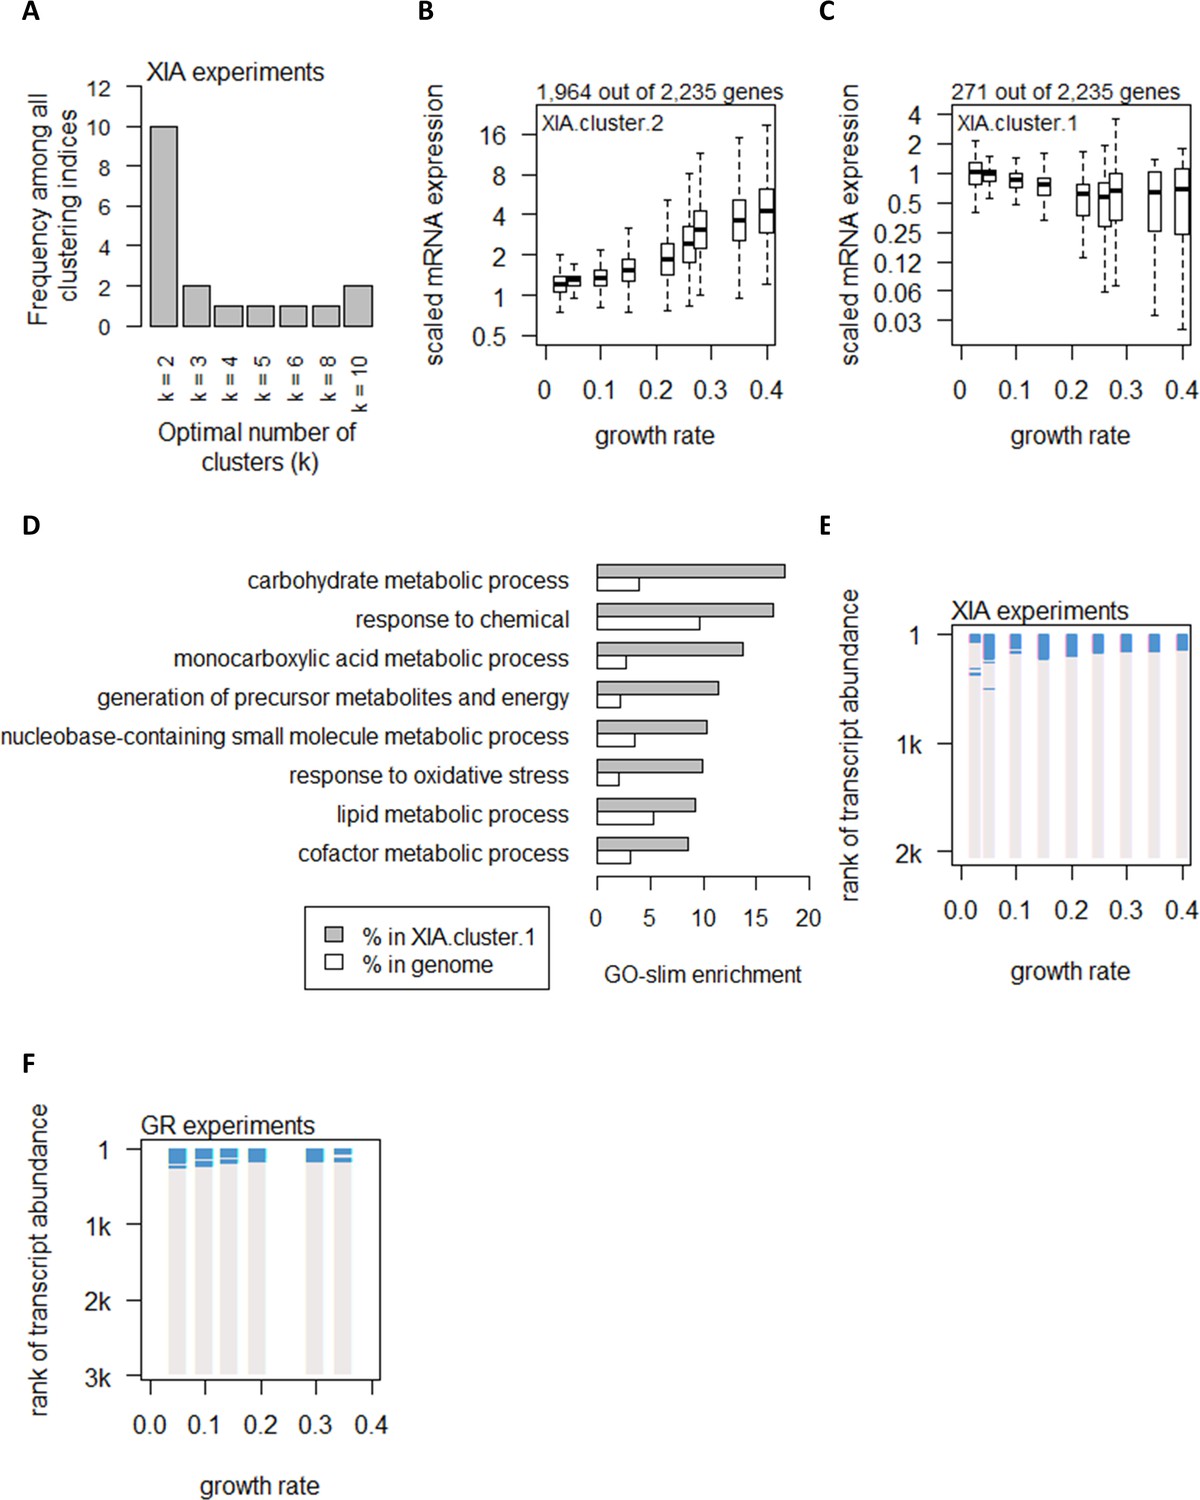
Global control of transcript abundance by growth rate.
(A) Using 25 clustering indices, we found that most indices suggest an optimal number of two clusters for transcript abundance in the XIA experiments. (B) Abundance of transcripts in XIA.cluster.2. Center line, median; box limits, upper and lower quartiles; whiskers, 1.5× interquartile range. (C) Abundance of transcripts in XIA.cluster.1. Details are as (B). (D) GO-slim enrichment of genes in XIA.cluster.1 showing enrichment in GO-slim terms related to CCM. (E) Enrichment of CCM genes in 200-gene sliding windows of increasing transcript abundance in the XIA experiments is shown by two-tailed Fisher’s exact test. Blue color indicates pFisher<0.05. (F) Enrichment of CCM genes in 200-gene sliding windows of increasing transcript abundance in the GR experiments. Details are as (E).
Figure 3 with 1 supplement
Growth rate regulates protein abundance in coordination with transcript abundance.
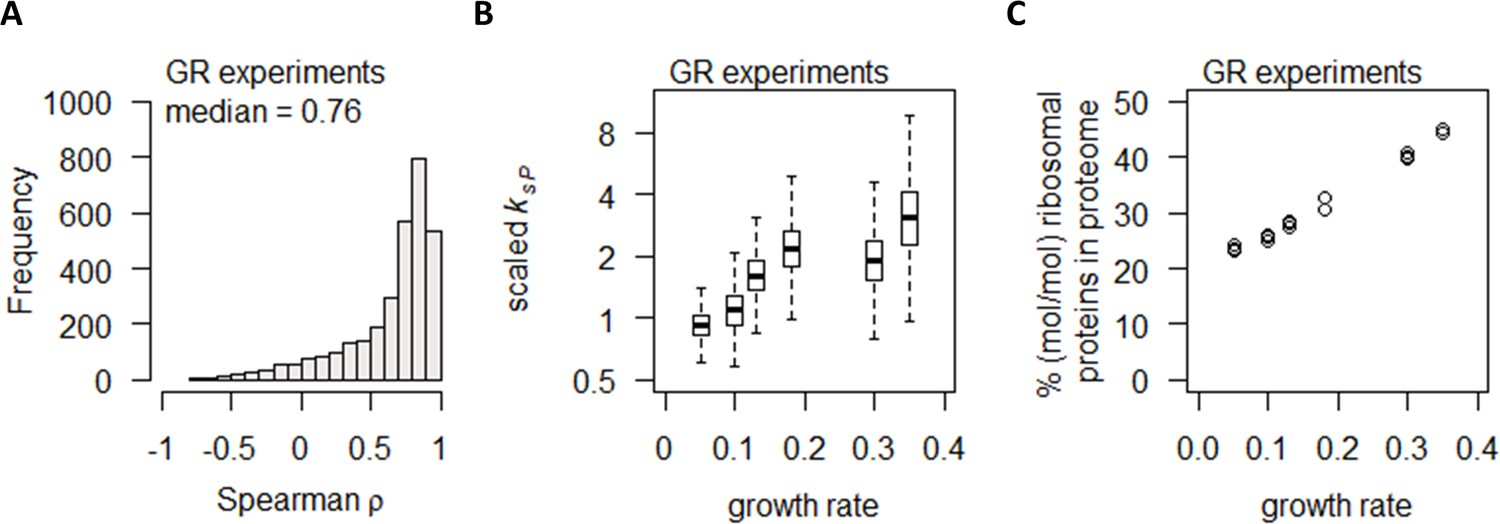
(A) Spearman correlation of absolute mRNA and protein abundances for each gene is calculated in the GR experiments, and the distribution is shown demonstrating overall high correlation. (B) Protein translation rate (ksP) in the GR experiments increases with growth rate by about fourfold. Center line, median; box limits, upper and lower quartiles; whiskers, 1.5× interquartile range. (C) Relative ribosomal protein abundance in the GR experiments was calculated as the sum of all detected ribosomal proteins and normalized to the total protein content, showing a linear increase with increasing growth rate.
Figure 3—figure supplement 1
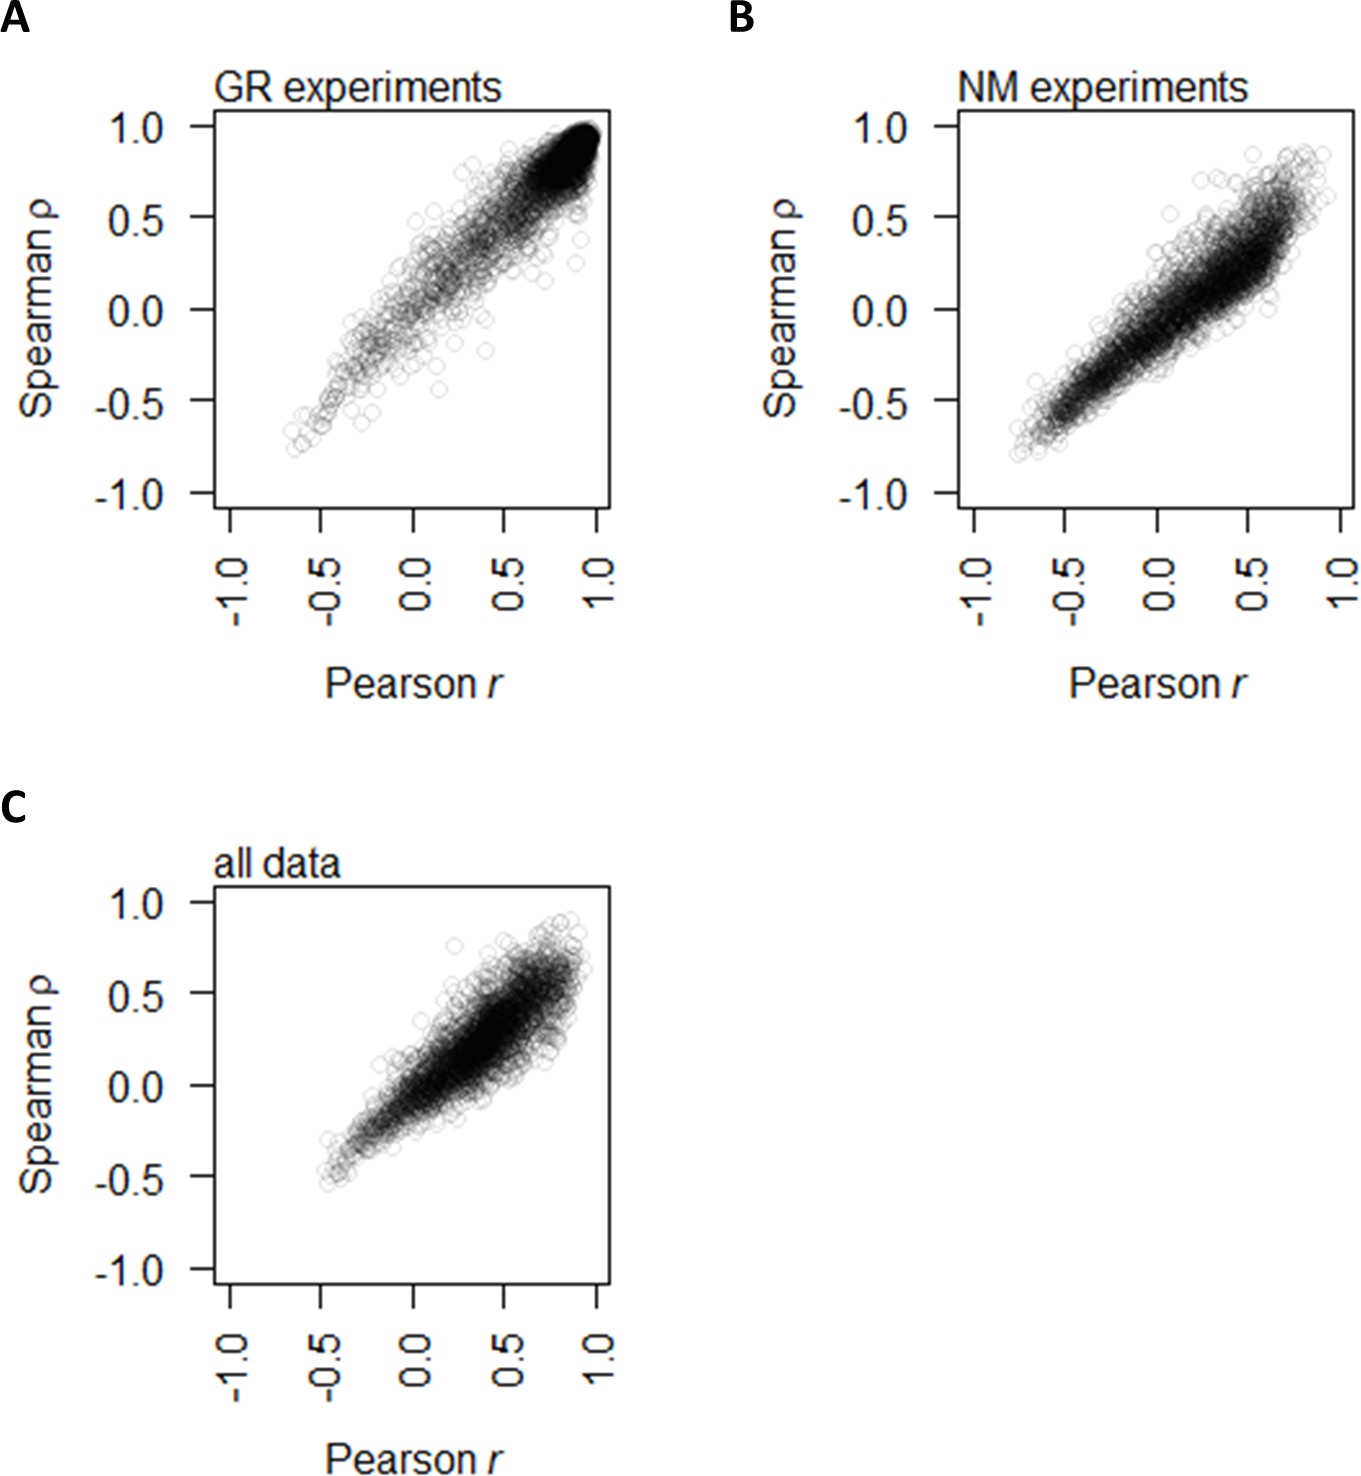
Correlation between protein and mRNA abundance for each gene showing that Spearman and Pearson correlations track well with each other.
This study uses Spearman correlations for analyses since the underlying data distribution is not always normal; however, previous literature used Pearson correlations. (A) Spearman ρ and Pearson r between protein and mRNA abundance for each gene in the GR experiments alone. (B) Spearman ρ and Pearson r between protein and mRNA abundance for each gene in the NM experiments alone. (C) Spearman ρ and Pearson r between protein and mRNA abundance for each gene with data from the two experiments combined.
Figure 4
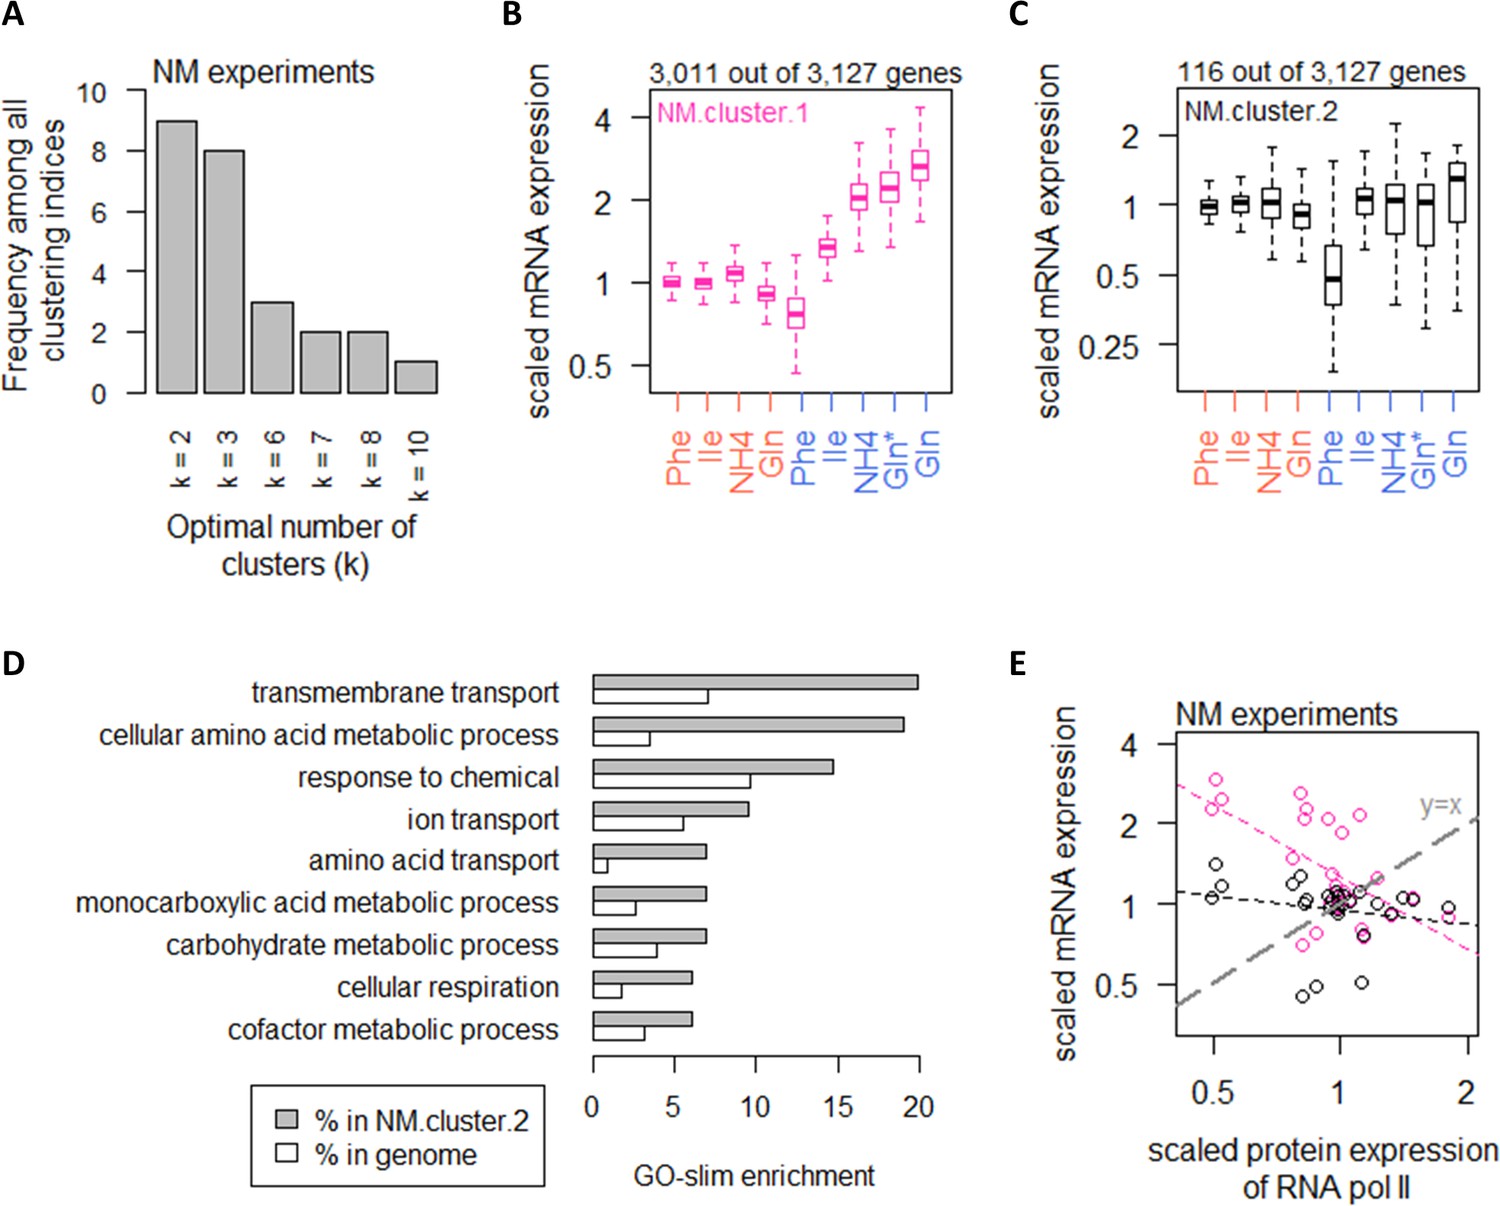
Nitrogen metabolism regulates a large number of transcripts with exceptions in CCM and amino acid metabolic processes.
(A) Using 25 clustering indices, we found that most indices suggest an optimal number of two clusters for transcript abundance in the NM experiments. (B) Abundance of transcripts in NM.cluster.1. Center line, median; box limits, upper and lower quartiles; whiskers, 1.5× interquartile range. In NM experiments, carbon-limited conditions (blue rows), the ‘Gln’ condition, and the ‘Gln*’ condition differ in the concentration of Gln and glucose in the chemostat feed media; see Supplementary file 1a for full details. (C) Abundance of transcripts in NM.cluster.2. Center line, median; box limits, upper and lower quartiles; whiskers, 1.5× interquartile range. In NM experiments, carbon-limited conditions (blue rows), the ‘Gln’ condition, and the ‘Gln*’ condition differ in the concentration of Gln and glucose in the chemostat feed media; see Supplementary file 1a for full details. (D) GO-slim enrichment of genes in NM.cluster.2 showing enrichment in GO-slim terms related to CCM, among others. (E) Expression of RNA polymerase II protein abundance and mRNA abundance of the two clusters in the NM experiments. Colors are as (B) and (C). Median mRNA expression values in each cluster and median protein expression of RNA polymerase II are shown. Gray dashed line represents y=x.
Figure 5
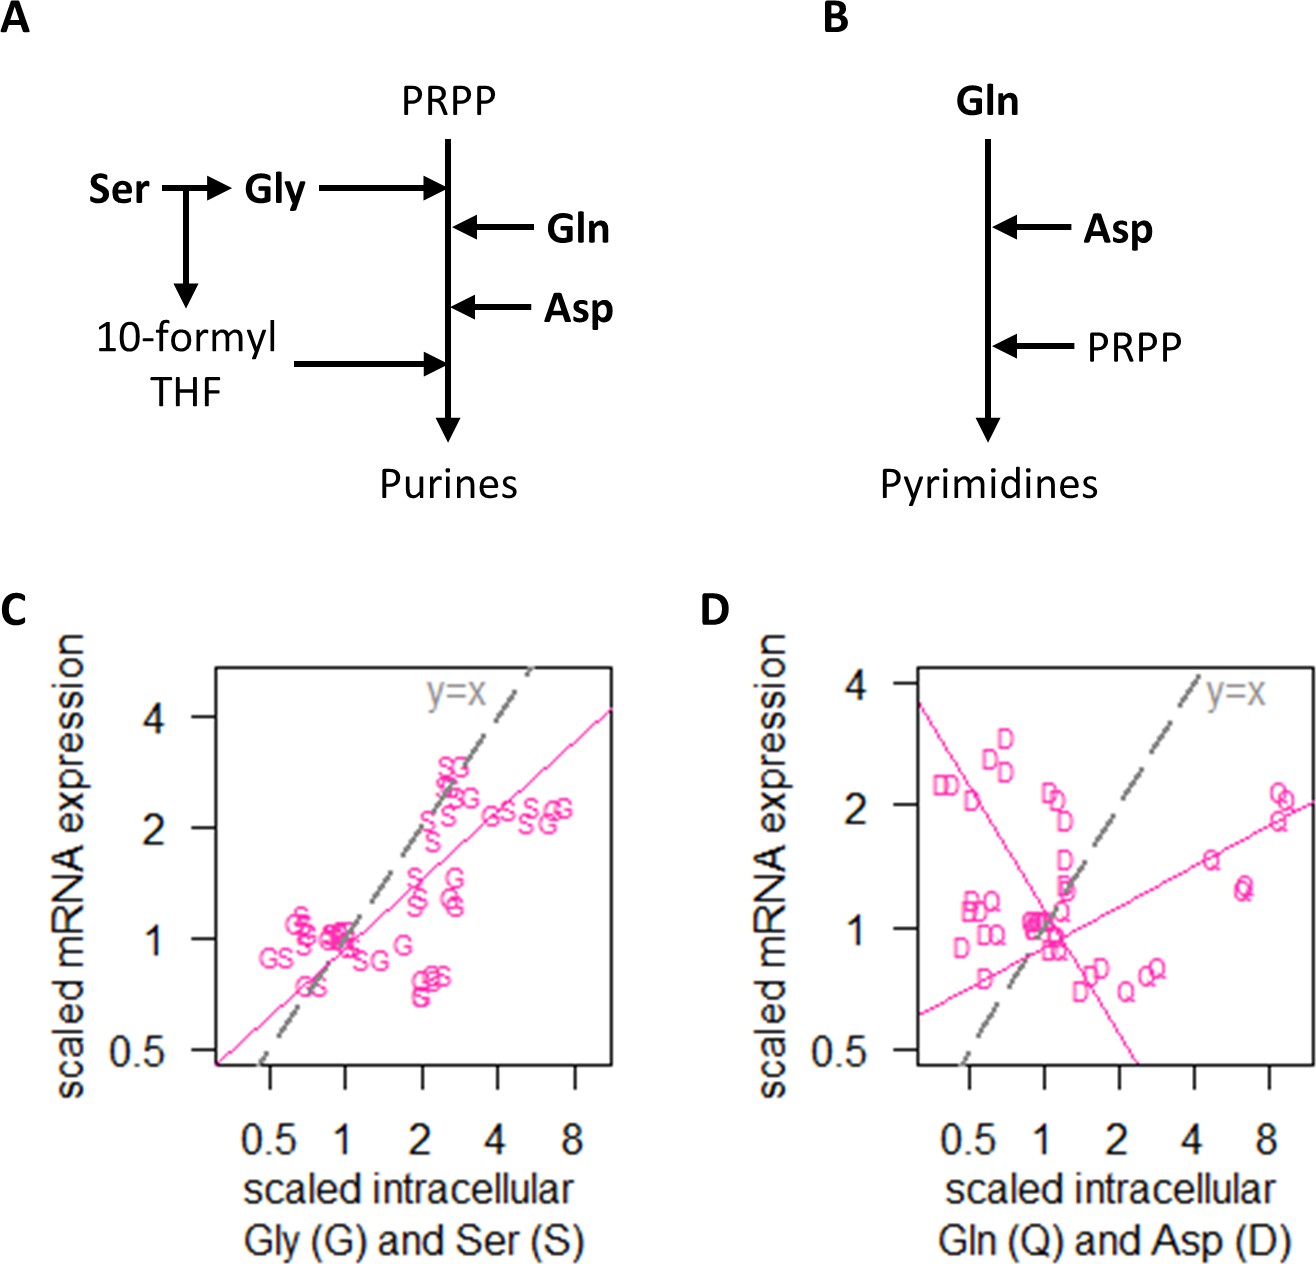
Regulation of transcript abundance by nitrogen metabolism hinges on Ser and Gly intracellular concentrations.
(A) Simplified pathway of purine synthesis showing dependencies on Ser, Gly, Gln, and Asp. (B) Simplified pathway of pyrimidine synthesis showing dependencies on Gln and Asp only. (C) Intracellular concentrations of Gly (G) and Ser (S), and RNA abundance of genes in NM.cluster.1, showing that transcript abundance in the NM experiments track closely with intracellular Ser and Gly concentrations. Median mRNA expression values of NM.cluster.1 are shown. (D) Intracellular concentrations of Gln (Q) and Asp (D), and RNA abundance of genes in NM.cluster.1, showing that transcript abundance for most genes in the NM experiments do not track with intracellular Gln and Asp concentrations. Median mRNA expression values of NM.cluster.1 are shown.
Figure 6 with 1 supplement
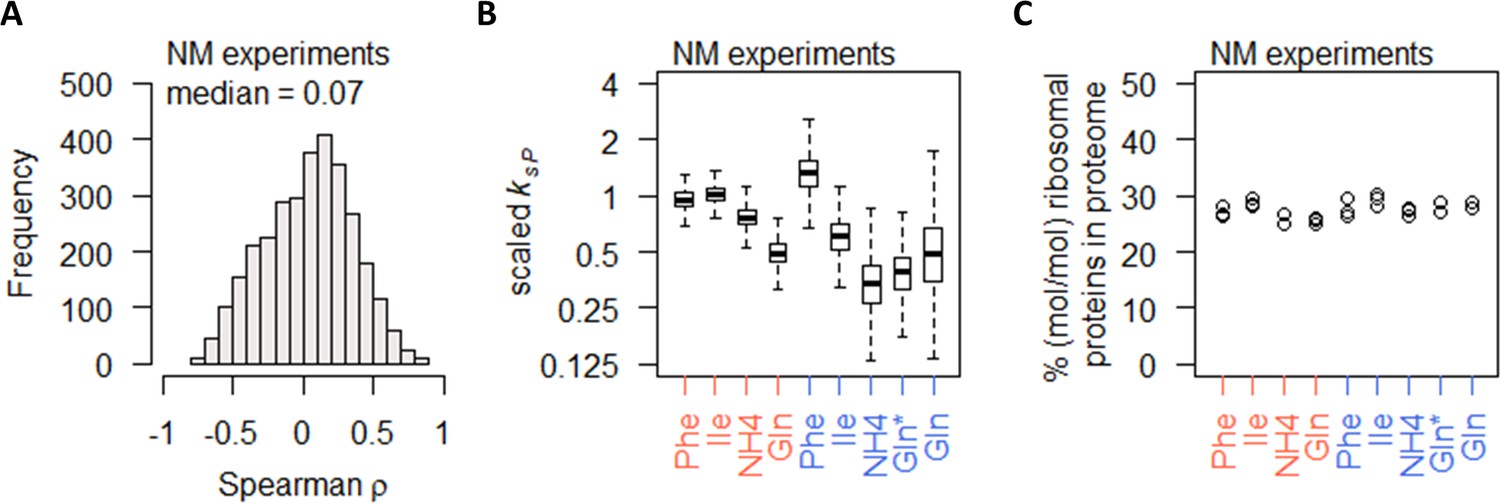
Nitrogen metabolism regulation of protein abundance is not coordinated with transcript abundance or ribosome abundance.
(A) Spearman correlation of absolute mRNA and protein abundances for each gene is calculated in the NM experiments, and the distribution is shown demonstrating overall poor correlation. (B) Protein translation rate (ksP) in the NM experiments decreases when cells were grown on preferred nitrogen sources (NH4 and Gln) compared to non-preferred nitrogen sources (Phe and Ile). In nitrogen-limited cultures (orange), there is an overall 2-fold decrease, and in carbon-limited cultures (blue), there is an overall 4-fold decrease. Center line, median; box limits, upper and lower quartiles; whiskers, 1.5× interquartile range. In carbon-limited conditions (blue), the ‘Gln’ condition and the ‘Gln*’ condition differ in the concentration of Gln and glucose in the chemostat feed media; see Supplementary file 1a for full details. (C) Relative ribosomal protein abundance (sum of all detected ribosomal proteins normalized to total protein) is constant in the NM experiments, where the growth rate is controlled to a constant as seen in Figure 1A. In carbon-limited conditions (blue), the ‘Gln’ condition and the ‘Gln*’ condition differ in the concentration of Gln and glucose in the chemostat feed media; see Supplementary file 1a for full details.
Figure 6—figure supplement 1
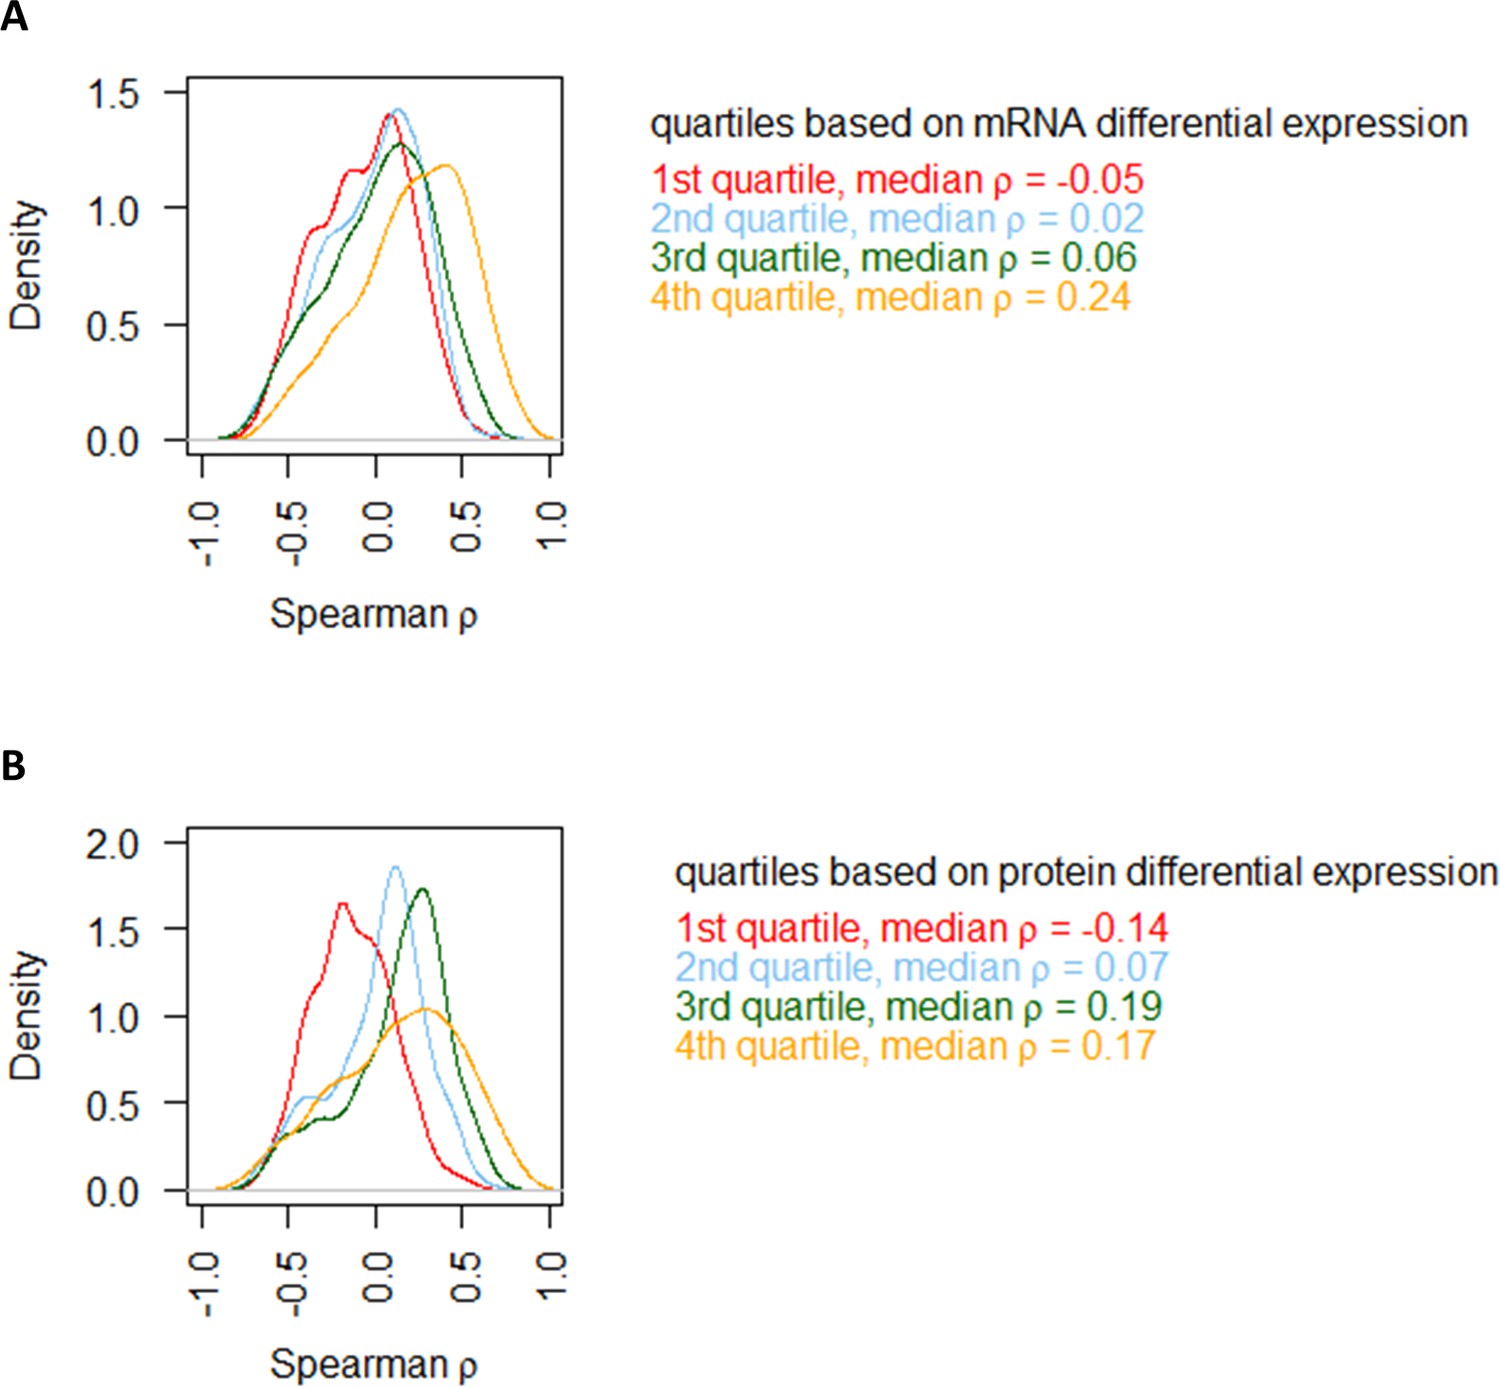
Comparing protein–mRNA correlations in the NM experiments with the range of differential expression.
(A) Genes are split into four groups based on quartiles of mRNA differential expression (fold-change of max to min value), and the distribution of Spearman correlation in each quartile is plotted separately. (B) Genes are split into four groups based on quartiles of protein differential expression (fold-change of max to min value), and the distribution of Spearman correlation in each quartile is plotted separately.
Figure 7 with 1 supplement
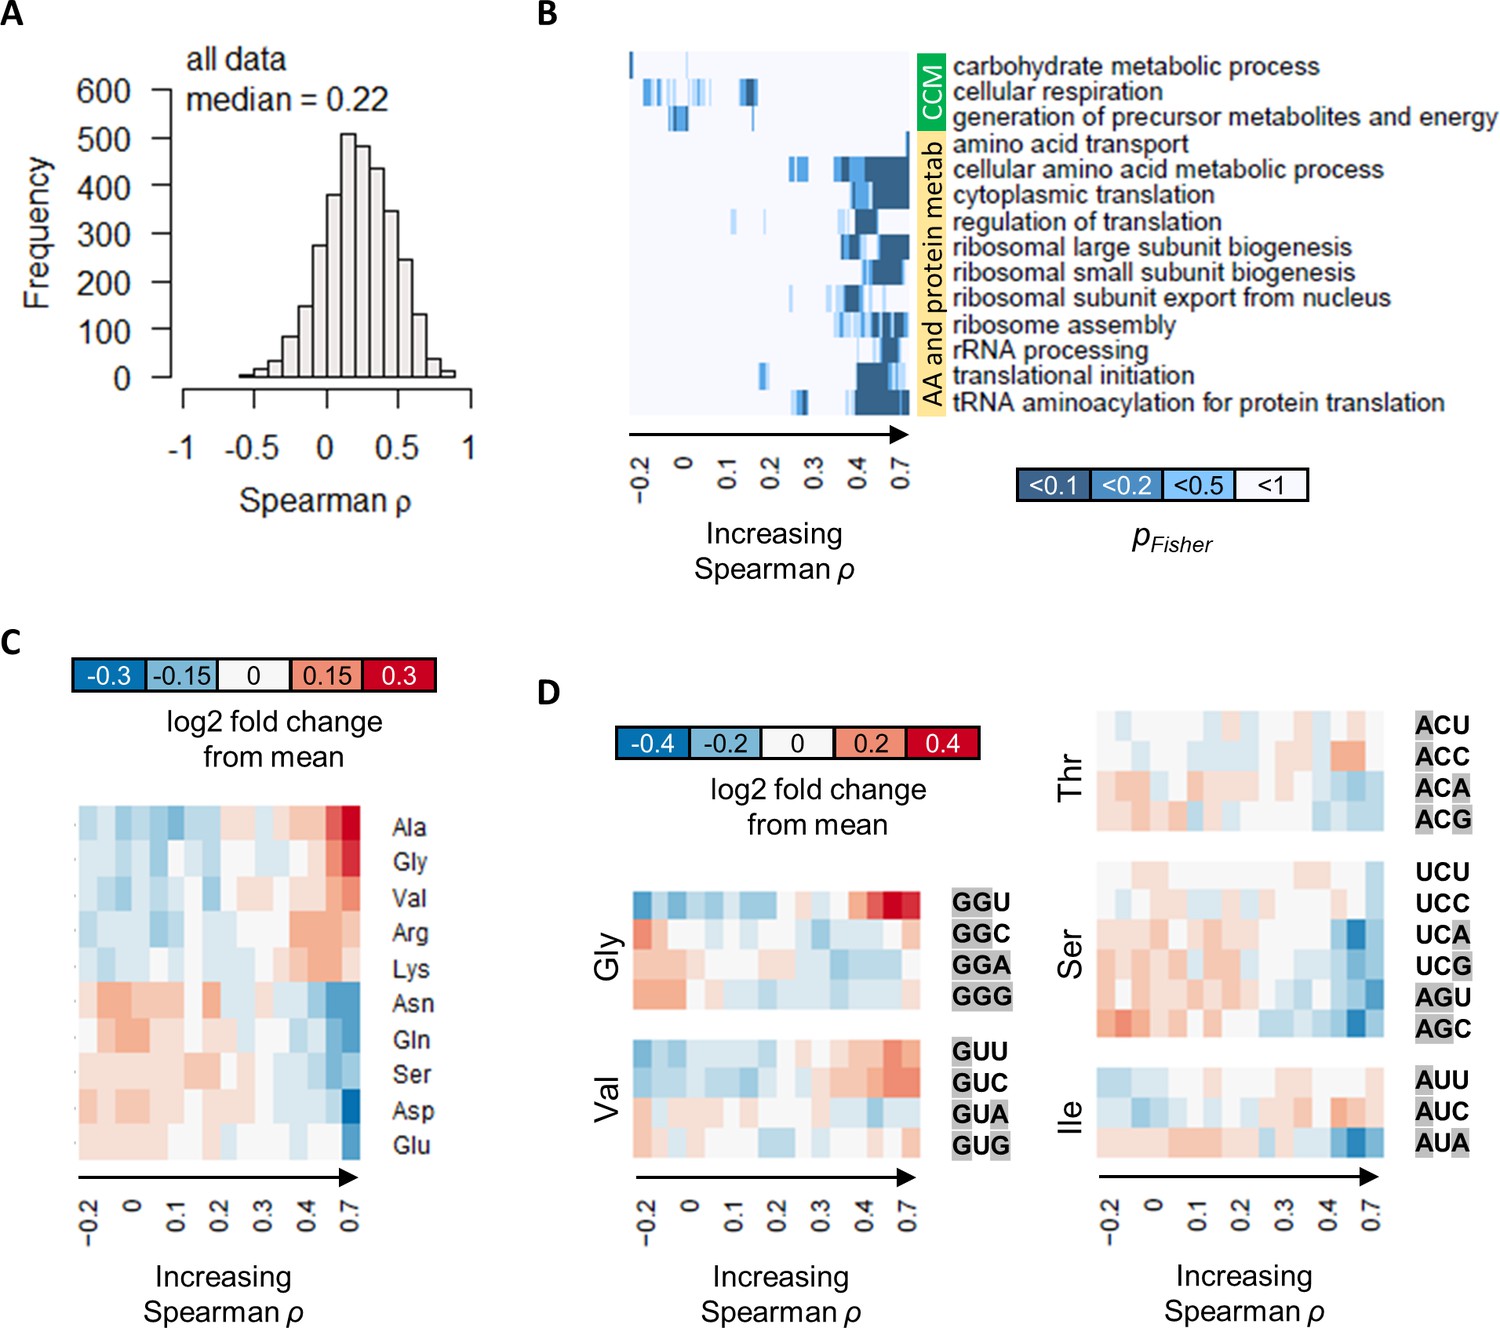
The correlation between protein and transcript abundance is especially poor for central carbon metabolism genes.
(A) Spearman correlation of absolute-quantitative mRNA and protein abundances for each gene was calculated using data from both the GR and the NM experiments combined, and the distribution is shown demonstrating overall poor correlation. (B) Enrichment of GO-slim terms in 200-gene sliding windows of increasing Spearman correlations was analyzed by two-tailed Fisher’s exact test. Shown are GO-slim terms related to central carbon metabolism (CCM), and amino acid (AA) and protein metabolism, with at least one sliding-window with pFisher<0.05, indicating that genes with good protein–mRNA correlations are enriched in AA and protein metabolism, while genes with poor protein–mRNA correlations are enriched in CCM. (C) Proportion of amino acids in genes with different protein–transcript correlations were analyzed in 200-gene brackets of increasing ρ. Ten amino acids with the largest change with respect to ρ are shown. For each amino acid, log2 of the amino acid proportion of each 200-gene bracket, divided by the mean amino acid proportion of all genes, is shown. (D) Codon usage in genes with different protein–transcript correlations were analyzed in 200-gene brackets of increasing ρ. Codons of selected amino acids with the largest changes in codon usage are shown. For each codon, log2 of the codon usage of each 200-gene bracket, divided by the mean codon usage of all genes, is shown. Purines (A and G) are highlighted in gray.
Figure 7—figure supplement 1
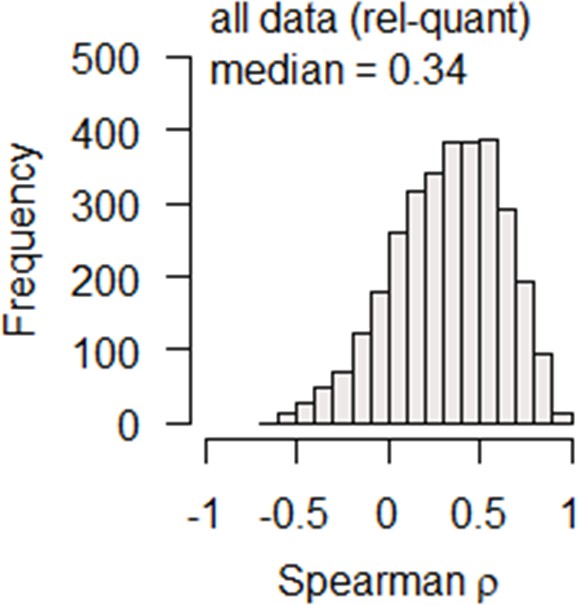
Spearman correlation of mRNA and protein relative-abundances (% of total mol/mol) for each gene is calculated using data from both the GR and the NM experiments combined, and the distribution is shown demonstrating overall poor correlation.
Figure 8
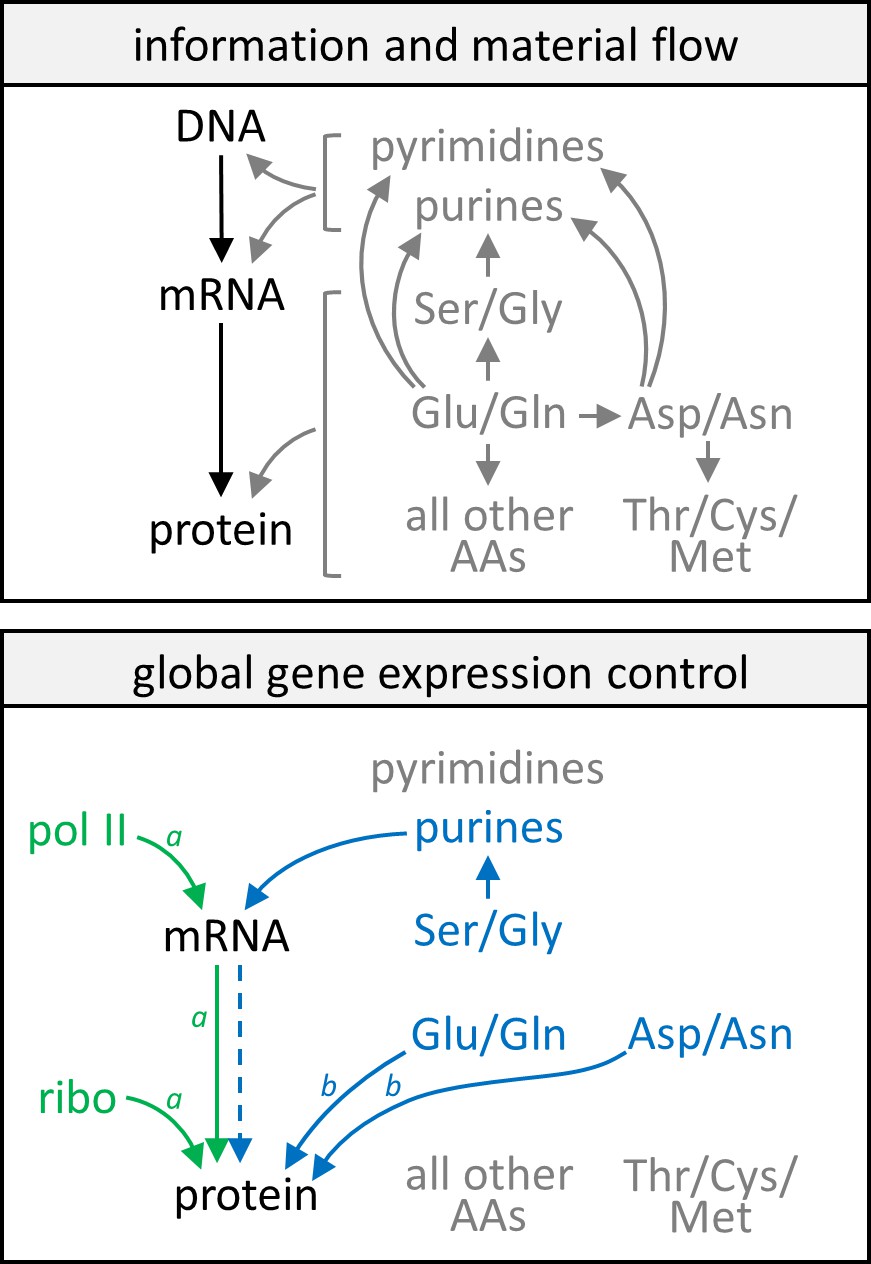
Model of gene expression control by growth rate and metabolism.
In the upper panel, information flow in the central dogma (black text and arrows) and a simplified schematic of the flow of nitrogenous material (gray text and arrows) are given as reference points. In the lower panel, green text and arrows reflect gene expression control by the growth rate, showing that protein and mRNA expression track well with each other and each follows closely with levels of RNA polymerase II and ribosomes in the cell. Blue text and solid arrows reflect gene expression control by specific amino acids and nucleotides, and the blue dashed arrow represents that only in a subset of genes are protein abundance well correlated with transcript abundance when gene expression is subject to control by nitrogen metabolism. A more detailed description of the model can be found in the main text. AA, amino acids; pol II, RNA polymerase II; ribo, ribosome. Note aCCM genes are not subject to these controls by the cell growth rate. Note bCCM genes are particularly sensitive to these controls by nitrogen metabolism.
Figure 9 with 1 supplement
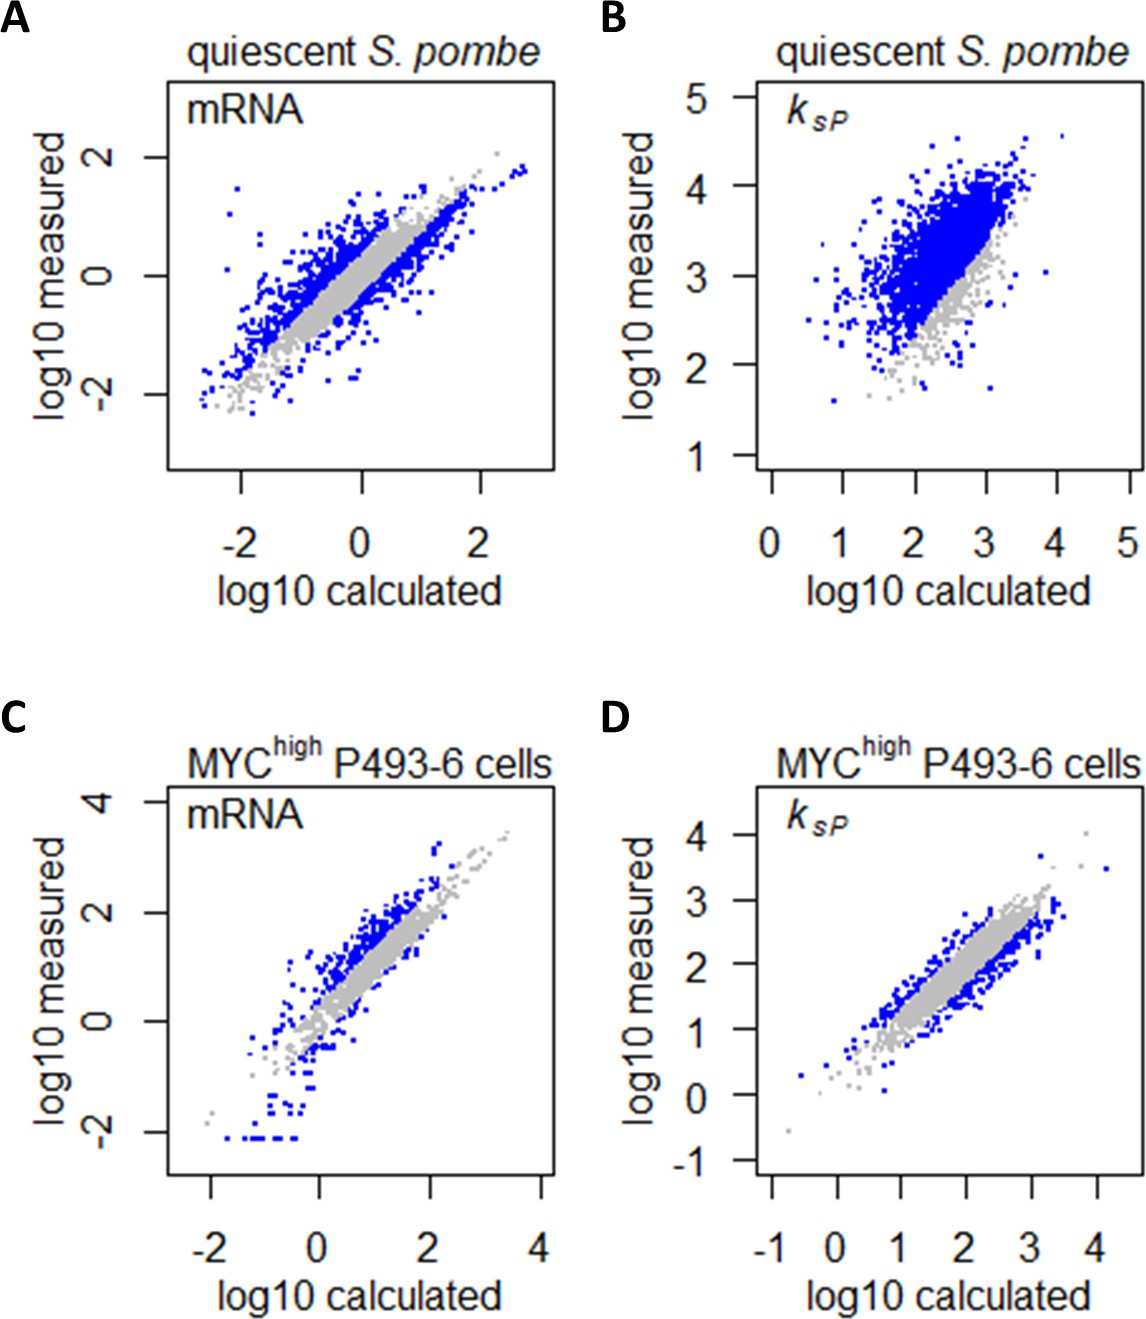
Confounding effects of growth rate and metabolism on gene expression can be accounted for in gene expression profiling analyses.
(A) Measured mRNA abundances in quiescent S. pombe are compared to the calculated mRNA abundance, given the mRNA abundance in proliferating S. pombe and the difference in cell growth rate and nitrogen availability. Gray data points are those where calculated and measured values agree within 2-fold change (−1 < log2 < 1). (B) Protein translation rate ksP calculated in quiescent S. pombe cells are compared to the protein translation rate ksP calculated based on protein and mRNA abundance in proliferating S. pombe and the difference in cell growth rate and nitrogen limitation. Gray data points are those where calculated and measured values agree within 2-fold change (−1 < log2 < 1). (C) Measured mRNA abundance in MYC-overexpressing (MYChigh) P493–6 cells are compared to the calculated mRNA abundance, given the mRNA abundance in P493–6 cells without MYC overexpression (MYClow) and the difference in cell growth rate and Gln usage. Gray data points are those where calculated and measured values agree within 2-fold change (−1 < log2 < 1). (D) Protein translation rate ksP calculated in MYC-overexpressing (MYChigh) P493–6 cells are compared to the protein translation rate ksP calculated based on protein and mRNA abundance in P493–6 cells without MYC overexpression (MYClow) and the difference in cell growth rate and Gln usage. Gray data points are those where calculated and measured values agree within 2-fold change (−1 < log2 < 1).
Figure 9—figure supplement 1
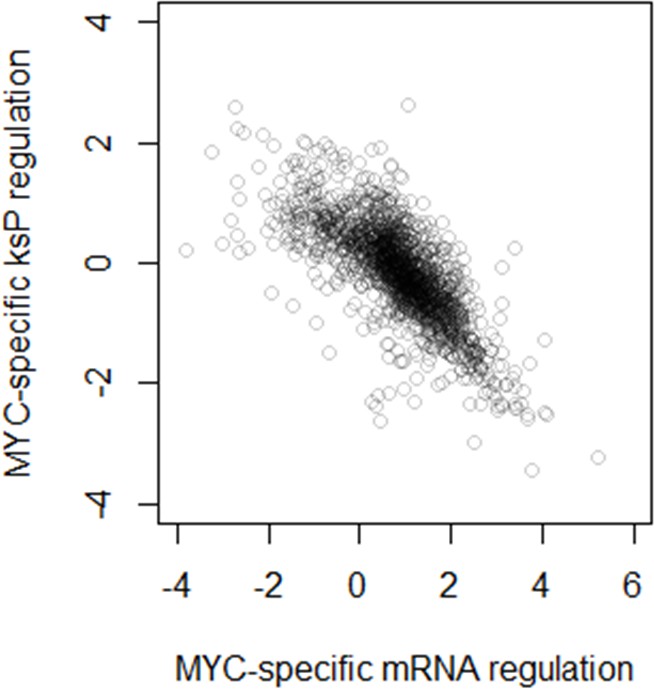
Comparison between MYC-specific regulation of mRNA abundance and protein translation rate (ksP).
Tables
Key resources table
| Reagent type (species) or resource | Designation | Source or reference | Identifiers | Additional information |
|---|---|---|---|---|
| Strain, strain background (Saccharomyces cerevisiae) | CEN.PK113-7D | Nielsen lab | MATa, MAL2-8c, SUC2 | |
| Commercial assay or kit | Qiagen RNeasy Mini Kit | Qiagen | Cat # 74106 | |
| Commercial assay or kit | Qubit RNA HS Assay Kit | Thermo Fisher | Cat # Q32852 | |
| Commercial assay or kit | Illumina TruSeq Stranded mRNA Library Prep Kit | Illumina | Cat # RS-122–2101 | |
| Commercial assay or kit | Pierce BCA Protein Assay Kit | Thermo Fisher | Cat # 23225 | |
| Commercial assay or kit | TMT10plex Isobaric Label Reagent Set | Thermo Fisher | Cat # 90110 | |
| Commercial assay or kit | SCIEX aTRAQ Reagents Application Kit | Sciex | Cat # 4442678 | |
| Peptide, recombinant protein | UPS2 Proteomics Dynamic Range Standard | Sigma–Aldrich | Cat # UPS2-1SET | |
| Software, algorithm | Proteome Discoverer 2.2 | Thermo Fisher | ||
| Software, algorithm | Mascot 2.5.1 | Matrix Science | ||
| Software, algorithm | R 4.0.3 | R Project |
Additional files
-
Supplementary file 1
Containing all data.
(a) Chemostat culture conditions and sample ID. (b) Absolute protein and mRNA abundances (fmol/mgDW) in yeast chemostat cultures (see a for culture conditions and sample ID); cluster information; and protein–mRNA correlations (Pearson and Spearman). (c) Absolute protein and mRNA abundances (fmol/mgDW) mined from Xia et al. and cluster information. (d) Intracellular amino acid (AA) abundance (µmol/gDW) in yeast chemostat cultures (see a for culture conditions and sample ID). (e) Measured metabolic fluxes in yeast chemostat cultures (see a for culture conditions and sample ID).
- https://cdn.elifesciences.org/articles/65722/elife-65722-supp1-v2.xlsx
-
Transparent reporting form
- https://cdn.elifesciences.org/articles/65722/elife-65722-transrepform-v2.docx
Download links
A two-part list of links to download the article, or parts of the article, in various formats.
Downloads (link to download the article as PDF)
Open citations (links to open the citations from this article in various online reference manager services)
Cite this article (links to download the citations from this article in formats compatible with various reference manager tools)
Quantifying absolute gene expression profiles reveals distinct regulation of central carbon metabolism genes in yeast
eLife 10:e65722.
https://doi.org/10.7554/eLife.65722


