Leveraging the Mendelian disorders of the epigenetic machinery to systematically map functional epigenetic variation
- Department of Genetic Medicine, Johns Hopkins University School of Medicine, United States
- Department of Biostatistics, Johns Hopkins Bloomberg School of Public Health, United States
- Faculty of Medicine, School of Health Sciences, University of Iceland, Iceland
- Landspitali University Hospital, Iceland
Figures
Figure 1 with 1 supplement
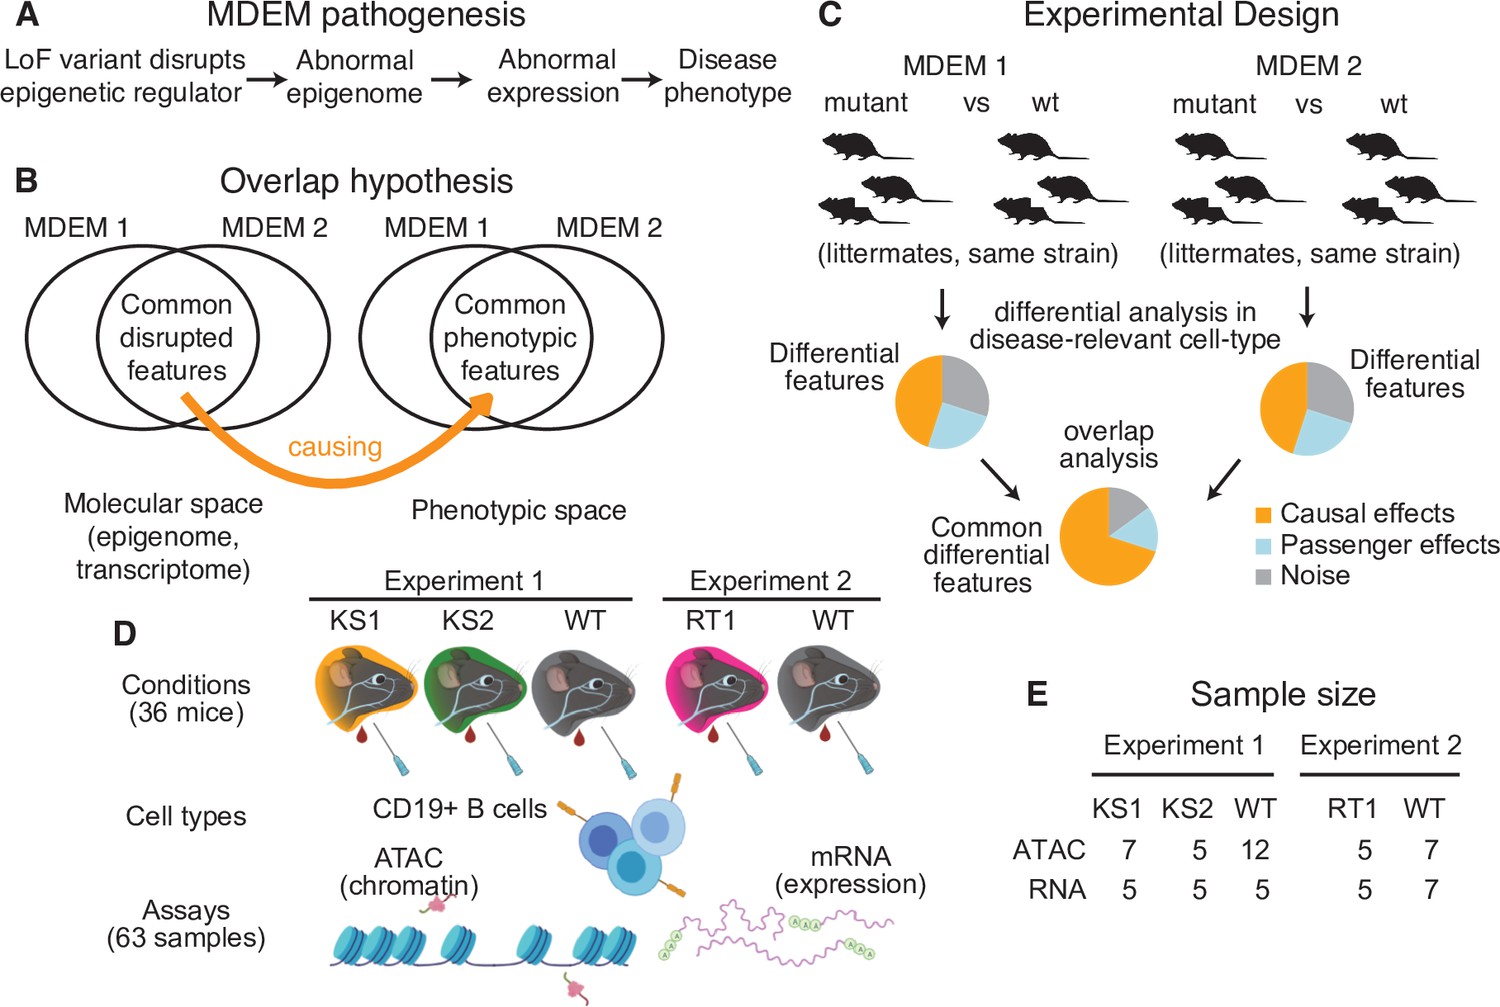
The conceptual framework of the present study.
(A) The causal chain of Mendelian Disorder of the Epigenetic Machinery (MDEM) pathogenesis: the genetic disruption of an epigenetic regulator leads to epigenetic and transcriptomic alterations, which ultimately determine the phenotype. (B) We hypothesize that the shared phenotypic features between MDEMs occur because of shared epigenetic and transcriptomic alterations downstream of the genetic disruption of distinct genes. The Venn diagram depicts two MDEMs for convenience, but our approach can be applied to an arbitrary number of MDEMs with shared phenotypes. (C) Our approach is designed to derive a list of abnormalities with high probability of causal relevance, by jointly comparing multiple MDEMs. Shown for two MDEMs for convenience. (D) Experimental design and workflow for sample generation in our present study. Created with BioRender.com. (E) The sample size of our study (number of mice). The ATAC- and RNA-seq samples were generated in parallel (see Materials and methods for details).
Figure 1—figure supplement 1
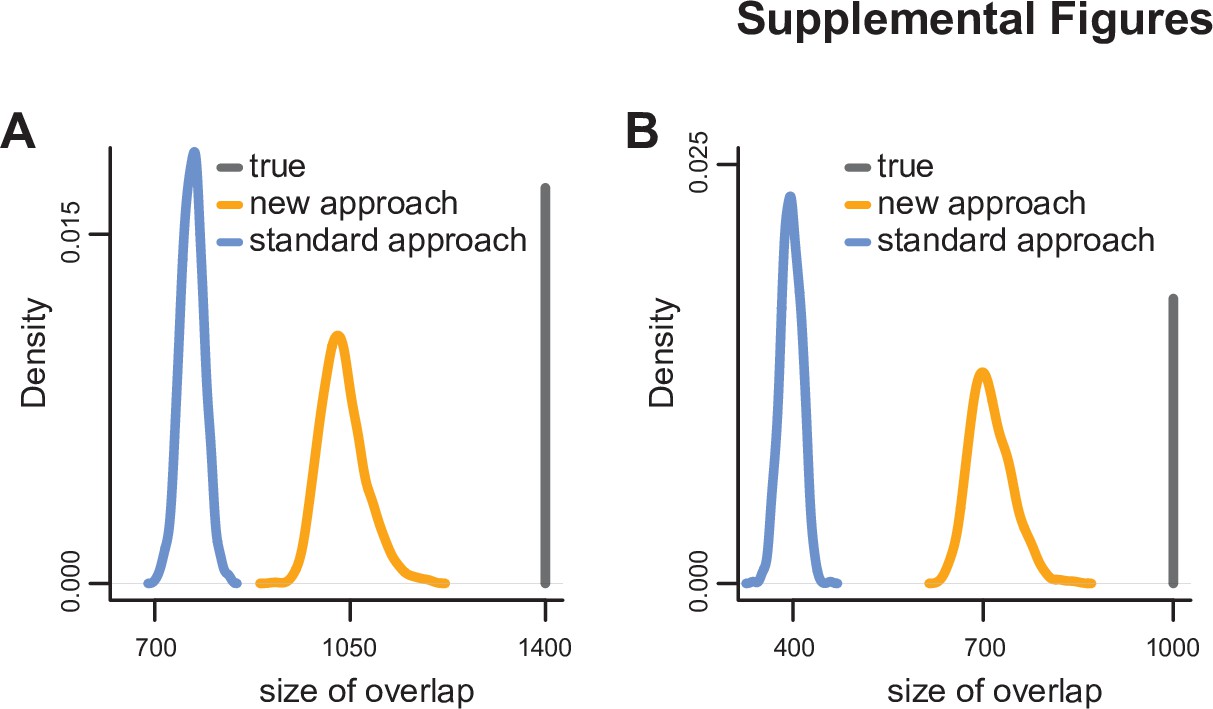
Simulation study comparing the ability of the standard approach to detect significant hits shared between experiments to that of our new approach.
See Materials and methods for details. Panel (A) corresponds to two experiments, and panel (B) corresponds to three experiments. The distributions were derived after 1000 simulations.
Figure 2 with 2 supplements

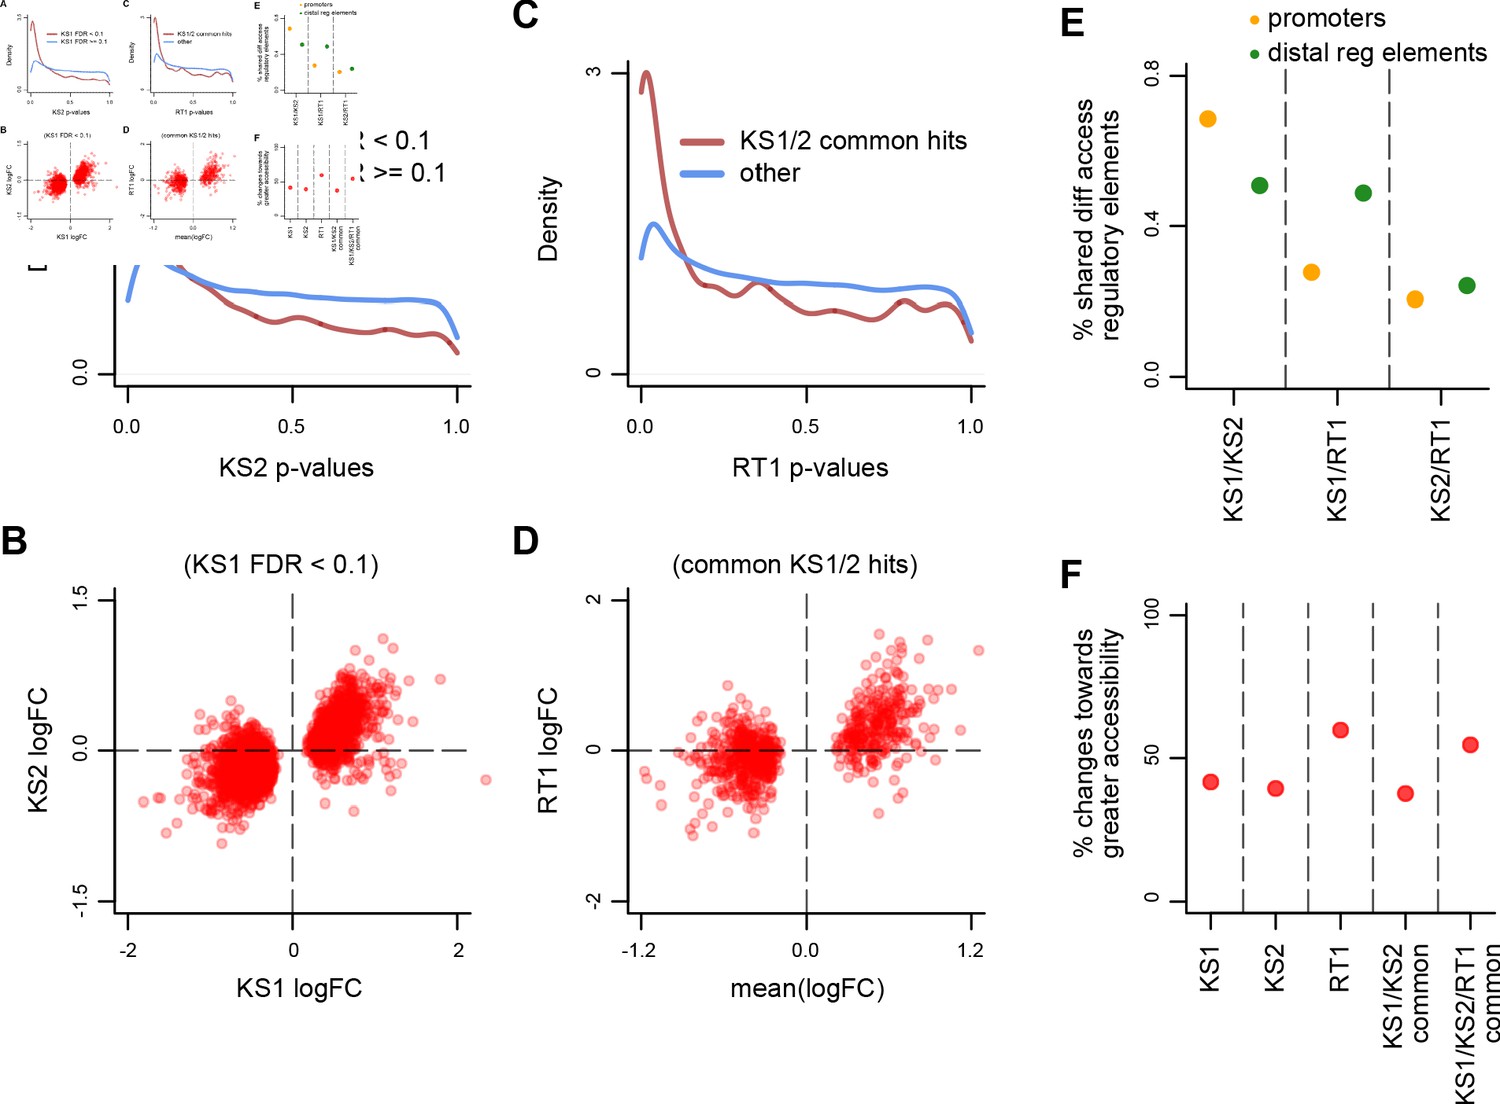
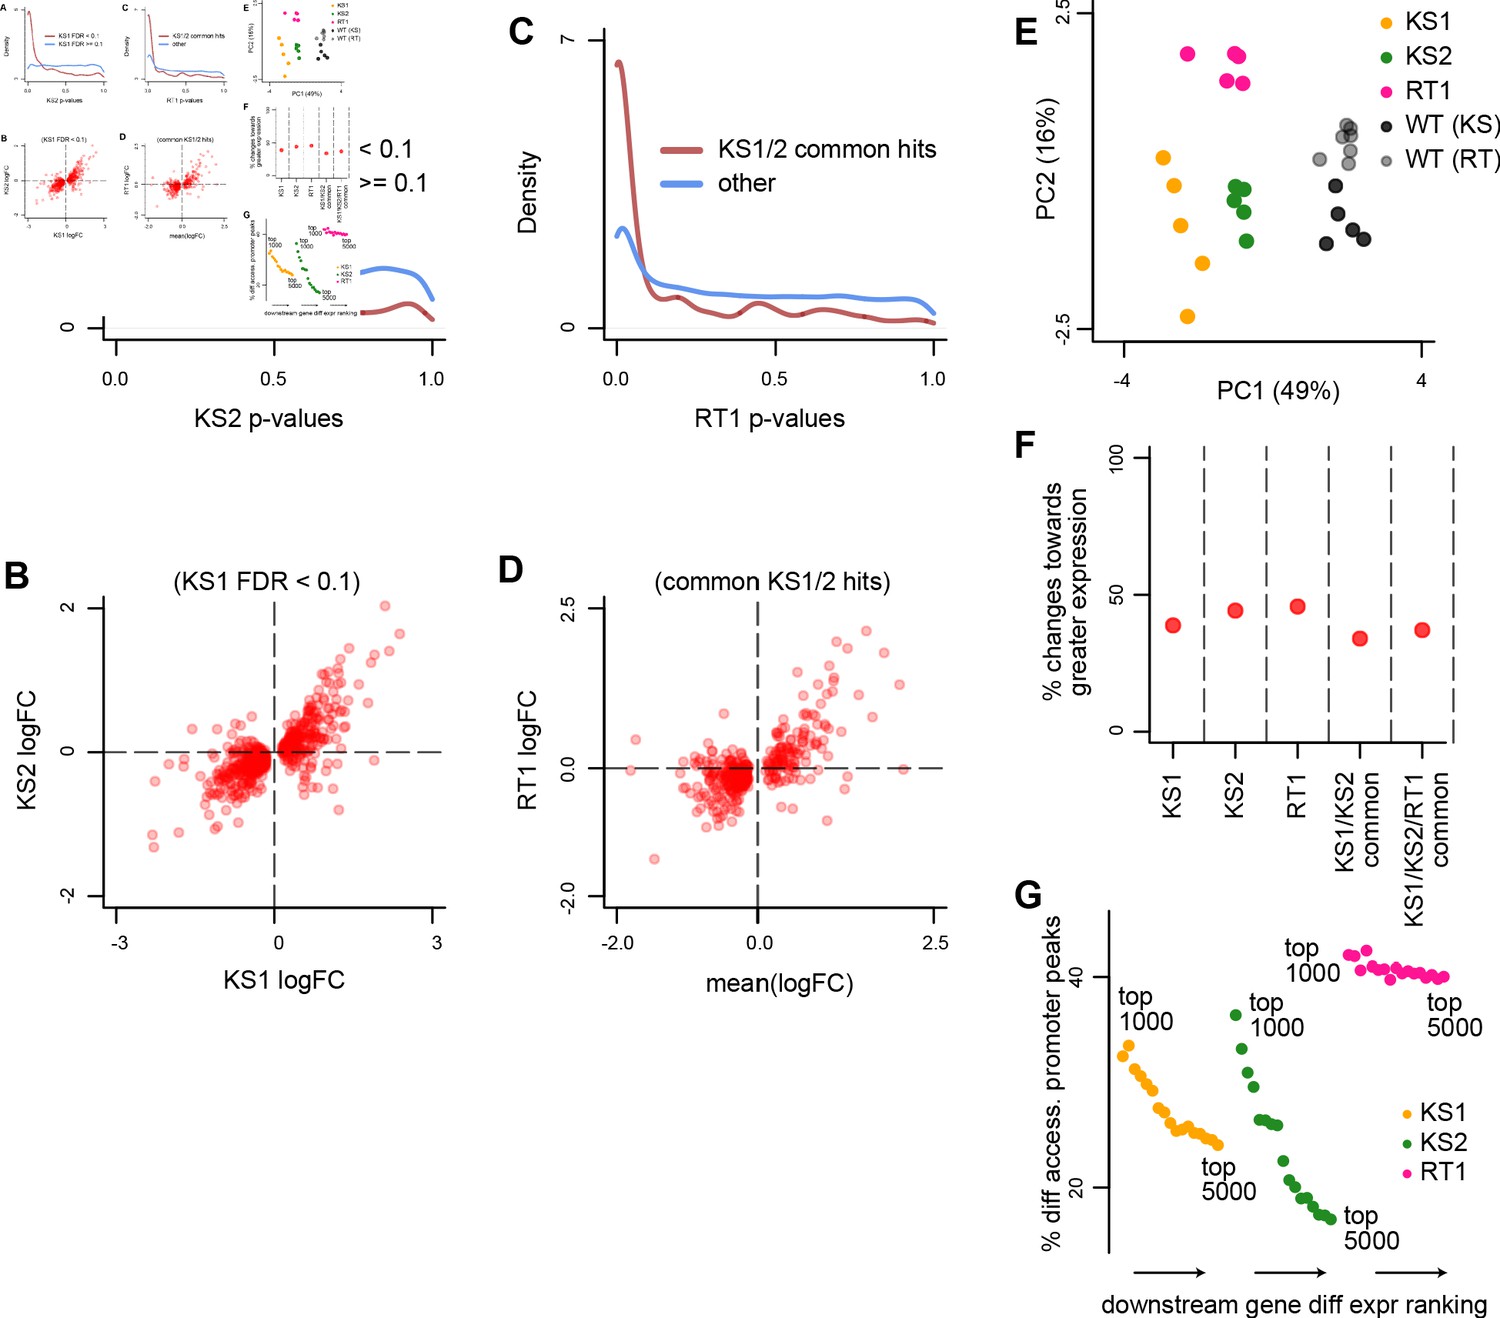
Evaluating the overlap between the differentially accessible promoter peaks in Kabuki type 1 (KS1), Kabuki type 2 (KS2), and Rubinstein-Taybi type 1 (RT1) syndromes.
(A) The distribution of p-values from the KS2 vs. wild-type differential accessibility analysis for promoter peaks, stratified according to whether the same promoter peaks are significantly differentially accessible in the KS1 vs. wild-type analysis (FDR < 0.1; red curve), or not (FDR ≥ 0.1; blue curve). (B) Scatterplot of log2(fold changes) from the KS1 vs. wild-type (x-axis) promoter peak differential accessibility analysis against the corresponding log2(fold changes) from the KS2 vs. wild-type analysis (y-axis). Each point corresponds to a peak. Shown are only peaks that are differentially accessible in KS1 (FDR < 0.1). (C) The distribution of p-values from the RT1 vs. wild-type differential accessibility analysis for promoter peaks, stratified according to whether the same promoter peaks are shared differentially accessible between KS1 and KS2 (FDR < 0.1, see Materials and methods; red curve), or not (blue curve). (D) Scatterplot of log2(fold changes) from the RT1 vs. WT (x-axis) differential accessibility analysis, against the mean log2(fold change) from the KS1 vs. wild-type and KS2 vs. wild-type analyses. Each point corresponds to a peak. Shown are only shared differentially accessible promoter peaks between KS1 and KS2 (FDR < 0.1). (E) Principal component analysis plot using only the 420 promoter peaks identified as shared differentially accessible between the three Mendelian Disorders of the Epigenetic Machinery (MDEMs). Each point corresponds to a mouse. (F) The proportion of differentially accessible promoter peaks that show increased accessibility in the mutant vs. the wild-type mice.
-
Figure 2—source data 1
Coordinates of shared differentially accessible promoter peaks in Kabuki type 1 (KS1) and Kabuki type 2 (KS2) syndromes, along with the corresponding logFC changes.
- https://cdn.elifesciences.org/articles/65884/elife-65884-fig2-data1-v2.csv
-
Figure 2—source data 2
Coordinates of shared differentially accessible promoter peaks in Kabuki type 1 (KS1), Kabuki type 2 (KS2), and Rubinstein-Taybi type 1 (RT1) syndromes, along with the corresponding logFC changes.
- https://cdn.elifesciences.org/articles/65884/elife-65884-fig2-data2-v2.xlsx
-
Figure 2—source data 3
Coordinates of shared differentially accessible distal regulatory element peaks in Kabuki type 1 (KS1) and Kabuki type 2 (KS2) syndromes, along with the corresponding logFC changes.
- https://cdn.elifesciences.org/articles/65884/elife-65884-fig2-data3-v2.xlsx
-
Figure 2—source data 4
Coordinates of shared differentially accessible distal regulatory element peaks in Kabuki type 1 (KS1), Kabuki type 2 (KS2), and Rubinstein-Taybi type 1 (RT1) syndromes, along with the corresponding logFC changes.
- https://cdn.elifesciences.org/articles/65884/elife-65884-fig2-data4-v2.xlsx
-
Figure 2—source data 5
Estimated surrogate variables for the differential accessibility and differential expression analyses.
- https://cdn.elifesciences.org/articles/65884/elife-65884-fig2-data5-v2.xlsx
Figure 2—figure supplement 1
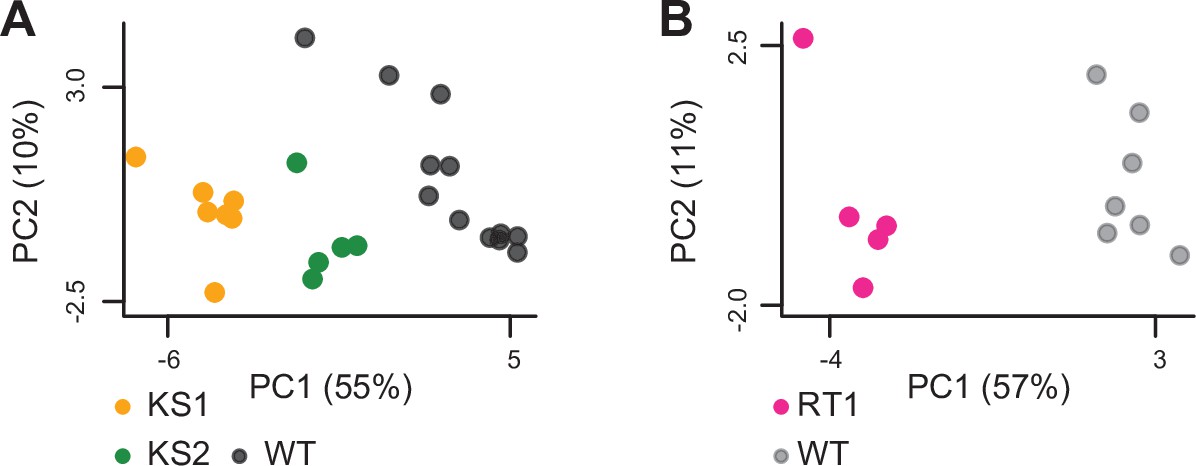
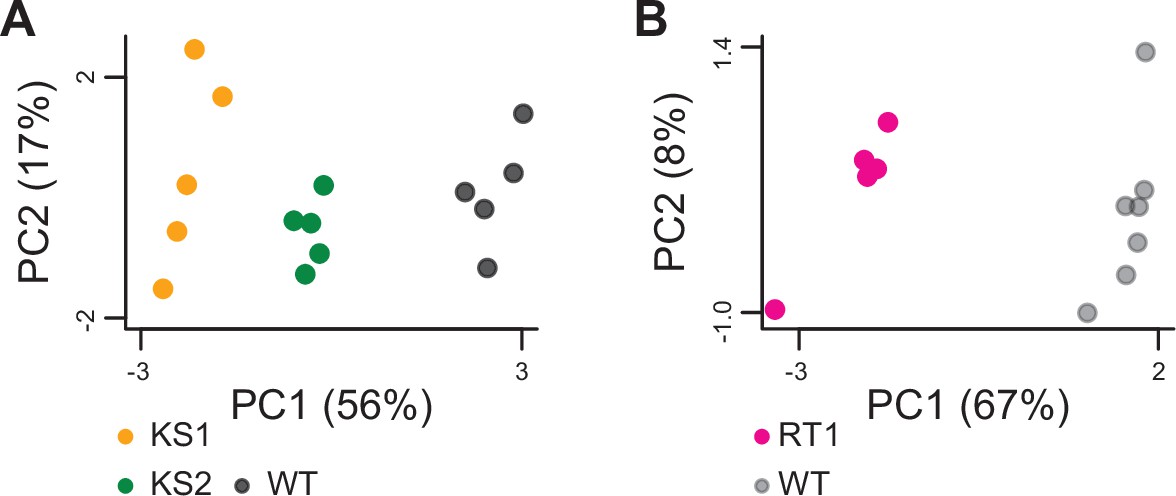
Principal component analysis plots using only the 420 promoter peaks identified as shared differentially accessible between the three Mendelian Disorders of the Epigenetic Machinery (MDEMs).
Each point corresponds to a mouse. The black points correspond to wild-type mice from the Kabuki cohorts, and the gray points correspond to wild-type mice from the Rubinstein-Taybi cohort.
Figure 2—figure supplement 2
Evaluating the overlap between the differentially accessible distal regulatory elements in Kabuki type 1 (KS1), Kabuki type 2 (KS2), and Rubinstein-Taybi type 1 (RT1) syndromes.
(A) The distribution of p-values from the KS2 vs. wild-type differential accessibility analysis for peaks at distal regulatory elements (defined as peaks not within ±2 kb from the TSS), stratified according to whether the same elements are significantly differentially accessible in KS1 (FDR < 0.1; red curve), or not (FDR ≥ 0.1; blue curve). (B) Scatterplot of log2(fold changes) from the KS1 vs. wild-type (x-axis) distal regulatory element differential accessibility analysis against the corresponding log2(fold changes) from the KS2 vs. wild-type analysis (y-axis). Each point corresponds to a peak. Shown are only peaks that are differentially accessible in KS1 (FDR < 0.1). (C) The distribution of p-values from the RT1 vs. wild-type differential accessibility analysis for distal regulatory element peaks, stratified according to whether the same peaks are shared differentially accessible between KS1 and KS2 (FDR < 0.1, see Materials and methods; red curve), or not (blue curve). (D) Scatterplot of log2(fold changes) from the RT1 vs. wild-type (x-axis) differential accessibility analysis, against the mean log2(fold change) from the KS1 vs. wild-type and KS2 vs. wild-type analyses. Each point corresponds to a peak. Shown are only peaks that are shared differentially accessible between KS1 and KS2 (FDR < 0.1). (E) The pairwise overlap between the differentially accessible peaks (promoters or distal regulatory elements) in the three Mendelian Disorders of the Epigenetic Machinery (MDEMs). (F) The proportion of differentially accessible distal regulatory elements that show increased accessibility in the mutant vs. the wild-type mice.
Figure 3 with 1 supplement
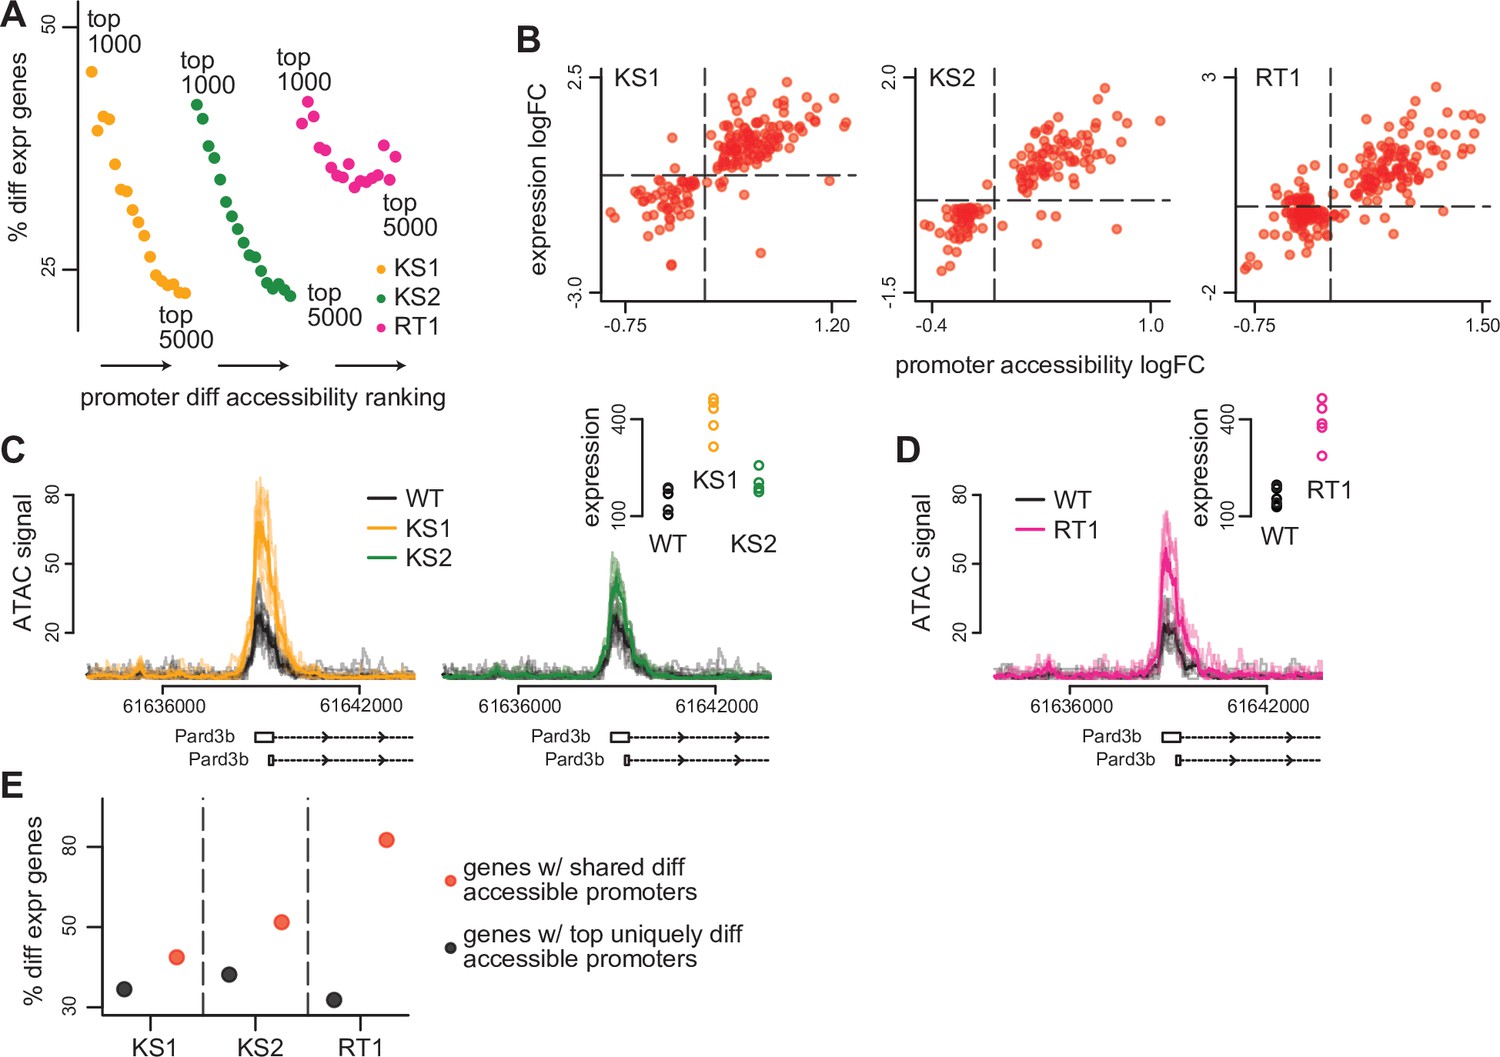
The relationship between differential accessibility of promoter peaks and differential expression of downstream genes in the three Mendelian Disorders of the Epigenetic Machinery (MDEMs).
(A) The proportion of promoters with differentially expressed downstream genes in Kabuki type 1 (KS1), Kabuki type 2 (KS2), and Rubinstein-Taybi type 1 (RT1) syndromes, estimated for the top ranked differentially accessible promoter peaks. The estimation was repeated for different thresholds for determining the top ranked list. For each MDEM, each point corresponds to a different threshold. Thresholds were slid from 1000 to 5000, in steps of 250. (B) Scatterplot of the accessibility log2(fold changes) of differentially accessible promoter peaks, against the expression log2(fold changes) of differentially expressed downstream genes, for each of the three MDEMs. Shown are only pairs where the promoter peak was within the top 1000 differentially accessible promoter peaks (ranked based on p-value), and the downstream gene was differentially expressed (10% FDR; Materials and methods). Each point corresponds to a gene-promoter pair. In cases where more than one peak in the same promoter was within the top 1000 differentially accessible peaks, the median(log2(fold change)) across all such peaks was calculated. (C) and (D) An example locus (Pard3b) with concordant changes in promoter peak accessibility and downstream gene expression in all three MDEMs. (E) The proportion of promoters with differentially expressed downstream genes in KS1, KS2, and RT1, estimated separately for the top uniquely differentially accessible promoters in each MDEM (see Materials and methods), vs. the same proportion estimated for the genes downstream of the 420 shared differentially accessible promoter peaks.
-
Figure 3—source data 1
Differentially expressed genes downstream of differentially accessible promoter peaks, along with the corresponding p-values and logFC changes.
- https://cdn.elifesciences.org/articles/65884/elife-65884-fig3-data1-v2.xlsx
Figure 3—figure supplement 1
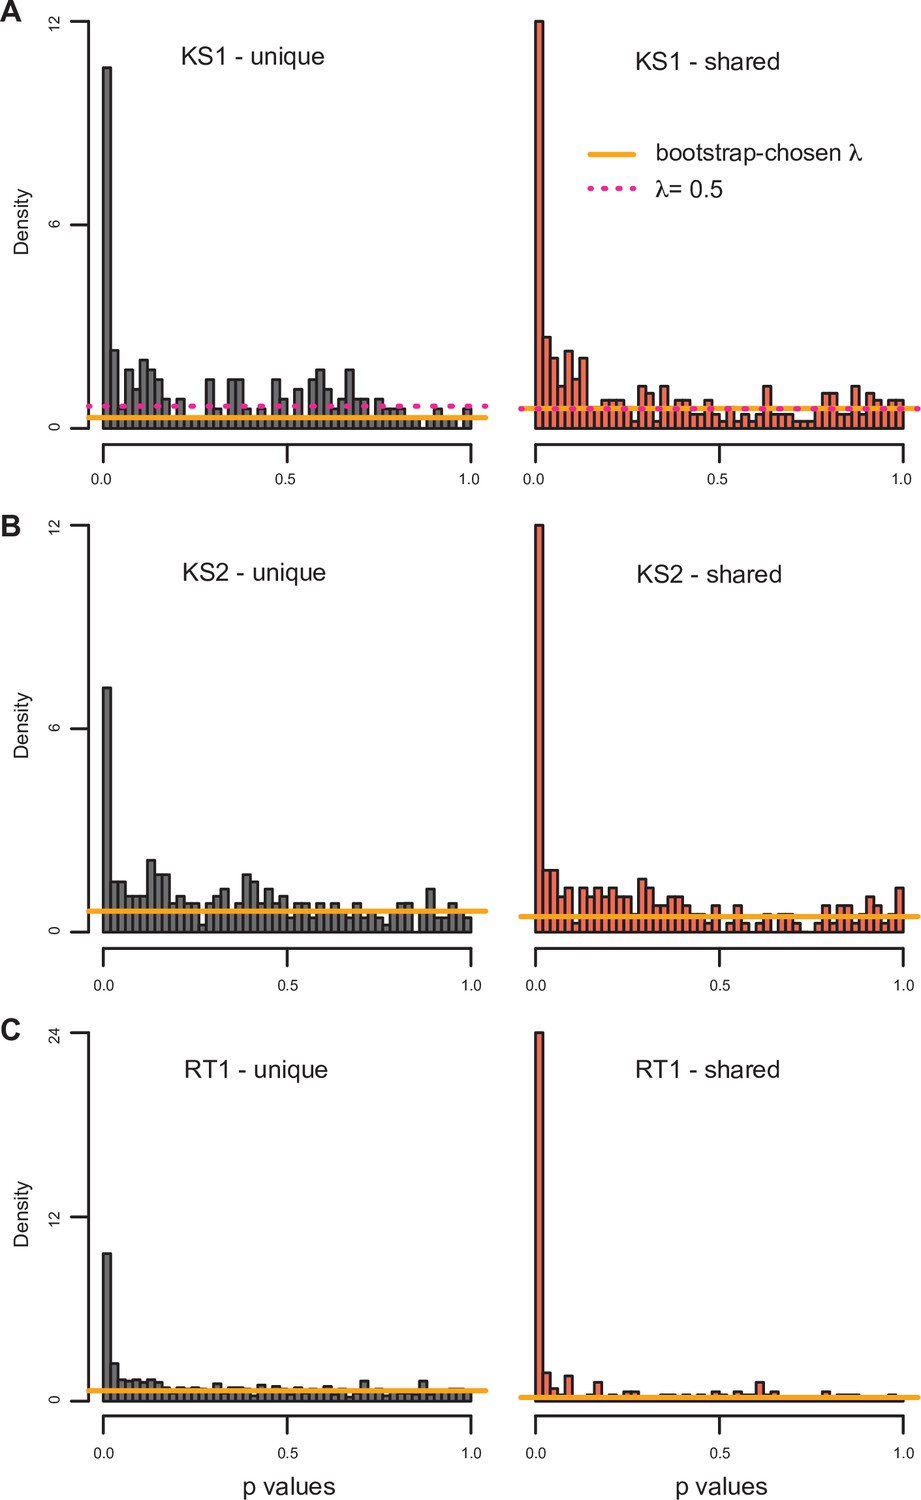
The distributions of p-values (from the differential expression analyses) for genes downstream of promoters with differentially accessible peaks shared across the disorders, or unique to the particular disorder.
The horizontal lines correspond to the estimated proportion of non-differential genes (see Materials and methods). For Kabuki type 1 (KS1) syndrome, both the proportion estimated with the bootstrap (orange line) and the smoother (pink dashed line) procedure are depicted.
Figure 4 with 1 supplement
Evaluating the overlap between the differentially expressed genes in Kabuki type 1 (KS1), Kabuki type 2 (KS2), and Rubinstein-Taybi type 1 (RT1) syndromes.
(A) The distribution of p-values from the KS2 vs. wild-type differential expression analysis, stratified according to whether the same genes are significantly differentially expressed in KS1 (FDR < 0.1; red curve), or not (FDR ≥ 0.1; blue curve). (B) Scatterplot of log2(fold changes) from the KS1 vs. wild-type differential expression analysis (x-axis), against the corresponding log2(fold changes) from the KS2 vs. wild-type analysis (y-axis). Each point corresponds to a gene. Shown are only genes that are differentially expressed in KS1 (FDR < 0.1). (C) The distribution of p-values from the RT1 vs. wild-type differential expression analysis, stratified according to whether the same genes are shared differentially expressed between KS1 and KS2 (FDR < 0.1, see Materials and methods; red curve), or not (blue curve). (D) Scatterplot of log2(fold changes) from the RT1 vs. WT (x-axis) differential expression analysis, against the mean log2(fold change) from the KS1 vs. wild-type and KS2 vs. wild-type analyses. Each point corresponds to a gene. Shown are only genes that are shared differentially expressed between KS1 and KS2 (FDR < 0.1). (E) Principal component analysis plots using only the 264 genes identified as shared differentially expressed between the three Mendelian Disorders of the Epigenetic Machinery (MDEMs). Each point corresponds to a mouse. (F) The proportion of differentially expressed genes that show increased expression in the mutant vs. the wild-type mice. (G) The proportion of genes with differentially accessible promoter peaks in KS1, KS2, and RT1, estimated for the top ranked differentially expressed genes. The estimation was repeated for different thresholds for inclusion into the top ranked list. For each MDEM, each point corresponds to a different threshold. Thresholds were varied from 1000 to 5000, in steps of 250.
-
Figure 4—source data 1
Shared differentially expressed genes in Kabuki type 1 (KS1) and Kabuki types 2 (KS2) syndromes, along with the corresponding logFC changes.
- https://cdn.elifesciences.org/articles/65884/elife-65884-fig4-data1-v2.xlsx
-
Figure 4—source data 2
Shared differentially expressed genes in Kabuki type 1 (KS1), Kabuki type 2 (KS2), and Rubinstein-Taybi type 1 (RT1), along with the corresponding logFC changes.
- https://cdn.elifesciences.org/articles/65884/elife-65884-fig4-data2-v2.xlsx
-
Figure 4—source data 3
Transcription factor motifs enriched in peaks found in promoters of differentially expressed genes.
- https://cdn.elifesciences.org/articles/65884/elife-65884-fig4-data3-v2.xlsx
Figure 4—figure supplement 1
Principal component analysis plots using only the 264 genes identified as shared differentially expressed between the three Mendelian Disorders of the Epigenetic Machinery (MDEMs).
Each point corresponds to a mouse. The black points correspond to wild-type mice from the Kabuki cohorts, and the gray points correspond to wild-type mice from the Rubinstein-Taybi cohort.
Figure 5
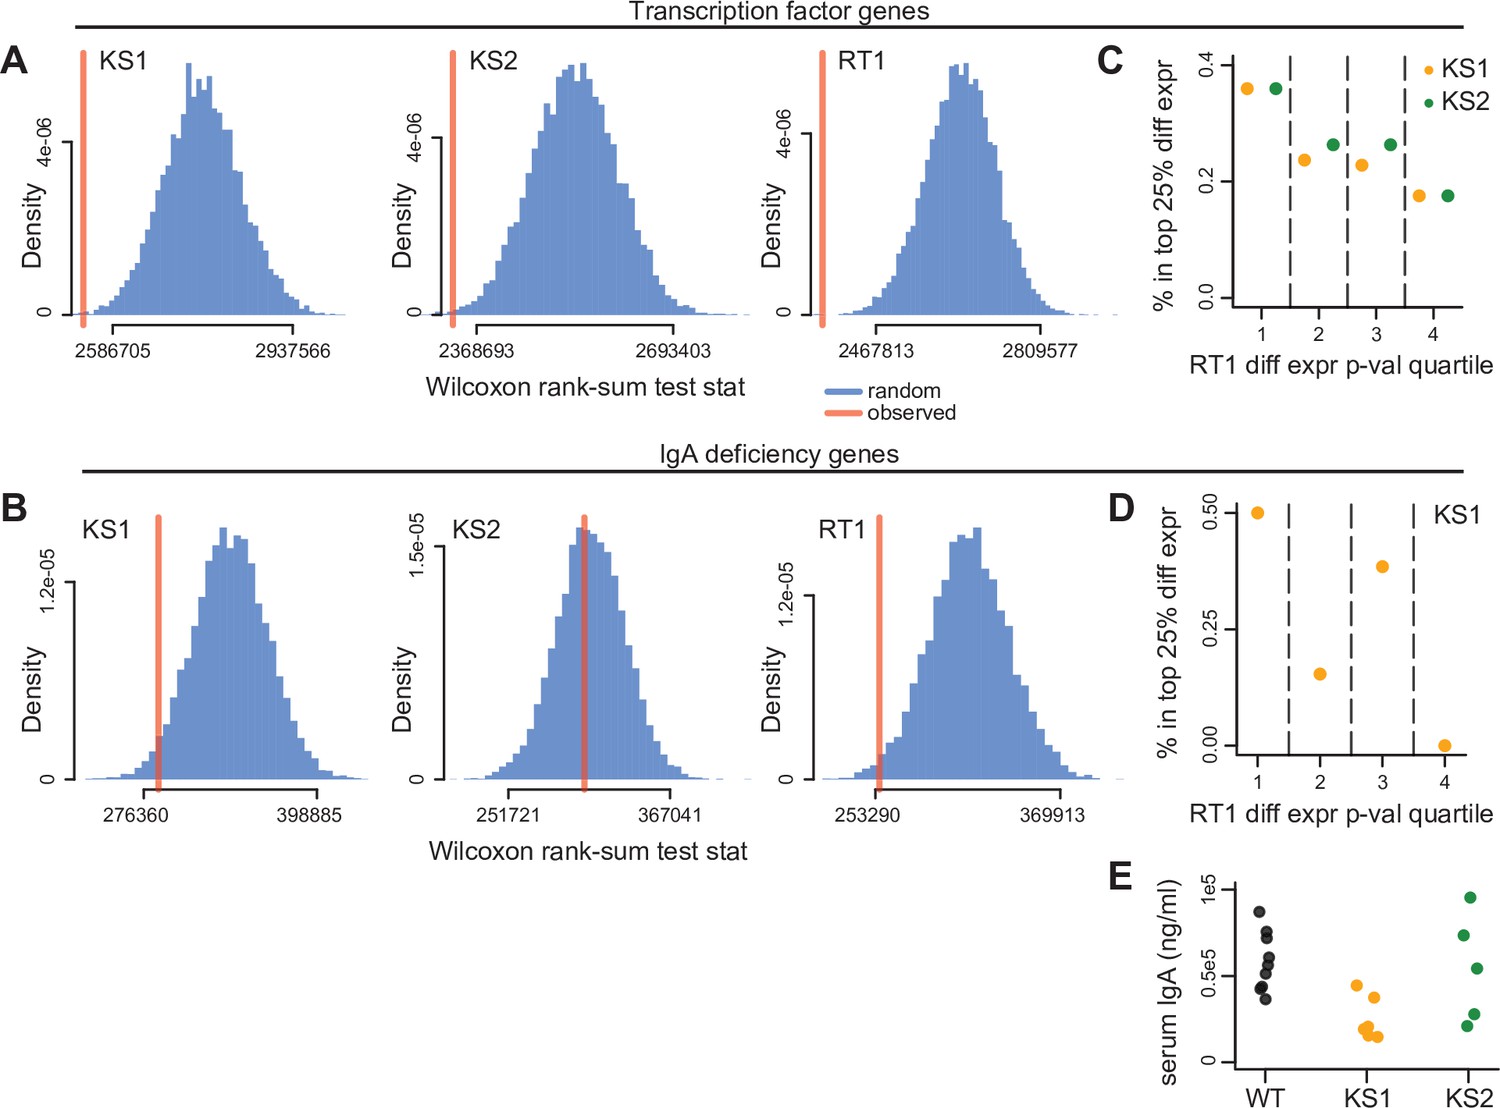
Evaluating genes known to encode transcription factors (TFs), or individually contribute to IgA deficiency, for collective expression dysregulation.
(A) The Wilcoxon rank-sum test statistic (red vertical line) computed after assembling a list of genes encoding TFs expressed in B cells (Materials and methods), and comparing the distribution of their differential expression p-values to the p-value distribution of the rest of the genes included in the differential expression analysis. The blue distribution corresponds to the same statistic computed after randomly sampling gene sets of the same size as TFs, and comparing their p-value distribution to the p-values for the rest of the genes. The resampling was performed 10,000 times. (B) Same as (A), but for genes known to individually contribute to IgA deficiency (Materials and methods). (C) The percentage of TF genes that belong to the top 25% differentially expressed TFs in Kabuki type 1 syndrome (KS1) (orange dots), and Kabuki type 2 syndrome (KS2) (green dots), stratified according to their p-value quartile in Rubinstein-Taybi type 1 syndrome (RT1). (D) Same as (C), but for IgA deficiency genes compared in KS1 and RT1. (E) Serum IgA levels in KS1, KS2, and wild-type mice.
-
Figure 5—source data 1
Top 20 Reactome enriched pathways, using shared differentially expressed genes in Kabuki type 1 (KS1), Kabuki type 2 (KS2), and Rubinstein-Taybi type 1 (RT1) syndromes.
- https://cdn.elifesciences.org/articles/65884/elife-65884-fig5-data1-v2.xlsx
-
Figure 5—source data 2
Top 20 Reactome enriched pathways, using genes with shared differentially accessible promoters in Kabuki type 1 (KS1), Kabuki type 2 (KS2), and Rubinstein-Taybi type 1 (RT1) syndromes.
- https://cdn.elifesciences.org/articles/65884/elife-65884-fig5-data2-v2.xlsx
-
Figure 5—source data 3
Serum IgA levels measured in the two types of Kabuki syndrome and wild-type littermates.
- https://cdn.elifesciences.org/articles/65884/elife-65884-fig5-data3-v2.xlsx
Tables
Table 1
Shared differentially expressed genes with shared differentially accessible promoters in Kabuki type 1, Kabuki type 2, and Rubinstein-Taybi syndromes.
| Gene name | Gene expression | Promoter accessibility | Gene function |
|---|---|---|---|
| Pard3b | Up | Up | Cell division and cell polarization processes |
| Pbx1 | Up | Up | Transcription factor |
| Epm2a | Up | Up | Serine/threonine/tyrosine phosphatase |
| Zfp365 | Up | Up | Transcription factor |
| Ccdc88a | Up | Up | Actin binding protein |
| Tanc2 | Up | Up | Synaptic scaffolding protein |
| Dip2c | Up | Up | Protein interacting with transcription factors |
| Kif13a | Up | Up | Microtubule-based motor protein |
| Spry2 | Up | Up | Inhibitory activity on receptor tyrosine kinase signaling proteins |
| Ndrg1 | Up | Up | N-myc downregulated gene family member |
| Ebi3 | Down | Down | Interleukin subunit |
| Ppdpf | Down | Down | Regulator of exocrine pancreas development |
| Golim4 | Up | Up | Golgi protein |
| Reln | Up | Up | Secreted extracellular matrix protein |
| Amz1 | Down | Down | Zinc metalloproteinase |
| Slc29a4 | Up | Up | Monoamine transporter |
| Bicd1 | Up | Up | Role in intracellular cargo transport |
| Slc25a4 | Up | Up | Member of the mitochondrial carrier subfamily |
| Nr3c2 | Up | Up | Mineralocorticoid receptor |
| Zfp827 | Up | Up | Transcription factor |
| Slc36a4 | Up | Up | Amino acid transporter |
| Arhgef12 | Up | Up | Guanine exchange factor |
| Tbc1d2b | Up | Up | GTP-ase activating protein |
| Cask | Up | Up | Calcium-calmodulin-dependent serine protein kinase |
| Dmd | Up | Up | Connects cytoskeleton and the extracellular matrix |
| Maged1 | Up | Up | p75 neurotrophin receptor mediated program |
| Chic1 | Up | Up | Cysteine-rich hydrophobic (CHIC) domain containing protein |
| Gprasp1 | Up | Up | G protein-coupled receptor interacting protein |
| Col4a5 | Up | Up | Major collagen of basement membrane |
Key resources table
| Reagent type (species) or resource | Designation | Source or reference | Identifiers | Additional information |
| Strain, strain background (Mus musculus, both sexes) | Kmt2d+/βGeo mice (fully backcrossed to C57BL/6J) | Originally from Bay Genomics and described in PMID:2527309625273096. | Kmt2d+/βGeo,Mll2Gt(RRt024)BygRRID:MGI:5829565 | A previously characterized mouse model of Kabuki syndrome (type 1). |
| Strain, strain background (Mus musculus, females only) | Kdm6a± mice (fully backcrossed to C57BL/6J, observed male lethality) | Ordered from EMMA (European Mouse Mutant Archive) | Kdm6a+/, Kdm6atm1d(EUCOMM)WtsiMGI:4434460 | A previously characterized mouse model of Kabuki syndrome (type 2). Transition from Kdm6atm1a(EUCOMM)Wtsi to Kdm6atm1d(EUCOMM)Wtsi performed in Bjornsson laboratory. |
| Strain, strain background (Mus musculus, both sexes) | Crebbp±mice (fully backcrossed to C57BL/6J) | Ordered from Jackson laboratory and described in PMID:10673499 | Crebbp+/-Crebbptm1Dli, RRID:MGI:2175793 | A previously characterized mouse model of Rubinstein-Taybi syndrome (type 1). |
| Sequence-based reagent | βGeo F | This paper | PCR primers | CAAATGGCGATTACCGTTGA |
| Sequence-based reagent | βGeo R | This paper | PCR primers | TGCCCAGTCATAGCCGAATA |
| Sequence-based reagent | Tcrd (control) F | This paper | PCR primers | CAAATGTTGCTTGTCTGGTG |
| Sequence-based reagent | Tcrd (control) R | This paper | PCR primers | GTCAGTCGAGTGCACAGTTT |
| Sequence-based reagent | Kdm6aTm1c F | This paper | PCR primers | AAGGCGCATAACGATACCAC |
| Sequence-based reagent | Kdm6aTm1c, Floxed LR | This paper | PCR primers | ACTGATGGCGAGCTCAGACC |
| Sequence-based reagent | Tcrd (control) F- | This paper | PCR primers | CAAATGTTGCTTGTCTGGTG |
| Sequence-based reagent | Tcrd (control) R | This paper | PCR primers | GTCAGTCGAGTGCACAGTTT |
| Sequence-based reagent | CrebbpR-T F | This paper | PCR primers | TAAGCAGCAGCATCCTTTGG |
| Sequence-based reagent | CrebbpR-T_WT | This paper | PCR primers | CCTGACAATGTGTCATGTGAT |
| Sequence-based reagent | CrebbpR_T_MUT R: | This paper | PCR primers | ATGCTCCAGACTGCCTTGGGA |
| Commercial assay or kit | IgA ELISA kit | Thermo | Catalog # EMIGA | |
| Commercial assay or kit | CD19 positive selection | Miltenyi | 130-052-201 | |
| Commercial assay or kit | Tagmentation | IlluminaNextera | FC-121–1030 | |
| Commercial assay or kit | Digitonin | Promega | G9441 | |
| Commercial assay or kit | DNA clean and concentration kit | Zymo | D4013 | |
| Commercial assay or kit | Select A size purification | Zymo | D4080 | |
| Commercial assay or kit | DNA high sensitivity | Agilent | 5067–4626 | |
| Commercial assay or kit | Qubit dsDNA HS | Thermo | Q32851 | |
| Commercial assay or kit | Direct-zol RNA microprep | Zymo | R2060 | |
| Commercial assay or kit | Quant-iT RiboGreen | Thermo | R11490 | |
| Commercial assay or kit | RNA HS Assay kit | Thermo | Q32852 | |
| Commercial assay or kit | RNA 6000 Pico | Agilent | 5067–1513 | |
| Commercial assay or kit | NEBNext Poly(A) mRNA isolation module | New England Biolabs | E7490 | |
| Commercial assay or kit | NEBNext Ultra II Directional RNA Library Prep kit | New England Biolabs | E7760/E7765 | |
| Commercial assay or kit | KAPA library Quantification kit | KAPA | KK4824 | |
| Software, algorithm | BowTie2 | PMID:22388286 | RRID:SCR_016368 | Default parameters |
| Software, algorithm | Samtools | PMID:19505943 | RRID:SCR_002105 | |
| Software, algorithm | MACS2 | PMID:18798982 | RRID:SCR_013291 | Keep-dup = all |
| Software, algorithm | DESeq2 | PMID:25516281 | RRID:SCR_015687 | |
| Software, algorithm | Surrogate Variable Analysis | PMID:17907809 | RRID:SCR_012836 | |
| Software, algorithm | Salmon | PMID:28263959 | V0.10RRID:SCR_017036 | |
| Other | GEO submission of all data | Accession GSE162181 | RRID:SCR_005012 |
Additional files
Download links
A two-part list of links to download the article, or parts of the article, in various formats.
Downloads (link to download the article as PDF)
Open citations (links to open the citations from this article in various online reference manager services)
Cite this article (links to download the citations from this article in formats compatible with various reference manager tools)
Leveraging the Mendelian disorders of the epigenetic machinery to systematically map functional epigenetic variation
eLife 10:e65884.
https://doi.org/10.7554/eLife.65884


