Augmentation of progestin signaling rescues testis organization and spermatogenesis in zebrafish with the depletion of androgen signaling
- State Key Laboratory of Freshwater Ecology and Biotechnology, Chinese Academy of Sciences, China
- College of Advanced Agricultural Sciences, University of Chinese Academy of Sciences, China
- Chinese Sturgeon Research Institute, China Three Gorges Corporation, China
- 5State Key Laboratory of Biocontrol, Institute of Aquatic Economic Animals and Guangdong Provincial Key Laboratory of Improved Variety Reproduction in Aquatic Economic Animals, School of Life Sciences, Sun Yat-Sen University, China
- College of Fisheries, Huazhong Agriculture University, China
- Key Laboratory of Freshwater Fish Reproduction and Development and Key Laboratory of Aquatic Science of Chongqing, School of Life Science, Southwest University, China
- The Innovative Academy of Seed Design, Chinese Academy of Sciences, China
Figures
Figure 1
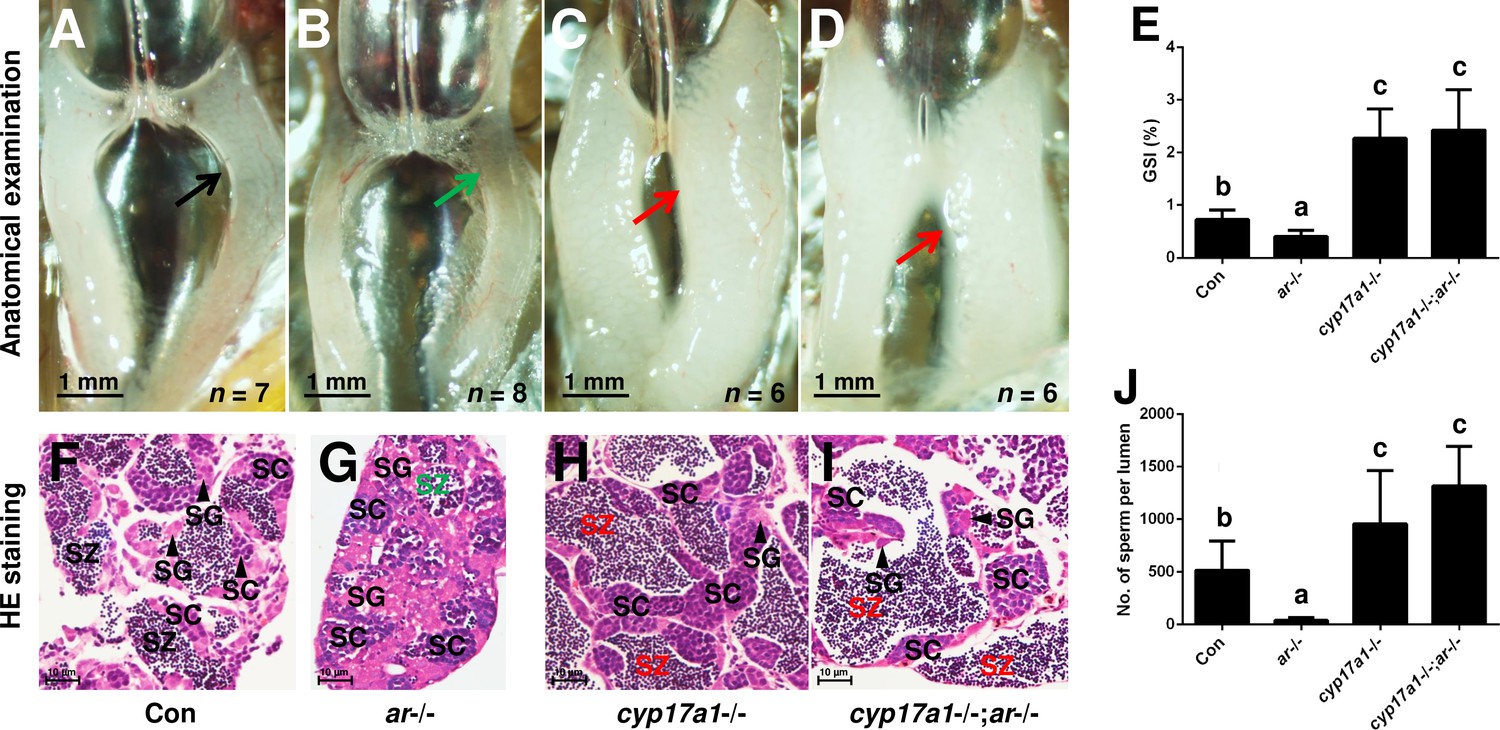
The alternative compensatory pathway induced by cyp17a1 depletion is ar-independent.
(A–D) Anatomical examination of the testes from control males, ar-/- males, cyp17a1-/- fish, and cyp17a1-/-;ar-/- fish at 6 months post-fertilization (mpf). Black and green arrows indicate the normal and impaired testis in control males and ar-/- males, respectively, whereas the red arrows indicate the hypertrophic testis in the cyp17a1-/- fish and cyp17a1-/-;ar-/- fish. (E) Gridpoint Statistical Interpolation (GSI) from the fish of the four genotypes at 6 mpf. (F–I) Histological analyses of the testes from control males, ar-/- males, cyp17a1-/- fish, and cyp17a1-/-;ar-/- fish at 6 mpf. Black and green letters of spermatozoa (SZ) indicate the normal and decreased number of SZ in control males and ar-/- males, respectively, whereas the red letters of SZ indicate the increased number of SZ in the cyp17a1-/- fish and cyp17a1-/-;ar-/- fish. (J) Statistical analysis of the SZ number in each lumen of seminiferous tubules from the fish of the four genotypes at 6 mpf. The letters in the bar charts (E) and (J) represent significant differences. SC: spermatocytes; SG: spermatogonia.
-
Figure 1—source data 1
GSI data (Figure 1E) and number of sperm per lumen (Figure 1J).
- https://cdn.elifesciences.org/articles/66118/elife-66118-fig1-data1-v2.xlsx
Figure 2 with 2 supplements
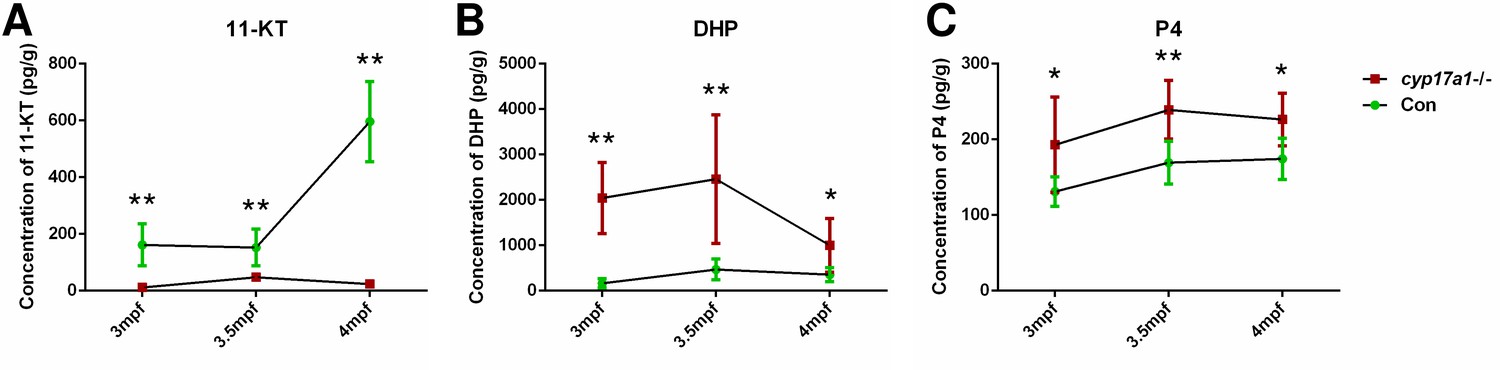
The 11-ketotestosterone (11-KT), 17α,20β-dihydroxy-4-pregnen-3-one (DHP), and progesterone (P4) measurements from whole-body lysates of the cyp17a1-/- fish and its control male siblings at 3 months post-fertilization (mpf), 3.5 mpf, and 4 mpf using ultra performance liquid chromatography tandem mass spectrometry (UPLC-MS/MS).
(A) 11-KT, (B) DHP, and (C) P4. *p<0.05; **p<0.01.
-
Figure 2—source data 1
11-KT, DHP and P4 concentrations measured from whole-body lysate of the cyp17a1-/- fish at respective stages.
- https://cdn.elifesciences.org/articles/66118/elife-66118-fig2-data1-v2.xlsx
Figure 2—figure supplement 1
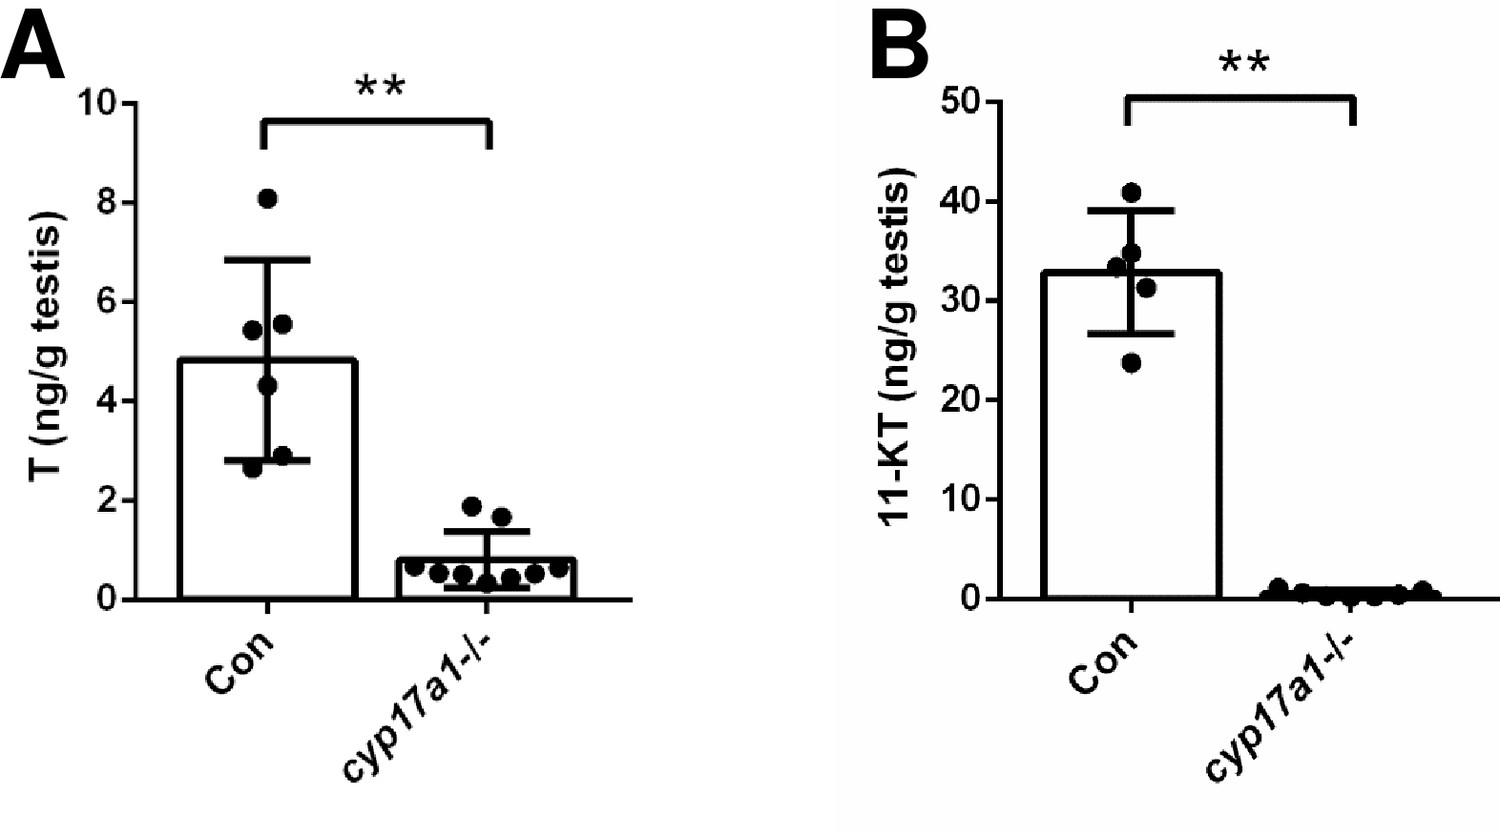
Depletion of cyp17a1 resulted in decreased concentrations of testosterone (T) and 11-ketotestosterone (11-KT) in the testes as measured by ELISA.
(A) Concentration of T in testes of control males and cyp17a1-/- fish at 3 months post-fertilization (mpf). (B) Concentration of 11-KT in testes of control males and cyp17a1-/- fish at 3 mpf. **p<0.01.
-
Figure 2—figure supplement 1—source data 1
Figure 2—figure supplement 1 for T and 11-KT concentrations.
- https://cdn.elifesciences.org/articles/66118/elife-66118-fig2-figsupp1-data1-v2.xlsx
Figure 2—figure supplement 2
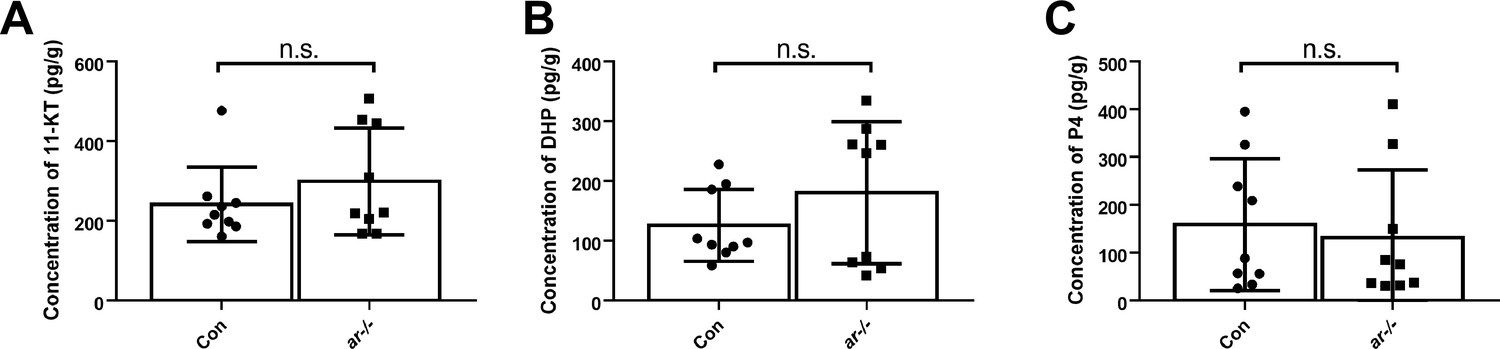
The 11-ketotestosterone (11-KT), 17α,20β-dihydroxy-4-pregnen-3-one (DHP), and progesterone (P4) measurements from whole-body lysates of the ar-/- males and their control male siblings at 3 months post-fertilization (mpf) using ultra performance liquid chromatography tandem mass spectrometry (UPLC-MS/MS).
(A) Whole-body lysates of the ar-/- males and their control male siblings were used to measure 11-KT. (B) Whole-body lysates of the ar-/- males and their control male siblings were used to measure DHP. (C) Whole-body lysates of the ar-/- males and their control male siblings were used to measure P4. n.s., no significance.
-
Figure 2—figure supplement 2—source data 1
Source data for 11-KT, DHP and P4 concentrations measured.
- https://cdn.elifesciences.org/articles/66118/elife-66118-fig2-figsupp2-data1-v2.xlsx
Figure 3 with 1 supplement
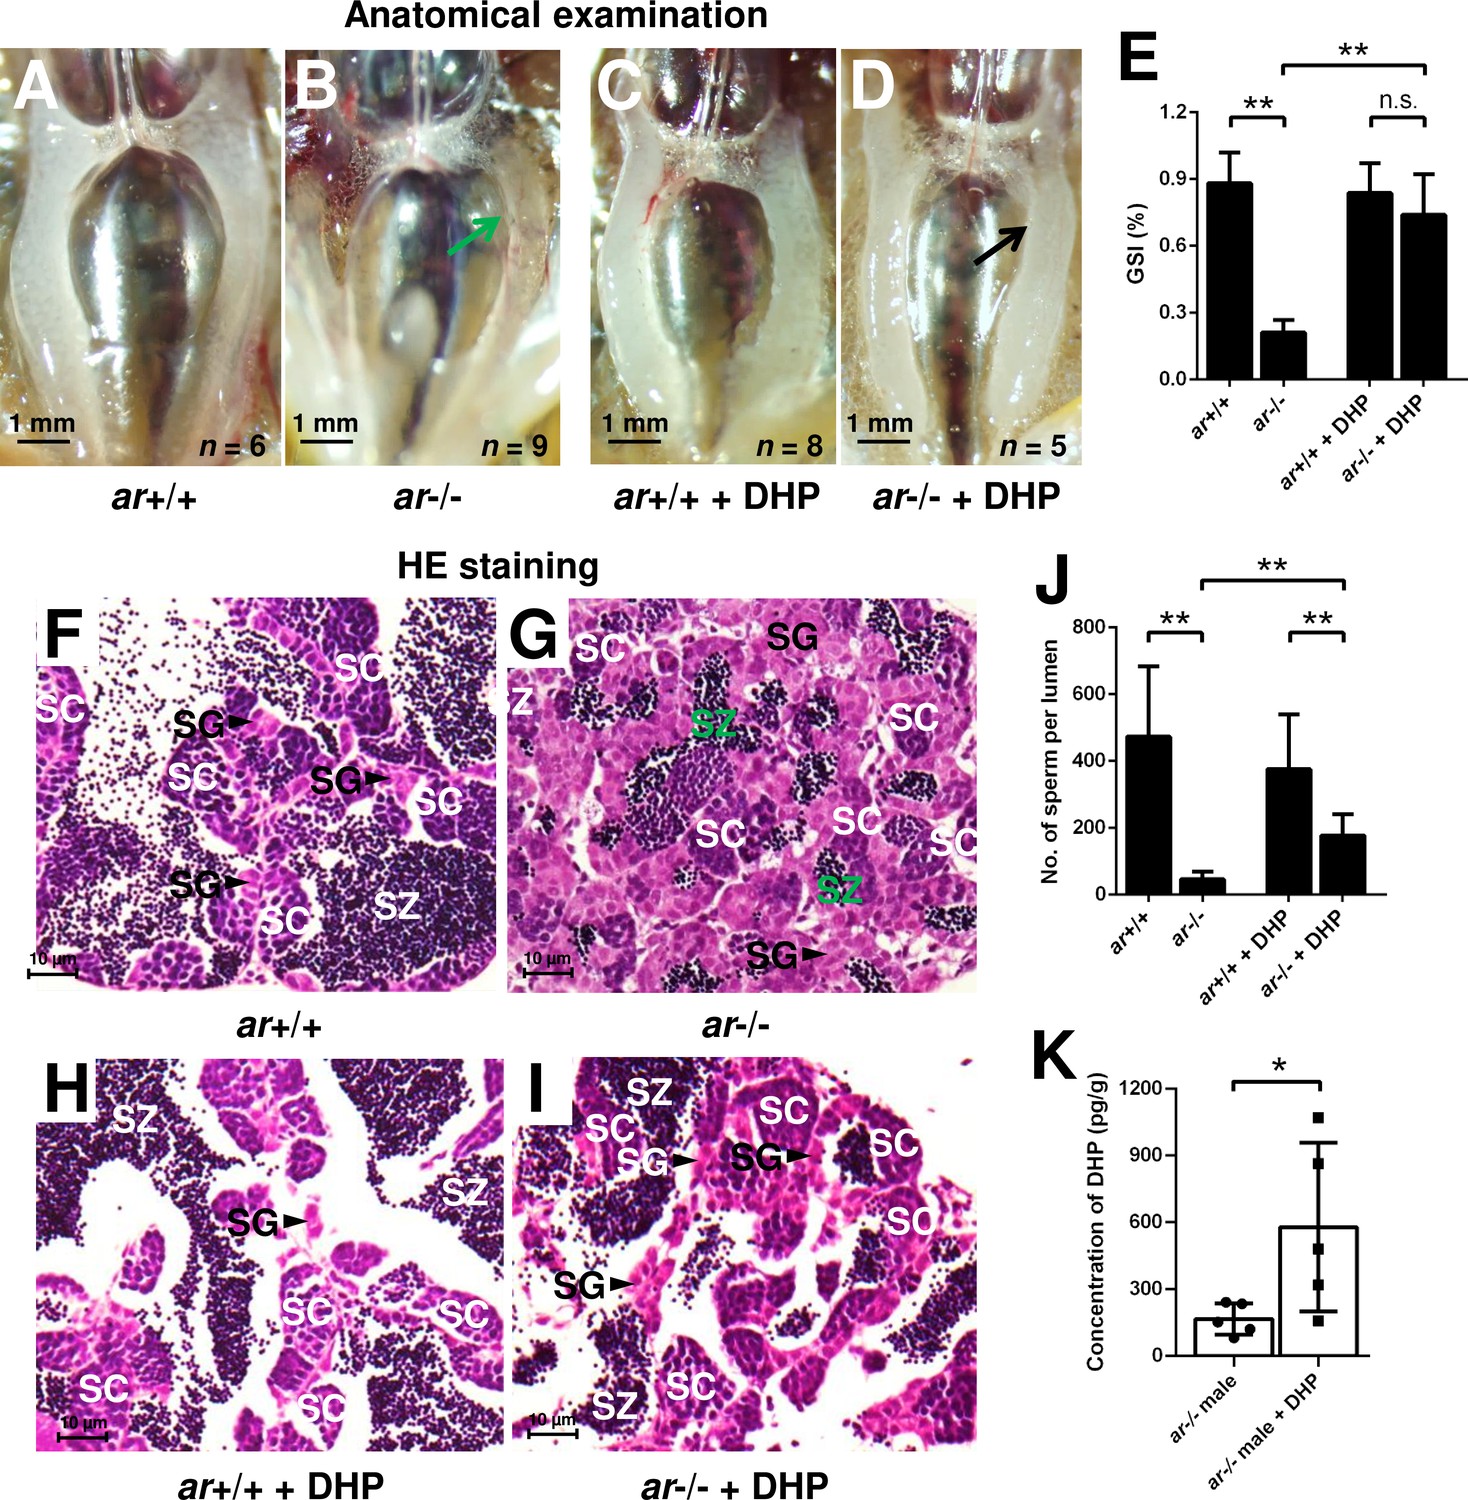
17α,20β-Dihydroxy-4-pregnen-3-one (DHP) treatment rescues the testis organization and spermatogenesis in the ar-/- males.
(A, B) Anatomical examination of ar+/+ males and ar-/- males reared in system water. (C, D) Anatomical examination of ar+/+ males and ar-/- males reared in DHP. Green and black arrows indicate the decreased and normal testis, respectively, in the ar-/- males. (E) Gridpoint Statistical Interpolation (GSI) from ar+/+ males and ar-/- males reared in system water and DHP, respectively. (F, G) Histological analyses of testes from ar+/+ males and ar-/- males reared in system water. (H, I) Histological analyses of testes from ar+/+ males and ar-/- males reared in DHP. (J) Statistical analysis of the spermatozoa (SZ) number in each lumen of seminiferous tubules from the ar+/+ males and ar-/- males reared in system water and DHP, respectively. (K) The DHP concentrations measurement of the ar-/- males reared in system water and DHP, respectively. *p<0.05; **p<0.01. n.s., no significance; SC: spermatocytes; SG: spermatogonia.
-
Figure 3—source data 1
GSI value for Figure 3E; number of sperm per lumen for Figure 3J; DHP concentrations for Figure 3K.
- https://cdn.elifesciences.org/articles/66118/elife-66118-fig3-data1-v2.xlsx
Figure 3—figure supplement 1
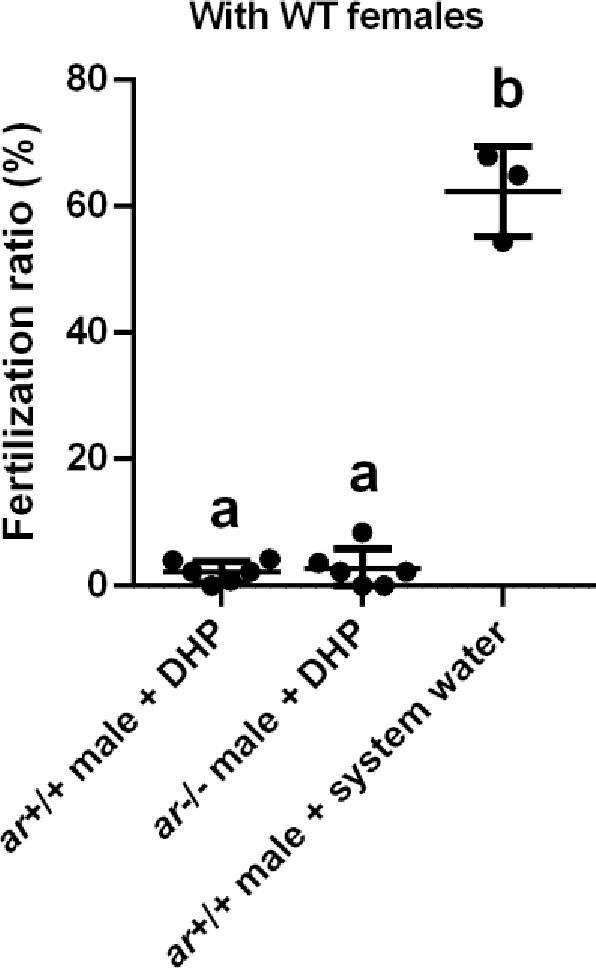
The fertilization ratio analysis.
The fertilization ratios of ar+/+ males and ar-/- males after the 17α,20β-dihydroxy-4-pregnen-3-one (DHP) treatment, and ar+/+ males reared in the system water at 3 months post-fertilization (mpf) were assessed by artificial fecundation with wild-type (WT) females.
-
Figure 3—figure supplement 1—source data 1
The fertilization ratios meatured of wildtype males and ar-/- males after DHP treatments.
- https://cdn.elifesciences.org/articles/66118/elife-66118-fig3-figsupp1-data1-v2.xlsx
Figure 4
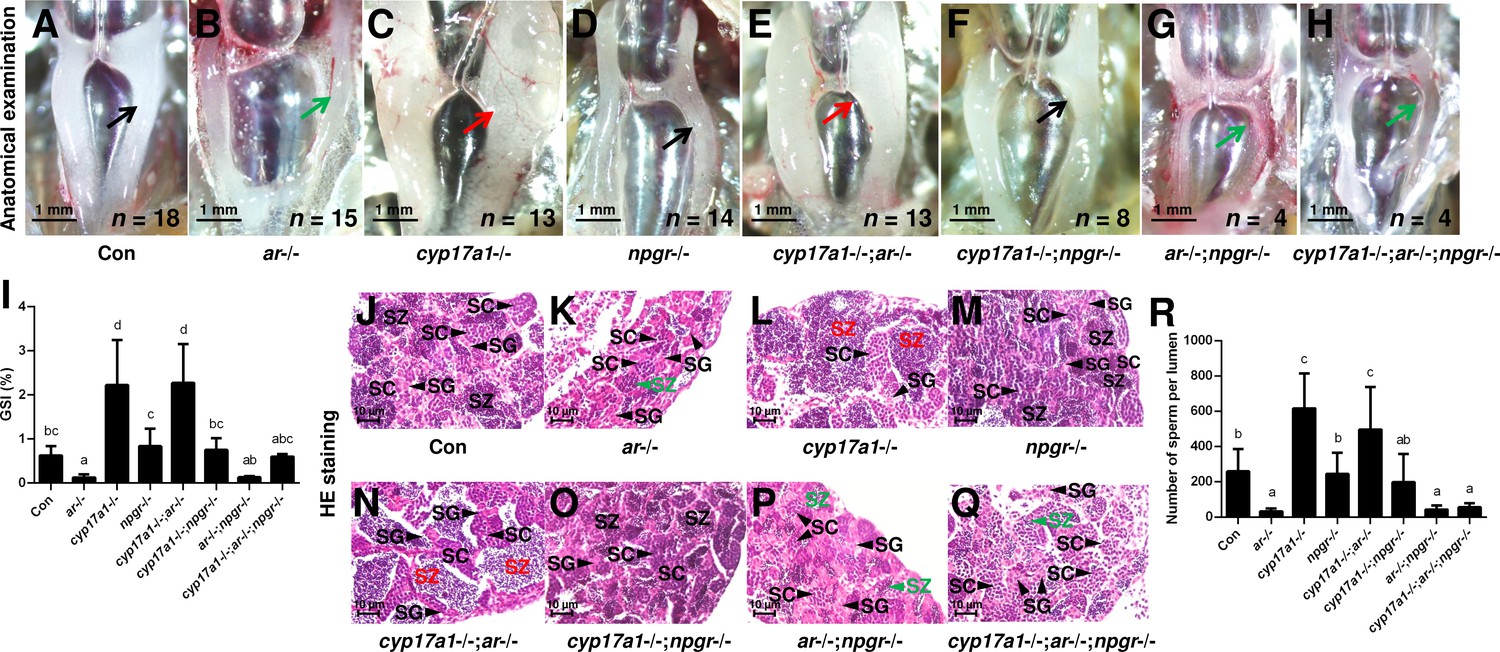
The alternative compensatory pathway induced by cyp17a1 depletion is npgr-dependent.
(A–H) Anatomical examination of the testes of control males, ar-/- males, cyp17a1-/- fish, npgr-/- males, cyp17a1-/-;ar-/- fish, cyp17a1-/-;npgr-/- fish, ar-/-;npgr-/- males, and cyp17a1-/-;ar-/-;npgr-/- fish at 6 months post-fertilization (mpf). Black and green arrows indicate the normal and impaired testis in control males, ar-/- males, npgr-/- males, cyp17a1-/-;npgr-/- fish, ar-/-;npgr-/- males, and cyp17a1-/-;ar-/-;npgr-/- fish, respectively, whereas the red arrows indicate the hypertrophic testis in the cyp17a1-/- fish and cyp17a1-/-;ar-/- fish. (I) Gridpoint Statistical Interpolation (GSI) from the fish of the eight genotypes at 6 mpf. (J–Q) Histological analyses of the testes from the fish of the eight genotypes at 6 mpf. Black and green letters indicate the normal and decreased number of spermatozoa (SZ) in control males, ar-/- males, npgr-/- males, cyp17a1-/-;npgr-/- fish, ar-/-;npgr-/- males, and cyp17a1-/-;ar-/-;npgr-/- fish, respectively, whereas the red letters of SZ indicate the increased number of SZ in the cyp17a1-/- fish and cyp17a1-/-;ar-/- fish. (R) Statistical analysis of the SZ number in each lumen of seminiferous tubules from the fish of the eight genotypes at 6 mpf. The letters in the bar charts (I) and (R) represent significant differences. SC: spermatocytes; SG: spermatogonia.
-
Figure 4—source data 1
GSI values for Figure 4I; number of sperm per lumen for Figure 4R.
- https://cdn.elifesciences.org/articles/66118/elife-66118-fig4-data1-v2.xlsx
Figure 5
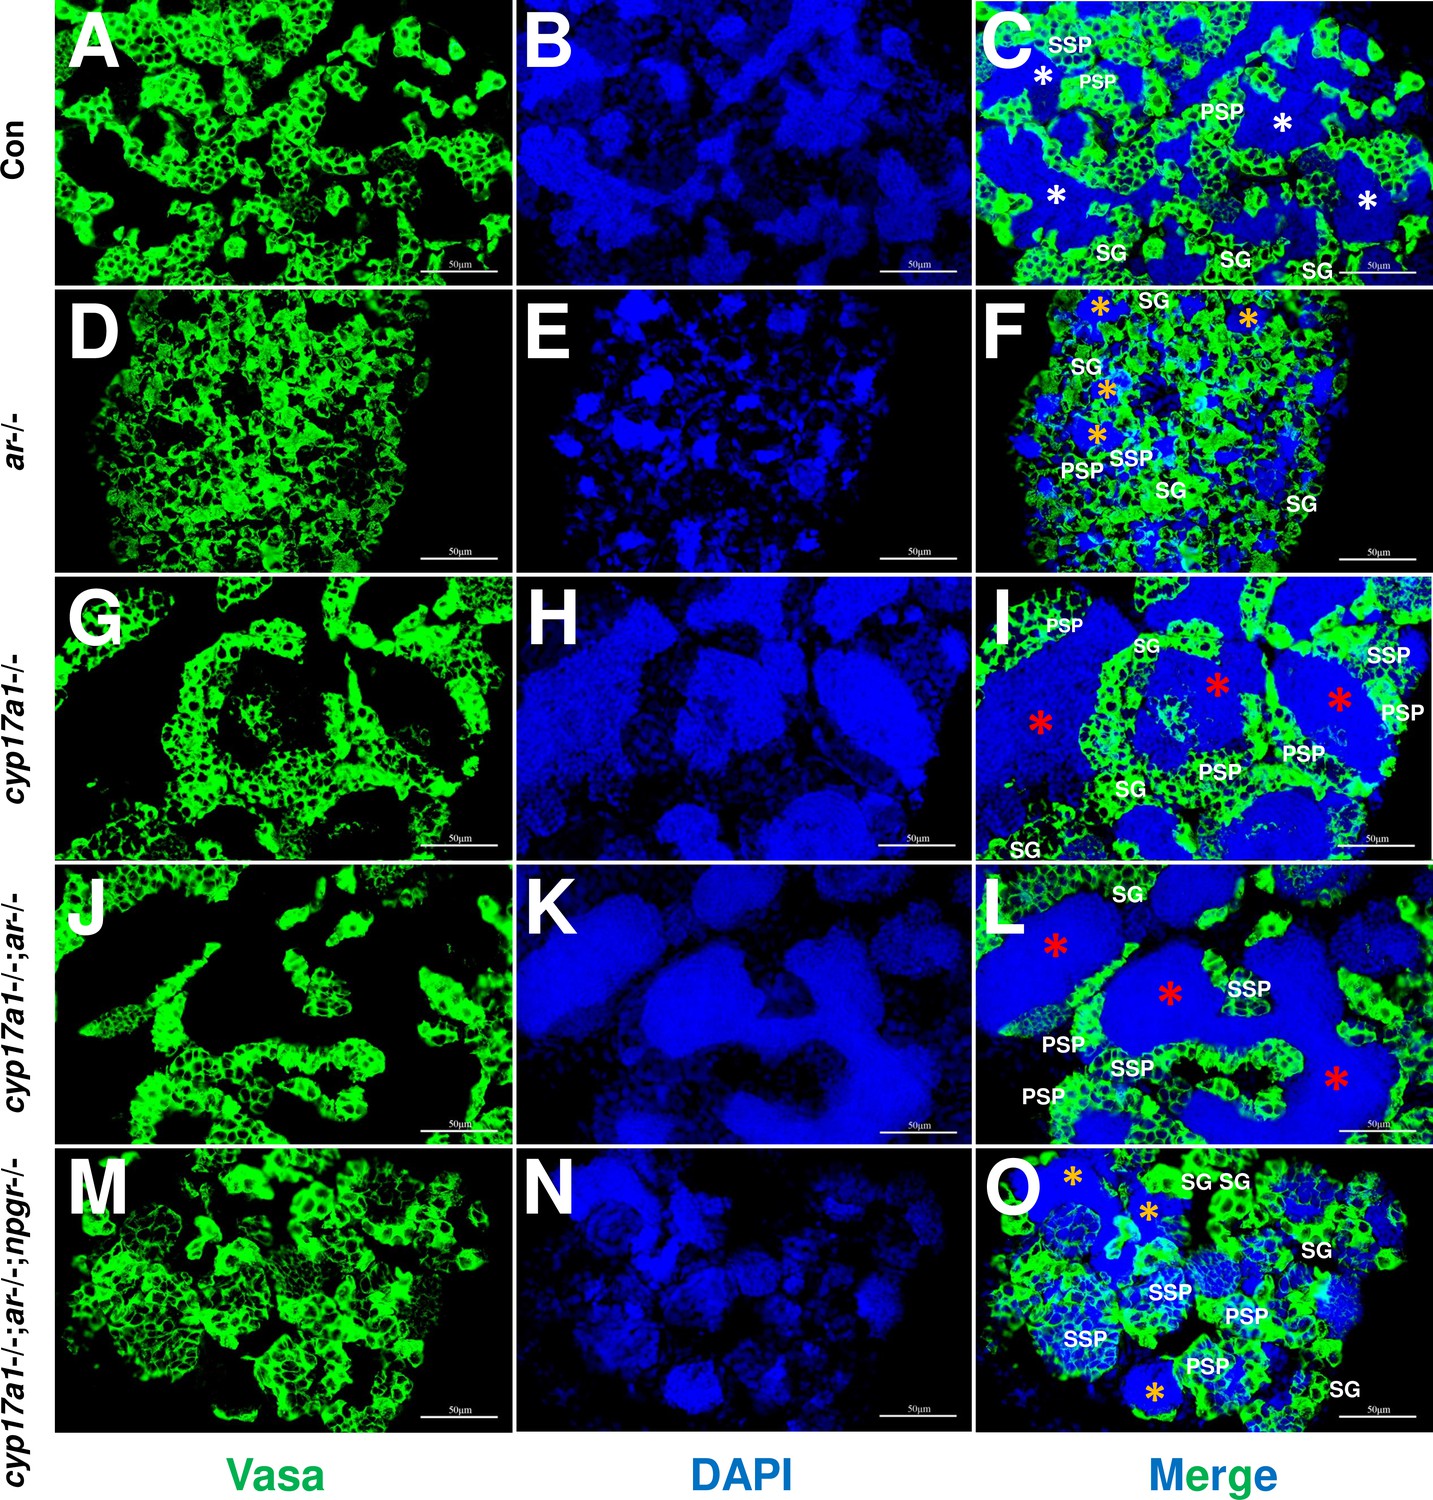
Germ cells were visualized by immunofluorescence staining of Vasa.
(A–C) Control male. (D–F) ar-/- male. (G–I) cyp17a1-/- fish. (J–L) cyp17a1-/-;ar-/- fish. (M–O) cyp17a1-/-;ar-/-;npgr-/- fish. Nuclear DNA was stained with 4',6-diamidino-2-phenylindole (DAPI). White and yellow asterisks in panels (C), (F), and (O) indicate the normal and decreased number of spermatozoa (SZ), respectively, whereas the red asterisks in panels (I) and (L) indicate the increased number of SZ in each lumen of seminiferous tubule. SG: spermatogonia; PSP: primary spermatocyte; SSP: secondary spermatocyte.
Figure 6 with 3 supplements
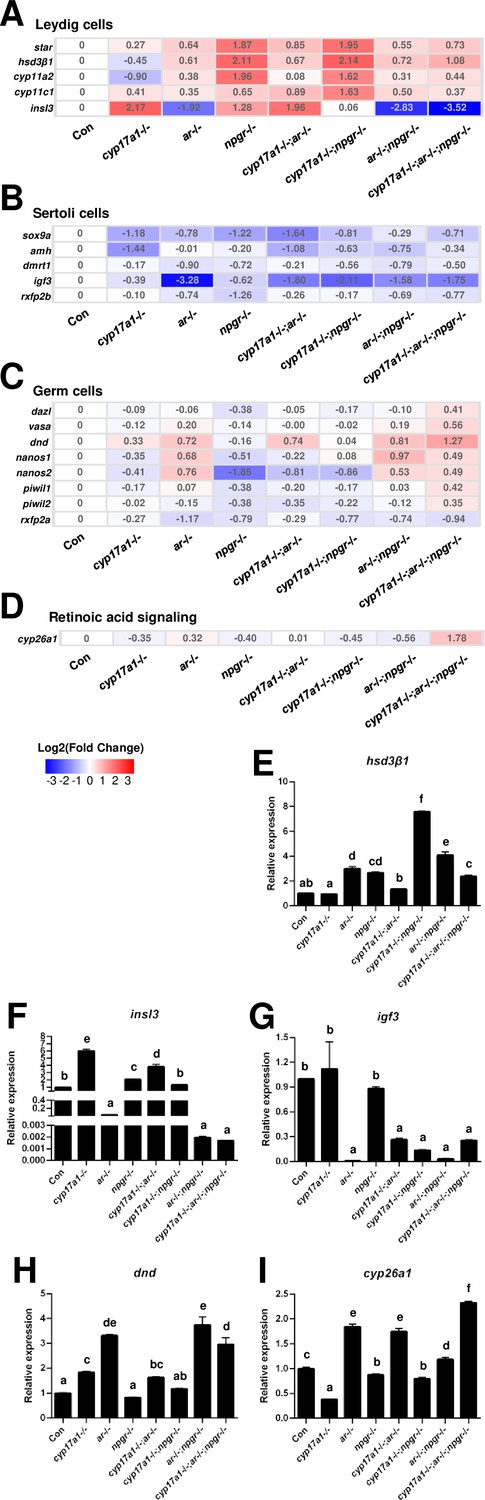
Gene expression analyses of testis Leydig cells, Sertoli cells, and germ cells.
(A–D) Heatmap of the candidate genes. (A) The heatmap of star, hsd3β1, cyp11a2, cyp11c1, and insl3 of Leydig cells. (B) The heatmap of sox9a, amh, dmrt1, igf3, and rxfp2b of Sertoli cells. (C) The heatmap of dazl, vasa, dnd, nanos1, nanos2, piwil1, piwil2, and rxfp2a (another receptor of Insl3) of germ cells. (D) The expression of the retinoic acid-degrading enzyme, cyp26a1. (E–H) The expression of the selected genes with qPCR for confirmation of transcriptome analyses. (E) hsd3β1. (F) insl3. (G) igf3. (H) dnd. (I) cyp26a1. The letters in the bar charts represent significant differences.
-
Figure 6—source data 1
Real-time RT PCR results for Figure 6E-I.
- https://cdn.elifesciences.org/articles/66118/elife-66118-fig6-data1-v2.xlsx
Figure 6—figure supplement 1
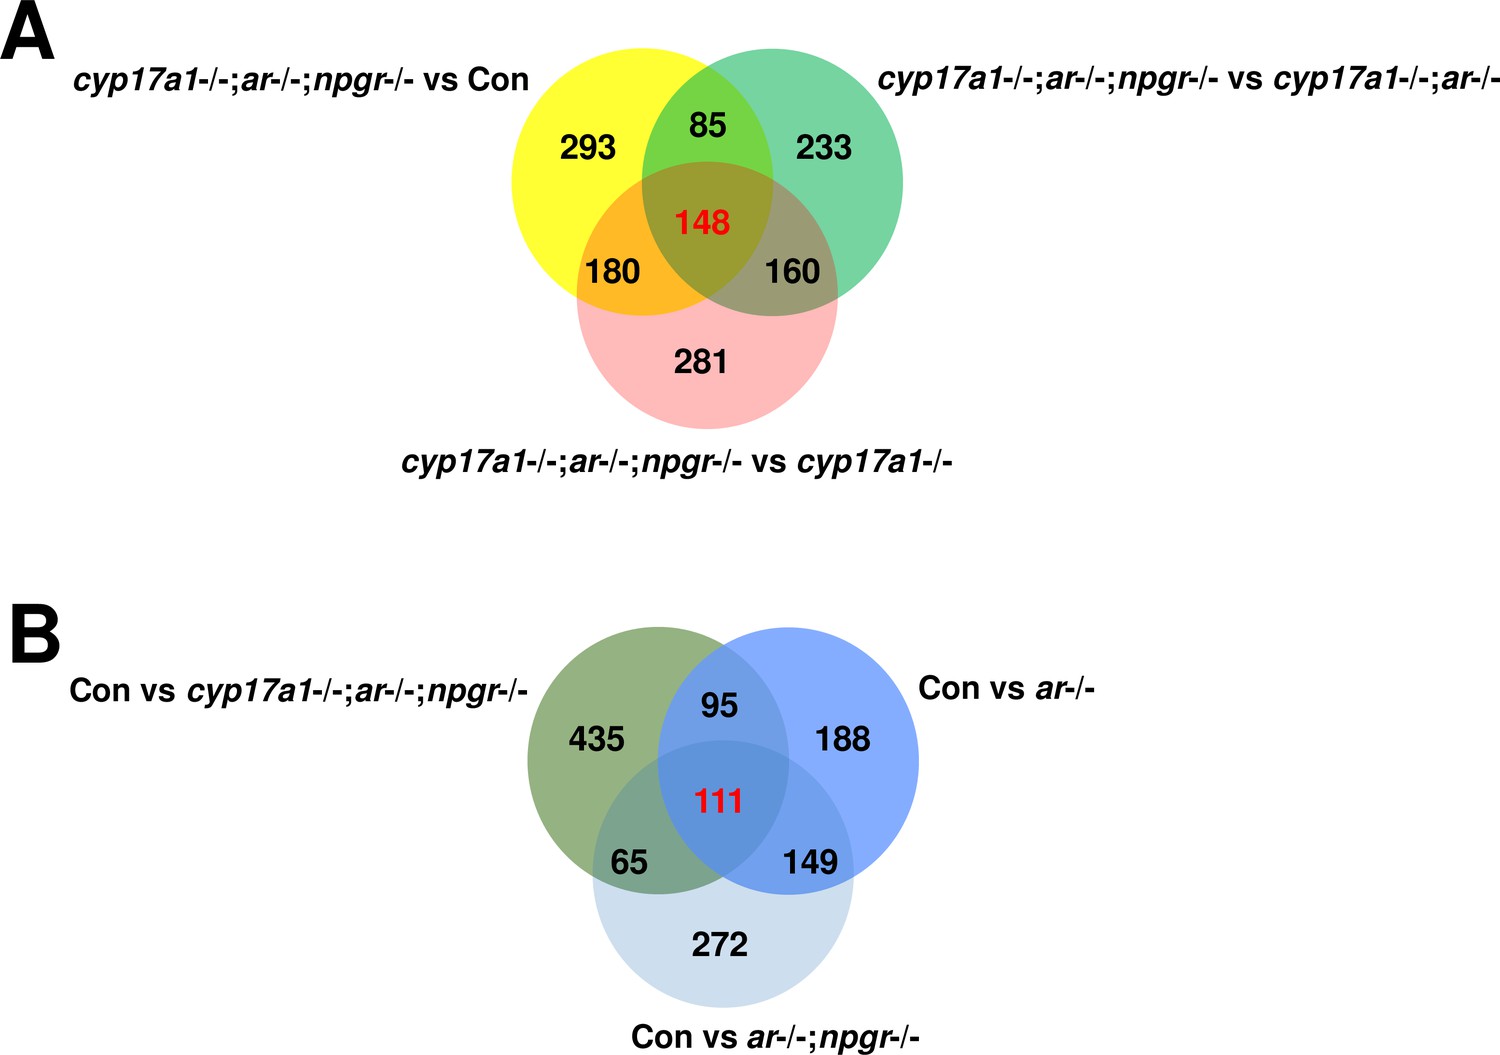
Venn diagram of gene expression profiles in testes.
(A) The comparison of the dataset between cyp17a1-/-;ar-/-;npgr-/- fish and control males, cyp17a1-/-;ar-/- fish, and cyp17a1-/- fish, respectively. (B) The comparison of the dataset between control males and ar-/- males, ar-/-;npgr-/- males, and cyp17a1-/-;ar-/-;npgr-/- fish, respectively. The number represents the genes that were differentially expressed (p<0.05). The number highlighted in red represents the genes that were differentially expressed (p<0.05) in the three comparison groups. The numbers shown in black represent the genes that were differentially expressed (p<0.05) in only one or two comparison groups. The lists of the differentially expressed genes in the overlapped region are available in Supplementary file 1.
Figure 6—figure supplement 2

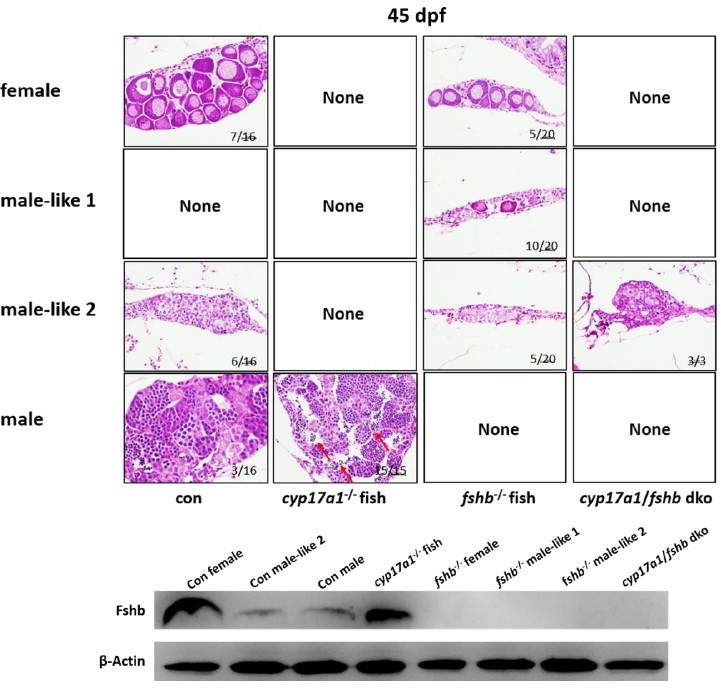
The upregulated fshβ contributes to the hypertrophic testis and enhanced spermatogenesis in the cyp17a1-/- fish and cyp17a1-/-;ar-/- fish at 6 months post-fertilization (mpf).
(A–E) Anatomical examination of the testes from control males, ar-/- males, cyp17a1-/- fish, cyp17a1-/-;ar-/- fish, and cyp17a1-/-;ar-/-;fshβ-/- fish at 6 mpf. Black and green arrows indicate the normal and decreased size of testes in control males and cyp17a1-/-;ar-/-;fshβ-/- fish, and ar-/- males, respectively, whereas the red arrows indicate the hypertrophic testis in the cyp17a1-/- fish and cyp17a1-/-;ar-/- fish. (F) Gridpoint Statistical Interpolation (GSI) from fish of the five genotypes at 6 mpf. The letters in bar chart (F) represent significant differences. (G–K) Histological analyses of the testes from control males, ar-/- males, cyp17a1-/- fish, cyp17a1-/-;ar-/- fish, and cyp17a1-/-;ar-/-;fshβ-/- fish at 6 mpf. Black and green letters indicate the normal and decreased number of spermatozoa (SZ) in control males and cyp17a1-/-;ar-/-;fshβ-/- fish, and ar-/- males, respectively, whereas the red letters indicate the increased number of SZ in the cyp17a1-/- fish and cyp17a1-/-;ar-/- fish.
-
Figure 6—figure supplement 2—source data 1
The GSI values for Figure 6—figure supplement 2F.
- https://cdn.elifesciences.org/articles/66118/elife-66118-fig6-figsupp2-data1-v2.xlsx
Figure 6—figure supplement 3
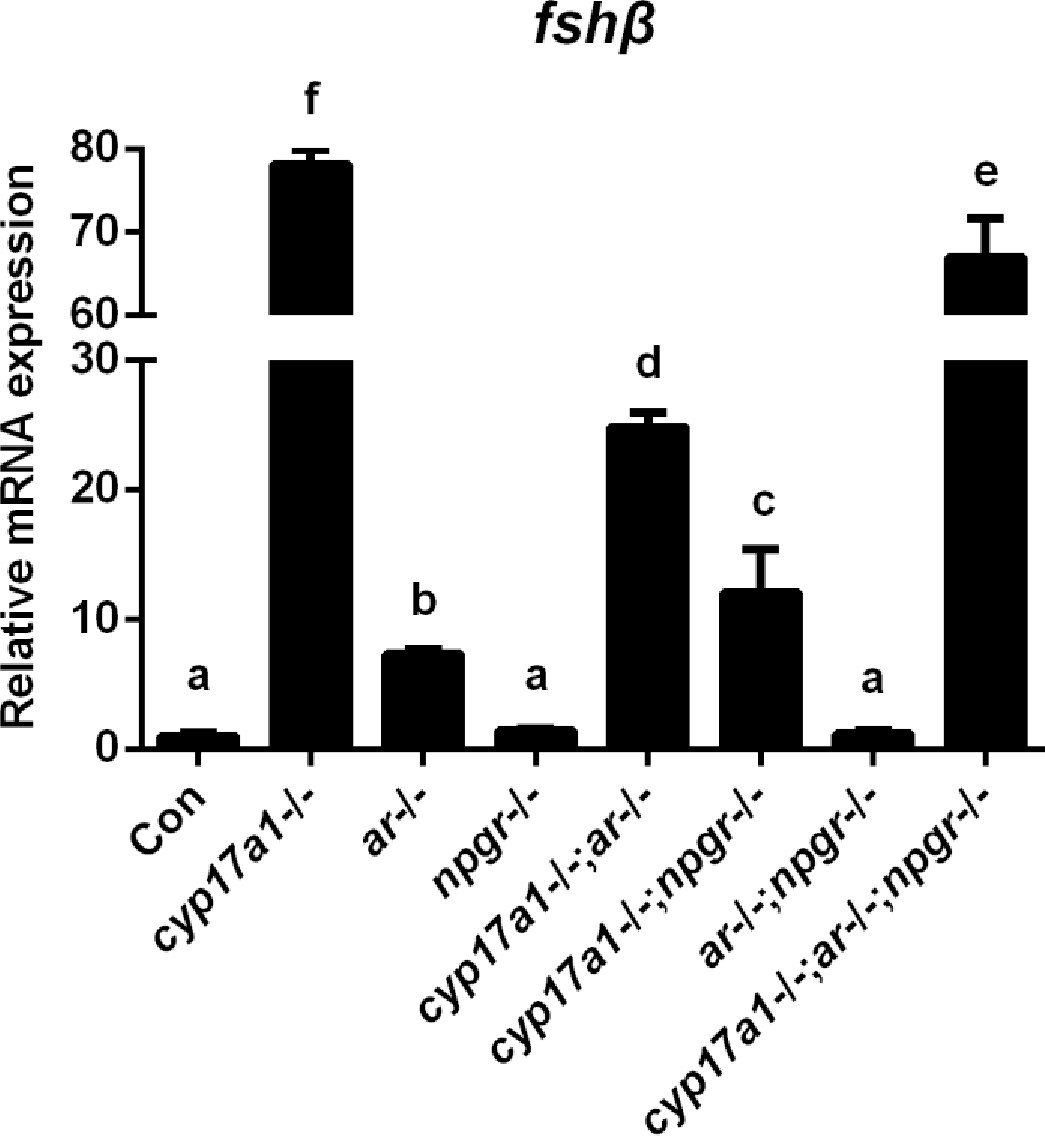
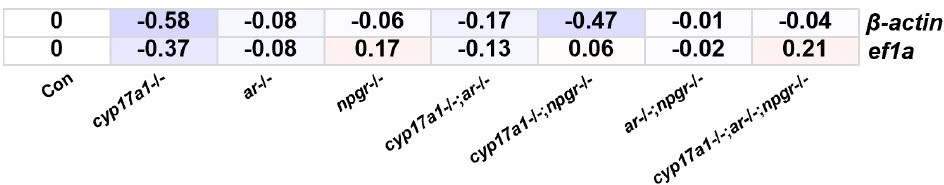
Expression analysis of pituitary fshβ in the control males, cyp17a1-/- fish, ar-/- males, npgr-/- males, cyp17a1-/-;ar-/- fish, cyp17a1-/-;npgr-/- fish, ar-/-;npgr-/- males, and cyp17a1-/-;ar-/-;npgr-/- fish at 6 months post-fertilization (mpf). The letters in the bar chart represent significant differences.
-
Figure 6—figure supplement 3—source data 1
Real-time PCR results of pituitary fshbeta transcriptional levels in zebrafish of various genotypes.
- https://cdn.elifesciences.org/articles/66118/elife-66118-fig6-figsupp3-data1-v2.xlsx
Figure 7
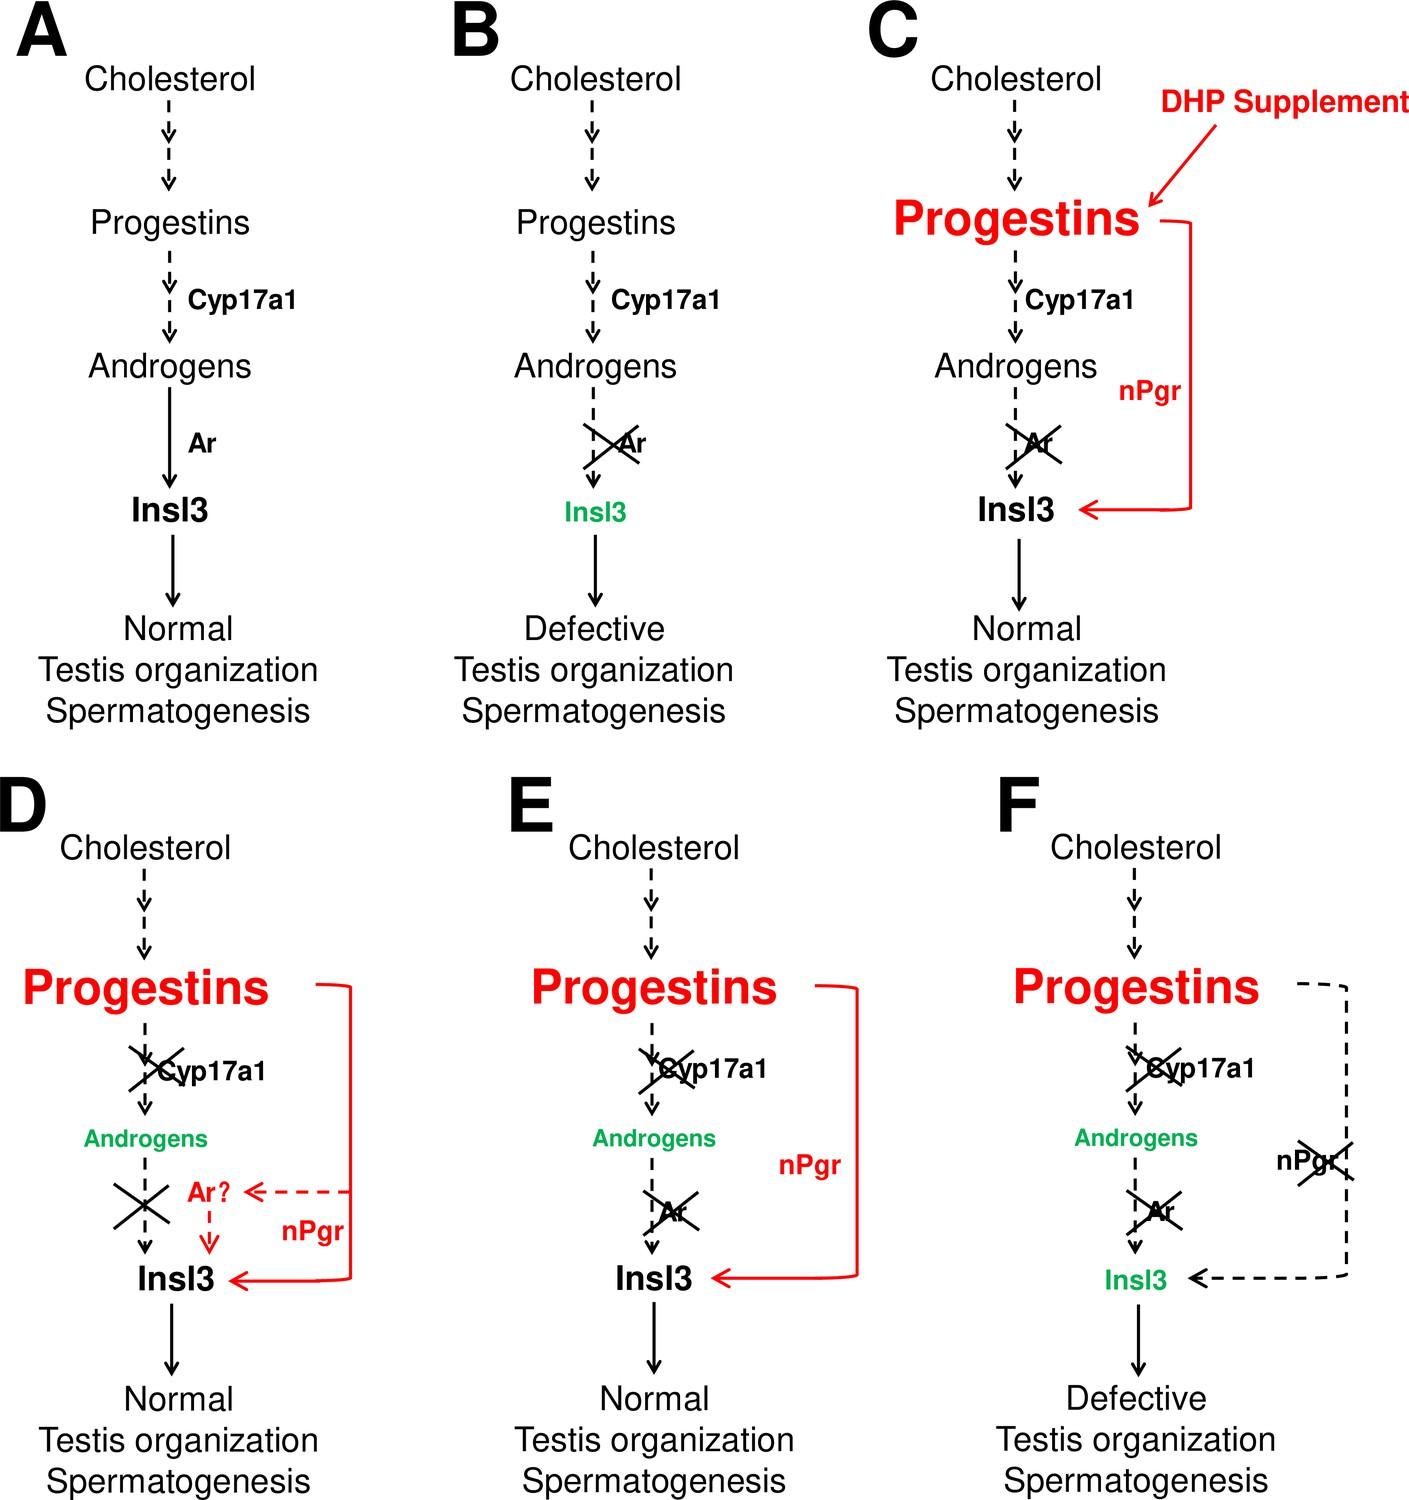
The potential regulatory network of androgens and progestins regulating testis organization and spermatogenesis via Insl3.
(A) Androgen signaling is essential in promoting testis organization and spermatogenesis in the control males. (B) Testis organization and spermatogenesis is impaired in the ar-/- males. (C) The impaired testis organization and spermatogenesis in the ar-/- males could be rescued by 17α,20β-dihydroxy-4-pregnen-3-one (DHP) supplement. (D) Testis organization and spermatogenesis proceeded normally in the cy17a1-/- fish, resulting from the enhanced progestin signaling caused by cyp17a1 depletion. (E) The alternative compensatory pathway induced by cyp17a1 depletion is ar-independent. (F) The alternative compensatory pathway induced by cyp17a1 depletion is npgr-dependent, demonstrating a high progestin/nuclear progestin receptor (nPgr) signaling pathway in promoting testis organization and spermatogenesis independent of androgen signaling. Red letters and lines indicate the upregulation of the progestin/nPgr signaling pathway, while green letters indicate the decreased concentration of androgens or downregulated insl3. The dotted lines indicate the brief description with omission or the potential existence of the proposed model.
Author response image 1
Author response image 2
Tables
Key resources table
| Reagent type (species) or resource | Designation | Source or reference | Identifiers | Additional information |
|---|---|---|---|---|
| Genetic reagent (Danio rerio) | cyp17a1 knockout | PMID:30202919 | RRID:ZFIN_ZDB-GENO-191029-6 | Dr. Zhan Yin (Institute of Hydrobiology, Chinese Academy of Sciences) |
| Genetic reagent (D. rerio) | fshβ knockout | PMID:30202919 | RRID:ZFIN_ZDB-GENO-191029-7 | Dr. Zhan Yin (Institute of Hydrobiology, Chinese Academy of Sciences) |
| Genetic reagent (D. rerio) | ar knockout | PMID:29849943 | RRID:ZFIN_ZDB-GENO-190307-7 | Dr. Wuhan Xiao (Institute of Hydrobiology, Chinese Academy of Sciences) |
| Genetic reagent (D. rerio) | npgr knockout | PMID:27333837 | RRID:ZFIN_ZDB-GENO-170907-1 | Dr. Xiaochun Liu (Sun Yat-Sen University) |
| Chemical compound, drug | 11-KT | Efebio | Cat# E092432 | |
| Chemical compound, drug | DHP | TRC | Cat# P712080 | |
| Chemical compound, drug | P4 | Aladdin | Cat# P106426 | |
| Chemical compound, drug | DMSO | Sigma-Aldrich | Cat# D2650 | |
| Chemical compound, drug | TRIzol reagent | Ambion | Cat# 15596 | |
| Commercial assay or kit | T ELISA kit | Cayman Chemicals | Cat# 582701 | |
| Commercial assay or kit | 11-KT ELISA kit | Cayman Chemicals | Cat# 582751 | |
| Commercial assay or kit | First-strand cDNA synthesis kit | Fermentas | Cat# K1621 | |
| Antibody | Anti-Vasa (rabbit polyclonal) | GeneTex | Cat# GTX128306 | RRID:AB_2847856IF: (1:500) |
Table 1
Primers for qPCR used in this study.
| Gene | Primer direction and sequence (5′–3′) | Reference |
|---|---|---|
| hsd3β1 | F: GATCCGACTGCTGGATAGAAACA | Crespo et al., 2021 |
| R: CCCGGCAATCATCAAGAGA | ||
| insl3 | F: CGGACGGTGGTCGCATCGTG | Zhai et al., 2018 |
| R: CTCTCTGGTGCACAACGAG | ||
| igf3 | F: CCAGGATTCATGCTGAAGGTG | Zhai et al., 2018 |
| R: CTACGAGCTGCTCCAGGTTTG | ||
| dnd | F: TCGTGGAAGCTTTTCGGAACCGG | Lin et al., 2017 |
| R: TGTCCTCGACGCGCTTGGAC | ||
| cyp26a1 | F: TGGGCTTGCCGTTCATTG | Crespo et al., 2021 |
| R: CATGCGCAGAAACTTCCTTCTC | ||
| ef1a | F: GCCGTCCCACCGACAAG | Crespo et al., 2021 |
| R: CCACACGACCCACAGGTACAG |
-
F = forward; R = reverse.
Additional files
-
Supplementary file 1
The gene list and basemean of the total of 148 differentially expressed genes in the overlapped region of the Venn diagram.
(a) The gene list and basemean of the total of 148 differentially expressed genes in the overlapped region of the Venn diagram. (b) The gene list and basemean of the total of 111 differentially expressed genes in the overlapped region of the Venn diagram.
- https://cdn.elifesciences.org/articles/66118/elife-66118-supp1-v2.docx
-
Transparent reporting form
- https://cdn.elifesciences.org/articles/66118/elife-66118-transrepform1-v2.docx
Download links
A two-part list of links to download the article, or parts of the article, in various formats.
Downloads (link to download the article as PDF)
Open citations (links to open the citations from this article in various online reference manager services)
Cite this article (links to download the citations from this article in formats compatible with various reference manager tools)
Augmentation of progestin signaling rescues testis organization and spermatogenesis in zebrafish with the depletion of androgen signaling
eLife 11:e66118.
https://doi.org/10.7554/eLife.66118


