Integrated evaluation of telomerase activation and telomere maintenance across cancer cell lines
- Broad Institute of MIT and Harvard, United States
- Division of Hematology/Oncology, Department of Medicine; Bakar Computational Health Sciences Institute; Institute for Human Genetics; University of California, San Francisco, United States
- Helen Diller Family Comprehensive Cancer Center, United States
Figures
Figure 1 with 5 supplements
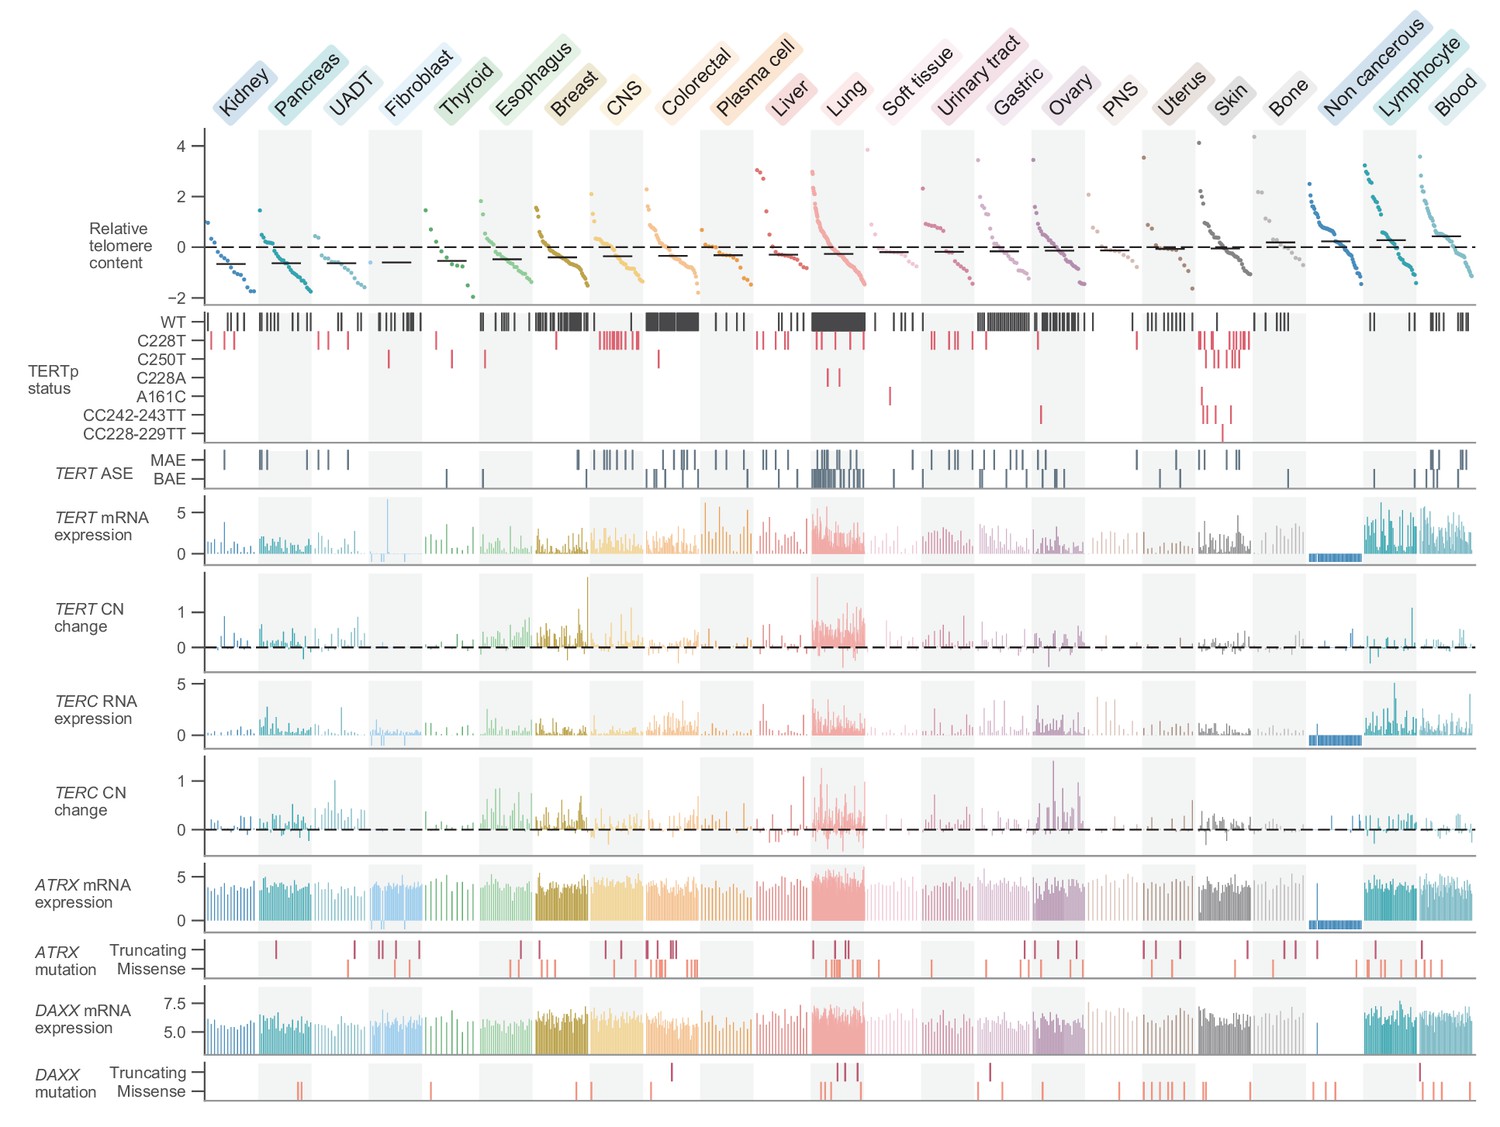
Telomere content and related genomic features across human cell lines.
Cell lines were grouped by cancer type and ordered by telomere content within each type, and are displayed such that each column represents a cell line. Telomere content measurements reflect combined z-scored estimates derived from CCLE WGS and GDSC WES with means for samples with telomere content estimates from both sources. Bars within each cancer type represent medians. Relative copy number values are shown as log2(relative to ploidy + 1)–1. Cell lines shown are filtered such in addition to annotations for telomere content, values for TERT and TERC RNA-seq expression, TERT and TERC copy number, and ATRX and DAXX mutation status are all available (with an exception made for non-cancerous cell lines, which lack such profiling in DepMap). Cell lines were also filtered such that each cancer type is represented by at least 10 cell lines (n = 738 cell lines total). RNA expression estimates are in terms of log2(TPM+1). CNS: central nervous system; PNS, peripheral nervous system; UADT, upper aerodigestive tract.
Figure 1—figure supplement 1
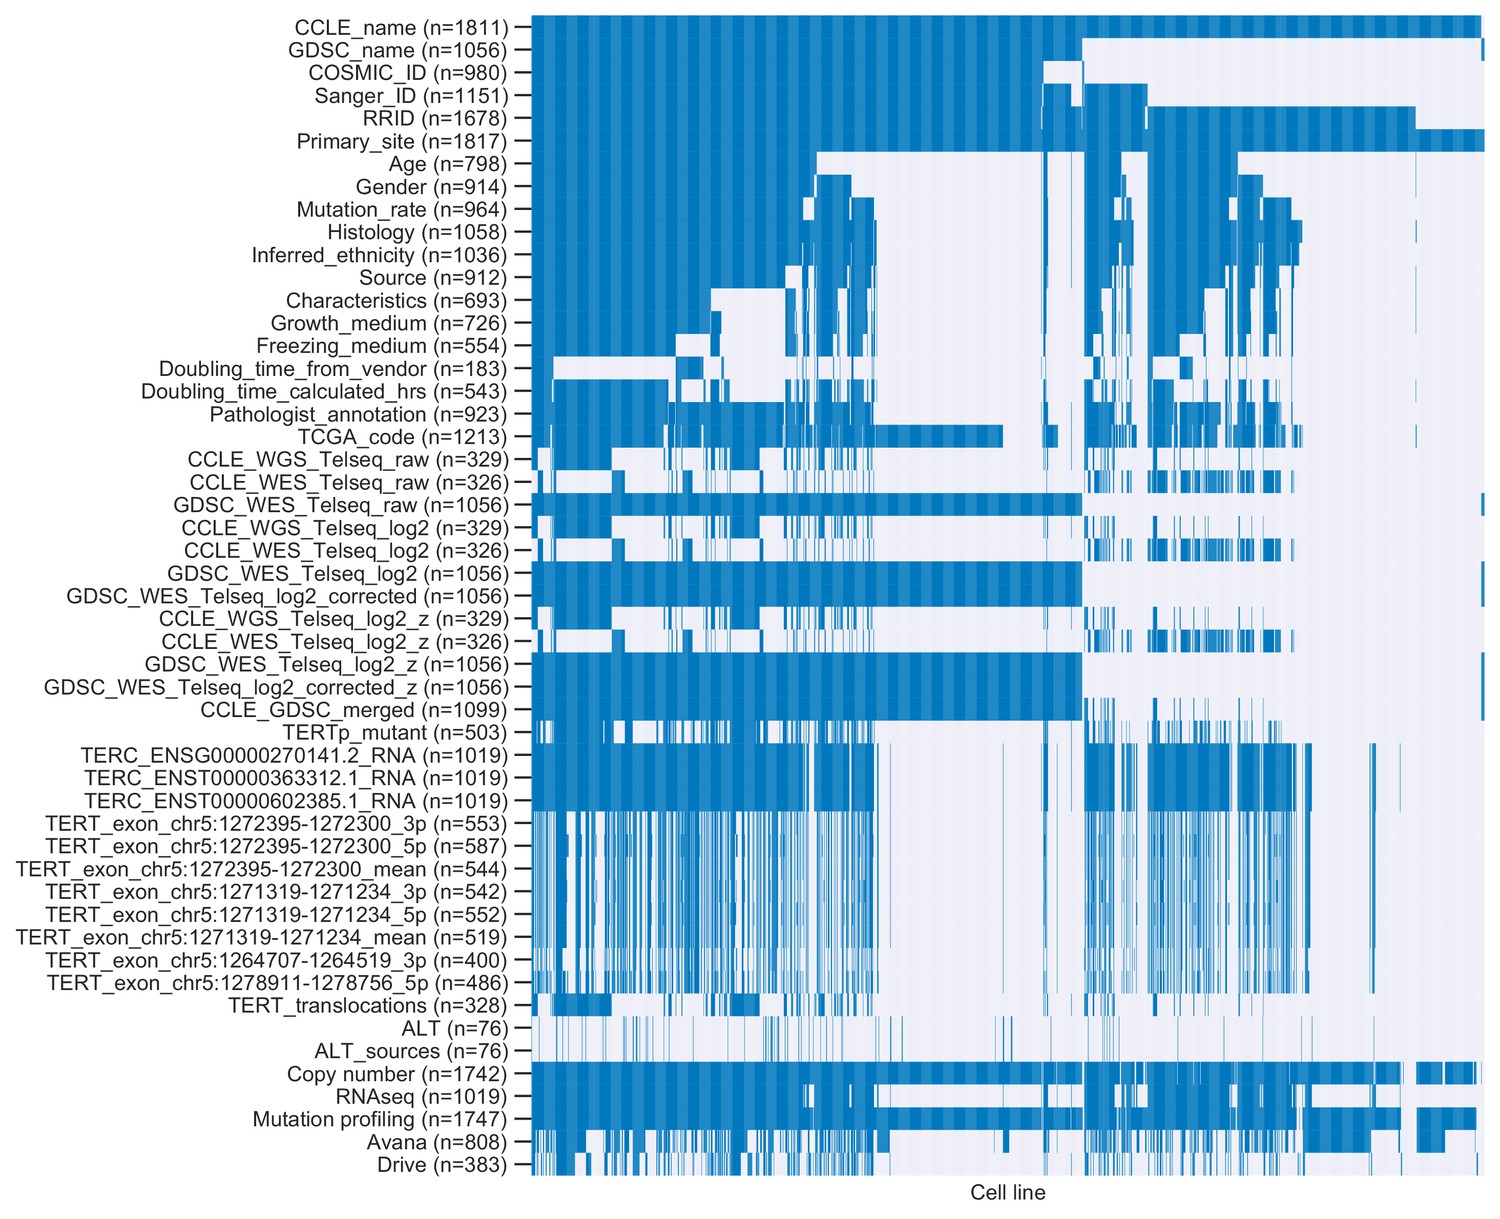
Overlap between cell lines represented in annotations.
Heatmap of cell lines (columns) and annotations (rows). Colored cells indicate cell lines profiled for specific annotations, and gray cells indicate cell lines missing annotations.
Figure 1—figure supplement 2
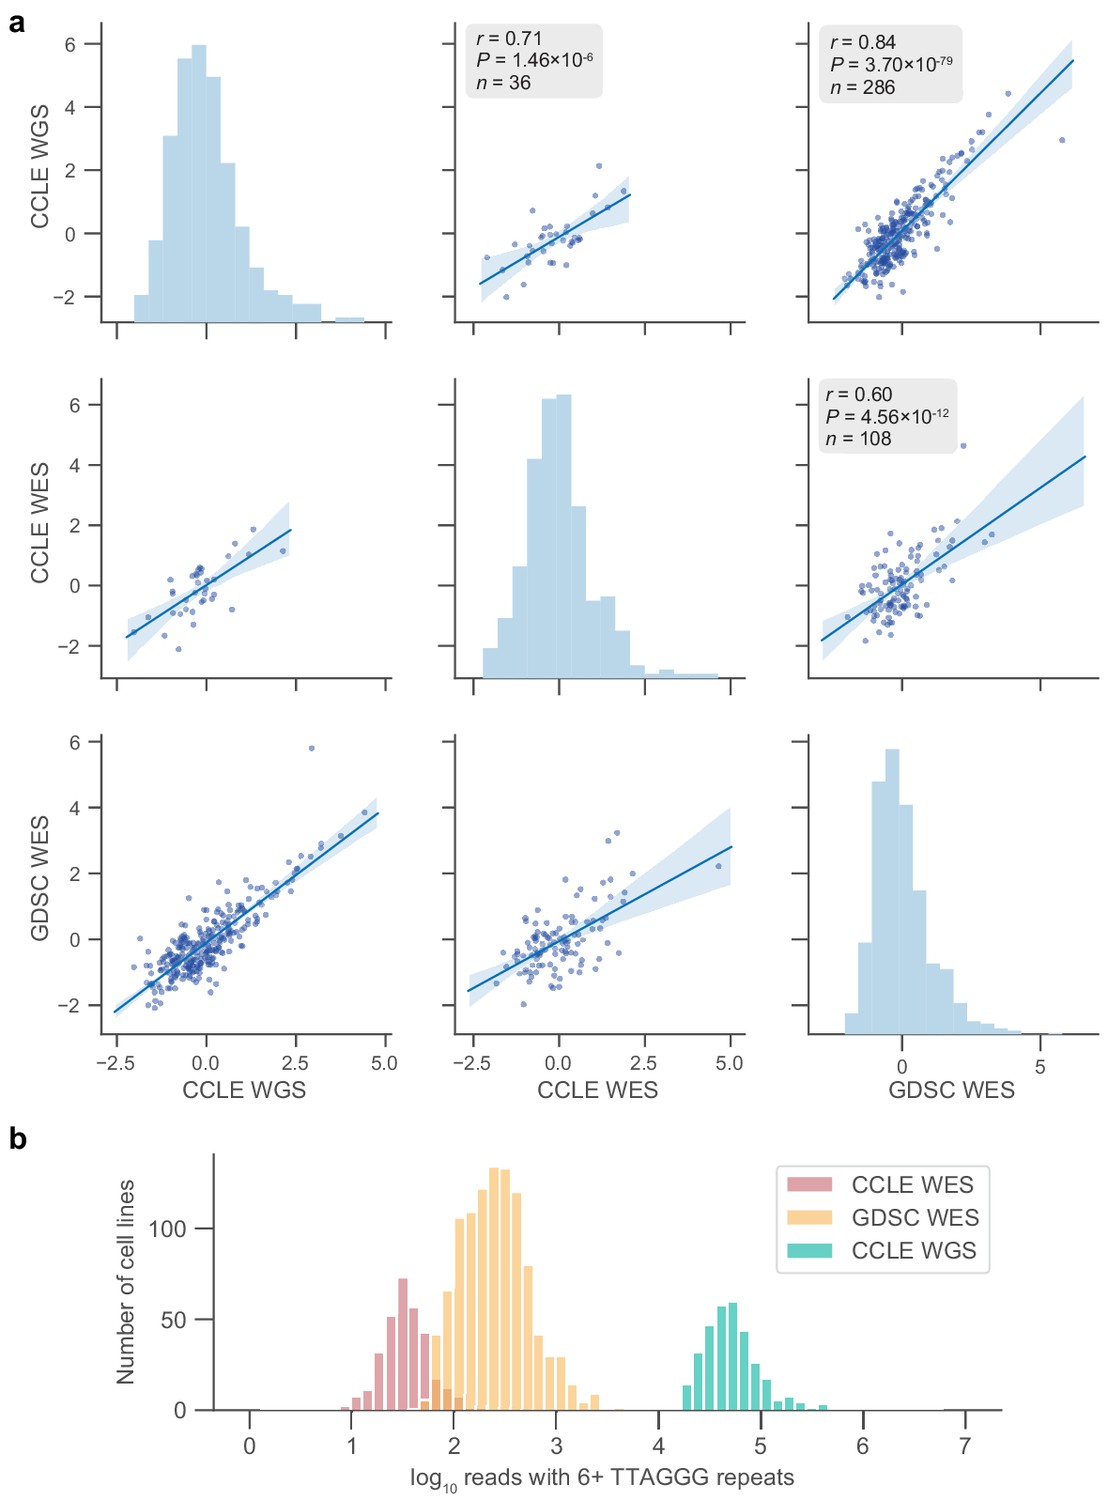
Telomere content agreement between sequencing sets.
(a) Pairwise correlations between cell lines in overlaps of the indicated sequencing sets. Telomere content estimates are displayed as z-scored values of log2-transformed raw content estimates. p Values determined by two-sided Pearson’s correlation test. (b) Distribution of counts for reads with six or more telomeric repeats across samples in the three sequencing datasets used.
Figure 1—figure supplement 3
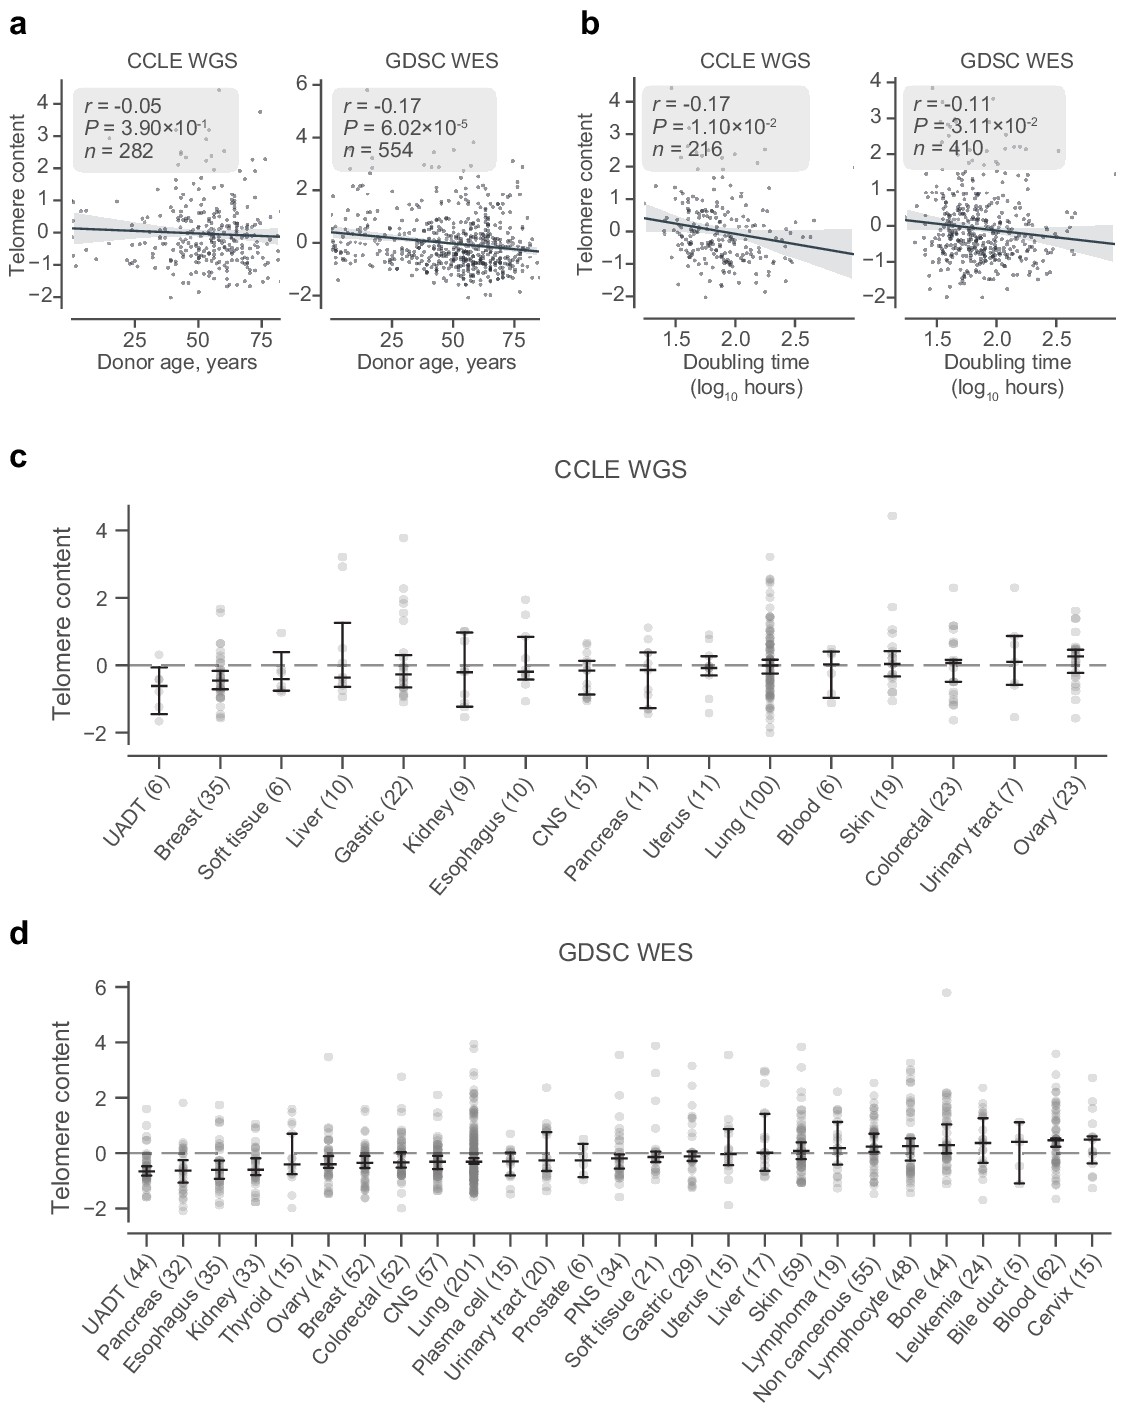
Telomere content, age, and tissue subtype.
(a) Correlation between donor age and z-scored and log2 transformed telomere content estimates from CCLE WGS (left) and GDSC WES (right) telomere content estimates as labeled. (b) Correlation between doubling time and z-scored and log2 transformed telomere content estimates from CCLE WGS (left) and GDSC WES (right) telomere content estimates as labeled. (c and d) Distribution of z-scored log2-transformed telomere content estimates across origin tissue subtypes of the CCLE WGS and GDSC WES datasets, respectively. Tissue subtypes with less than five samples are omitted. Bars denote bootstrapped 95% confidence intervals, with central lines denoting means. CNS, central nervous system; PNS, peripheral nervous system; UADT, upper aerodigestive tract.
Figure 1—figure supplement 4
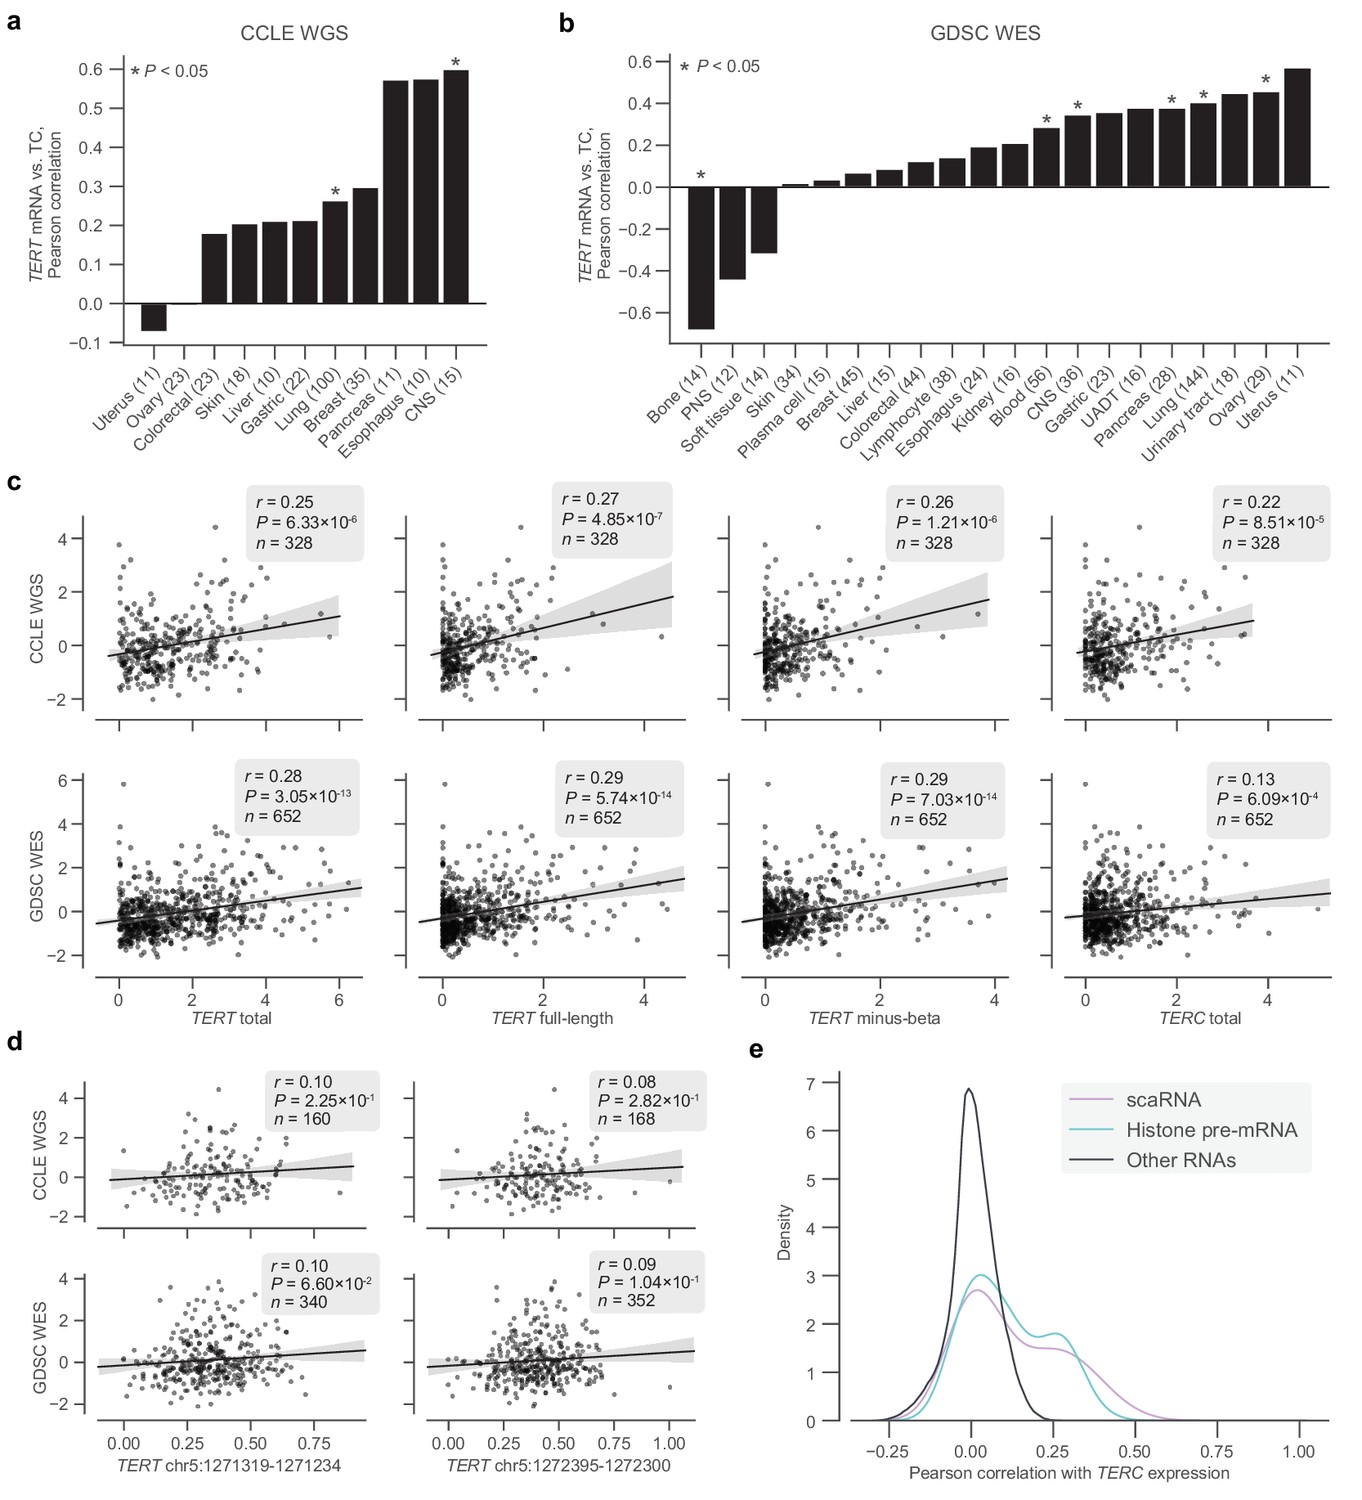
Transcriptomic associations between TERT, TERC, and telomere content.
(a and b) Pearson correlations between log2(TPM + 1) levels of TERT mRNA and telomere content within tissue subtypes in the CCLE WGS and GDSC WES datasets, respectively. CNS, central nervous system; PNS, peripheral nervous system; UADT, upper aerodigestive tract. (c) Associations between total TERT (ENSG00000164362.14) mRNA, full-length TERT (ENST00000310581.5) mRNA, minus-beta TERT (ENST00000296820.5) mRNA, TERC (ENSG00000270141.2) RNA, and z-scored log2-transformed telomere content estimates in the CCLE WGS and GDSC WES datasets. mRNA expression measured as log2-transformed TPMs with a pseudocount of +1. (d) Associations between exon inclusion levels of TERT exons 7 (GRCh37: chr5:1272395–1272300) and 8 (GRCh37: chr5:1271319–1271234) and telomere contents as described previously. (e) Distribution of correlations between TERC RNA levels and other RNAs (n = 1,019 cell lines), with scaRNAs and histone pre-mRNAs highlighted.
Figure 1—figure supplement 5
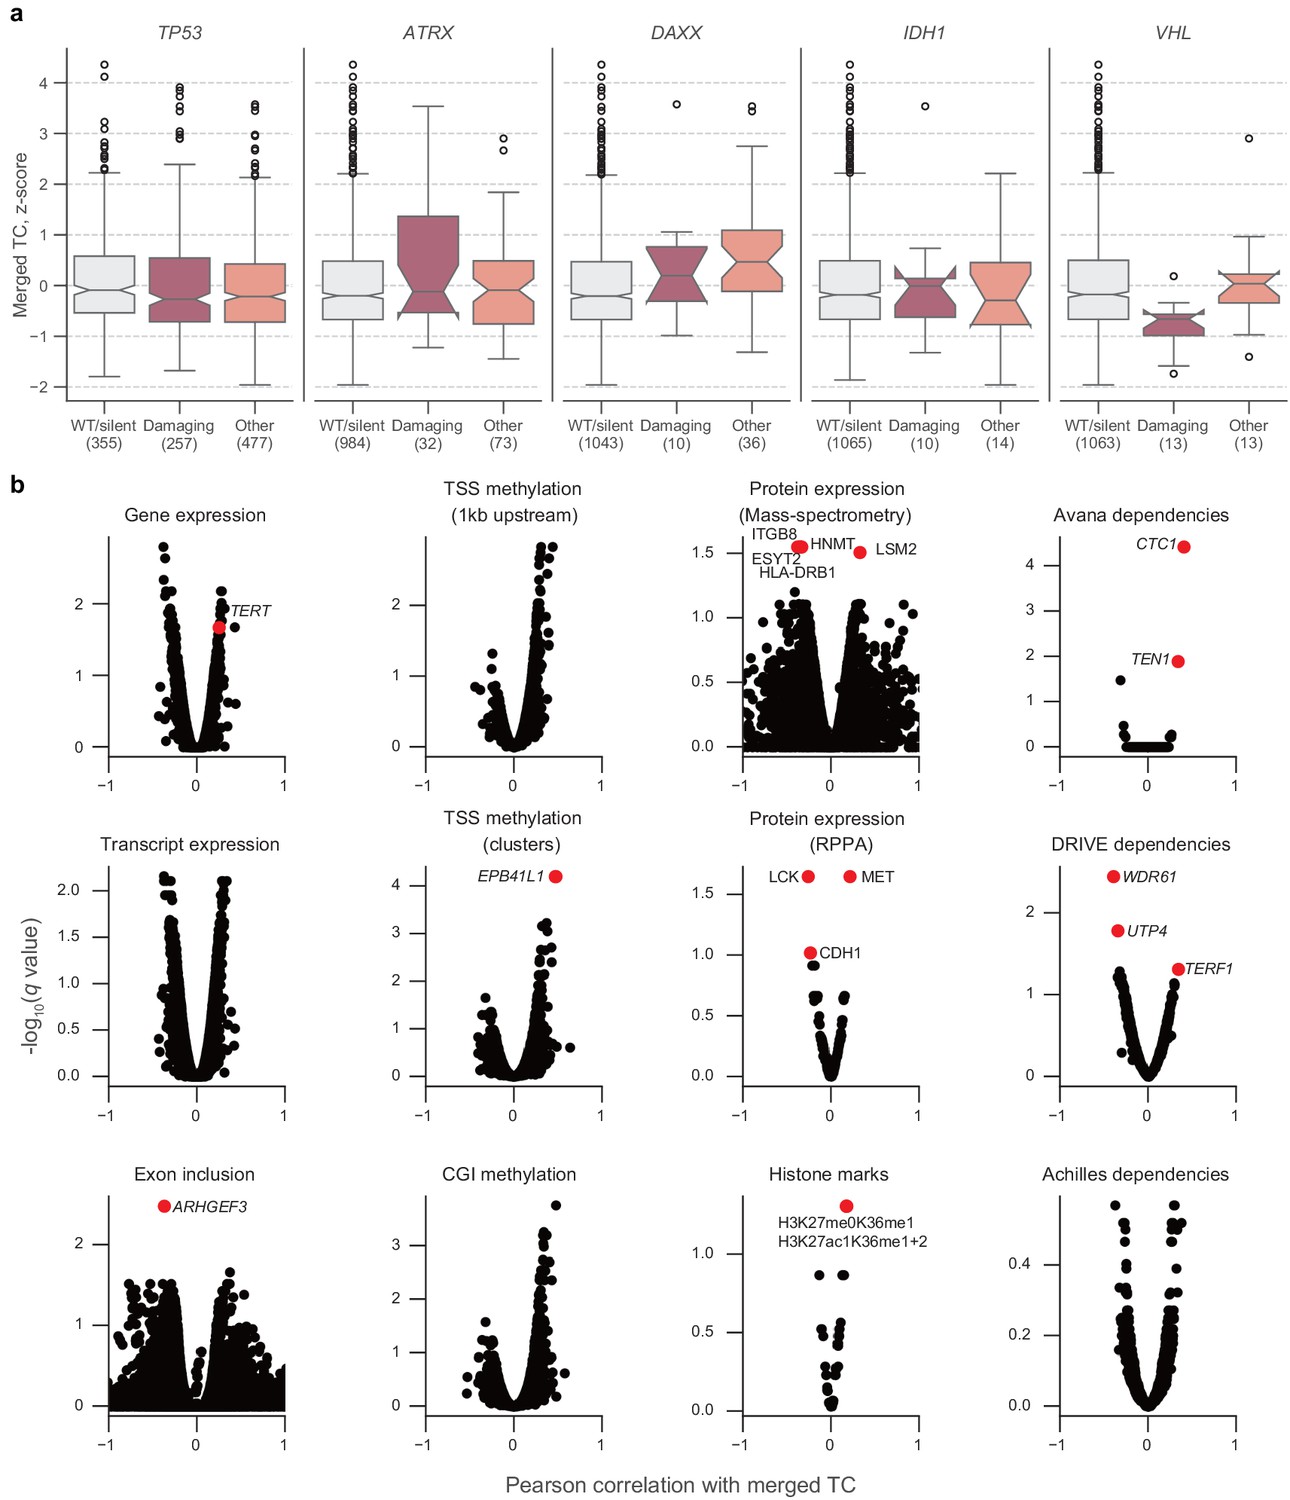
Associations between telomere content and cell line characteristics.
(a) Distributions of z-scored log2-transformed telomere content estimates from merged CCLE WGS and GDSC WES estimates, stratified by mutations in TP53, ATRX, DAXX, IDH1, and VHL. Boxes, interquartile range (IQR); center lines, median; whiskers, maximum and minimum or 1.5 × IQR; notches, 95% confidence interval of bootstrapped median using 1000 samples and a Gaussian-based asymptotic approximation. *p < 0.05, two-sided Mann-Whitney U test against WT/silent category; n.s, not significant. (b) Volcano plots of normalized correlation coefficients and false discovery rates (q values) of associations between merged telomere content estimates and several profiling datasets. Correlation coefficients were computed by regressing telomere content versus each indicated feature with cancer type as a covariate. Sample sizes listed in Supplementary file 2. p Values determined using two-sided Pearson’s correlation test.
Figure 2 with 2 supplements
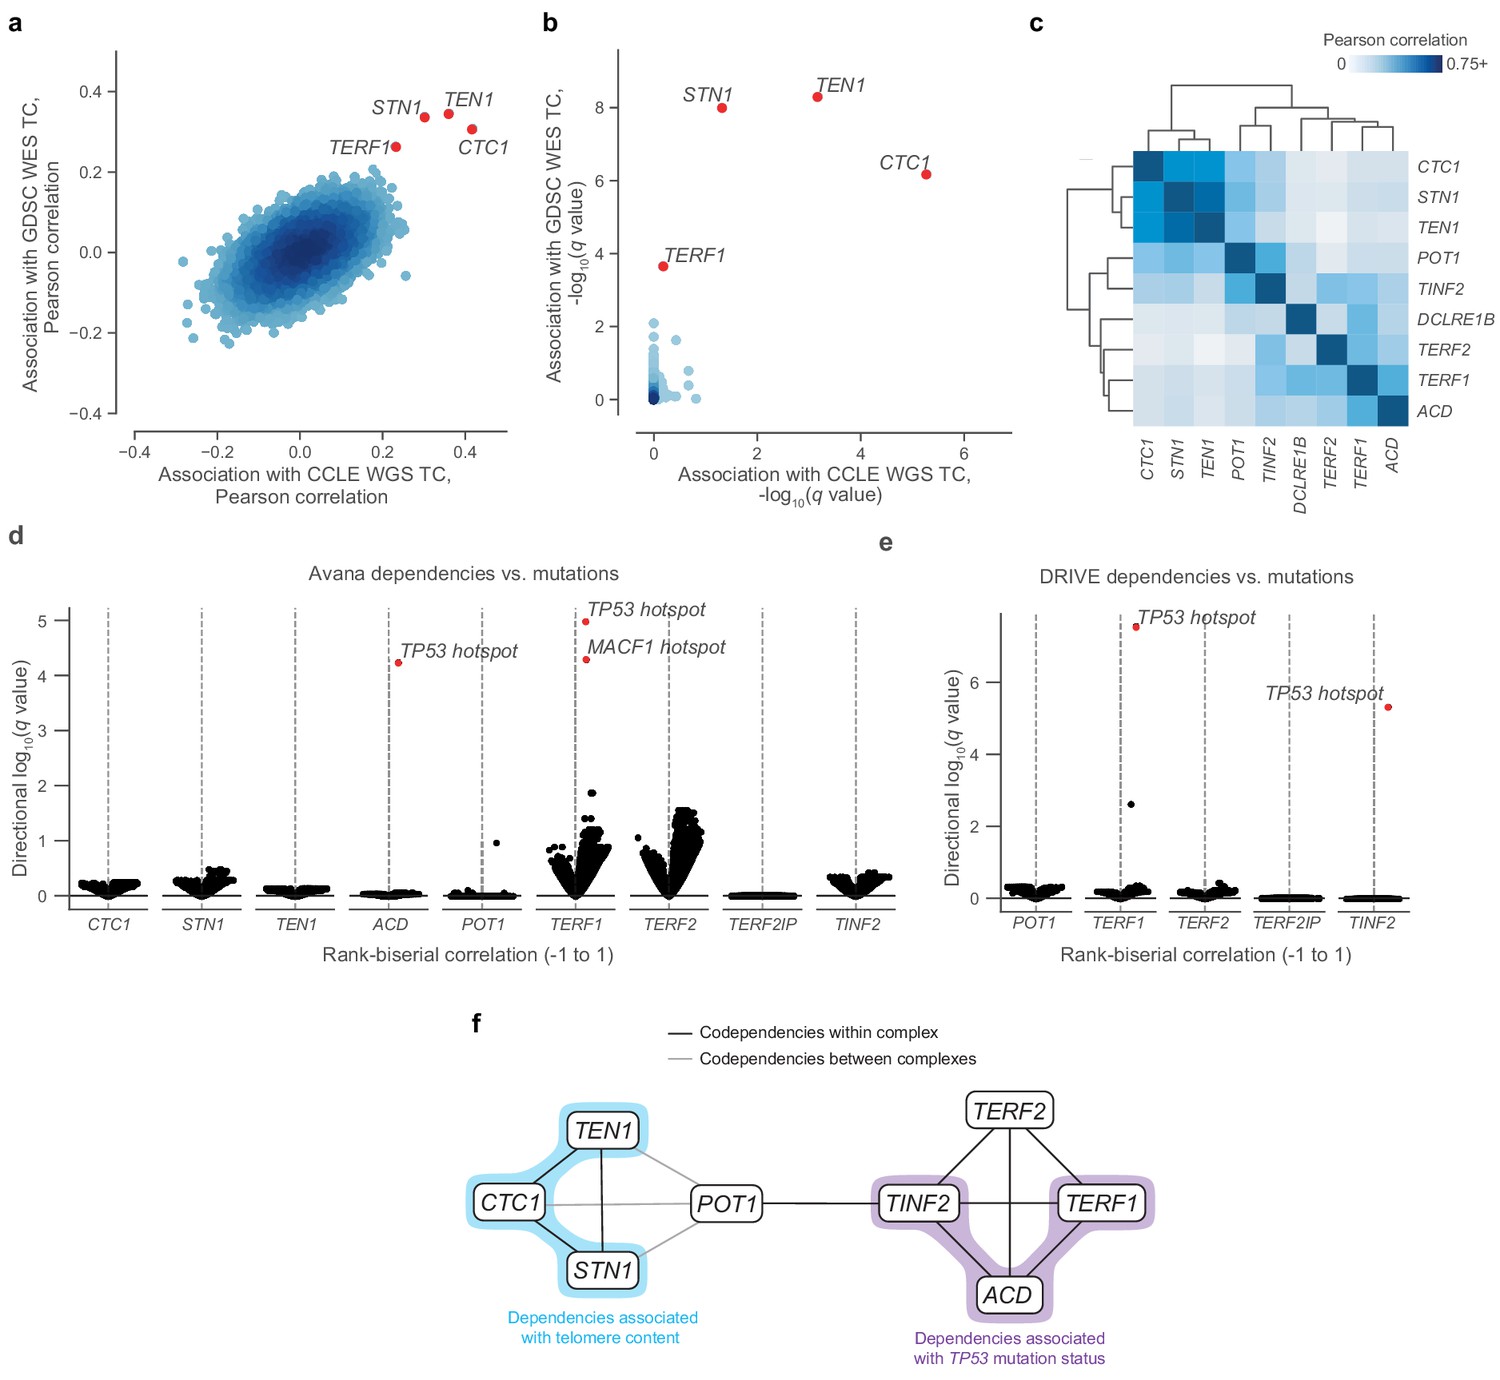
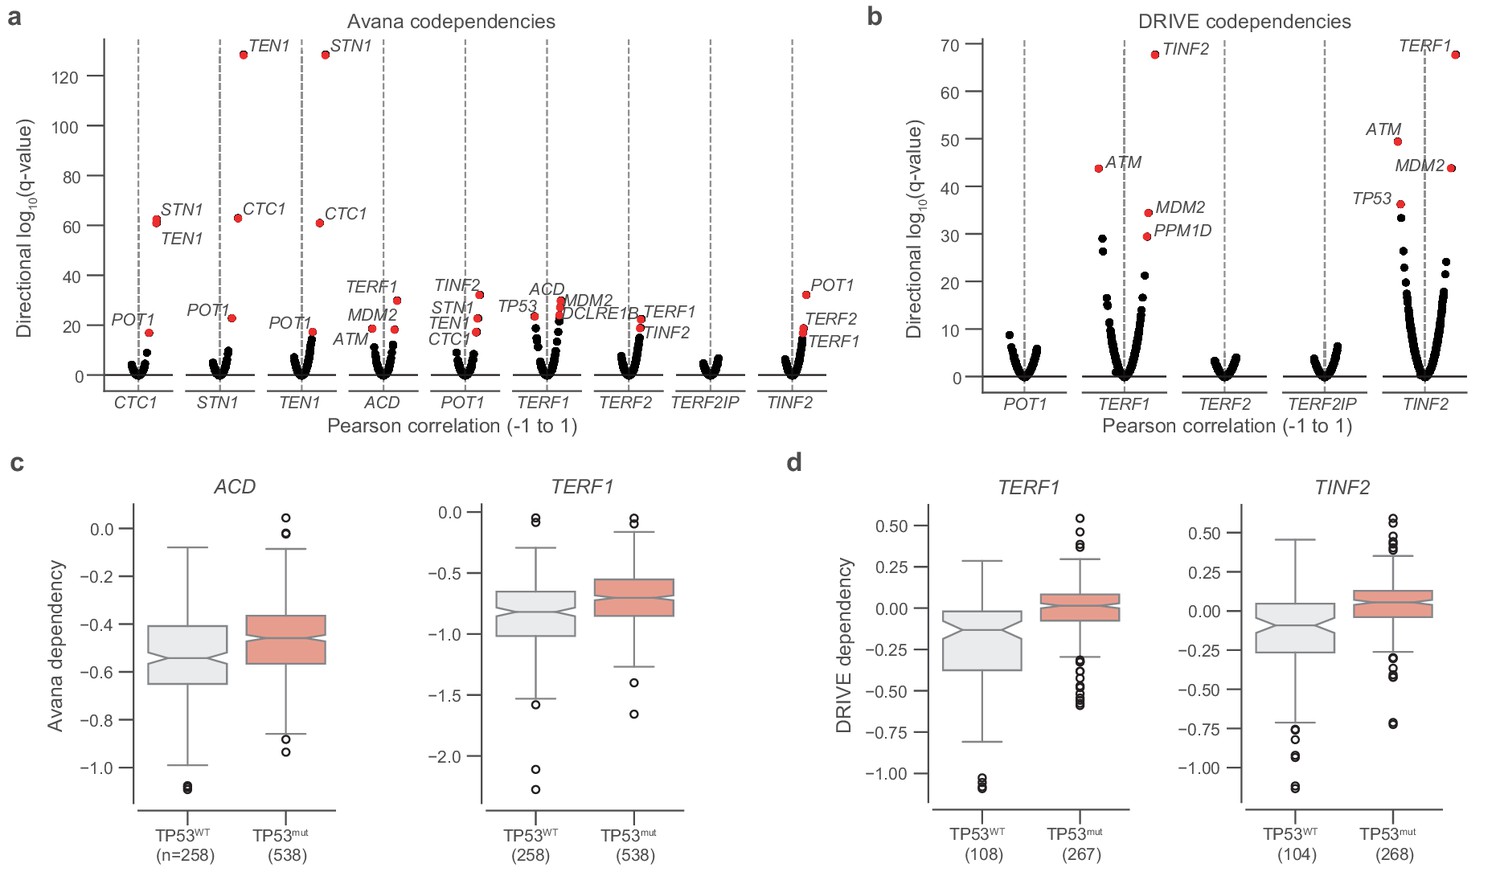
Telomere-binding protein dependencies are associated with telomere content and TP53 mutation status.
(a) Pairwise plot of Pearson correlations between dependencies of all genes in the Avana dataset and CCLE WGS telomere content (x-axis, n = 210–211 cell lines) and GDSC WES telomere content (y-axis, n = 420–426 cell lines) estimates. (b) Pairwise plot of significance levels of correlations shown in (a) with correction for multiple hypothesis testing. (c) Pairwise Pearson correlation matrix between Avana dependencies among CST members and five shelterin components (n = 796–808 cell lines; Supplementary file 3). (d) Associations of CST and shelterin member Avana dependency scores with damaging and hotspot mutations (n = 796–808 cell lines). For each gene dependency, mutation associations were computed using rank-biserial correlations with mutants and wild-types as the two categories. p Values determined using two-sided Mann-Whitney U test. (e) Associations of shelterin member DRIVE dependency scores with damaging and hotspot mutations (n = 372–375 cell lines; Supplementary file 3) under the same scheme used in (d). (f) Network schematic of the co-dependency matrix shown in (c) and annotated with association with telomere content or TP53 mutation status.
Figure 2—figure supplement 1
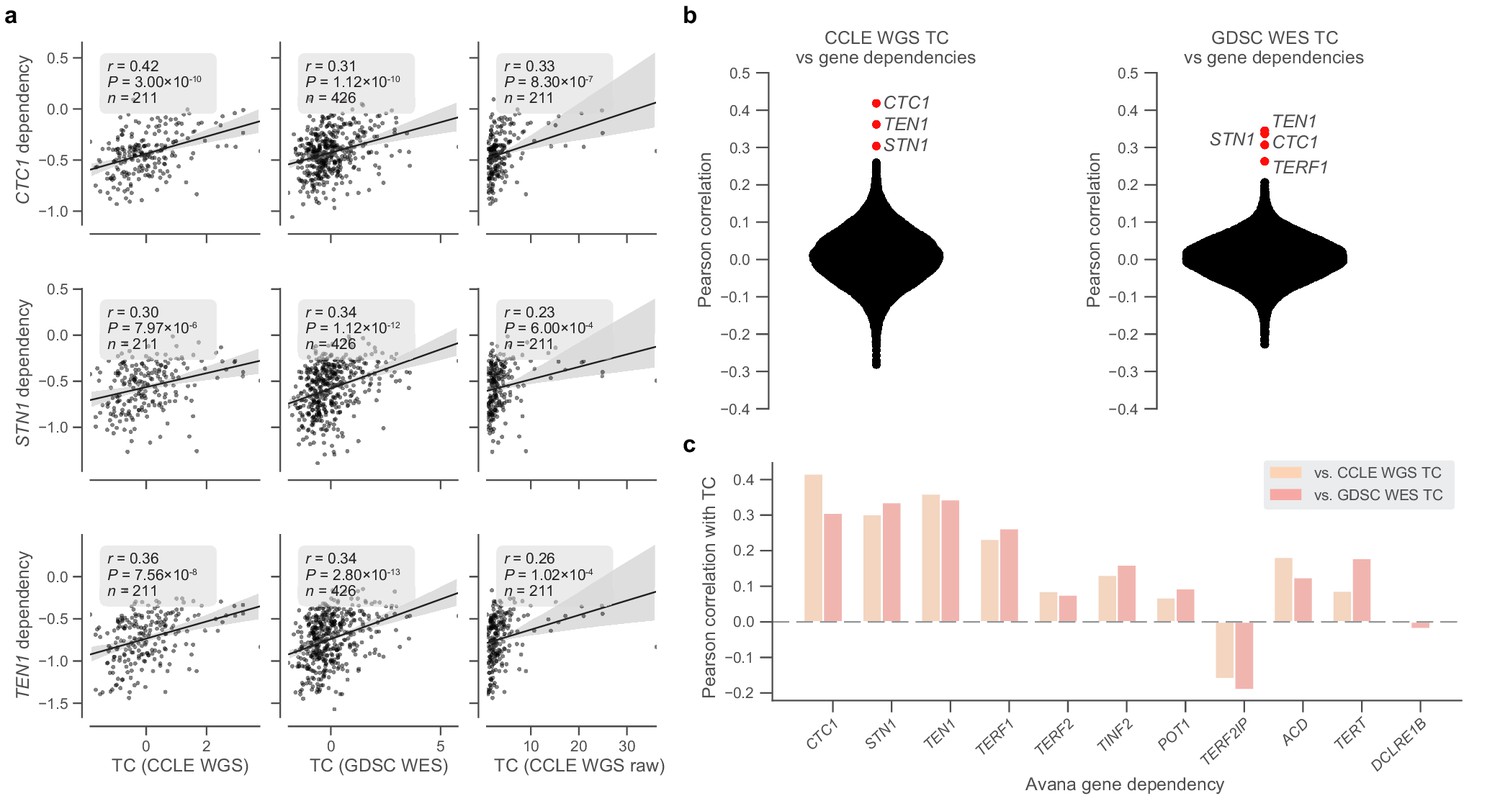
Telomere content and telomere protein dependencies.
(a) Scatterplots of z-scored log2-transformed telomere content estimates from the CCLE WGS (left) and GDSC WES (center) datasets against sensitivity to members of the CST complex measured in the Avana dataset. Also shown are comparisons with raw telomere content from CCLE WGS samples (right). (b) Distribution of Pearson correlations between telomere content estimates from CCLE WGS and GDSC WES datasets and all gene dependencies in the Avana CRISPR-Cas9 dataset (vs. CCLE WGS: n = 192–210 cell lines, vs. GDSC WES: n = 395–416 cell lines; Supplementary file 3). (c) Selected correlations between CCLE WGS and GDSC WES-derived telomere content and Avana dependencies of CST and shelterin complex members.
Figure 2—figure supplement 2
TP53 mutation status and shelterin member dependencies.
(a) Codependencies of CST and shelterin complex members in the Avana CRISPR-Cas9 dataset as measured by Pearson correlation and the associated two-sided P value (n = 793–808 cell lines). q-values are shown for correlations between each gene indicated on the x-axis and all other genes, with q-values transformed and ranked by the sign of the correlation. (b) Repeat of codependency analysis in (a), but for DRIVE RNAi dependencies (n = 88–386 cell lines). (c and d) comparison of dependencies of select members (Avana and DRIVE, respectively) with respect to TP53 hotspot mutation status. Boxes, interquartile range (IQR); center lines, median; whiskers, maximum, and minimum or 1.5 × IQR; notches, 95% confidence interval of bootstrapped median using 1000 samples and a Gaussian-based asymptotic approximation. p Values determined by two-sided Mann-Whitney U test.
Figure 3 with 2 supplements
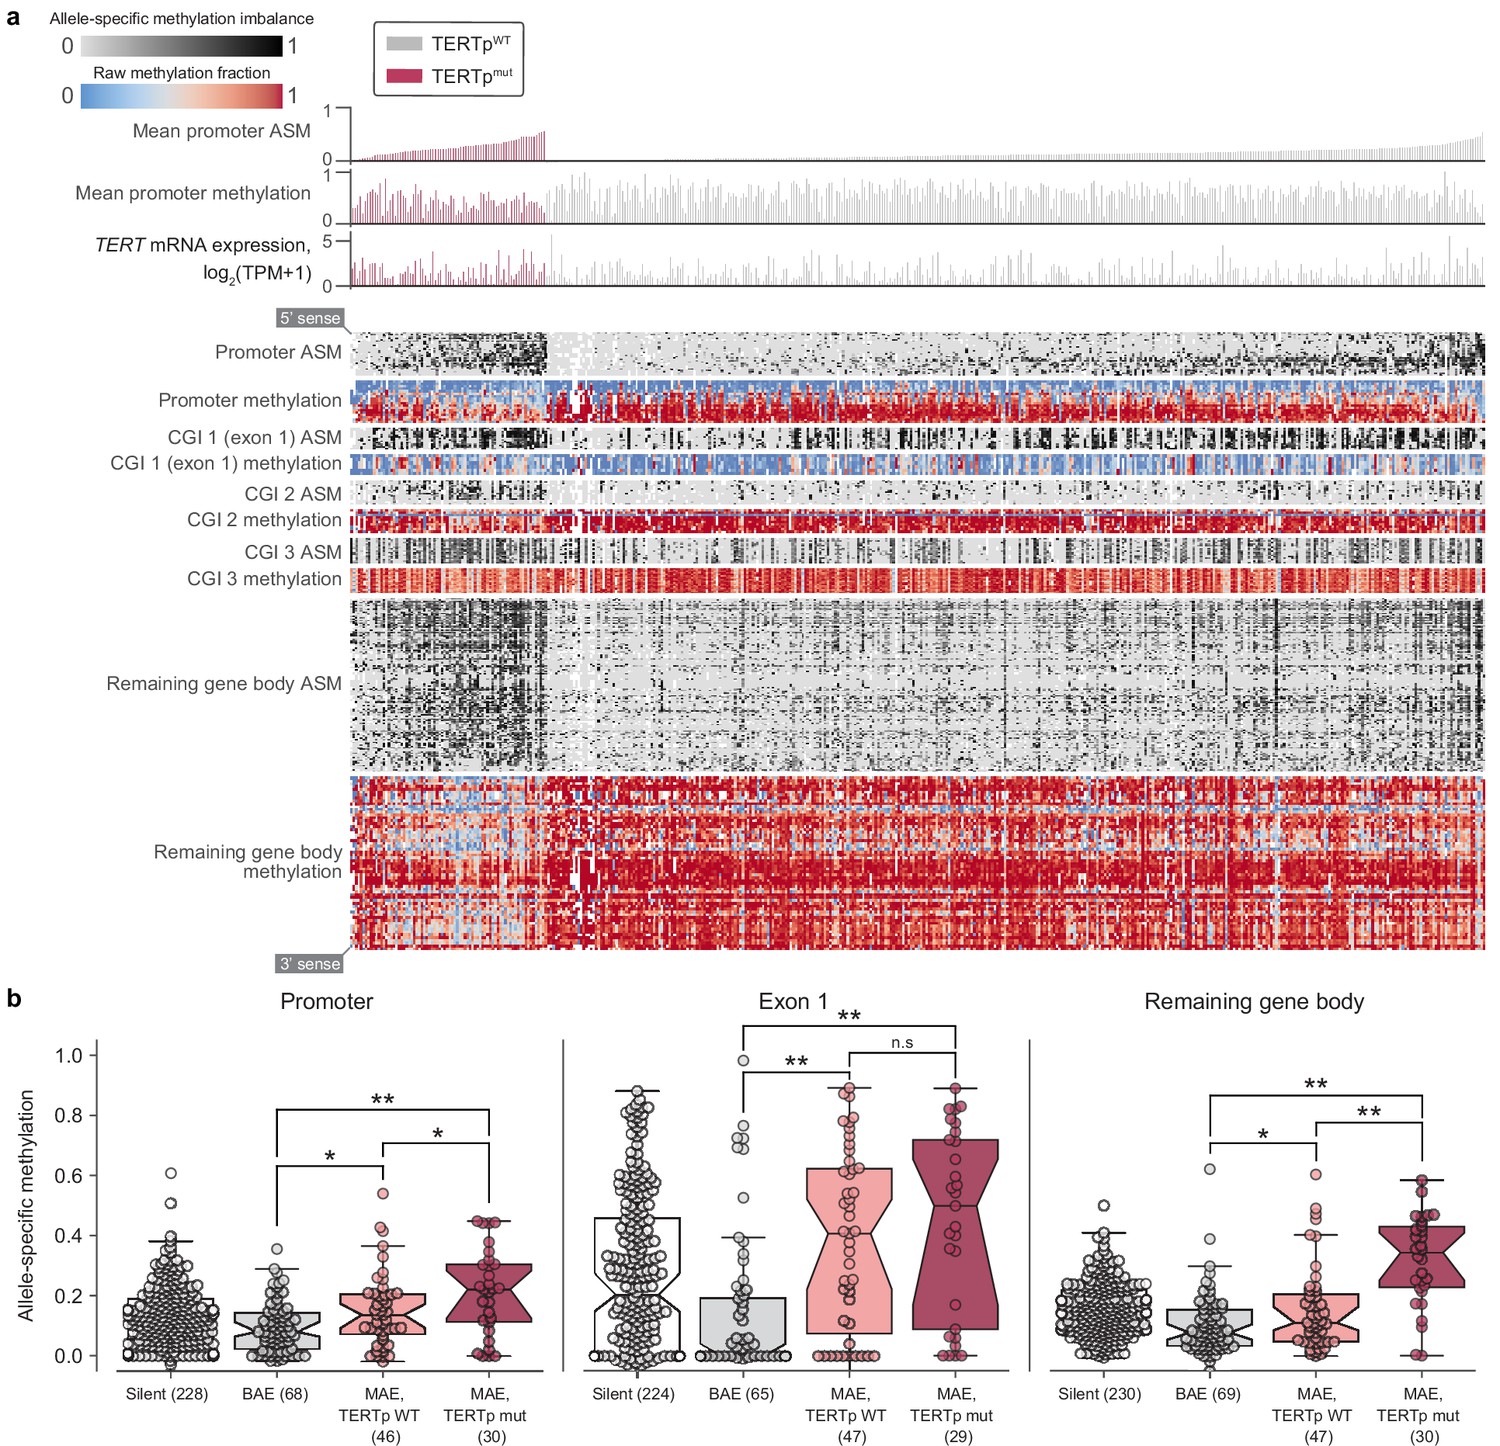
Allele-specific methylation of the TERT locus is indicative of both promoter mutation status and allele-specific expression.
(a) Heatmap of CpG methylation levels along the TERT locus, sorted in order of mean methylation levels along the upstream 5 kb region within TERTp-mutants and -wildtypes. TERT gene expression levels are also indicated for each cell line. Each column represents a cell line (n = 450), and each row represents a CpG pair (n = 209) sorted from the 5’ to 3’ direction along the TERT sense strand. White blocks indicate missing ASM/methylation values. Cell lines with unavailable ASM values for at least half of TERT locus CpGs were excluded. (b) ASM levels of TERT locus subregions in cell lines are indicative of TERTp status and allele-specific expression. BAE, biallelic expression; MAE, monoallelic expression. Boxes, interquartile range (IQR); center lines, median; whiskers, maximum and minimum or 1.5 × IQR; notches, 95% confidence interval of bootstrapped median using 1000 samples and a Gaussian-based asymptotic approximation. *p < 0.05, **p < 0.01, n.s, not significant; two-sided Mann-Whitney U test.
Figure 3—figure supplement 1
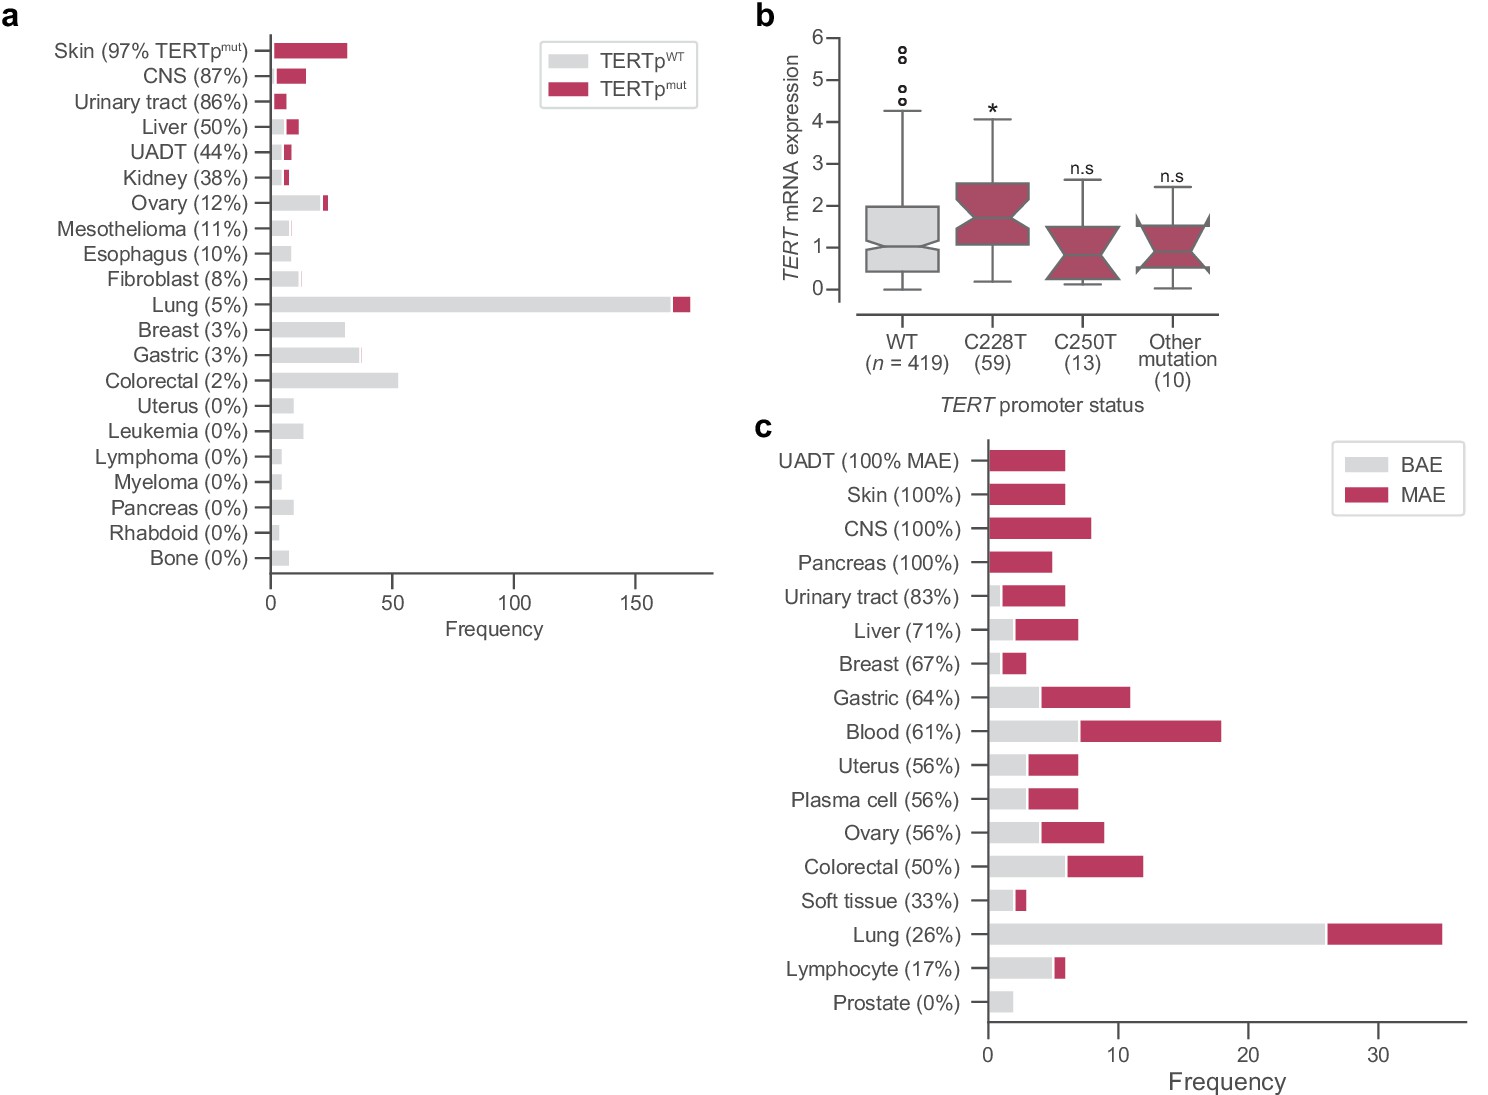
TERT promoter mutations, gene expression, and ASE.
(a) Frequencies of TERT promoter mutations across different tissue subtypes. (b) Distributions across different promoter mutation types of mRNA expression as measured in log2(TPM + 1) from RNAseq. Boxes, interquartile range (IQR); center lines, median; whiskers, maximum and minimum or 1.5 × IQR; notches, 95% confidence interval of bootstrapped median using 1000 samples and a Gaussian-based asymptotic approximation. *p < 0.01, two-sided Mann-Whitney U test against wild-type (WT) values; n.s, not significant. (c) Distribution of TERT allele-specific expression across tissue subtypes. CNS, central nervous system; UADT, upper aerodigestive tract.
Figure 3—figure supplement 2

Interactions bewteen TERT ASE, promoter mutations, and methylation.
(a) Contingency table of TERT allele-specific expression and TERT promoter mutation status. p Value determined by Fisher’s exact test. (b) Distribution of TERT allele-specific expression and promoter mutations across tissue subtypes. c and d, Distributions across different promoter mutation types of mean ASM (c) and methylation (d) in the TERT remaining gene body. Boxes, interquartile range (IQR); center lines, median; whiskers, maximum and minimum or 1.5 × IQR; notches, 95% confidence interval of bootstrapped median using 1000 samples and a Gaussian-based asymptotic approximation. *p < 0.01, two-sided Mann-Whitney U test against wild-type (WT) values; n.s, not significant. (e) Correlation between TERT gene body methylation and mRNA expression in promoter-wildtype (left) and promoter-mutant (right) cell lines. CNS, central nervous system; UADT, upper aerodigestive tract.
Figure 4 with 1 supplement
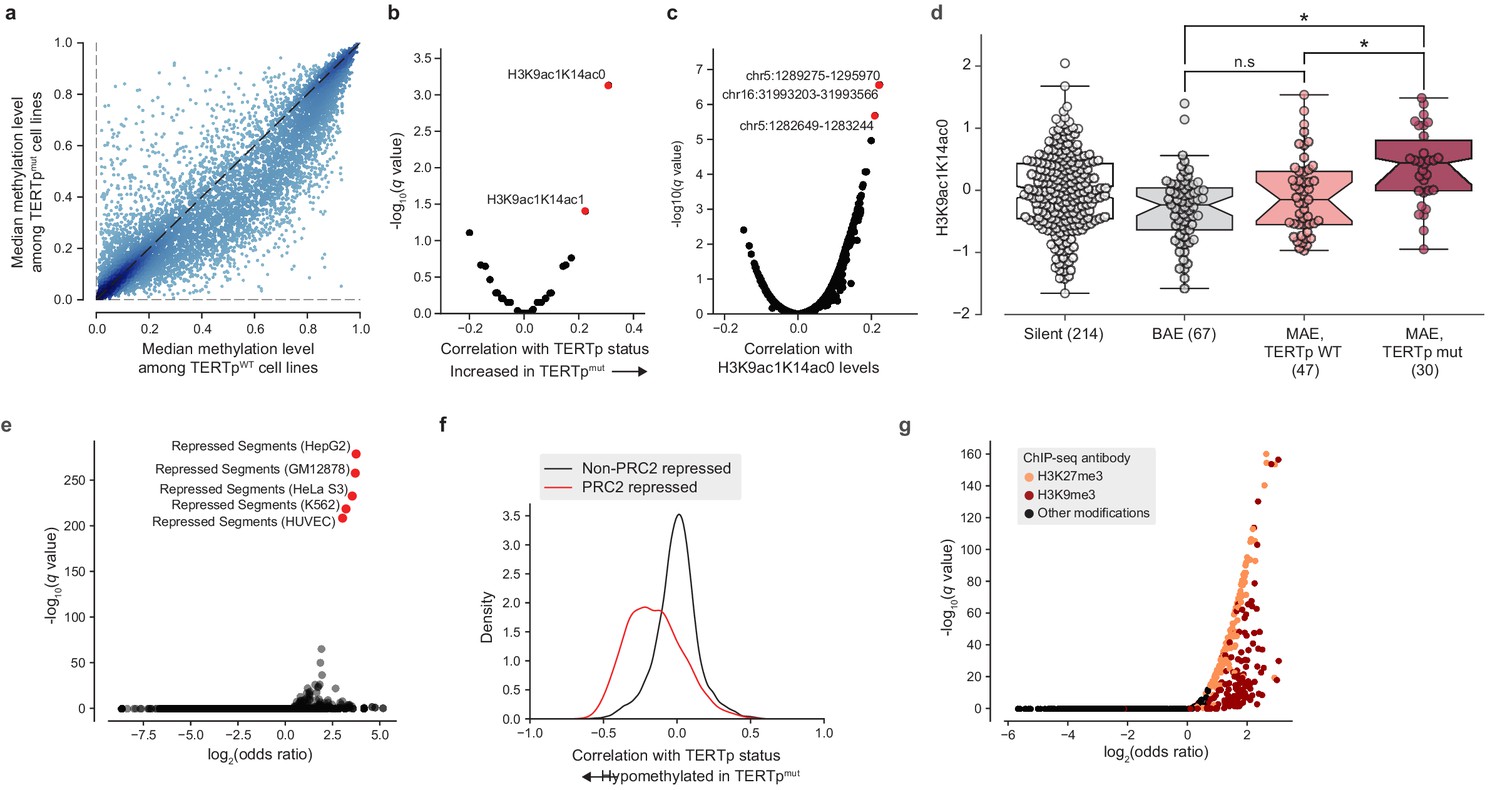
TERT promoter mutations associate with genome-wide decreased methylation of PRC2-repressed regions.
(a) Pairwise plot of median CGI methylation levels in TERTpmut cell lines (n = 21–83; Supplementary file 6) versus TERTpWT cell lines (n = 95–410, Supplementary file 6). Each dot represents a CGI. (b) Rank-biserial correlations between TERTp status (mutant or wild-type) and global histone modification levels (n = 302–475). Significance determined by two-sided Mann-Whitney U test. (c) Pearson correlation levels between global H3K9ac1K14ac0 levels and ASM imbalance of CGIs (n = 261–884). (d) H3K9ac1K14ac0 levels are significantly increased in TERTp mutants. Boxes, interquartile range (IQR); center lines, median; whiskers, maximum and minimum or 1.5 × IQR; notches, 95% confidence interval of bootstrapped median using 1000 samples and a Gaussian-based asymptotic approximation. *p < 0.01, n.s, not significant; two-sided Mann-Whitney U test. (e) LOLA core set enrichment analysis of CGIs hypomethylated in TERTpmut cell lines reveals enrichment of PRC2-repressed regions. (f) Kernel density distributions of rank-biserial correlations between CGI methylation levels for PRC2-overlapping regions and non-PRC2-overlapping regions. A negative correlation indicates that a CGI is hypomethylated in TERTpmut cell lines relative to TERTpWT ones, and a positive correlation indicates the opposite. PRC2 regions were sourced from the HepG2 segmentation. (g) LOLA ENCODE Roadmap region enrichment analysis of CGIs hypomethylated in TERTpmut cell lines reveals enrichment of H3K9me3 and H3K27me3 regions.
Figure 4—figure supplement 1
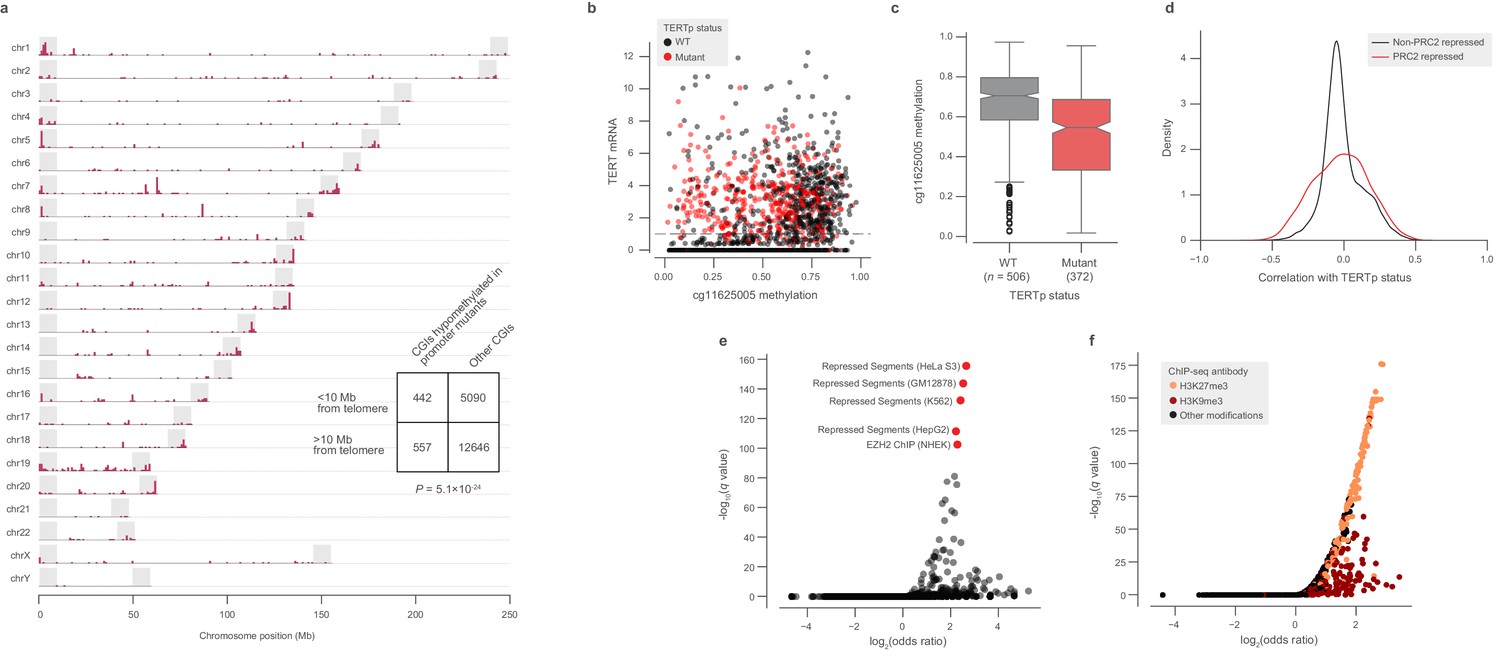
Global methylation changes associated with TERT promoter mutations.
(a) Genomic distribution of CGIs hypomethylated in TERTpmut CCLE cell lines. Shaded regions denote 10 Mb chromosome ends. (b) Methylation at the cg11625005 CpG probe and TERT mRNA expression across TCGA samples annotated by TERTp status (n = 1553). (c) Comparison of cg11625005 methylation levels in TERTp mutants and wild-type TCGA samples with TERT mRNA expression greater than 1 as indicated in the horizontal line in (b). Boxes, interquartile range (IQR); center lines, median; whiskers, maximum and minimum or 1.5 × IQR; notches, 95% confidence interval of bootstrapped median using 1000 samples and a Gaussian-based asymptotic approximation. p = 1.5 × 10⁻²⁶, two-sided Mann-Whitney U test. d, Kernel density distributions of rank-biserial correlations between CGI methylation levels for PRC2-overlapping regions and non-PRC2-overlapping regions. A negative correlation indicates that a CGI is hypomethylated in TERTpmut cell lines relative to TERTpWT ones, and a positive correlation indicates the opposite. PRC2 regions were sourced from the HepG2 segmentation. (e) LOLA core set enrichment analysis of CGIs hypomethylated in TERTpmut samples reveals enrichment of PRC2-repressed regions. (f) LOLA ENCODE Roadmap region enrichment analysis of CGIs hypomethylated in TERTpmut samples reveals enrichment of H3K9me3 and H3K27me3 regions.
Additional files
-
Supplementary file 1
Telomere content estimates and sample information.
- https://cdn.elifesciences.org/articles/66198/elife-66198-supp1-v2.xlsx
-
Supplementary file 2
Telomere content and transcriptomic associations.
- https://cdn.elifesciences.org/articles/66198/elife-66198-supp2-v2.xlsx
-
Supplementary file 3
Unsupervised dependency associations.
- https://cdn.elifesciences.org/articles/66198/elife-66198-supp3-v2.xlsx
-
Supplementary file 4
Allele-specific expression calls.
- https://cdn.elifesciences.org/articles/66198/elife-66198-supp4-v2.xlsx
-
Supplementary file 5
TERT locus methylation.
- https://cdn.elifesciences.org/articles/66198/elife-66198-supp5-v2.xlsx
-
Supplementary file 6
Genome-wide methylation analysis in the CCLE.
- https://cdn.elifesciences.org/articles/66198/elife-66198-supp6-v2.xlsx
-
Supplementary file 7
Genome-wide methylation analysis in TCGA.
- https://cdn.elifesciences.org/articles/66198/elife-66198-supp7-v2.xlsx
-
Transparent reporting form
- https://cdn.elifesciences.org/articles/66198/elife-66198-transrepform-v2.pdf
Download links
A two-part list of links to download the article, or parts of the article, in various formats.
Downloads (link to download the article as PDF)
Open citations (links to open the citations from this article in various online reference manager services)
Cite this article (links to download the citations from this article in formats compatible with various reference manager tools)
Integrated evaluation of telomerase activation and telomere maintenance across cancer cell lines
eLife 10:e66198.
https://doi.org/10.7554/eLife.66198


