Plasmodium falciparum K13 mutations in Africa and Asia impact artemisinin resistance and parasite fitness
- Department of Microbiology and Immunology, Columbia University Irving Medical Center, United States
- Department of Microbiology and Immunology, University of Otago, New Zealand
- Malaria Genetics and Resistance Unit, Institut Pasteur, INSERM U1201, CNRS ERL9195, France
- Institut Cochin, INSERM U1016, Université Paris Descartes, France
- Department of Genetics, University of North Carolina at Chapel Hill, United States
- Programme National de Lutte Contre le Paludisme au Tchad, Chad
- Centre National de Recherche et de Formation sur le Paludisme, Burkina Faso
- Laboratoire de Parasitologie, Institut Pasteur de Bangui, Central African Republic
- University Teaching Hospital of Kamenge, Burundi
- Ifakara Health Institute, United Republic of Tanzania
- Malaria and Other Parasitic Diseases Division, Rwanda Biomedical Centre, Rwanda
- National Malaria Control Program, Sierra Leone
- National Malaria Control Program, Gambia
- Programme National de Lutte Contre le Paludisme, Democratic Republic of the Congo
- School of Public Health and Community Medicine, University of Gothenburg, Sweden
- National Center for Parasitology, Entomology & Malaria Control, Cambodia
- Shoklo Malaria Research Unit, Mahidol-Oxford Tropical Medicine Research Unit, Faculty of Tropical Medicine, Mahidol University, Thailand
- Centre for Tropical Medicine and Global Health, Nuffield Department of Medicine, University of Oxford, United Kingdom
- Texas Biomedical Research Institute, United States
- Department of Medicine, University of California, San Francisco, United States
- Division of Infectious Diseases, Department of Medicine, Columbia University Irving Medical Center, United States
Figures
Figure 1
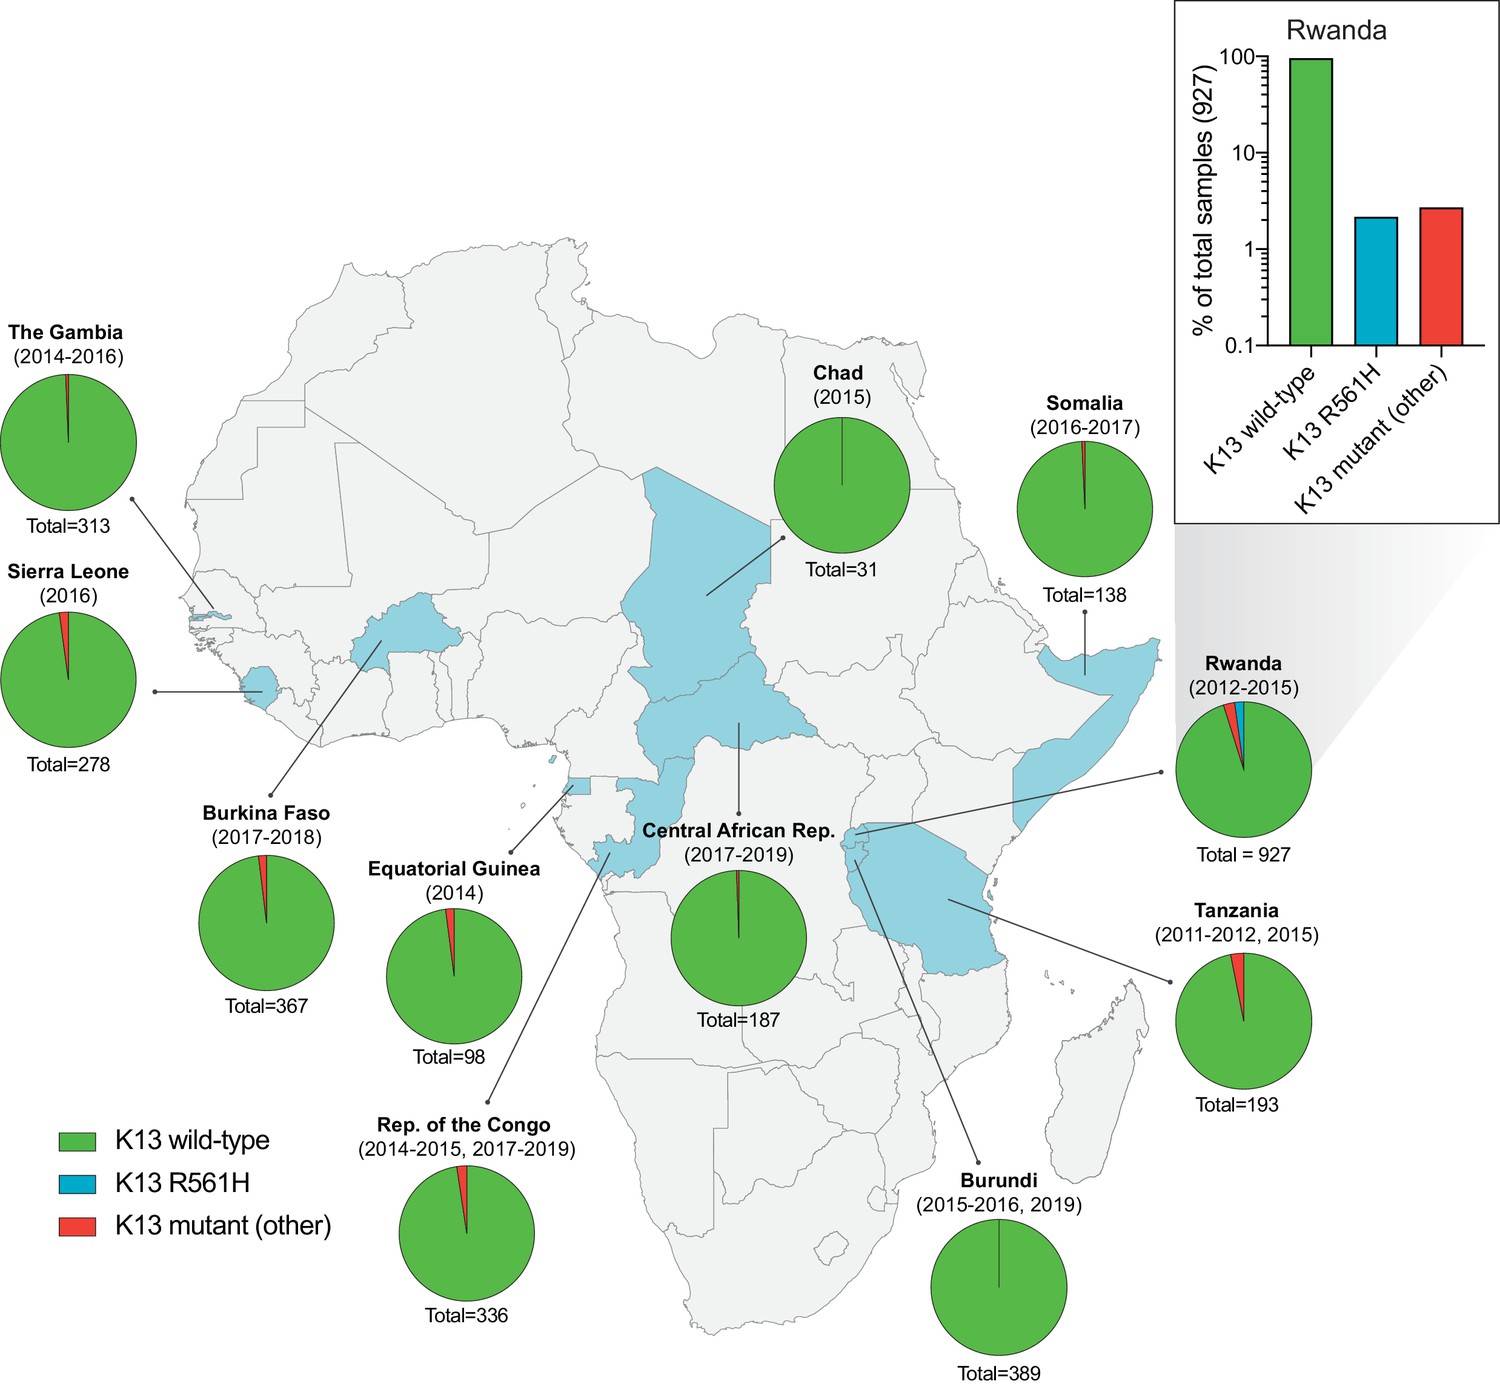
Frequency and distribution of K13 alleles in eleven African countries.
Map of Africa with pie charts representing the proportions of sequenced samples per country that harbor the K13 wild-type sequence (3D7 reference), the R561H variant (the most commonly identified mutation, unique to Rwanda; see inset), or another less frequent non-synonymous K13 mutation. Sample sizes and years of sample collection are indicated. Mutations and numbers of African samples sequenced per country, and prior citations as appropriate, are listed in Figure 1—source data 1.
-
Figure 1—source data 1
Distribution of K13 alleles over time in African countries (2011–2019).
- https://cdn.elifesciences.org/articles/66277/elife-66277-fig1-data1-v3.xlsx
Figure 2 with 1 supplement
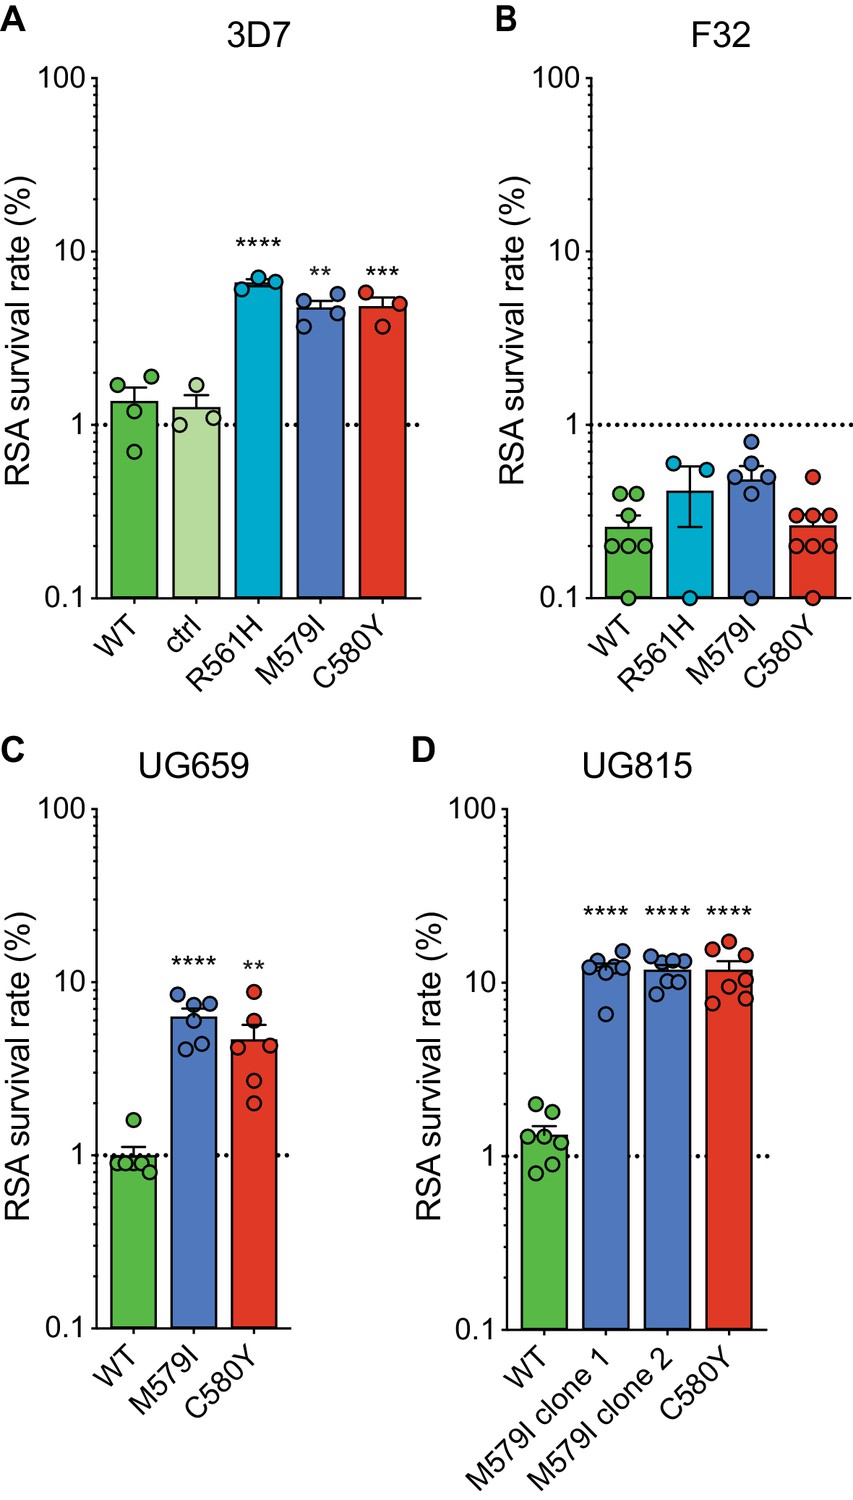
Gene-edited mutant K13 African parasites display variable levels of RSA survival.
(A–D) RSA survival rates for (A) 3D7 (Africa), (B) F32 (Tanzania), (C) UG659 (Uganda), or (D) UG815 (Uganda) K13 wild-type parental lines and CRISPR/Cas9-edited K13 R561H, M579I, or C580Y mutant clones. Unedited parental lines are described in Table 1 and Supplementary file 4. For 3D7, we also included a K13 wild-type control (ctrl) line harboring silent shield mutations at the K13 gRNA cut site. Results show the percentage of early ring-stage parasites (0–3 hr post invasion) that survived a 6 hr pulse of 700 nM DHA, relative to DMSO-treated parasites assayed in parallel. Percent survival values are shown as means ± SEM (detailed in Figure 2—source data 1). Results were obtained from three to eight independent experiments, each performed in duplicate. p Values were determined by unpaired t tests and were calculated for K13 mutant lines relative to their isogenic wild-type lines. ** p<0.01; *** p<0.001; **** p<0.0001.
-
Figure 2—source data 1
Ring-stage survival (RSA) assay data for K13 edited African parasites and controls.
- https://cdn.elifesciences.org/articles/66277/elife-66277-fig2-data1-v3.xlsx
Figure 2—figure supplement 1
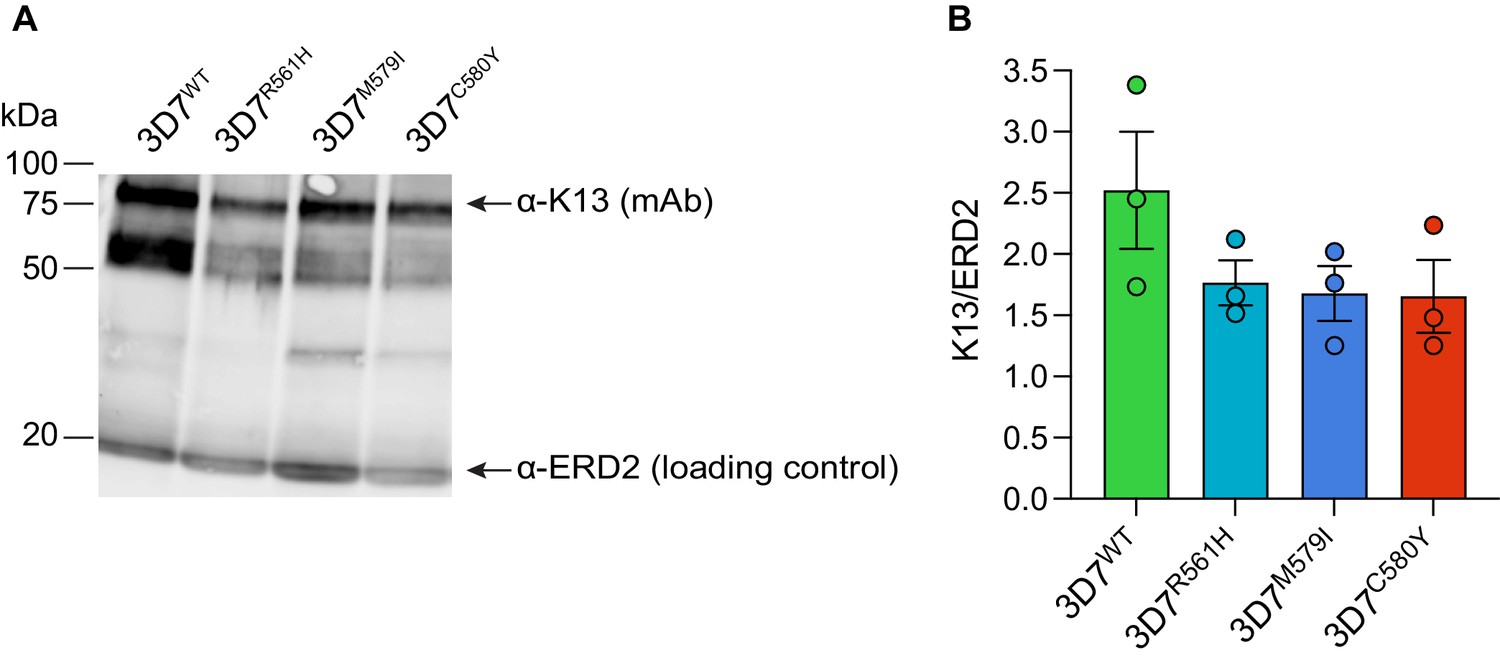
K13 mutations result in reduced K13 protein levels in African 3D7 parasites.
(A) Representative Western blot of parasite extracts probed with an anti-K13 monoclonal antibody (clone E9) that recognizes full-length K13 (~85 kDa) and lower molecular weight bands, presumably N-terminal degradation products, as previously reported (Gnädig et al., 2020). Tightly synchronized K13 wild-type, R561H, M579I, or C580Y 3D7 parasites were harvested as 0–6 hr ring stages. ERD2 was used as a loading control. Experiments were performed on three independent occasions. (B) Quantification of K13 mutant protein levels versus K13 wild-type protein levels across independent replicates, performed using ImageJ, with all protein levels normalized to the ERD2 loading control. Western blots reveal reduced levels of K13 protein in the three mutant lines relative to wild-type 3D7 parasites. Results are shown as means ± SEM. WT, wild-type.
-
Figure 2—figure supplement 1—source data 1
Raw figure files for K13 Western blots performed on 3D7 parasites.
- https://cdn.elifesciences.org/articles/66277/elife-66277-fig2-figsupp1-data1-v3.zip
Figure 3
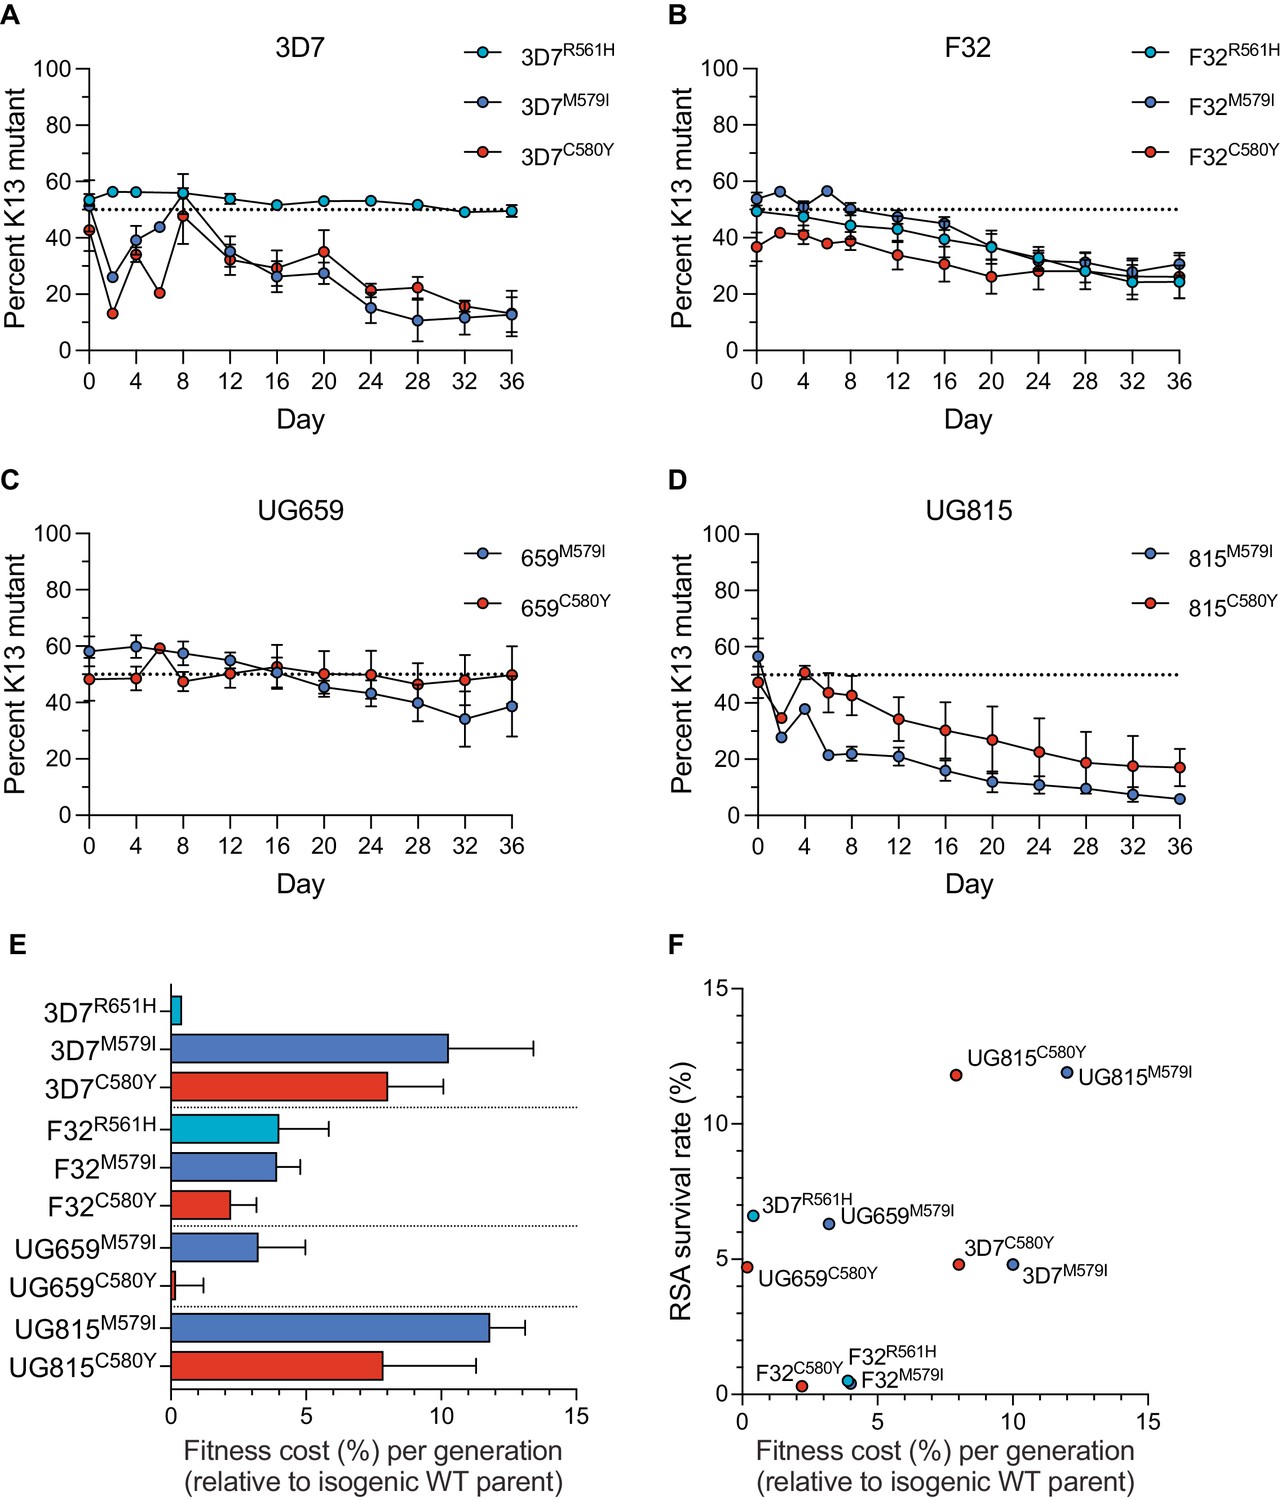
K13 mutations cause differential impacts on in vitro growth rates across gene-edited African strains.
(A–D) Percentages of mutant alleles relative to the wild-type allele over time in (A) 3D7, (B) F32, (C) UG659, and (D) UG815 parasite cultures in which K13 mutant clones were co-cultured at 1:1 starting ratios with isogenic K13 wild-type controls over a period of 36 days. Results, shown as means ± SEM, were obtained from two to five independent experiments, each performed in duplicate. Values are provided in Figure 3—source data 1. (E) The percent reduction in growth rate per 48 hr generation, termed the fitness cost, is presented as mean ± SEM for each mutant line relative to its isogenic wild-type comparator. (F) Fitness costs for mutant lines and isogenic wild-type comparators plotted relative to RSA survival values for the same lines.
-
Figure 3—source data 1
Fitness assay data for K13 edited African parasite lines and controls.
- https://cdn.elifesciences.org/articles/66277/elife-66277-fig3-data1-v3.xlsx
Figure 4 with 1 supplement
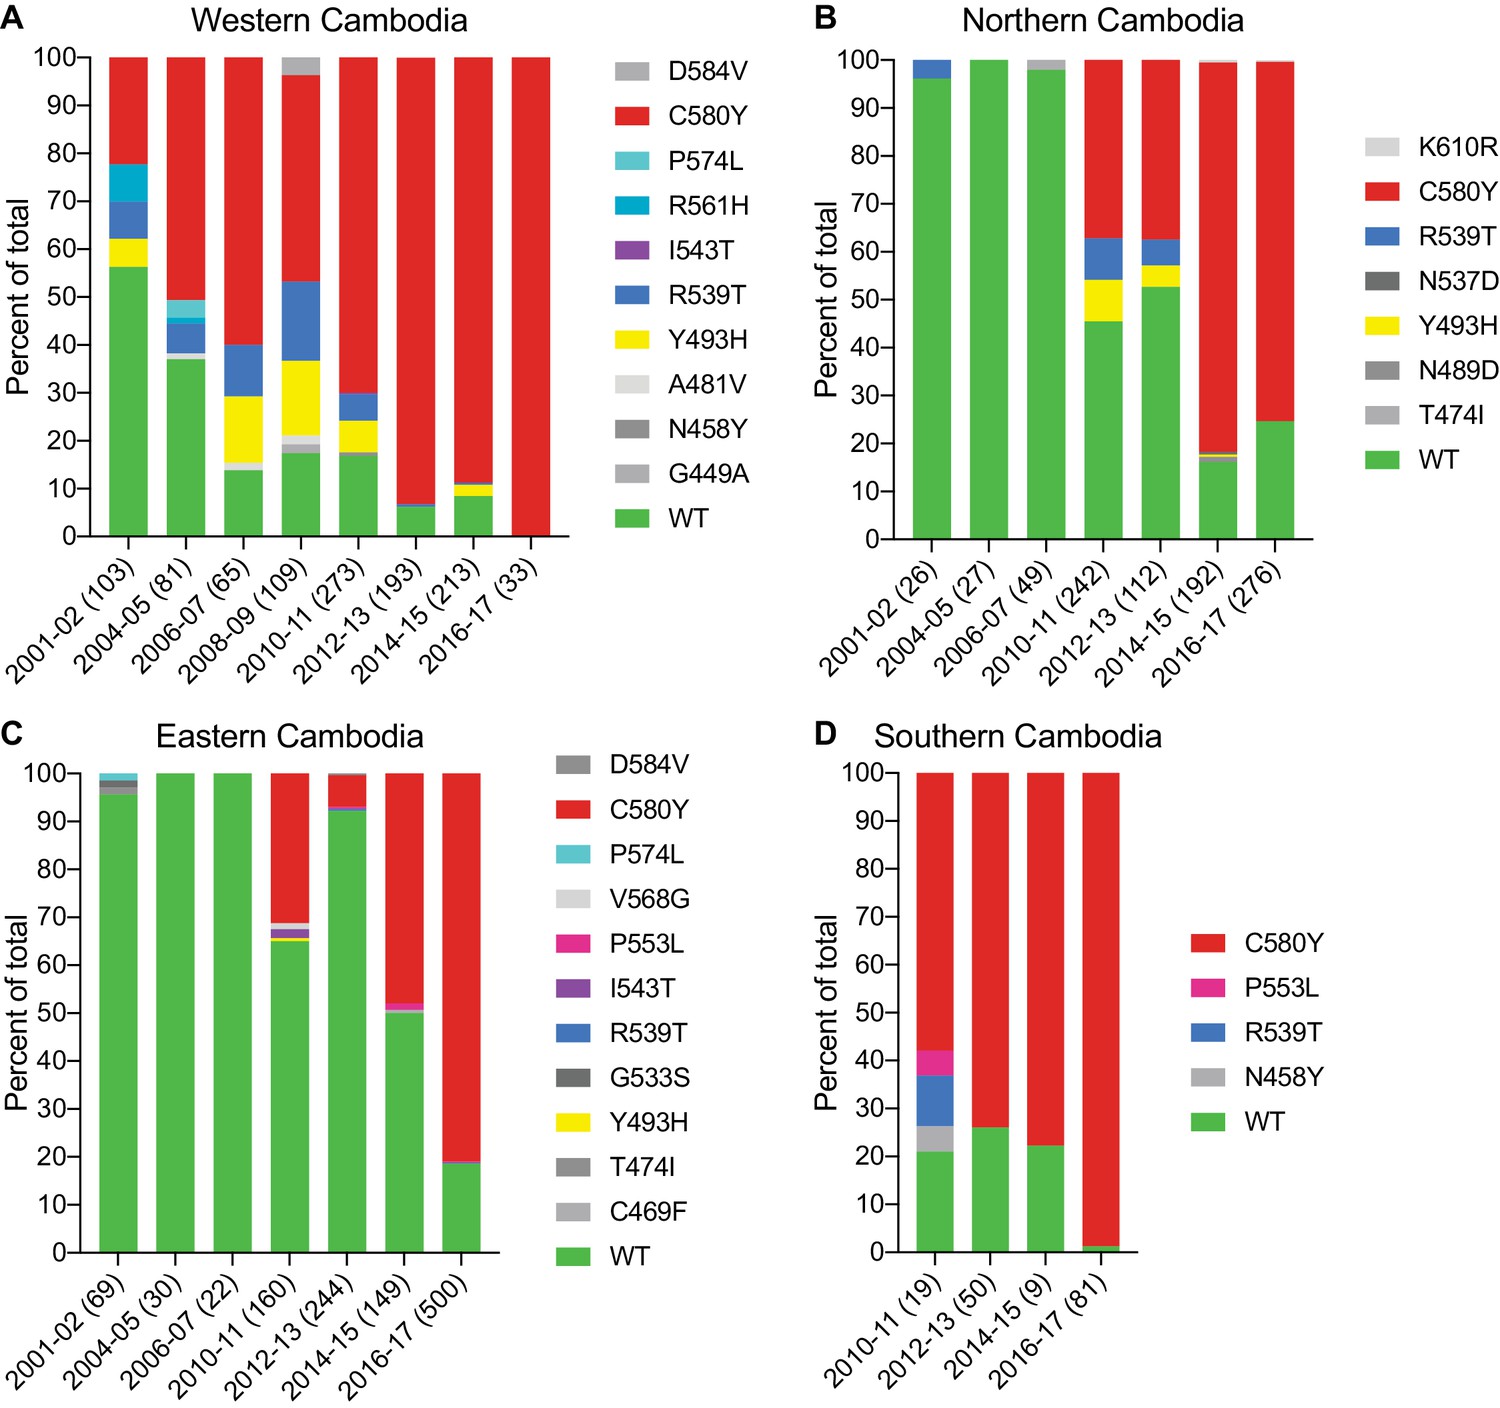
The K13 C580Y allele has progressively outcompeted all other alleles in Cambodia.
(A–D) Stacked bar charts representing the percentages of sequenced samples expressing the K13 wild-type allele or individual variants, calculated based on the total number of samples (listed in parentheses) for a given period. Sample collection was segregated into four regions in Cambodia (detailed in Figure 4—figure supplement 1). All K13 mutant samples harbored a single non-synonymous nucleotide polymorphism. Mutations and numbers of Cambodian samples sequenced per region/year, including prior citations as appropriate, are listed in Figure 4—source data 1.
-
Figure 4—source data 1
Distribution of K13 alleles over time in Cambodia (2001–2017).
- https://cdn.elifesciences.org/articles/66277/elife-66277-fig4-data1-v3.xlsx
Figure 4—figure supplement 1
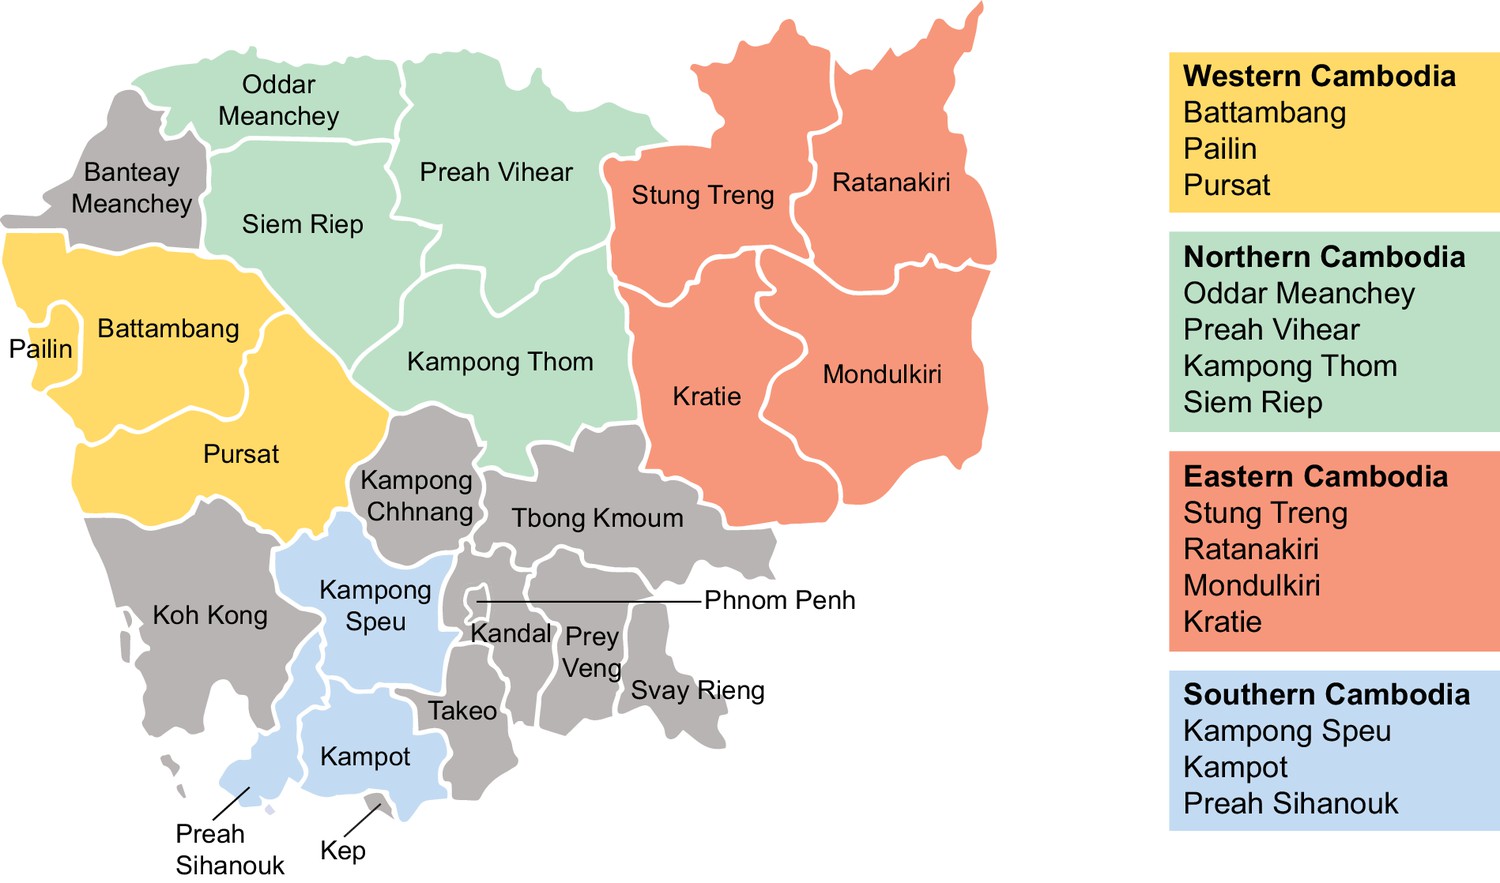
Regions of sample collection in Cambodia for K13 sequencing.
Map depicting the fourteen provinces and four regions of Cambodia (western, northern, eastern, and southern) in which samples were collected between 2001 and 2017 for K13 genotyping. Genotyping data are presented in Figure 4.
Figure 5 with 1 supplement
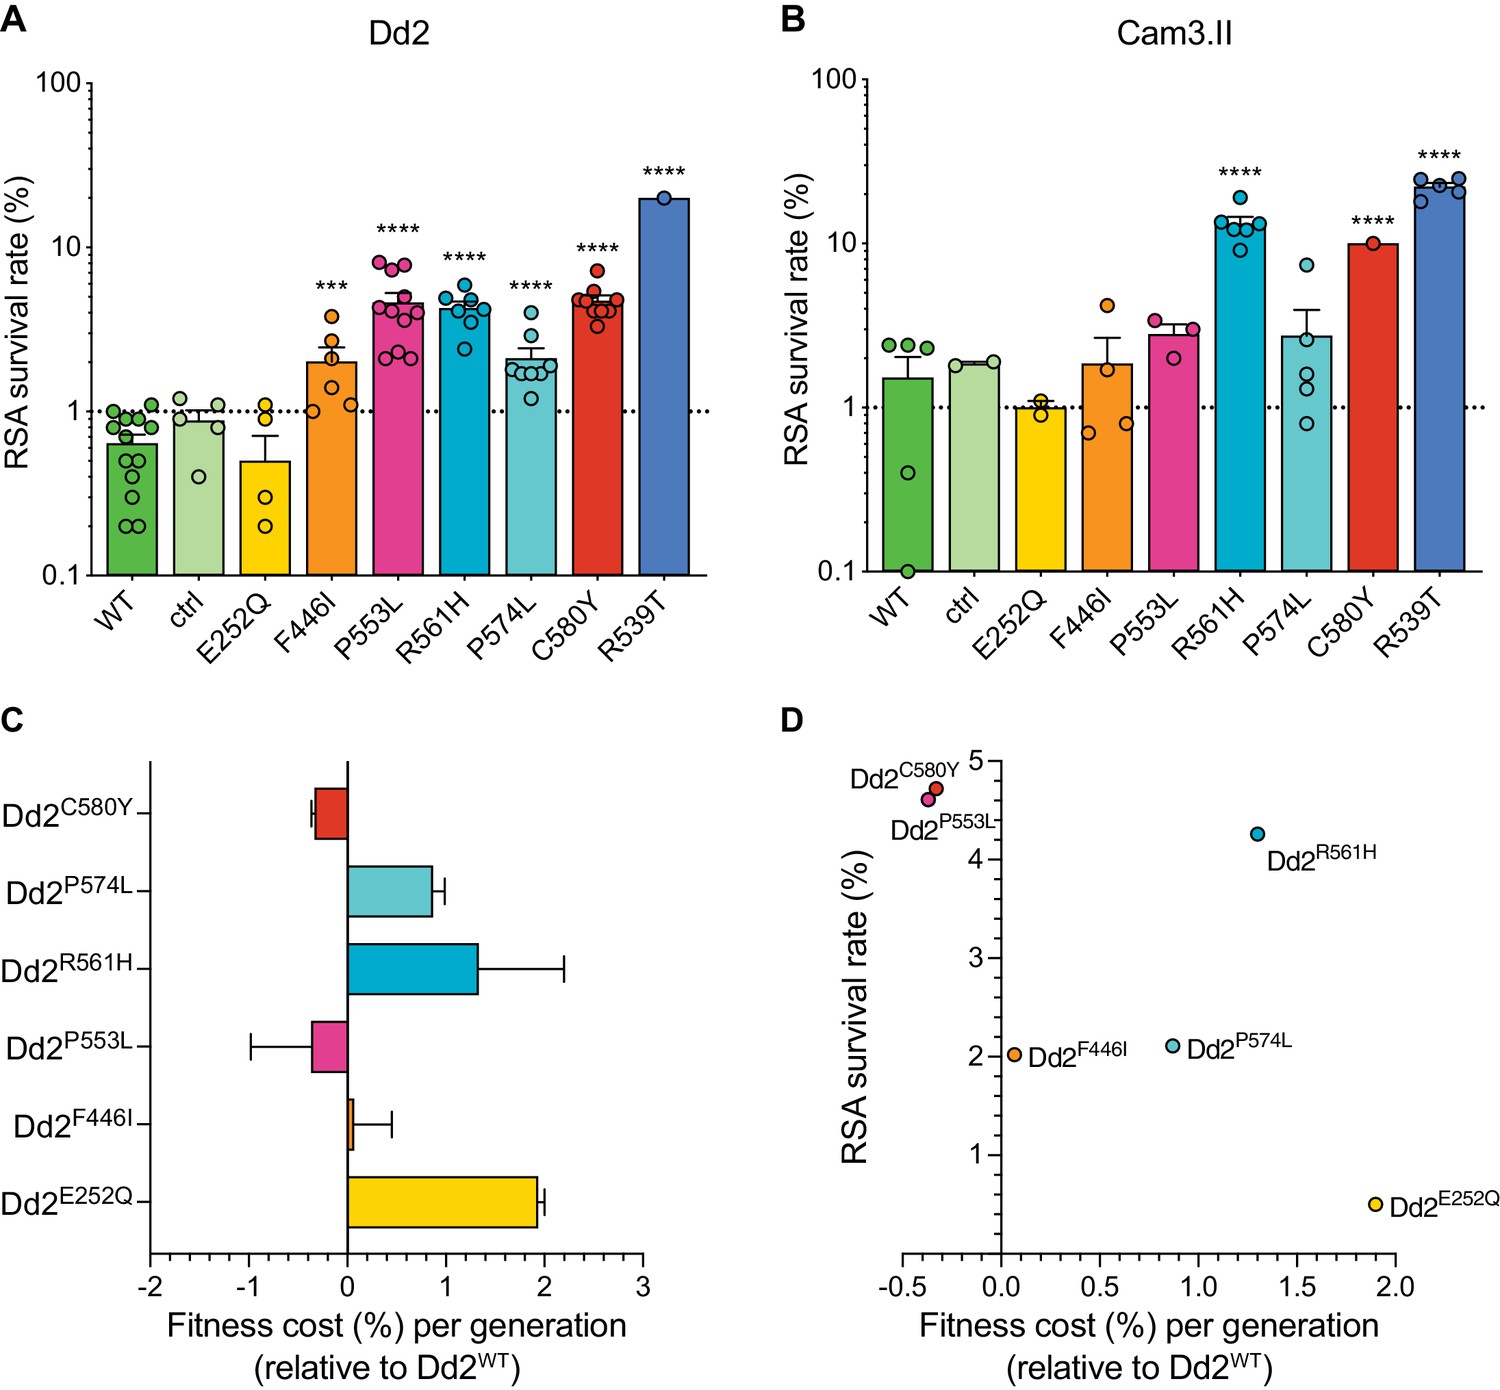
Southeast Asian K13 mutations yield elevated RSA survival and minor impacts on in vitro growth in gene-edited parasite lines.
(A, B) RSA survival rates for Dd2 (Indochina) and Cam3.II (Cambodia) P. falciparum parasites expressing wild-type or mutant K13. Gene-edited parasites were generated using CRISPR/Cas9 or zinc-finger nucleases. Control (ctrl) lines express silent shield mutations at the K13 gRNA cut site. Parental lines are described in Table 1 and Supplementary file 4. Results show the percentages of early ring-stage parasites (0–3 hr post invasion) that survived a 6 hr pulse of 700 nM DHA, relative to DMSO-treated parasites processed in parallel. Percent survival values are shown as means ± SEM (detailed in Figure 5—source data 1). Results were obtained from three to thirteen independent experiments, each performed in duplicate. p Values were determined by unpaired t tests and were calculated for mutant lines relative to the isogenic line expressing wild-type K13. *** p<0.001; **** p<0.0001. (C) Percent reductions in growth rate per 48 hr generation, expressed as fitness costs, for Dd2 mutant lines relative to the Dd2WT line. Fitness costs were determined by co-culturing the Dd2eGFP reporter line with either the Dd2 K13 wild-type parental line (Dd2WT) or gene-edited K13 mutant lines. Co-cultures were maintained for 20 days and percentages of eGFP+ parasites were determined by flow cytometry (see Figure 5—source data 2 and Figure 5—figure supplement 1). Fitness costs were initially calculated relative to the Dd2eGFP reporter line (Figure 5—figure supplement 1) and then normalized to the Dd2WT line. Mean ± SEM values were obtained from three independent experiments, each performed in triplicate. (D) Fitness costs for K13 mutant lines relative to the Dd2WT line plotted against their corresponding RSA survival values.
-
Figure 5—source data 1
Ring-stage survival (RSA) assay data for K13 edited SE Asian parasites and controls (Dd2 and Cam3.II strains).
- https://cdn.elifesciences.org/articles/66277/elife-66277-fig5-data1-v3.xlsx
-
Figure 5—source data 2
Fitness assay data (percent eGFP+ parasites) for K13 edited Dd2 parasites and parental control.
- https://cdn.elifesciences.org/articles/66277/elife-66277-fig5-data2-v3.xlsx
Figure 5—figure supplement 1
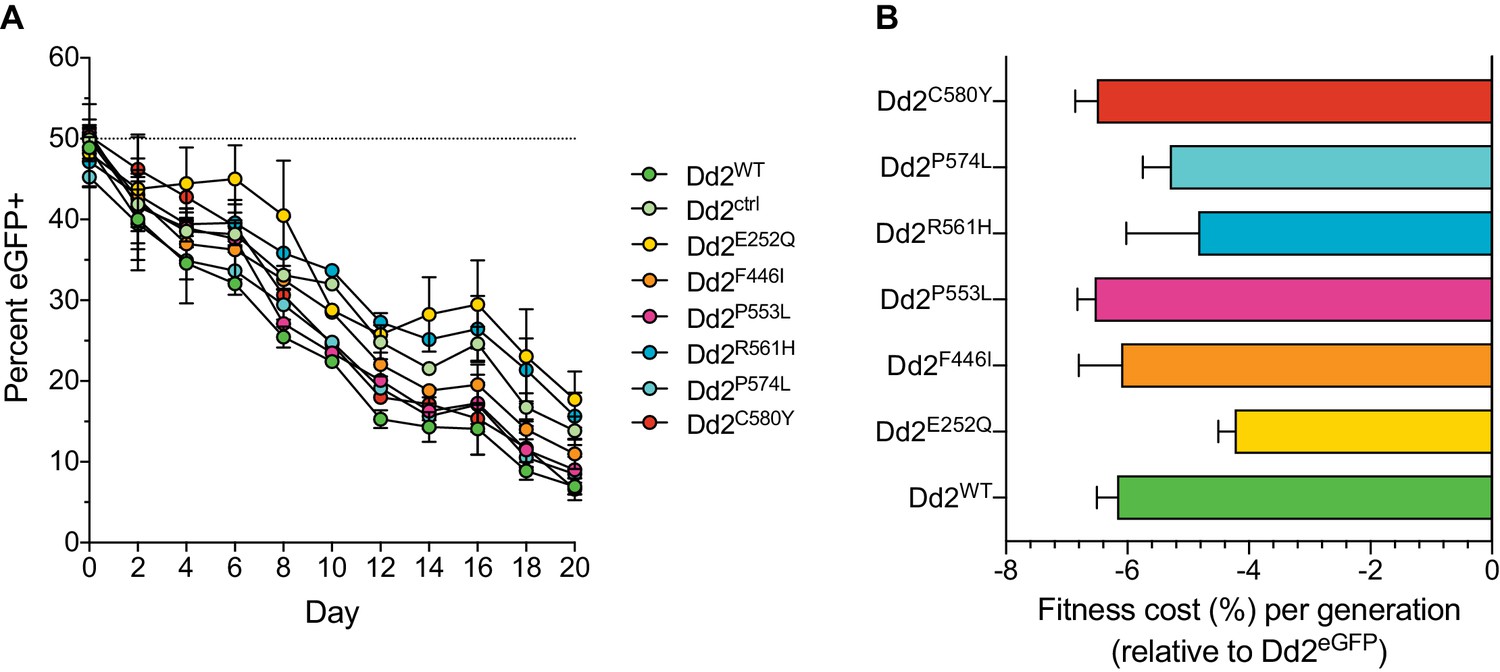
Southeast Asian K13 mutations result in minor in vitro growth defects in Dd2 parasites, with the exception of the C580Y and P553L mutations.
(A) Percentages of eGFP+ parasites over time in parasite cultures in which the eGFP-expressing Dd2 line was co-cultured in 1:1 mixtures with either the Dd2 K13 WT parental line (Dd2WT) or individual Dd2 gene-edited K13 mutant lines. Co-cultures were maintained over a period of 20 days, and the percentage of eGFP+ parasites in each mixture was determined by flow cytometry. Data are shown as means ± SEM. Results were obtained from three independent experiments, each performed in triplicate. (B) Percent reductions in growth rate per 48 hr generation, denoted as fitness costs, for Dd2WT and K13 edited mutant lines relative to the Dd2eGFP line. Results are shown as means ± SEM.
Figure 6
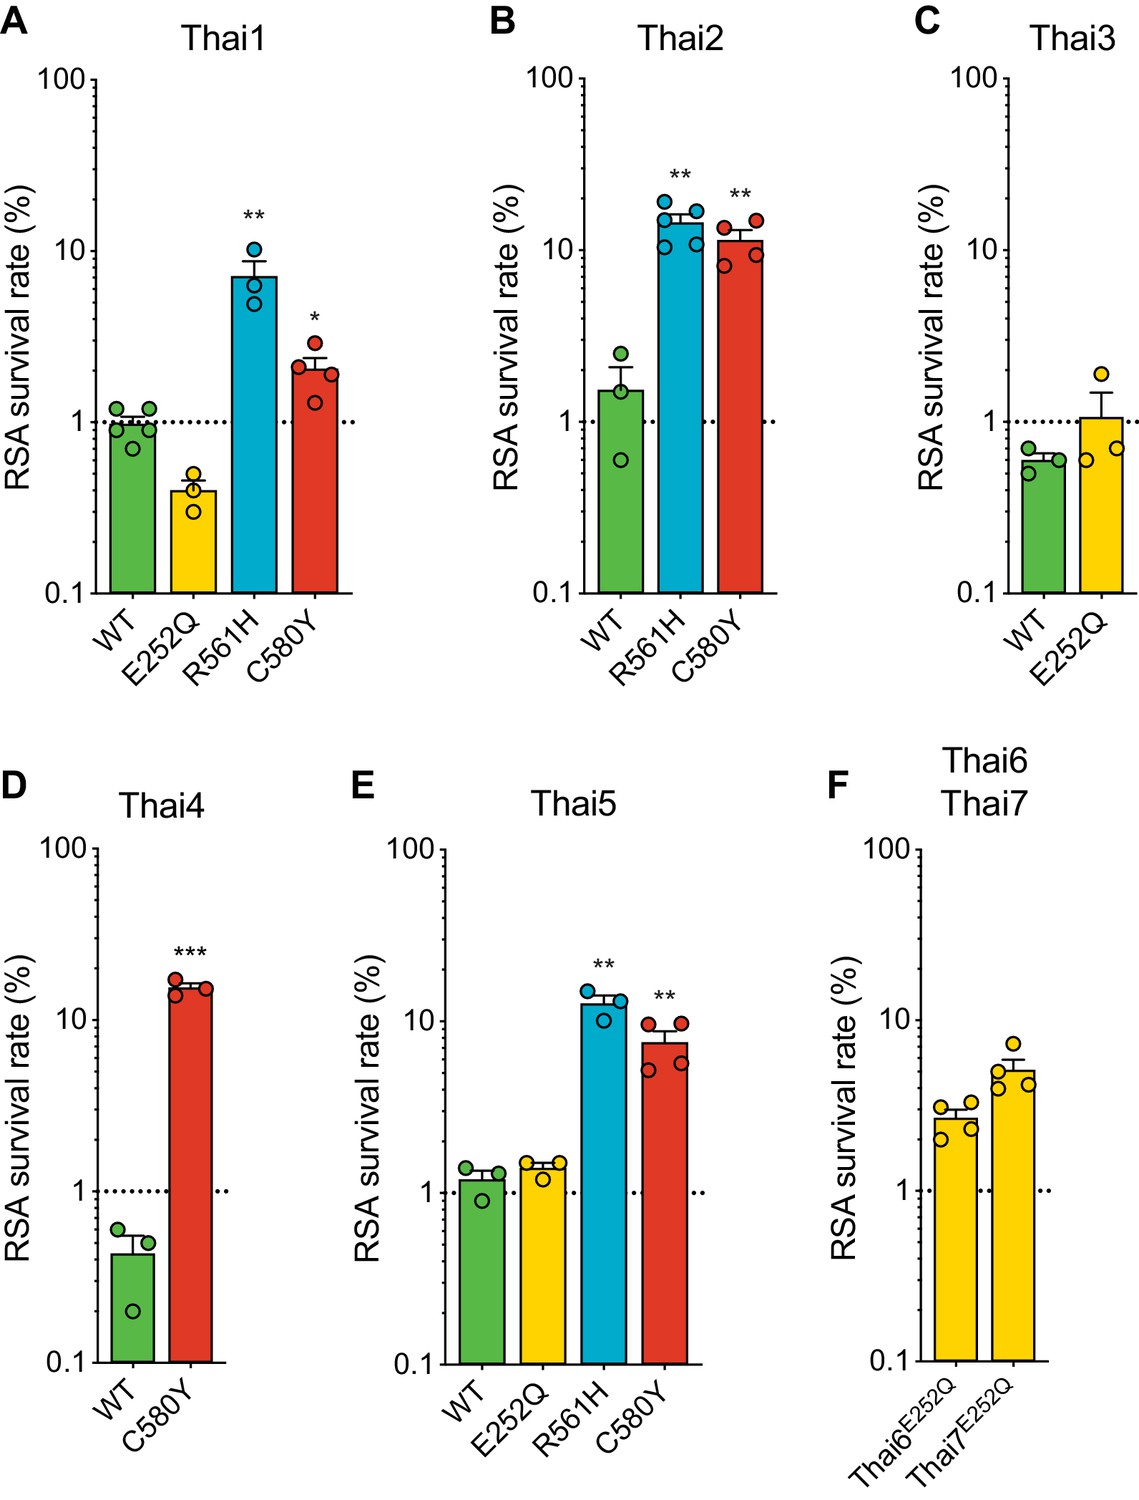
Thai isolates expressing mutant K13 display variable RSA survival rates.
RSA survival rates for (A–E) K13 edited Thai isolates and (F) K13 E252Q unedited Thai lines, shown as means ± SEM (detailed in Figure 6—source data 1). Results were obtained from three to seven independent experiments, each performed in duplicate. p Values were determined by unpaired t tests and were calculated for mutant lines relative to the isogenic line expressing wild-type K13. * p<0.05; ** p<0.01; *** p<0.001.
-
Figure 6—source data 1
Ring-stage survival (RSA) assay data for K13 edited Thai parasites and controls.
- https://cdn.elifesciences.org/articles/66277/elife-66277-fig6-data1-v3.xlsx
Figure 7 with 1 supplement
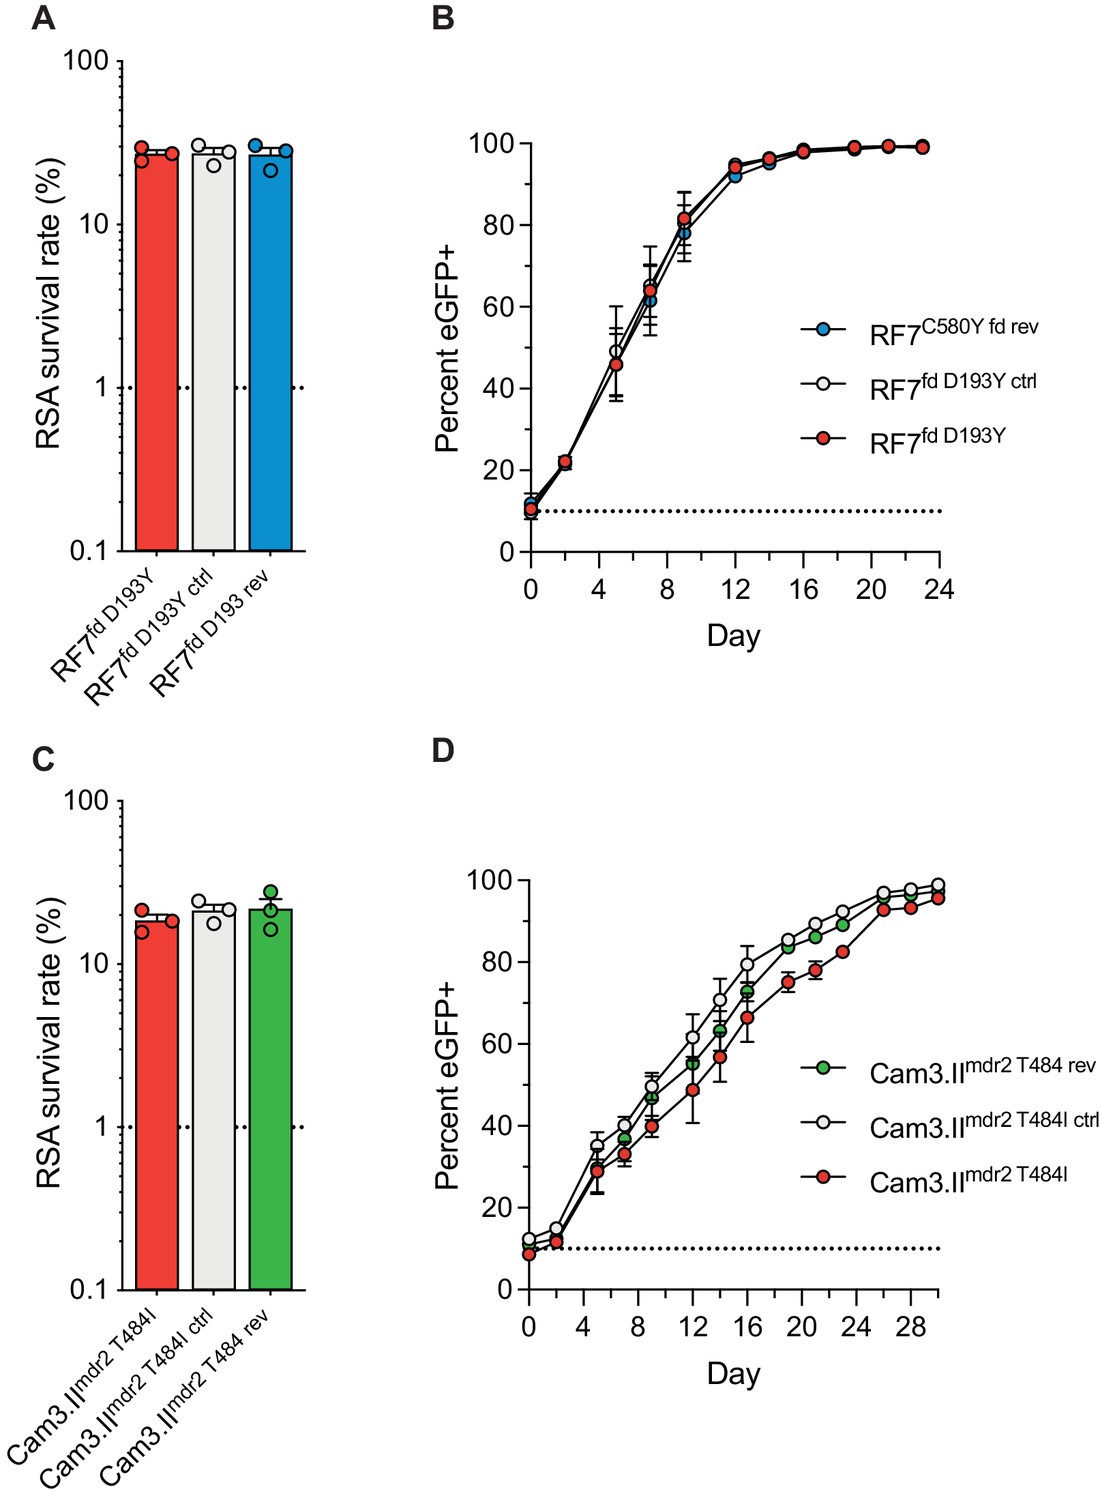
Ferredoxin (fd) and multidrug resistance protein 2 (mdr2) mutations do not impact RSA survival or in vitro growth rates in K13 C580Y parasites.
RSA survival rates for (A) RF7C580Y parasite lines expressing the fd variant D193Y (parent), this variant plus silent shield mutations (edited control), or fd D193 (edited revertant), and (C) Cam3.IIC580Y parasite lines expressing the mdr2 variant T484I (parent), this variant plus silent shield mutations (edited control), or mdr2 T484 (edited revertant). Parental lines are described in Table 1 and Supplementary file 4. Mean ± SEM survival rates were generated from three independent experiments, each performed in duplicate. (B, D) In vitro eGFP-based fitness assays performed with (B) fd and (D) mdr2 RF7C580Y or Cam3.IIC580Y edited lines, respectively. Competitive growth assays were seeded with individual lines plus the Dd2eGFP+ reporter line at starting ratios of 10:1. Results show percentages of eGFP+ parasites over time. Co-cultures were maintained over a period of 24 days (fd edited lines) or 30 days (mdr2 edited lines), and percentages of eGFP+ parasites were determined by flow cytometry. Results were obtained from two to three independent experiments, each performed in triplicate, and are shown as means ± SEM. All values are provided in Figure 7—source data 1, 2, 3.
-
Figure 7—source data 1
Ring-stage survival (RSA) assay data for fd and mdr2 edited parasites and controls.
- https://cdn.elifesciences.org/articles/66277/elife-66277-fig7-data1-v3.xlsx
-
Figure 7—source data 2
Fitness assay data (percent eGFP+ parasites) for RF7 fd edited parasites and parental control.
- https://cdn.elifesciences.org/articles/66277/elife-66277-fig7-data2-v3.xlsx
-
Figure 7—source data 3
Fitness assay data (percent eGFP+ parasites) for Cam3.II mdr2 edited parasites and parental control.
- https://cdn.elifesciences.org/articles/66277/elife-66277-fig7-data3-v3.xlsx
Figure 7—figure supplement 1
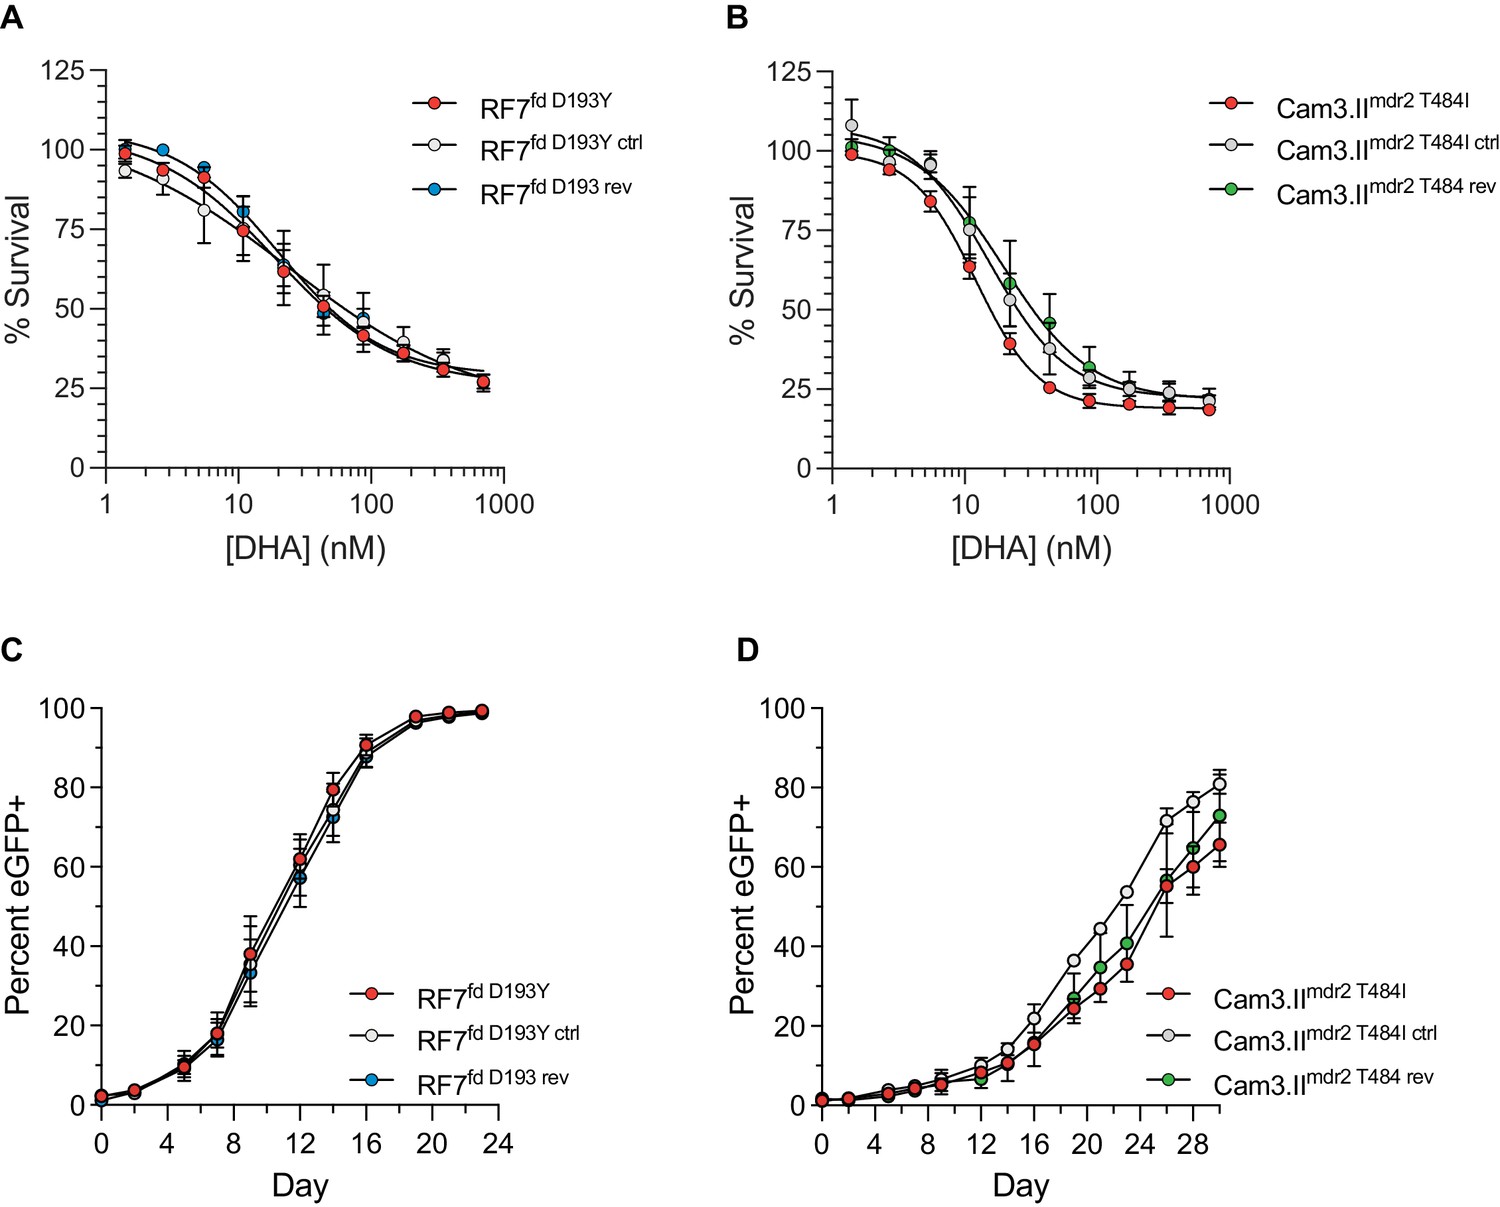
Ferredoxin (fd) and multidrug resistance protein 2 (mdr2) mutations do not impact RSA survival or in vitro growth in K13 C580Y parasites.
(A, B) Ring-stage survival assays (RSAs) performed on fd and mdr2 edited lines and parental controls (RF7C580Y and Cam3.IIC580Y, respectively). Results show RSA survival rates across a range of DHA concentrations. Survival rates were calculated relative to DMSO-treated parasites processed in parallel. Results were obtained from three independent experiments, each performed in duplicate. Data are shown as means ± SEM. (C, D) In vitro eGFP-based fitness assays performed with (C) fd and (D) mdr2 RF7C580Y or Cam3.IIC580Y edited lines, respectively. Competitive growth assays were seeded with individual lines plus the Dd2eGFP+ reporter line at starting ratios of 100:1. Results show percentages of eGFP+ parasites over time. Co-cultures were maintained over a period of 24 days (fd edited lines) or 30 days (mdr2 edited lines) and percentages of eGFP+ parasites were determined by flow cytometry. Results were obtained from two to three independent experiments, each performed in triplicate, and are shown as means ± SEM.
Tables
Table 1
Plasmodium falciparum lines employed herein.
| Parasite | Origin | Year | K13 | Resistance |
|---|---|---|---|---|
| 3D7WT | Africa | 1981 | WT | -- |
| F32WT | Tanzania | 1982 | WT | -- |
| UG659WT | Uganda | 2007 | WT | CQ, SP |
| UG815WT | Uganda | 2008 | WT | CQ, SP |
| Dd2WT | Indochina | 1980 | WT | CQ, MFQ, SP |
| Cam3.IIWT | Cambodia | 2010 | WT | CQ, SP |
| CamWTC580Y | Cambodia | 2010 | C580Y | ART, CQ, SP |
| RF7C580Y | Cambodia | 2012 | C580Y | ART, CQ, PPQ, SP |
| Thai1WT | Thailand | 2003 | WT | CQ, SP |
| Thai2WT | Thailand | 2004 | WT | CQ, MFQ, SP |
| Thai3WT | Thailand | 2003 | WT | CQ, SP |
| Thai4WT | Thailand | 2003 | WT | CQ, SP |
| Thai5WT | Thailand | 2011 | WT | CQ, SP |
| Thai6E252Q | Thailand | 2008 | E252Q | ART (low), CQ, MFQ, SP |
| Thai7E252Q | Thailand | 2010 | E252Q | ART (low), CQ, MFQ, SP |
-
Parasite superscripts refer to the K13 sequence.
ART, artemisinin; CQ, chloroquine; MFQ, mefloquine; PPQ, piperaquine; SP, sulfadoxine/pyrimethamine; WT, wild type.
Key resources table
| Reagent type (species) or resource | Designation | Source or reference | Identifiers | Additional information |
|---|---|---|---|---|
| Gene (Plasmodium falciparum 3D7 strain) | Kelch13 (K13) | PlasmoDB | PF3D7_1343700 | |
| Gene (Plasmodium falciparum 3D7 strain) | Ferredoxin (fd) | PlasmoDB | PF3D7_1318100 | |
| Gene (Plasmodium falciparum 3D7 strain) | Multidrug resistance protein 2 (mdr2) | PlasmoDB | PF3D7_1447900 | |
| Strain, strain background (Plasmodium falciparum) | 3D7 clone A10 (3D7WT) | D. Goldberg, Washington University School of Medicine, St. Louis, MO, USA | see Table 1 and Supplementary file 4 for additional details on all P. falciparum strains employed herein | |
| Strain, strain background (Plasmodium falciparum) | F32-TEM (F32WT) | F. Benoit-Vical, Université de Toulouse, Toulouse, France Ariey et al., 2014 | ||
| Strain, strain background (Plasmodium falciparum) | UG659 (UG659WT) | P. Rosenthal, University of California, San Francisco, CA, USA | ||
| Strain, strain background (Plasmodium falciparum) | UG815 (UG815WT) | P. Rosenthal, University of California, San Francisco, CA, USA | ||
| Strain, strain background (Plasmodium falciparum) | Dd2 (Dd2WT) | The Malaria Research and Reference Reagent Resource Center (MR4), BEI Resources | MRA-156 | |
| Strain, strain background (Plasmodium falciparum) | Cam3.II (Cam3.IIR539T) | R. Fairhurst, NIAID, NIH, Bethesda, MD, USA Straimer et al., 2015 | PH0306-C | |
| Strain, strain background (Plasmodium falciparum) | CamWT | R. Fairhurst, NIAID, NIH, Bethesda, MD, USA Straimer et al., 2015 | PH0164-C | |
| Strain, strain background (Plasmodium falciparum) | RF7 (RF7C580Y) | R. Fairhurst, NIAID, NIH, Bethesda, MD, USA Ross et al., 2018 | PH1008-C | |
| Strain, strain background (Plasmodium falciparum) | Thai1WT | T. Anderson, Texas Biomedical Research Institute, San Antonio, TX, USA | TA32A2A4 | |
| Strain, strain background (Plasmodium falciparum) | Thai2WT | T. Anderson, Texas Biomedical Research Institute, San Antonio, TX, USA | TA50A2B2 | |
| Strain, strain background (Plasmodium falciparum) | Thai3WT | T. Anderson, Texas Biomedical Research Institute, San Antonio, TX, USA | TA85R1 | |
| Strain, strain background (Plasmodium falciparum) | Thai4WT | T. Anderson, Texas Biomedical Research Institute, San Antonio, TX, USA | TA86A3 | |
| Strain, strain background (Plasmodium falciparum) | Thai5WT | T. Anderson, Texas Biomedical Research Institute, San Antonio, TX, USA | NHP-01334-6B | |
| Strain, strain background (Plasmodium falciparum) | Thai6E252Q | T. Anderson, Texas Biomedical Research Institute, San Antonio, TX, USA | NHP4076 | |
| Strain, strain background (Plasmodium falciparum) | Thai7E252Q | T. Anderson, Texas Biomedical Research Institute, San Antonio, TX, USA | NHP4673 | |
| Strain, strain background (Escherichia coli) | HST08 | Takara | Cat. #636766 | Stellar Competent Cells |
| Genetic reagent (Plasmodium falciparum) | Transgenic parasite lines | This study and Straimer et al., 2015 | See Supplementary file 5 | Available from D. Fidock upon request |
| Commercial assay or kit | In-Fusion HD Cloning Plus kit | Takara | Cat. #638909 | |
| Commercial assay or kit | QuantiFast Multiplex PCR Kit | Qiagen | Cat. #204654 | |
| Sequence-based reagents | Oligonucleotides | This study | See Supplementary file 7 | |
| Recombinant DNA reagents | Plasmids | This study | See Supplementary file 8 | Available from D. Fidock upon request |
| Sequence-based reagents | qPCR primers and probes | This study | See Supplementary file 9 | |
| Antibody | Anti-K13 (P. falciparum) (Mouse monoclonal) | I. Trakht, Columbia University Medical Center, New York, NY, USA Gnädig et al., 2020 | Antibody clone E9 WB (1:1000) | |
| Antibody | Anti-ERD2 (P. falciparum) (Rabbit polyclonal) | MR4, BEI Resources | MRA-1 | WB (1:1000) |
| Antibody | StarBright Blue 700 goat anti-mouse | Bio-Rad | 12004158 | WB (1:200) |
| Antibody | StarBright Blue 520 goat anti-rabbit | Bio-Rad | 12005869 | WB (1:1000) |
| Other | 4–20% Criterion TGX Precast Protein Gel | Bio-Rad | 5671093 | Used with recommended buffers, also purchased from Bio-Rad |
| Chemical compound, drug | Carbenicillin disodium salt | Sigma | C1389 | |
| Chemical compound, drug | WR99210 | Jacobus Pharmaceuticals | ||
| Chemical compound, drug | Dihydroartemisinin (DHA) | Sigma | D7439 | |
| Software, algorithm | GraphPad Prism Version 9 | GraphPad Software, San Diego, CA, USA | graphpad.com | |
| Software, algorithm | ImageJ software | NIH, Bethesda, MD, USA | imagej.nih.gov |
Additional files
-
Supplementary file 1
Sample information and approval from within-country ethics committees for K13 genotyping data.
- https://cdn.elifesciences.org/articles/66277/elife-66277-supp1-v3.xlsx
-
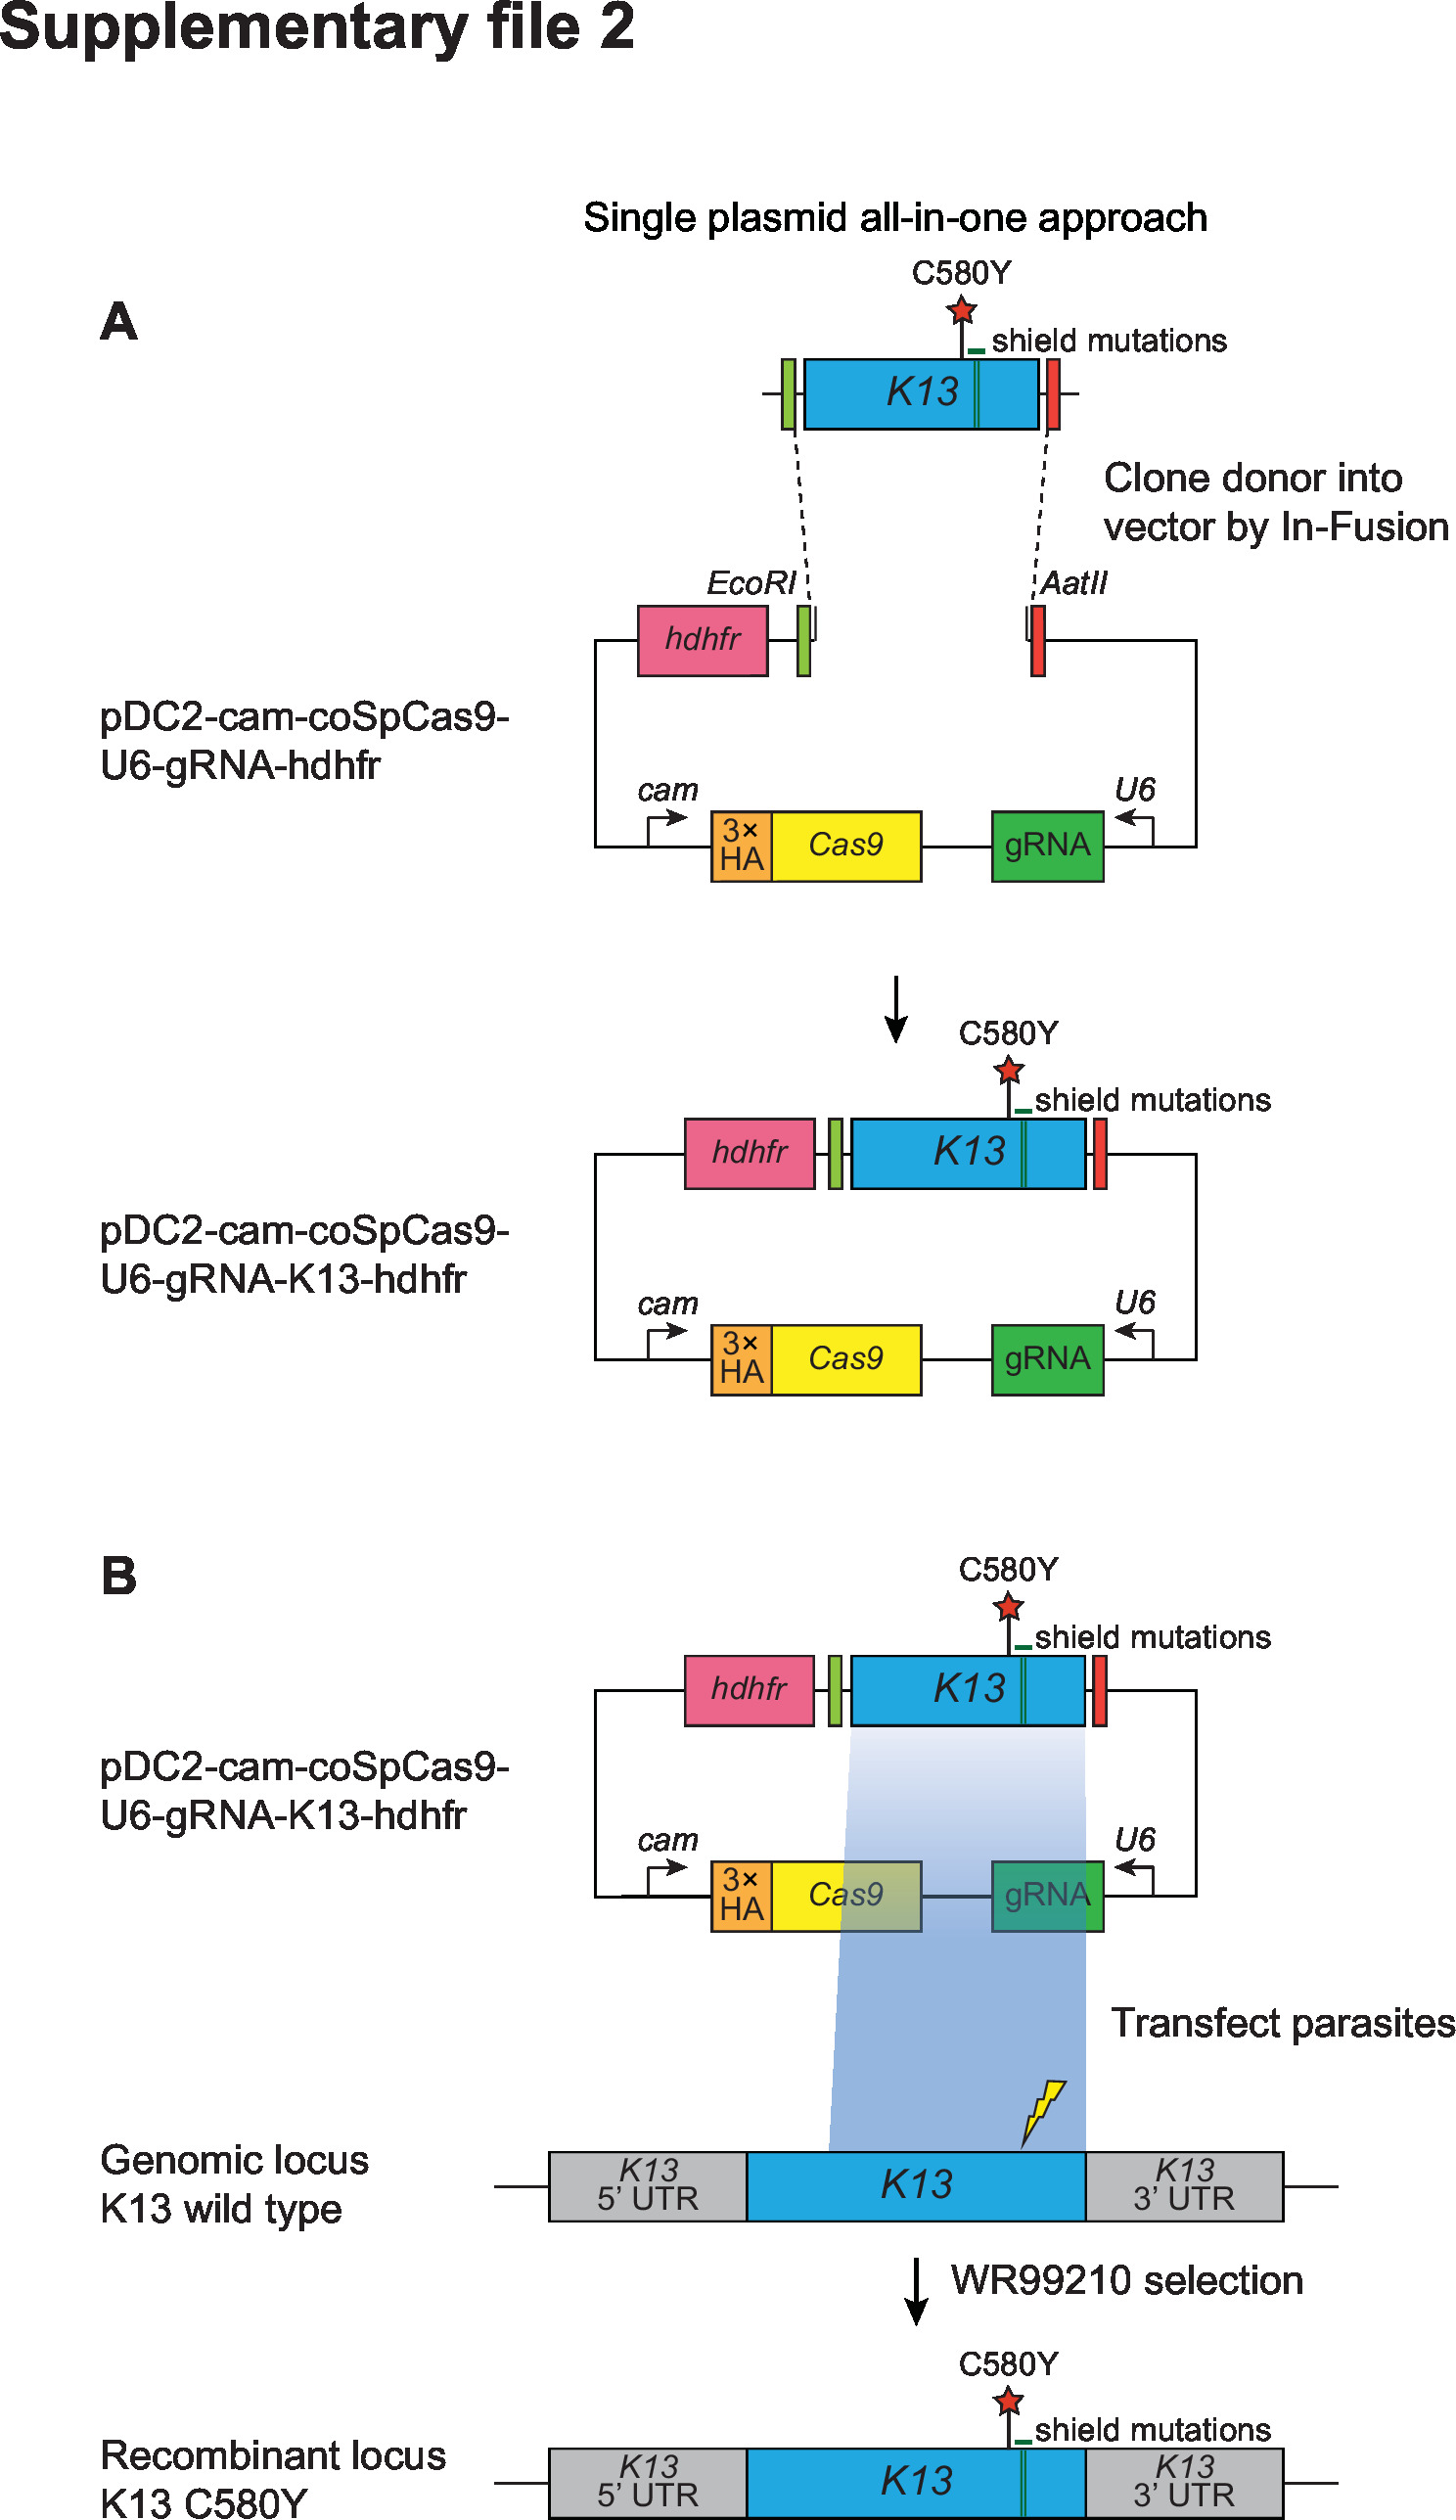
Supplementary file 2
CRISPR/Cas9 strategy for editing the K13 locus.
All-in-one plasmid approach used for CRISPR/Cas9-mediated K13 gene editing, consisting of a K13-specific donor template for homology-directed repair, a K13-specific gRNA expressed from the U6 promoter, a Cas9 cassette with expression driven by the calmodulin (cam) promoter, and a selectable marker (human dhfr, conferring resistance to the antimalarial WR99210 that inhibits P. falciparum DHFR). The Cas9 sequence was codon-optimized for improved expression in P. falciparum. Donors coding for specific mutations of interest (e.g., K13 C580Y, red star) were generated by site-directed mutagenesis of the K13 wild-type donor sequence. Green bars indicate the presence of silent shield mutations that were introduced to protect the edited locus from further cleavage. The lightning bolt indicates the location of the cut site in the genomic target locus. Primers used for cloning and final plasmids are described in Supplementary files 7 and 8, respectively.
- https://cdn.elifesciences.org/articles/66277/elife-66277-supp2-v3.jpg
-
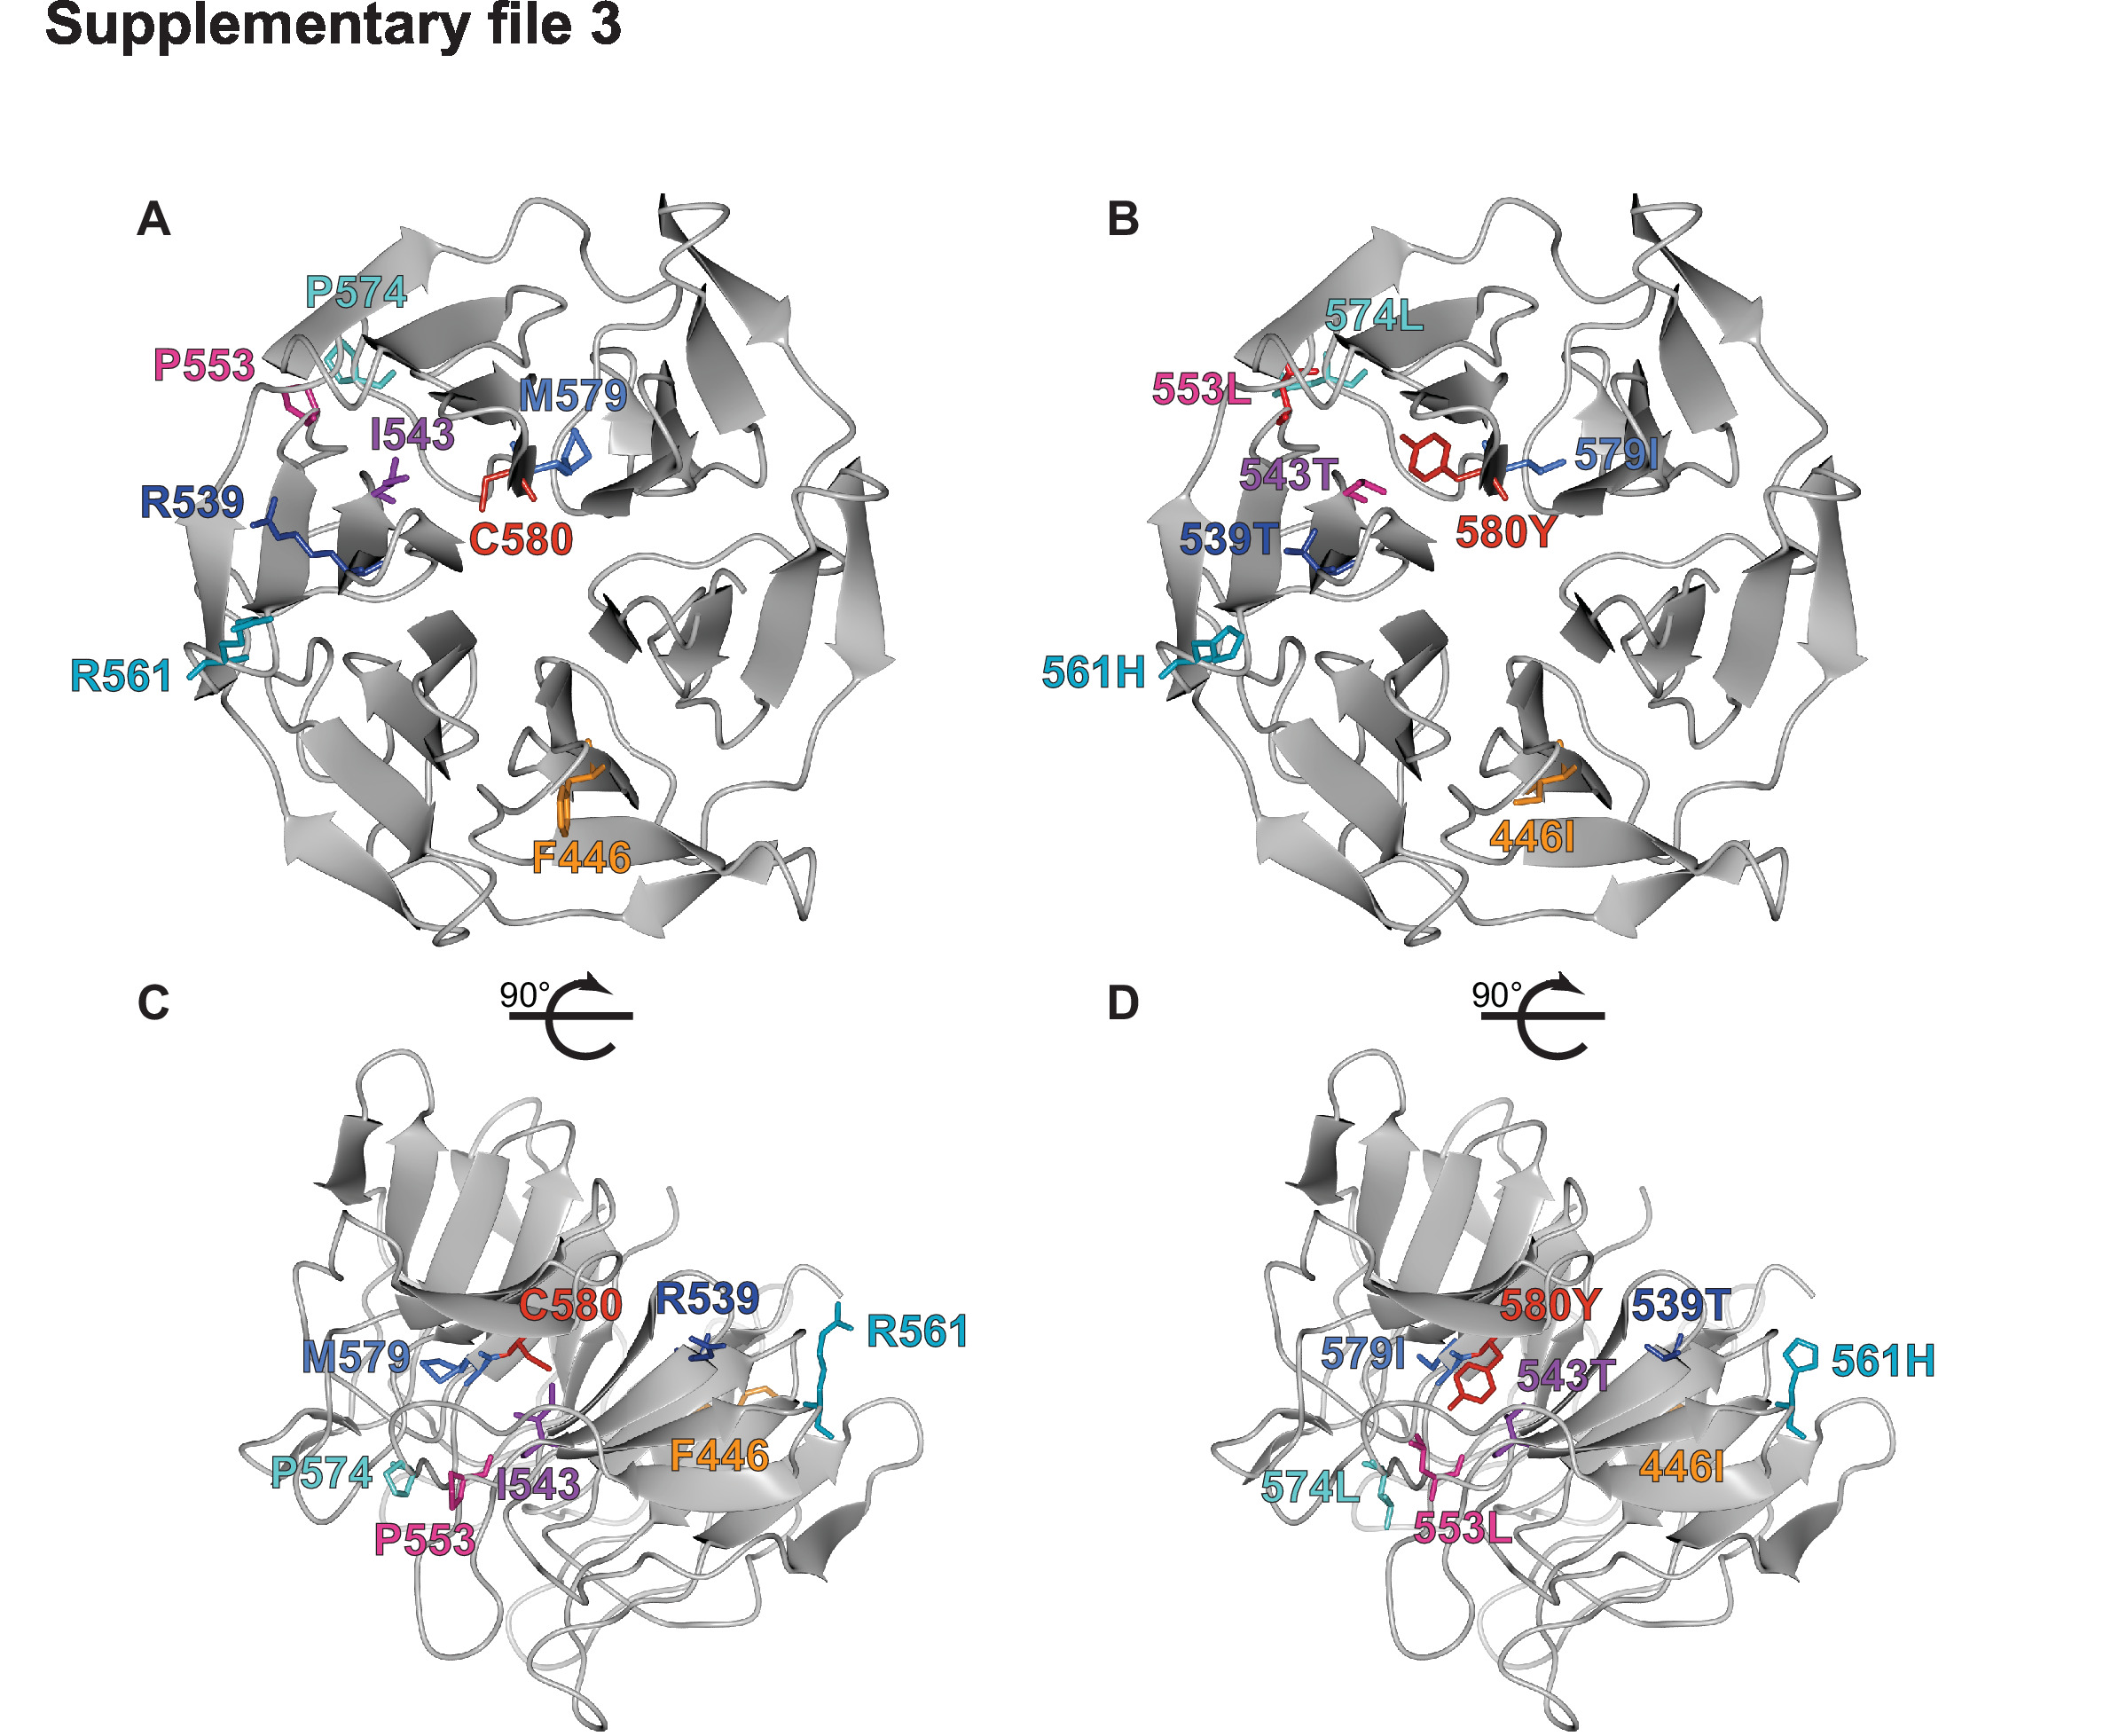
Supplementary file 3
Crystal structure of K13 propeller domain showing positions of mutated residues.
(A, B) Top and (C, D) side views of the crystal structure of the K13 propeller domain (PDB ID: 4YY8), highlighting residues of interest (F446I, orange; R539T, dark blue; I543T, purple; P553L, pink; R561H, dark turquoise; P574L, light turquoise; M579I medium blue; C580Y, red). Structures shown in (A) and (C) show wild-type residues while (B) and (D) show mutated residues.
- https://cdn.elifesciences.org/articles/66277/elife-66277-supp3-v3.jpg
-
Supplementary file 4
Geographic origin and drug resistance genotypes of P. falciparum clinical isolates and reference lines employed in this study.
- https://cdn.elifesciences.org/articles/66277/elife-66277-supp4-v3.xlsx
-
Supplementary file 5
Transgenic P. falciparum lines generated in this study.
- https://cdn.elifesciences.org/articles/66277/elife-66277-supp5-v3.xlsx
-
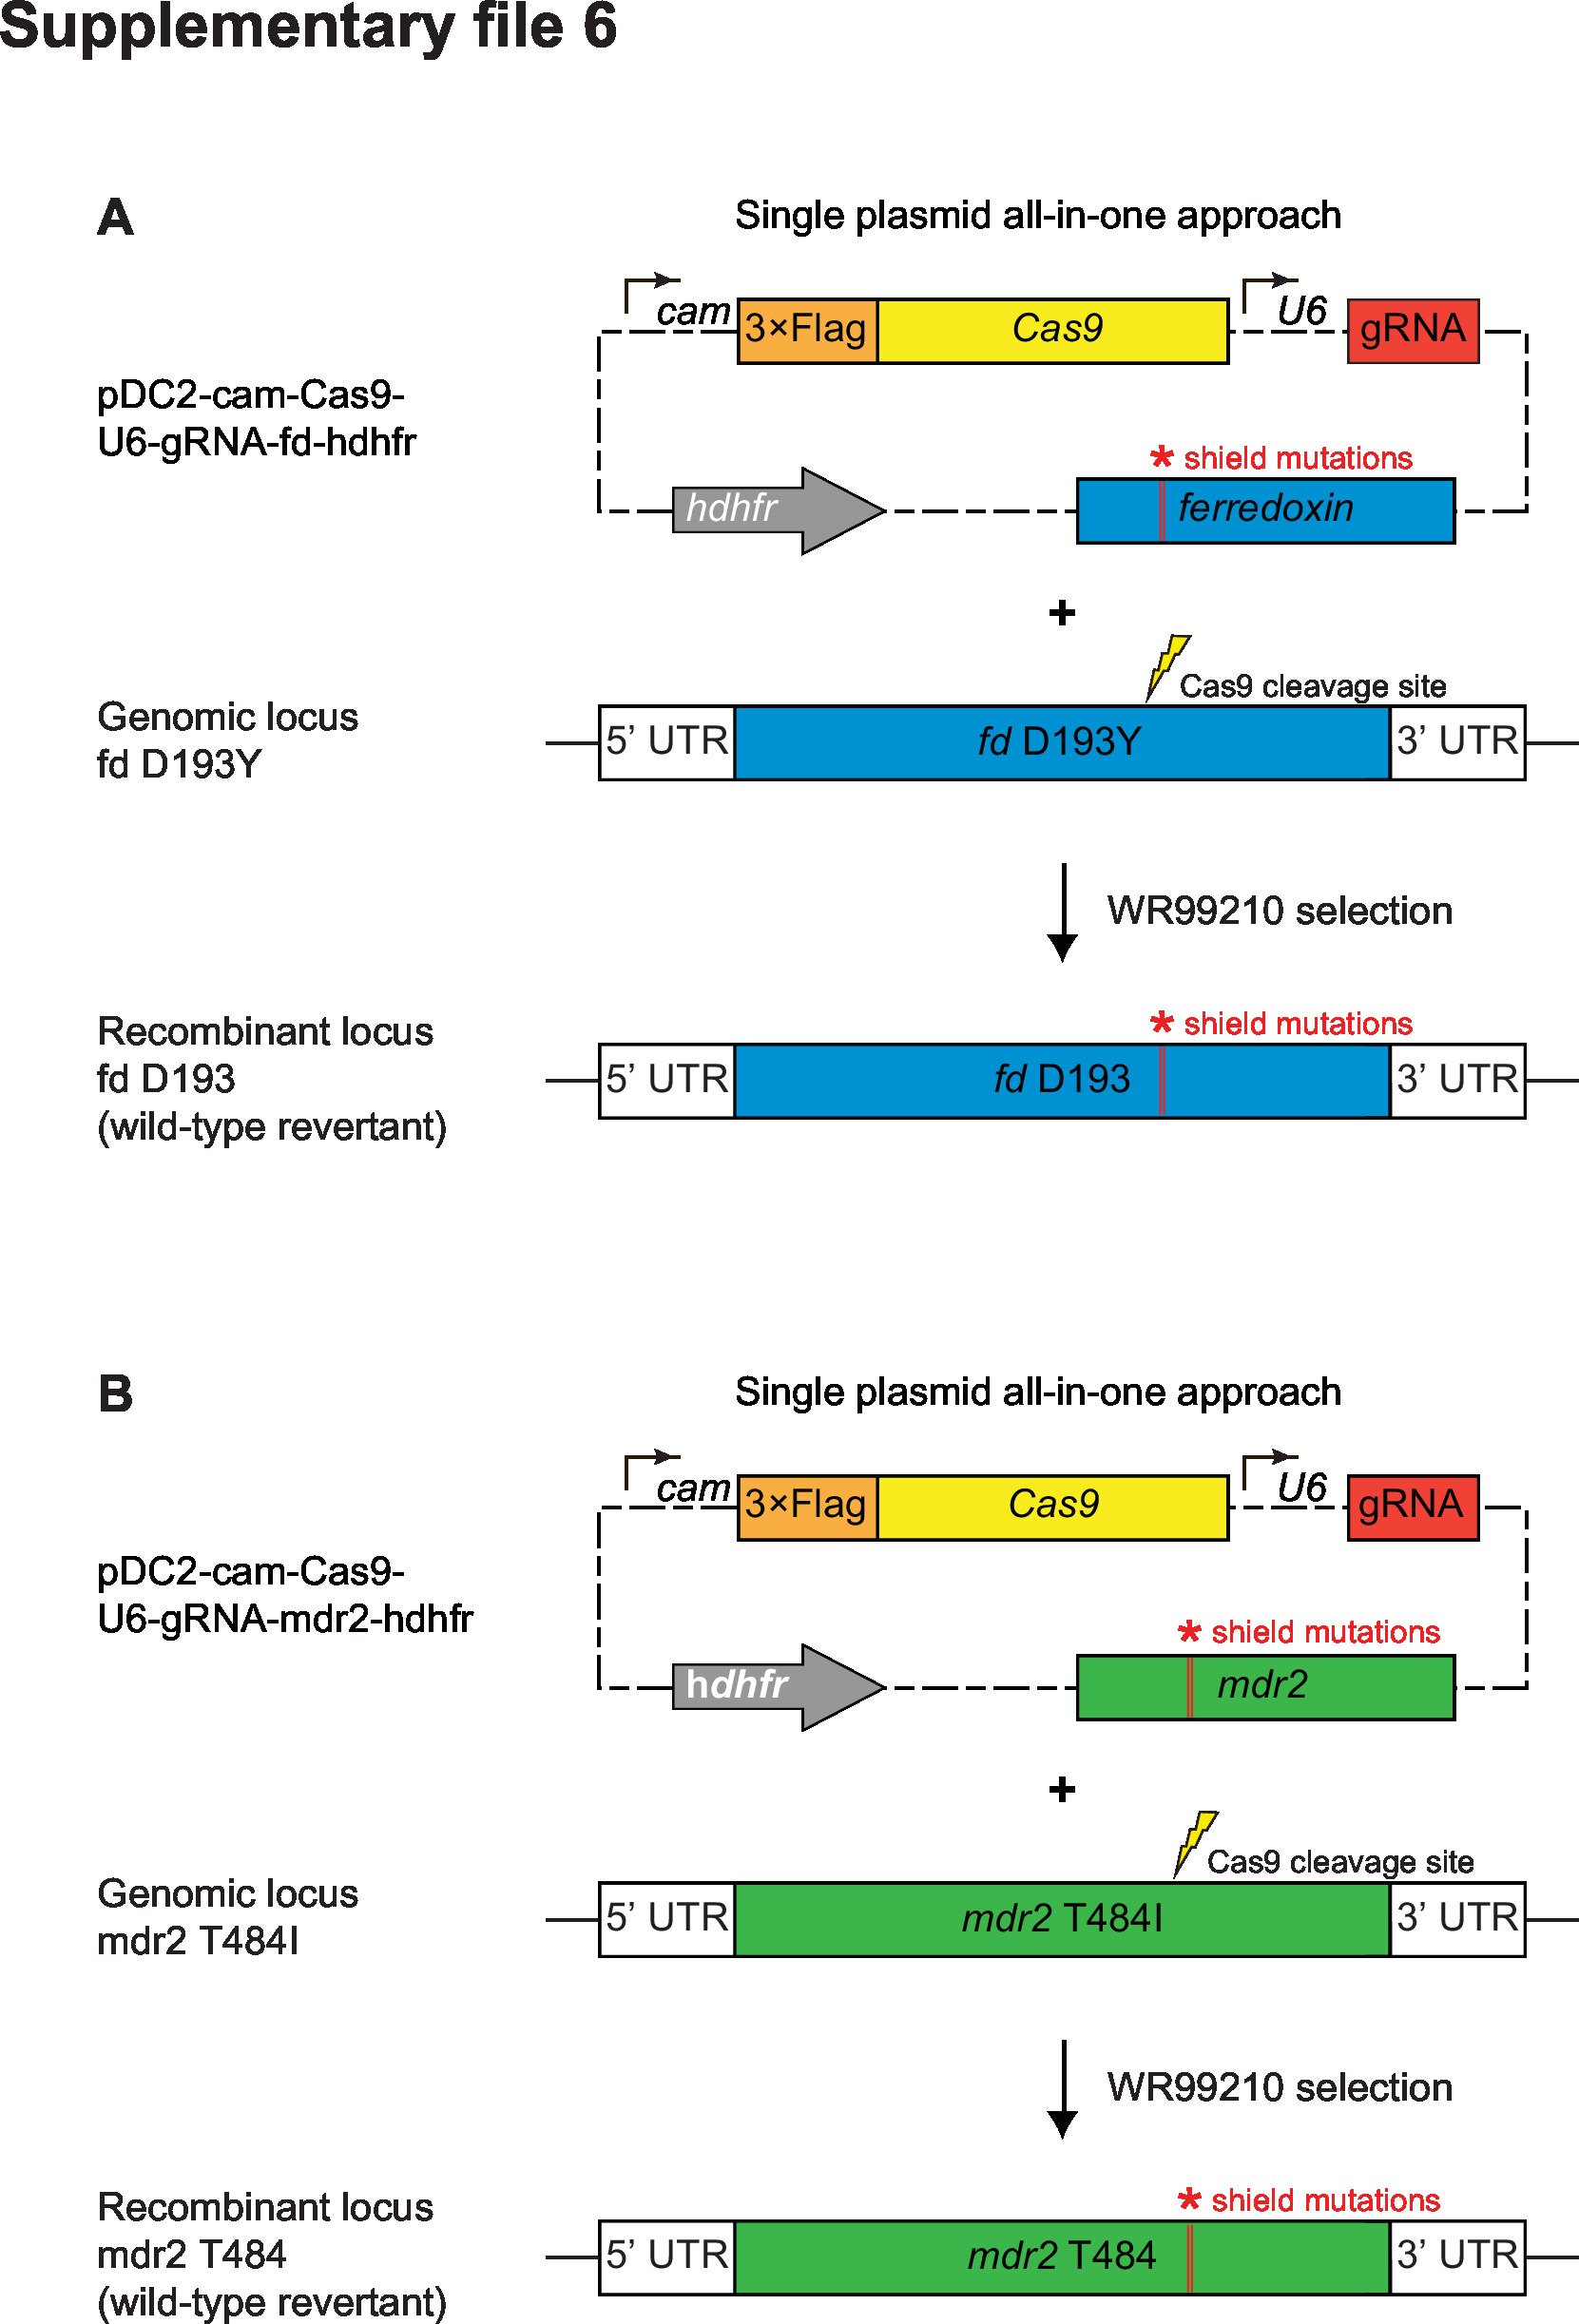
Supplementary file 6
CRISPR/Cas9 strategy for editing the ferredoxin (fd) and multidrug resistance protein 2 (mdr2) loci.
All-in-one plasmid approaches used for CRISPR/Cas9-mediated editing of (A) the ferredoxin (fd) locus or (B) the multidrug resistance protein 2 (mdr2) locus. Plasmids consisted of a (A) fd or (B) mdr2 specific donor template for homology-directed repair, a gene-specific gRNA expressed from the U6 promoter, a Cas9 cassette with expression driven by the cam promoter, and a selectable marker (human dhfr, conferring resistance to WR99210). Donors coding for specific mutations of interest (fd D193Y or mdr2 T484I) were generated by site-directed mutagenesis of the wild-type donor sequences. Red bars indicate the presence of silent shield mutations used to protect edited loci from further cleavage. Primers used for cloning and final plasmids are described in Supplementary files 7 and 8, respectively.
- https://cdn.elifesciences.org/articles/66277/elife-66277-supp6-v3.jpg
-
Supplementary file 7
Oligonucleotides used in this study.
- https://cdn.elifesciences.org/articles/66277/elife-66277-supp7-v3.xlsx
-
Supplementary file 8
Description of gene-editing plasmids generated in this study.
- https://cdn.elifesciences.org/articles/66277/elife-66277-supp8-v3.xlsx
-
Supplementary file 9
Real-time PCR (qPCR) primers and probes used in this study.
- https://cdn.elifesciences.org/articles/66277/elife-66277-supp9-v3.xlsx
-
Transparent reporting form
- https://cdn.elifesciences.org/articles/66277/elife-66277-transrepform-v3.docx
Download links
A two-part list of links to download the article, or parts of the article, in various formats.
Downloads (link to download the article as PDF)
Open citations (links to open the citations from this article in various online reference manager services)
Cite this article (links to download the citations from this article in formats compatible with various reference manager tools)
Plasmodium falciparum K13 mutations in Africa and Asia impact artemisinin resistance and parasite fitness
eLife 10:e66277.
https://doi.org/10.7554/eLife.66277


