Conserved visual capacity of rats under red light

  1. Nader Nikbakht  Is a corresponding author
  2. Mathew E Diamond  Is a corresponding author
  1. Tactile Perception and Learning Lab, International School for Advanced Studies (SISSA), Italy
  2. Department of Brain and Cognitive Sciences, McGovern Institute for Brain Research, Massachusetts Institute of Technology, United States

Abstract

Recent studies examine the behavioral capacities of rats and mice with and without visual input, and the neuronal mechanisms underlying such capacities. These animals are assumed to be functionally blind under red light, an assumption that might originate in the fact that they are dichromats who possess ultraviolet and green cones, but not red cones. But the inability to see red as a color does not necessarily rule out form vision based on red light absorption. We measured Long-Evans rats’ capacity for visual form discrimination under red light of various wavelength bands. Upon viewing a black and white grating, they had to distinguish between two categories of orientation: horizontal and vertical. Psychometric curves plotting judged orientation versus angle demonstrate the conserved visual capacity of rats under red light. Investigations aiming to explore rodent physiological and behavioral functions in the absence of visual input should not assume red-light blindness.

Introduction

Rats, like many rodents, are largely crepuscular and, even during daylight, are usually to be found in poorly illuminated environments (Macdonald et al., 1994). Their retina is rod dominated, with cones making up as little as 1% of photoreceptors (Jacobs et al., 2001; La Vail, 1976). Rods are about 100 times more sensitive (Yau, 1994) and allow vision under low-light conditions, with a peak spectral absorption of rhodopsin in rods in rats and mice at 498 nm (Bridges, 1959; Govardovskii et al., 2000; Lyubarsky et al., 2004). Although rats are not color-blind (Jacobs et al., 2001; Lemmon and Anderson, 1979; Muenzinger and Reynolds, 1936; Munn and Collins, 1936; Walton and Bornemeier, 1938), they perform poorly in discriminating between nearby wavelengths, compared to humans (Walton, 1933). Rats’ color sensitivity is based on two sets of cones with peak sensitivities in the range of ultraviolet (UV cones; peak absorption at 358–359 nm) and green (M cones; peak absorption at 509–510 nm) (Deegan and Jacobs, 1993; Jacobs et al., 1991; Szél and Röhlich, 1992). Recently, electroretinogram (ERG) responses of the photopic spectral sensitivity curves of photoreceptors of rats and mice were measured throughout the UV–visible spectrum (300–700 nm) (Rocha et al., 2016). These measurements identified two sensitivity peaks in Wistar rats: 362 and 502 nm; no significant response to long wavelength light (above 620 nm) was detected. This study reinforced the already existing notion that red light is experienced as a total absence of usable light. In contrast, another study (Niklaus et al., 2020) showed significant scotopic and photopic ERG responses to red light even at low intensities. In the present study, we challenge the notion of form vision blindness under red light and find, contrary to expectation, good behavioral performance.

Results

Rats were required to categorize the orientation of a solid disk-like object with a circular boundary and raised parallel bars, alternately colored white and black, thus forming a square-wave grating (Figure 1A). Orientations in the range of 0°– 45° were rewarded as horizontal and orientations in the range of 45°– 90° as vertical (Figure 1B). Figure 1C illustrates the sequence of events in the behavioral task. Each trial started with the rat’s head poke, which triggered the opening of an opaque gate, followed by illumination with light sources of various wavelengths. A transparent panel in front of the object prevented the rat from generating tactile cues. After observing the object, the rat turned its head toward one spout (L or R) and licked. The boundary angle, 45°, was rewarded randomly on left or right. Illumination was by a white LED array or else by monochrome LEDs with peak intensities at 626 nm, 652 nm, 729 nm, 854 nm, and 930 nm as measured by spectrometer and verified by the manufacturer’s datasheet (Figure 1D; see Materials and methods). Half widths were 12.1–49.1 nm.

Figure 1 with 3 supplements see all
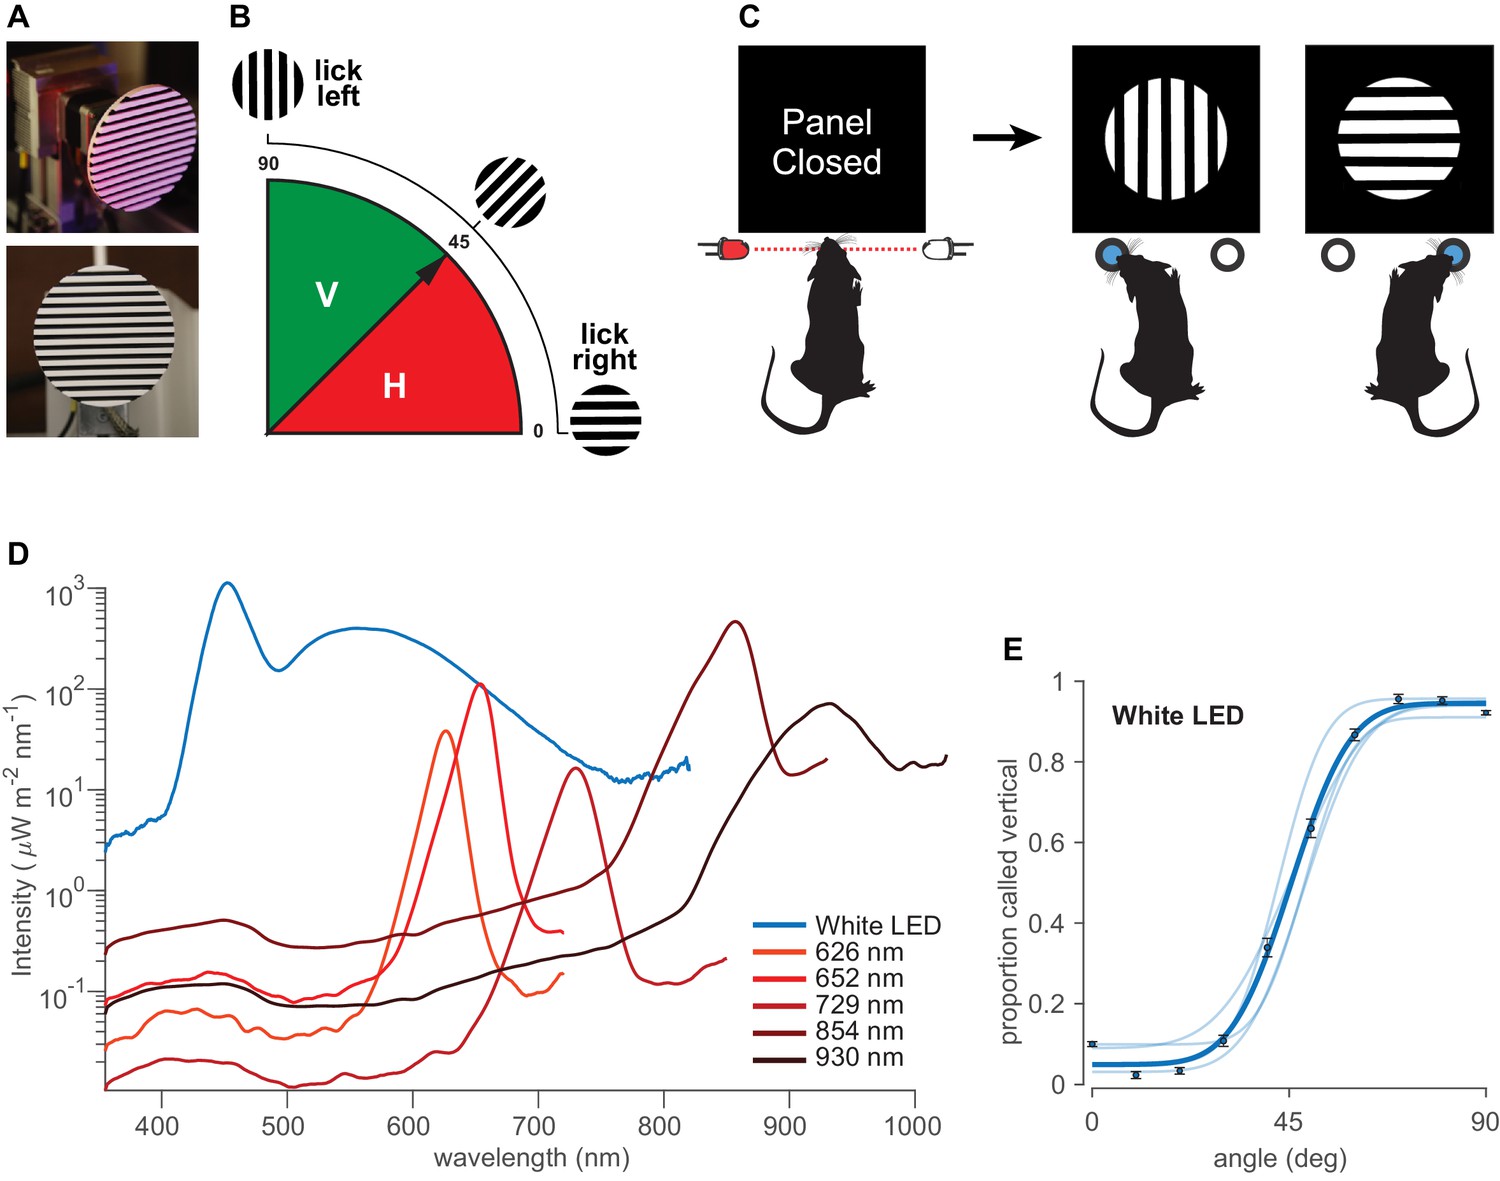
Orientation categorization task.

(A) Discriminandum viewed at an oblique angle (top) and exactly from the front (bottom), the latter approximating the perspective of the rat. (B) Schematic of the orientations of the stimuli and rule of the categorization task. 0°–45° (red) rewarded as ‘horizontal’ and 45°–90° (solid green) rewarded as ‘vertical.’. (C) Sequential steps in the behavioral task. Each trial started with a head poke that interrupted a light beam and triggered the opening of an opaque gate, followed by visual access to the object. After probing the stimulus, the rat turned its head toward one spout, in this illustration left for vertical and right for horizontal. See Figure 1—figure supplement 1 for the experimental setup. (D) Irradiance for each LED, measured by a spectrometer at the stimulus delivery area. Equivalent photon count values are shown in Figure 1—figure supplement 2. Integrating the power under the curves at wavelengths <580 nm reveals that the infrared LEDs emitted from 2 to 50 times higher intensity as compared to red LEDs, in spite of the infrared LEDs being centered at longer wavelengths (infrared 854 nm and 930 nm LEDs emitted 1.95 and 0.48 mW/cm2, respectively, while red 626, 652, and 729 nm LEDs emitted 0.12, 0.28, and 0.04 mW/cm2, respectively). See Figure 1—figure supplement 3 for normalized irradiance for each LED along with rat’s photopigment spectral sensitivity. (E) Pale curves give the performance of four rats under white light. Dark data points and curves show the average over all rats. Error bars are 95% binomial confidence intervals. See Figure 1—figure supplement 1A for the experimental setup.

© 2018, Nikbakht et al. Figure 1A-C has been reproduced from Figure 1 of Nikbakht et al., 2018, under the terms of the Creative Commons Attribution - NonCommercial - NoDerivs (CC BY-NC-ND 4.0) license.

To quantify rats’ performance, we used a cumulative Gaussian function to fit psychometric curves to the data of each rat (see Materials and methods). Figure 1E reveals that all rats (N = 4, pale curves; average curve in dark blue) performed well under white LED illumination.

Sessions with white light were interspersed with sessions illuminated by various narrow-band monochrome LEDs in the range of red, far-red, and infrared (Figure 1D). It is important to perform behavioral testing under illumination with narrow-band monochromatic light sources to eliminate the possibility of off-peak illumination through the tail of a wide power spectral distribution. Figure 2A,B shows that dark-adapted rats performed the visual categorization task under 626 nm and 652 nm LEDs (perceived as red by humans) with accuracy equivalent to that under white light, refuting the common belief of functional blindness under red light. Rats performed well even under peak 729 nm (Figure 2C), perceived as far-red by humans, though clearly diminished with respect to white. They performed poorly under infrared illumination, comprising 854 nm and 930 nm light (Figure 2D,E).

Figure 2 with 2 supplements see all
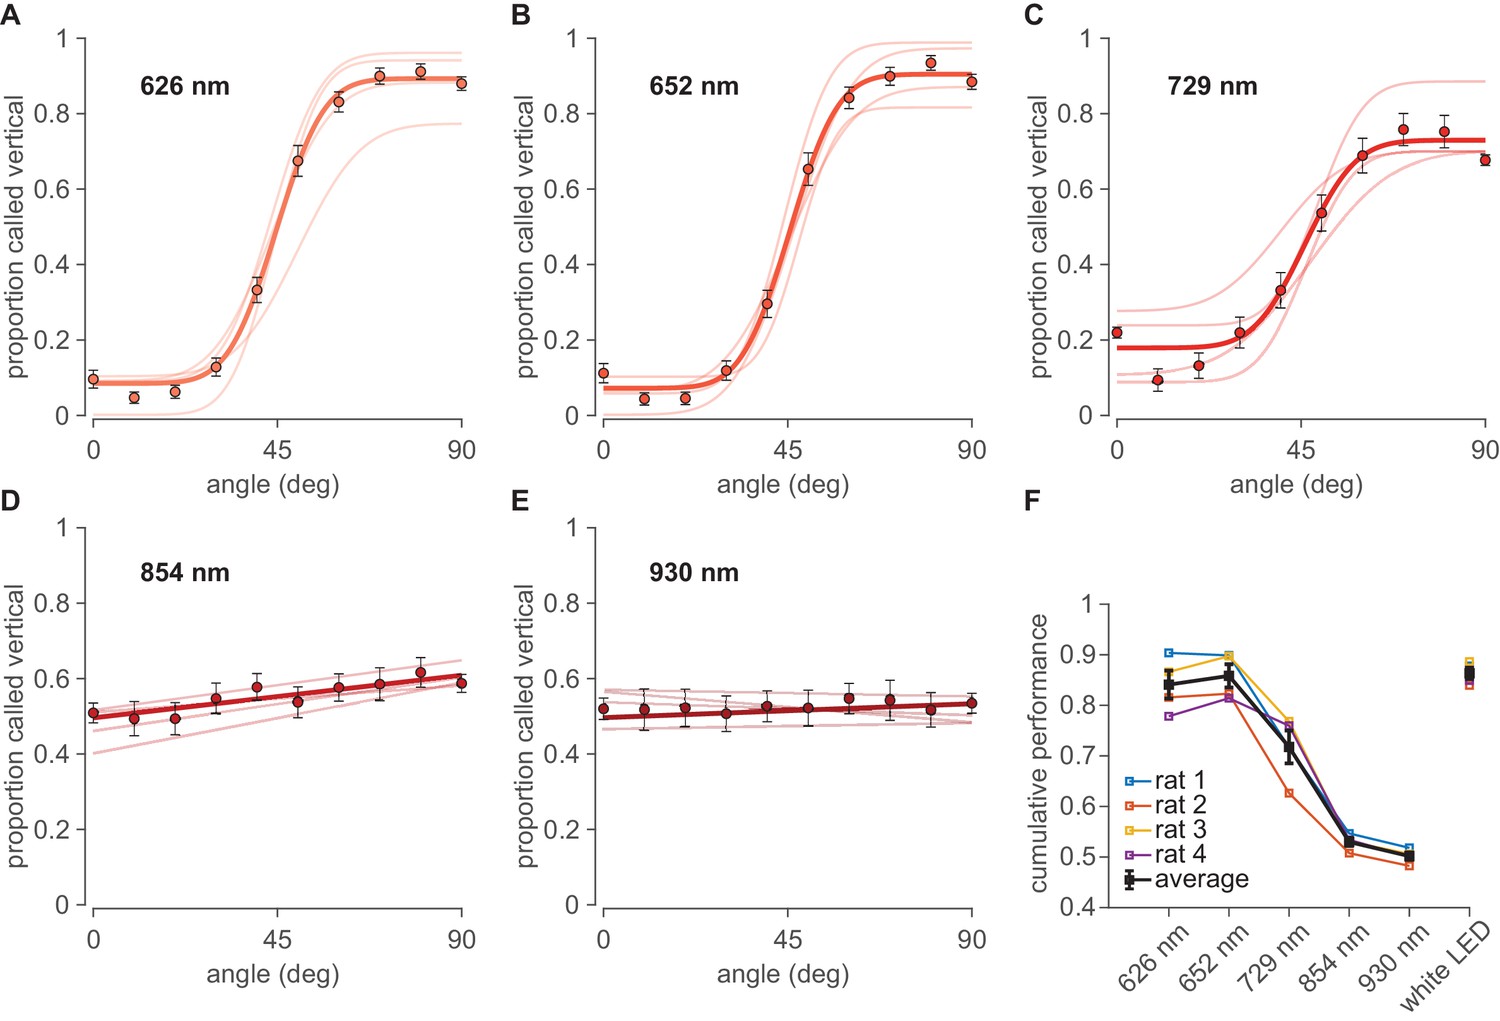
Performance under far-red and infrared illumination.

(A–E) Psychometric curves obtained under illumination with monochrome LEDs in the range of far-red to infrared with peak wavelengths at 626 nm, 652 nm, 729 nm, 854 nm and 930 nm, respectively. Pale curves depict the performance of four rats. Dark data points and lines or curves show the average over all rats. Error bars are 95% binomial confidence intervals. (F) Summary cumulative performance (proportion correct) for all four rats (colored) and the average rat (black) in each illumination condition. Data from all angles (except 45°, uninformative about discriminative capacity) are pooled. See Figure 2—figure supplement 1 for tests of significance.

The performance (N=four rats) under different illumination wavelengths is summarized by the cumulative proportion of trials categorized correctly across all orientations (Figure 2F). Average performance was 87 ± 2% correct under white light (confidence interval is SEM across rats). Average performance was 84 ± 3% under 626 nm illumination (p=0.158 compared to white light; bootstrap tests illustrated in Figure 2—figure supplement 1), 86 ± 2% under 652 nm (p=0.419 compared to white light), 72 ± 3% under 729 nm (p=0.00 compared to white light), 53 ± 2% under 854 nm (p=0.257 compared to chance), and 50 ± 1% under 930 nm average performance (p=0.316 compared to chance).

Visual acuity under the red LEDs (626 nm and 652 nm) cannot be explained by unintended ‘leakage’ toward shorter wavelengths. Figure 1D shows that the infrared LEDs (854 nm and 930 nm) emitted ~2–50 times higher intensity at shorter wavelength than did the red LEDs, yet performance under illumination by IR LEDs was at chance. Therefore, performance under red LEDs is better explained by positing that enough red light was absorbed to guide the discrimination.

Discussion

Rodent behavioral experiments done under red light are believed to place the animal in dark conditions while allowing the experimenter to observe the preparation directly or by video recording (Celikel and Sakmann, 2007; Cloke et al., 2015; Diamond et al., 1999; Englund et al., 2020; van Goethem et al., 2012; Harris and Diamond, 2000; Harris et al., 1999; Jacklin et al., 2016; Nikbakht et al., 2012; Pacchiarini et al., 2020; Reid et al., 2014; Salaberry et al., 2017; Sieben et al., 2015; Vasconcelos et al., 2011; Winters and Reid, 2010). The relevant literature includes place-cell studies of rats navigating under dim red light, taken as the absence of visual input (O'Keefe, 1976; Save et al., 2000; Zhang and Manahan-Vaughan, 2015; Zhang et al., 2014). In a developmental study of the visual cortex, mice were dark-reared but were allowed very brief daily exposure to red light (Kowalewski et al., 2021). Furthermore, red illumination is often used in reverse light cycle conditions in animal husbandry settings with the assumption that it will not affect rodent circadian rhythms (Emmer et al., 2018). In all of these cases, the animals may acquire more visual input than previously believed.

Rodents lack red cones (Deegan and Jacobs, 1993; Jacobs et al., 1991; Szél and Röhlich, 1992), but from the inability to see red as a color, it does not necessarily follow that they cannot absorb red light through their rod-dominated retina to support form vision. A recent study (Niklaus et al., 2020) examined the retinal responses mediated by rods and cones of pigmented (Brown Norway) and albino (Wistar) rats in response to monochromatic far-red light of 656 ± 10 nm in both photopic (light-adapted) and scotopic (dark-adapted) settings. Both rat strains showed significant scotopic and photopic ERG responses to red light even at low intensities. These results hinted that even far-red light may provide effective illumination for rats. However, whether the photoreceptor activation by red light can lead to functionally meaningful signals has not yet been established. Excitation of retinal receptors by red light does not, by itself, indicate behavioral availability of the signal. For instance, red light might act to entrain circadian rhythms, unconscious to the animal. The sensitivity of mice is emphasized by the finding that red illumination delivered into the brain in an optogenetic protocol evoked a behavioral artifact in mice performing a visually guided discrimination task (Danskin et al., 2015).

Although our study does not include direct measures of photoreceptor sensitivity, the results indicate that mechanisms must exist for converting miniscule quantities of receptor activation into meaningful signals, perhaps through some cross-retina population code. It is interesting to note the possibility that photoreceptors could respond to longer wavelengths through a nonlinear optical process including two-photon activation of photopigments (Palczewska et al., 2014; Vinberg et al., 2019), although the emission intensities used in our work are many orders of magnitude lower than those used in two-photon studies (Palczewska et al., 2014).

In the present work, Long-Evans rats demonstrated substantial visual form capacity under illumination by LEDs emitting long-wavelength red and far-red light – LEDs that are low cost, easy to use, and thus common in the laboratory. Object discrimination began to degrade when illumination wavelength increased from 652 to 729 nm and was almost nil at 854 nm. The performance curves suggest the optimal conditions for vision-excluded behavioral studies: illumination at 850 nm did not support visual form capacity, yet remains within the sensitivity range of inexpensive silicone detectors (CMOS and CCDs). Thus, behaviors may be documented by video while the animal performs without visual cues.

Rats and mice are the most frequently used laboratory mammals, ideal for research on spatial navigation (Frank et al., 2000; MacDonald et al., 2011; Moser et al., 2017; O’keefe and Nadel, 1978; Pastalkova et al., 2008; Wood et al., 2000) and the processing of tactile (Diamond et al., 2008; Fassihi et al., 2017; Zuo and Diamond, 2019) and olfactory (Chae et al., 2019; Koldaeva et al., 2019; Uchida and Mainen, 2003; Uchida et al., 2006) information. Neuroscientists have not traditionally attributed to rodents the wide range of visual perceptual functions characteristic of primates. However, there is growing interest in the use of rodents for the study of vision, alone or combined with other modalities (Gharaei et al., 2018; Nikbakht et al., 2018; Nikbakht Nasrabadi, 2015; Sieben et al., 2015; Zoccolan, 2015). Rats under broad-wavelength conditions spontaneously recognize an object even when views differ by angle, size, and position Zoccolan, 2015; such generalization is a hallmark of authentic visual perception and was once believed to belong only to primates. Importantly, they achieve high-level sensory-perceptual cognition through the workings of neuronal circuits that are accessible (Crochet et al., 2019; Matteucci and Zoccolan, 2020; Matteucci et al., 2019; Steinmetz et al., 2019; Tafazoli et al., 2017). The present study extends the range of visual perceptual functions for which rats can serve as models, characterizing their performance in judging object orientation and indicating the longest illumination wavelengths at which this capacity remains intact. A complete understanding of the visual processing of these animals is important not only in the design and control of the behavioral and physiological experiments but also to ensure optimal environmental lighting conditions for their well-being in laboratory settings.

Materials and methods

Experimental subject details

Request a detailed protocol

Four male Long–Evans rats (Charles River Laboratories, Calco, Italy) were used. They were caged in pairs and maintained on a 12/12 hr light/dark cycle; experiments were conducted during the light phase. Upon arrival, they were 8 weeks old, weighing approximately 250 g, and typically grew to over 600 g over the course of the study. They had free access to food in the cage. To promote motivation in the behavioral task, rats were water-deprived on days of training/testing. During each session, they received 17–22 mL of pear juice diluted in water (one unit juice: four units water) as reward. After the session, they were given access to water ad libitum for 1 hr, though they were rarely thirsty and then they were placed for several hours in a large, multistory-enriched environment to interact with other rats. Animals were examined weekly by a veterinarian. Protocols conformed to international norms and were approved by the Ethics Committee of SISSA and by the Italian Health Ministry (license numbers 569/2015-PR and 570/2015-PR).

Behavioral method details

Apparatus

The main chamber of the apparatus, custom-built in opaque white Plexiglas, measured 25 × 25 × 37 (H × W × L, cm) (Figure 1—figure supplement 1). The rat started a trial by interrupting an infrared beam detected by a phototransistor (Figure 1C). Beam interruption triggered fast opening of an opaque panel (through a rotational motion of 40° in 75 ms), actuated by a stepper motor, uncovering a circular hole (diameter 5 cm) in the front wall through which the rat could extend its head to see the object. The stimulus was 3 cm behind the opaque panel (further details below), and the reward spouts were 2 cm lateral to the edge of the stimulus. A transparent panel prevented direct touch.

The apparatus was in a Faraday cage that, with the door closed, provided acoustic, visual, and electromagnetic isolation. An array of 12 infrared emitters (λ = 930 nm, OSRAM Opto Semiconductors GmbH, Germany) illuminated the stimulus port to permit the investigator to monitor behavior and to execute video recording. Such illumination did not provide visual cues for the rat (see Results). For visual testing, different light sources were used to illuminate the stimulus: a pair of six white LED arrays or various high-power monochrome LED arrays (Roithner LaserTechnik, GmbH) with peak intensities at 626 nm (LED620-66-60), 652 nm (LED660-66-60), 729 nm (LED735-66-60), 854 nm (LED850-66-60), and 930 nm (LED940-66-60) (see Figure 1D for Gaussian fits to the measured spectrum in ambient temperature). The power spectral distributions were measured with a calibrated spectrometer and the associated software (Model: FLAME-S-XR1-ES, OceanOptics, Rochester, NY) via a visible-NIR fiber (core diameter 200 µm) attached to a cosine corrector. The cosine corrector acts as an optical diffuser that couples to the optical fiber and spectrometer to collect signals from 180° field of view. The spectrometer was calibrated using a Deuterium-Halogen calibration light source unit (DH-3 plus OceanOptics, Rochester, NY). This light source provides known absolute intensity values at several wavelengths, expressed in µW/cm²/nm. The spectral intensities emitted by this source are calibrated according to the intensity standard of the National Institute of Standards and Technology (NIST). The spectrometer calibration procedure accounts for the different sensitivities of the spectrometer across different wavelengths. The spectrometer we used has a software suite that reports the values measured from the calibrated spectrometer as spectral irradiance (the power received by a surface per unit area of the measurement probe per wavelength [in units of µW/cm2/nm]).

Two infrared-sensitive video systems (Point Grey Flea, Edmund Optics, Barrington, NJ) registered the rat’s actions. The first camera, equipped with a macro lens (Fujinon TV HF25HA-1B Lens, Fujifilm, Tokyo) mounted 25 cm above the stimulus delivery area (distance with respect to the center of stimulus), monitored the rat’s interaction with the object. In some sessions, this camera was set to 250 f/s to monitor head, snout, and whisker position and movement during behavior. The second camera provided a wide-angle view (Fujinon HF9HA-1B Lens, Fujifilm, Tokyo) and monitored the entire setup, illuminated with adjustable infrared LEDs, at 30 f/s.

Reward spouts included custom-made infrared diode sensors interrupted by the tongue. Only the licking signal from the correct spout triggered the pump motor (NE-500 programmable OEM; New Era Pump Systems, mounted on a vibration-cancellation pedestal) to extrude the reward, 0.05 mL per trial of diluted pear juice. Licking marked the end of the trial, accompanied by the closure of the opaque front panel. Before the next trial began, the motor on which the stimulus was mounted rotated to generate the next orientation.

Custom-made software was developed using LabVIEW (National Instruments, Austin, TX). An AVR32 board (National Instruments) and multiple Arduino Shields (National Instruments) acquired all sensor signals and controlled the motors, LEDs, and the reward syringe pumps. All the sensors, actuators (including motors and pumps), and lights were interfaced with the computer program allowing full control over a wide range of parameters governing the flow of the training and testing. Although fully automatic, the software allowed the experimenter to modify all the parameters of the task and control the lights, sensors, and motors online as needed.

Visual stimulus presentation

Request a detailed protocol

The stimulus was a black and white square-wave grating within a circular 9.8 cm diameter circumference, built in-house by a 3D printer (3D Touch, BFB Technologies, Figure 1A). It was mounted on a stepper motor and rotated to generate the trial’s intended orientation (Figure 1B). The stimulus stepper motor was controlled through a feedback system with a digital step counter to maintain the exact desired orientation. In the study that originally explored orientation judgment (Nikbakht et al., 2018), tactile exploration of the object was allowed in some trials, but the tactile condition is not considered in the present work; only visual, touch-free data are included. Within behavioral testing sessions, each stimulus orientation was sampled from a uniform distribution in 5° steps between −45° and 135° and presented in a semi-random fashion (sampling without replacement). For analysis, we binned the angles every 10°. Visual acuity is measured in cycles per degree (cpd), an assessment of the number of lines that can be seen as distinct within a degree of the visual field:

Acuity=12×tan-1(hd)cpd

where h is the width of each line in the stimulus and d is the distance from the eye. Considering the 3 cm distance behind the opaque panel (Figure 1—figure supplement 1), at the moment of panel opening, each cycle of the 14 cycles would occupy 2tan-1(3.5/30)=13.31° of visual angle, for a total stimulus coverage of about 117°. The spatial frequency of the gratings would be 1/(2tan-1(3.5/30))=0.075 cycles per degree of visual angle. As the normal visual acuity of Long–Evans rats has been estimated as ∼1 cpd (Prusky et al., 2002), the bars would be expected to be resolvable. Rats also have a large depth of focus, from 7 cm to infinity (Powers and Green, 1978). The width of the binocular field directly in front of the rat’s nose, generally considered the animal’s binocular viewing area (Mei et al., 2012), ranges from approximately 40°–110°, depending on head pitch (Wallace et al., 2013). The 117° stimulus should thus completely cover the rat’s binocular visual field.

When all illumination sources were turned off, the ambient light magnitude was 0 cd/mm2 (Konica Minolta LS-100 luminance meter, Tokyo).

Quantification of LED emission characteristics

Request a detailed protocol

Following the procedure of Franke et al., 2019, for each LED, we computed the following measurements, which we have included in Supplementary table 2.

Using the spectrophotometer measurements (P(λ)[μW.cm-2.nm-1]), we can calculate the spectral power density for each LED:

ILED(λ)=10-2×λminλmaxP(λ)d(λ)[W.m-2.nm-1]

The energy of a single photon at wavelength λ is Qp(λ)=hc/λ[m2.kg.s-1], where c=299,792,458m.s-1 is the speed of light, and h=6.62607004×10⁻³⁴[J.s] is Planck's constant.

Then we computed the spectral photon count for each LED (SPC(λ)[photons.μm-2.s-1.nm-1]):

SPC(λ)=ILED(λ)Qp(λ)=10-12/(h×c)×ILED(λ)×λ[photons.μm-2.s-1.nm-1]

Given the d=50cm distance between the LEDs and the stimulus delivery area, the rat’s dilated pupil area of Apupil=0.0314cm2, the rat’s retinal surface area of Aretina=0.8cm2, and the rat’s rod outer segment area of Arod=4×10⁻⁸cm2 (Mayhew and Astle, 1997), we approximated the photon flux density (C) of an isotropic LED radiation pattern at each photoreceptor as:

C=2.Apupil.Arod4πd2.AretinaλminλmaxSPC(λ)d(λ)[photons.μm-2.s-1]

Then, the photon flux per photoreceptor is:

Cflux=108.C.Arod[photons.s-1]

Behavioral task and training

Request a detailed protocol

Duration of training to reach stable performance was typically 4–6 weeks, with one session per day, and varied according to individual differences in rate of learning. The sequence of sessions for each rat was randomized, with each day’s session illuminated by either red, infrared, or white LEDs, with equal likelihood. The standard training was done with stimulus illumination by white LEDs. The training protocol proceeded across a sequence of stages given in Nikbakht et al., 2018. Exclusion of unintended stimulus cues (olfaction, rotating motor noise) was controlled as given in Nikbakht et al., 2018. Rats were dark-adapted in a light-free environment for 20–30 min prior to each session.

Quantification and statistical analysis

Analysis of behavioral data

Request a detailed protocol

We analyzed the behavioral data in MATLAB (MathWorks, Natick, MA) and LabVIEW. To quantify a single rat’s performance, we fit psychometric curves to its choice data. For a given orientation, we calculated the proportion of trials categorized as vertical. Ideally, rats would categorize all trials with angle greater than 45° as vertical and all trials with angle less than 45° as horizontal. For 45° trials, choices should be evenly distributed between vertical and horizontal. However, task difficulty grows in the vicinity of 45°, such that real performance is better described by a sigmoid function with an inflection point at the point of subjective equality (PSE), the orientation at which subjects report the stimulus with equal likelihood as horizontal or vertical. In unbiased rats, the PSE should be at 45°. We generated psychometric functions using a cumulative Gaussian function with the general form given in the equation below based on (Wichmann and Hill, 2001). The parameter estimation was then performed in MATLAB using maximum-likelihood estimation:

ψ(x;μ,σ,γ,λ)=γ+(1-γ-λ)F(x;μ,σ).

The two-parameter function, F(x;μ,σ), is defined by a cumulative Gaussian distribution, as follows:

F(x;μ,σ)=12[1+erf(x-μσ2)]

where x is the stimulus orientation, γ is the lower bound of the function ψ, and λ is the lapse rate. Often, γ and λ are considered to arise from stimulus-independent mechanisms of guessing and lapsing. μ is the mean of the probability distribution that determines the displacement along the abscissa of the psychometric function – a reflection of the subject’s bias – and σ is the standard deviation of the cumulative Gaussian distribution. σ determines the slope of the psychometric function, a common measure of acuity.

Where fitting with a sigmoid was not appropriate (Figure 2D,E), data were fit with the line y=ax+y0, where x is the stimulus orientation, a is the slope, and y0 is the y-intercept.

Test of significance for the fitted psychometric curves

Request a detailed protocol

Errors around the performance value for each orientation and modality condition were expressed as a 95% binomial proportion confidence interval computed by approximating the distribution of errors about a binomially distributed observation, p^, with a normal distribution:

p^±1.961np^(1p^)

where p^ is the proportion of correct trials (Bernoulli) and n is the number of trials.

For statistical tests of significance, we performed a non-parametric test based on bootstrapping, as follows. We computed a distribution of the performance values from the fitted psychometric functions based on 1000 resamples of the behavioral data. We then performed pairwise comparisons between all the performance values generated via bootstrapping from fitted psychometric functions of each experimental condition, calculated the overlap between the distributions and computed the p-values.

Data availability

All data generated or analyzed during this study will be included in the manuscript and supporting files. Source code files will be provided for Figures 1 and 2 at https://github.com/nadernik/nikbakht_diamond_elife (copy archived at https://archive.softwareheritage.org/swh:1:rev:4ba735b86cbcb4bb0094d1d8531a36297561752a).

References

    1. La Vail MM
    (1976)
    Survival of some photoreceptor cells in albino rats following long-term exposure to continuous light
    Investigative Ophthalmology 15:64–70.
    1. Macdonald DW
    2. Fenn MGP
    3. Gelling M
    (1994)
    The natural history of rodents: preadaptations to pestilence
    Rodent Pests and Their Control 1:22.
  1. Book
    1. Mei N
    2. Martin GR
    3. Gallego A
    (2012)
    Progress in Sensory Physiology
    Springer.
    1. Munn NL
    2. Collins M
    (1936) Discrimination of red by white rats
    The Pedagogical Seminary and Journal of Genetic Psychology 48:72–87.
    https://doi.org/10.1080/08856559.1936.10533712
  2. Book
    1. O’keefe J
    2. Nadel L
    (1978)
    The hippocampus as a cognitive map
    Clarendon Press.
    1. Yau KW
    (1994)
    Phototransduction mechanism in retinal rods and cones the friedenwald lecture
    Investigative Ophthalmology & Visual Science 35:9–32.

Decision letter

  1. Joshua I Gold
    Senior Editor; University of Pennsylvania, United States
  2. Martin Vinck
    Reviewing Editor; Ernst Strüngmann Institute (ESI) for Neuroscience in Cooperation with Max Planck Society, Germany
  3. Nick Steinmetz
    Reviewer; University of Washington, Washington, United States
  4. Katrin Franke
    Reviewer; University of Tübingen, Germany

In the interests of transparency, eLife publishes the most substantive revision requests and the accompanying author responses.

Acceptance summary:

It is commonly thought that rodents are functionally blind when their surroundings are illuminated with light of longer wavelengths, which humans perceive as red. Nikbakht and Diamond challenge this assumption, and show that rats can accurately discriminate different objects that are illuminated only by red light. This result has important implications for the design of experiments and housing of rodents, and demonstrates that rodents can perform perceptual tasks despite the weak activation of retinal photoreceptors.

Decision letter after peer review:

Thank you for submitting your article "Conserved visual capacity of rats under red light" for consideration by eLife. Your article has been reviewed by 4 peer reviewers, one of whom is a member of our Board of Reviewing Editors, and the evaluation has been overseen by Joshua Gold as the Senior Editor. The following individuals involved in review of your submission have agreed to reveal their identity: Nick Steinmetz (Reviewer #3); Katrin Franke (Reviewer #5).

The reviewers have discussed their reviews with one another, and the Reviewing Editor has drafted this to help you prepare a revised submission. Overall the reviewers were very positive about this study. They identified a number of Discussion points and further analyses to improve the paper.

Essential revisions:

1) We recommend that the authors comment on at least three applications that they haven't mentioned, which are additional points of impact of the study:

i) Studies of visual development and plasticity in rodents often use "dark-rearing" or days/weeks of darkness as a way to test the visual system under conditions of no stimulation; however, red light is used in husbandry tasks during these times, and any visual experience during those times could severely confound the interpretation of such studies (to pick one recent example, Kowalewski.… Kuhlman Current Biology 2020).

ii) Red light sources are often used in optogenetic perturbation experiments and might be assumed to be invisible to the subject, an assumption clearly invalid. In fact there was a paper with a similar finding to the authors (and to Niklaus et al) in this context – Danskin… Waters Plos One 2015.

iii) Quite some studies nowadays do eye or whisker monitoring and some conclusions of neural activity in the dark could very well be affected by these conclusions. Another point is place field monitoring in the dark – an experiment that has been quite fundamental for the hippocampal field.

2) The photon absorption rate depends on the sensitivity curve of the visual pigment expressed by the photoreceptor and on the light intensity. As stated by the authors in the Discussion, it has been shown that mammalian photoreceptors can be activated by infrared light if the intensity is strong enough – both by single photon and two photon events. As a result of this dependence on intensity, it is critical that the authors carefully measure and report the light intensity used in their experiments and ideally relate this to the expected photoreceptor activation, e.g. as photo-isomerizations per second. In addition, we suggest to discuss the rationale behind using this intensity range in their experiments. Together, this will help other researchers to interpret these interesting behavioral results and adjust their experimental setup accordingly.

The authors did not attempt to present a matching white light that would activate the rods or the cones in the same manner and investigate adaptation. This should be discussed and considered. Furthermore analysis on the extent to which the cones and the rods would be driven in the red light range would be very helpful.

The way in which the LED data is presented and analyzed should be improved. In particular, the authors seem to show fits and they are shown on a linear scale. The authors should show the raw spectrometer values and show these on a logarithmic scale in proper physical units in order to assess how much energy the LED generates in the normal vision range. With respect to intensity calibration of light sources, we suggest to include additional information in the manuscript. The authors mention in the Methods that they use a calibrated spectrometer for intensity measurements. Does this also account for different sensitivity of the spectrometer across different wavelengths? How do you transform spectrometer output to irradiances shown in Figure 1—figure supplement 2? And what is the unit of irradiance in this figure? Did the authors calibrate the different LEDs such that they result in the same irradiance during experiments? We suggest to include all these points into the Methods section. Also, please use absolute and not normalized spectra to compare intensities across LEDs – see Figure 1D. In addition, we believe it is important to (i) state the absolute intensities used in the experiments in the Results section, (ii) relate these intensities to expected photoreceptor activation and also intensities used in common experimental designs, and (iii) discuss the rationale behind using these intensities during experiments. This will help the reader to interpret the results. For example, did the authors pick these intensities because they are regularly used to dark adapt rats during experiments? Did the authors also test other intensities?

If there would be any concern left here after these analysis, one solution could be to use monochromatic lasers for the experiment.

We further suggest to add a simple control experiment to exclude any light contamination in the experimental setup. For that, the authors should position the spectrometer head at the position of the rat's head during behavioral experiments and record both background light levels and spectra of all LEDs. While this is unlikely to interfere with the experiments, it is a fast test that could be added as a supplementary figure.

3) The paper needs to be improved in terms of considering the mechanisms:

i) The discussion on this needs to be improved and extended. These findings likely have a fairly straightforward explanation.

ii) It goes beyond the scope of the paper to investigate whether this depends on cones, rods or even two-photon effects (note that this is unlikely to explain the data given the wavelength results that they describe, this may have been a bit misplaced). The most straightforward explanation is that the small drive of the cones and rods, combined with adaptation mechanisms, is sufficient to perform the task at hand. This seems testable by using very low-intensity green light (hitting the M-cones and the rods) that elicits a similar drive. This would show there is nothing special about red here, it just means that rats can do this kind of task under very low-level lighting conditions.

iii) Another very simple experiment that could have been considered is to prevent adaptation, so first prevent adaptation by using green or white light at normal intensity and then put the animal in the red condition – this should prevent the animal from doing the task. The authors write that "Rats were dark-adapted in a light free environment for 20-30 minutes prior to each session". Was this a necessary step?

4) The normalized irradiance plot in 1D does not extend below 350nm though it is stated that rats have cones with peak sensitivity ~360nm. So, is it possible that the 630-730nm wavelength LEDs also give off a small amount of 300-350nm UV light, and this is used by the rats for discrimination? How can this be ruled out? Many long-pass optical filters also pass some light of much shorter wavelengths than the cutoff - to pick one example, see the spectrum for the DMLP650 on this page (https://www.thorlabs.com/newgrouppage9.cfm?objectgroup_id=3313). I don't know whether the LEDs in this study obtain their wavelength selectivity from anything at all related to the mechanisms of filtering in DMLP650 or similar - I'm not an expert - but it seems like it must be ruled out.

5) What accounts for the difference in findings relative to Jacobs et al 1991? I think this paper is the most classic/foundational, and it included a behavioral test of visual function, but concluded no behavioral sensitivity beyond 600 nm. I think the authors ought to indicate what they think accounts for the discrepancy in conclusions between that work and the present. Difference in species? Difference in behavioral task design? Difference in light source? Difference in range of wavelengths tested? Different analytical methods used to draw conclusions?

6) In the introduction, it is stated that Rocha et al 2016 found no ERG response above 620nm, while in the discussion it is stated that Niklaus et al 2020 found ERG responses to 650nm. Are the authors claiming that Rocha et al 2016 are simply wrong? If so, it would seem more appropriate to raise that study and call it into question in the discussion rather than the introduction - as is, that study is presented as accepted fact and is never revisited or questioned, which I found very confusing.

Reviewer #1:

This paper challenges a long-standing dogma in the rodent field, namely that rodents don't see in red light. The paper performs careful behavioral analyses to show that rats can indeed see (discriminate orientations) under red light condition. Even though the paper does not explain why this happens, the findings are likely of great interest to rodent vision scientists, and rodent researchers using infrared for e.g. housing and monitoring of the animal (eye, location). I have some concerns w.r.t. the purity of the LEDs. The discussion of the paper in terms of mechanisms should be strongly enhanced. I was surprised that the authors did not attempt to present a matching white light that would activate the rods or the M-cone in the same manner and investigate adaptation. Furthermore I expect more analysis on the extent to which the M cones and the rods would be driven in the red light range.

– The way in which the LED data is presented and analyzed should be improved. In particular, the authors seem to show fits and they are shown on a linear scale. The authors should show the raw spectrometer values and show these on a logarithmic scale in proper physical units in order to assess how much energy the LED generates in the normal vision range.

– Related to this, it would be straightforward to calculate how much the rods and cones are driven by the remaining white light and compare this to the extent to which they are driven by the red light.

– If there would be any concern left here after this analysis, I would recommend using monochromatic lasers for the experiment.

– The paper does little in terms of dissecting mechanisms:

1) The discussion on this needs to be improved and extended massively. I don't think these findings are mysterious but likely have a fairly straightforward explanation.

2) I think it goes beyond the scope of the paper to investigate whether this depends on cones, rods or even two-photon effects (note that this is unlikely to explain the data given the wavelength results that they describe, I felt this was a bit misplaced). it would be straightforward to obtain some minimum mechanistic insight. The most straightforward explanation is that the small drive of the cones and rods, combined with adaptation mechanisms, is sufficient to perform the task at hand. This seems testable by using very low-intensity green light (hitting the M-cones and the rods) that elicits a similar drive. This would show there's nothing special about red here, it just means that rats can do this kind of task under very low-level lighting conditions.

3) Another very simple experiment that could be added is to prevent adaptation, so first prevent adaptation by using green or white light at normal intensity and then put the animal in the red condition – this should prevent the animal from doing the task. The authors write that "Rats were dark-adapted in a lightfree environment for 20-30 minutes prior to each session". I guess, this was a necessary step.

– It would be useful to discuss a bit more practical implications. Quite some studies nowadays do eye or whiskerre monitoring and some conclusions of neural activity in the dark could very well be affected by these conclusions. I'm also thinking of place field monitoring in the dark – an experiment that has been quite fundamental for the hippocampal field.

Reviewer #3:

I think the authors actually undersell the full impact of this work, as it bears on at least two applications that they haven't mentioned:

1) Studies of visual development and plasticity in rodents often use "dark-rearing" or days/weeks of darkness as a way to test the visual system under conditions of no stimulation; however, red light is used in husbandry tasks during these times, and any visual experience during those times could severely confound the interpretation of such studies (to pick one recent example, Kowalewski.… Kuhlman Current Biology 2020);

2) Red light sources are often used in optogenetic perturbation experiments and might be assumed to be invisible to the subject, an assumption clearly invalid. In fact there was a paper with a similar finding to the authors (and to Niklaus et al) in this context – Danskin… Waters Plos One 2015.

Reviewer #4:

This study demonstrates that Long-Evans rats accurately discriminate the orientation of visual gratings illuminated by red light and far red light (wavelengths between 626 and 729), despite lacking a cone type with a peak absorbance at long wavelengths (>620). This important study follows recent work demonstrating that there are significant retinal responses to the same wavelengths of light in both rat and mouse species commonly used in behavioral and neural circuit function studies. The demonstration that rats retain clear form vision and can demonstrates accurate visually evoked behavior under "red-light conditions has important implications for studies of rodent visual perception which may have previously assumed "blindness" when the environment is illuminated by long wavelengths of light. Likewise, housing/rearing recommendations for rodents and possibly "dark" rearing studies not completed without any light, may be impacted by this study if experimenters used red light conditions to provide intermittent care for animals and assumed it was similar to no light or night-time conditions.

The major claims are well supported by the presented psychometric functions of the study subjects. The Authors also provide sufficient evidence that they accurately measured the intensity and wavelength span of their light sources and can therefore eliminate differences in light intensity, or overlap from neighboring wavelengths, as alternative explanations for their robust behavioral data.

This study will set a new standard and raise awareness of the need to stop considering "red-light" conditions as the same as no light or infrared conditions.

I'm at a loss to think of anything to improve the study substantively. It's a clear and tight study. The stimuli appear accurately measured and controlled- the behavior is beautiful (as much as behavior can be) and the specific study design was perfect for the question. It is clear these rats can see the stimuli and there doesn't appear to be any other explanation other than the ability of the rats to see in those narrow bands of red light.

Reviewer #5:

In the study "Conserved visual capacity of rats under red light", Nader Nikbakht and Mathew Diamond quantify the behavioral visual performance of rats under red and far-red light illumination. Due to the lack of a red-sensitive photoreceptor type present in e.g. humans and other primate species, rodents are often considered functionally blind under red light and vision researchers are regularly using this property in their experimental design. Here, the authors demonstrate that rats preserve their visual capacity in an orientation discrimination task under red light illumination up to ~650 nm, with reduced performance at ~730 nm and no visual capacity for wavelengths of 850 and 930 nm. These results resonate well with another recent study reporting robust photoreceptor responses upon red light application in rats (Niklaus et al., 2020). Together, this challenges the view that red light is invisible to rodents and suggests to reconsider common experimental practices.

In general, this study is well-written, the data is clearly presented and the conclusion that rats maintain their visual capacity under red light is supported by the data. The study addresses an important question in animal research and I believe that the results will be of great interest to the vision research community – especially because rodents have become a prominent model species in vision research over the last decade.

However, I have the following comments:

1. The photon absorption rate depends on the sensitivity curve of the visual pigment expressed by the photoreceptor and on the light intensity. As stated by the authors in the Discussion, it has been shown that mammalian photoreceptors can be activated by infrared light if the intensity is strong enough – both by single photon and two photon events. As a result of this dependence on intensity, it is critical that the authors carefully measure and report the light intensity used in their experiments and ideally relate this to the expected photoreceptor activation, e.g. as photoisomerizations per second. In addition, I suggest to discuss the rationale behind using this intensity range in their experiments. Together, this will help other researchers to interpret these interesting behavioral results and adjust their experimental setup accordingly.

2. With respect to intensity calibration of light sources, I suggest to include additional information in the manuscript. The authors mention in the Methods that they use a calibrated spectrometer for intensity measurements. Does this also account for different sensitivity of the spectrometer across different wavelengths? How do you transform spectrometer output to irradiances shown in Figure 1—figure supplement 2? And what is the unit of irradiance in this figure? Did the authors calibrate the different LEDs such that they result in the same irradiance during experiments? I suggest to include all these points into the Methods section. Also, please use absolute and not normalized spectra to compare intensities across LEDs – see Figure 1D.

3. In addition, I believe it is important to (i) state the absolute intensities used in the experiments in the Results section, (ii) relate these intensities to expected photoreceptor activation and also intensities used in common experimental designs, and (iii) discuss the rationale behind using these intensities during experiments. This will help the reader to interpret the results. For example, did the authors pick these intensities because they are regularly used to dark adapt rats during experiments? Did the authors also test other intensities?

4. Finally, I suggest to add a simple control experiment to exclude any light contamination in the experimental setup. For that, the authors should position the spectrometer head at the position of the rat's head during behavioral experiments and record both background light levels and spectra of all LEDs. While this is unlikely to interfere with the experiments, it is a fast test that could be added as a supplementary figure.

https://doi.org/10.7554/eLife.66429.sa1

Author response

Essential revisions:

1) We recommend that the authors comment on at least three applications that they haven't mentioned, which are additional points of impact of the study:

i) Studies of visual development and plasticity in rodents often use "dark-rearing" or days/weeks of darkness as a way to test the visual system under conditions of no stimulation; however, red light is used in husbandry tasks during these times, and any visual experience during those times could severely confound the interpretation of such studies (to pick one recent example, Kowalewski.… Kuhlman Current Biology 2020).

ii) Red light sources are often used in optogenetic perturbation experiments and might be assumed to be invisible to the subject, an assumption clearly invalid. In fact there was a paper with a similar finding to the authors (and to Niklaus et al) in this context – Danskin… Waters Plos One 2015.

iii) Quite some studies nowadays do eye or whisker monitoring and some conclusions of neural activity in the dark could very well be affected by these conclusions. Another point is place field monitoring in the dark – an experiment that has been quite fundamental for the hippocampal field.

Beyond expanding our citation list of rodent behavioral studies under red or mixed red/infrared light, we have also included discussion of the three applications pointed out by the reviewers. The relevant sections of text are the following:

“The literature includes place-cell studies of rats navigating under dim red light, taken as the absence of visual input (O’Keefe, 1976; Save et al., 2000; Zhang and Manahan-Vaughan, 2015; Zhang et al., 2014). In a developmental study of visual cortex, mice were dark-reared but were allowed very brief daily exposure to red light(Kowalewski et al., 2021).”

“The sensitivity of mice is emphasized by the finding that red illumination delivered into the brain in an optogenetic protocol evoked a behavioral artifact during performance of a visually guided discrimination task (Danskin et al., 2015).”

2) The photon absorption rate depends on the sensitivity curve of the visual pigment expressed by the photoreceptor and on the light intensity. As stated by the authors in the Discussion, it has been shown that mammalian photoreceptors can be activated by infrared light if the intensity is strong enough – both by single photon and two photon events. As a result of this dependence on intensity, it is critical that the authors carefully measure and report the light intensity used in their experiments and ideally relate this to the expected photoreceptor activation, e.g. as photo-isomerizations per second. In addition, we suggest to discuss the rationale behind using this intensity range in their experiments. Together, this will help other researchers to interpret these interesting behavioral results and adjust their experimental setup accordingly.

The authors did not attempt to present a matching white light that would activate the rods or the cones in the same manner and investigate adaptation. This should be discussed and considered. Furthermore analysis on the extent to which the cones and the rods would be driven in the red light range would be very helpful.

The way in which the LED data is presented and analyzed should be improved. In particular, the authors seem to show fits and they are shown on a linear scale. The authors should show the raw spectrometer values and show these on a logarithmic scale in proper physical units in order to assess how much energy the LED generates in the normal vision range. With respect to intensity calibration of light sources, we suggest to include additional information in the manuscript. The authors mention in the Methods that they use a calibrated spectrometer for intensity measurements. Does this also account for different sensitivity of the spectrometer across different wavelengths? How do you transform spectrometer output to irradiances shown in Figure 1—figure supplement 2? And what is the unit of irradiance in this figure? Did the authors calibrate the different LEDs such that they result in the same irradiance during experiments? We suggest to include all these points into the Methods section. Also, please use absolute and not normalized spectra to compare intensities across LEDs – see Figure 1D. In addition, we believe it is important to (i) state the absolute intensities used in the experiments in the Results section, (ii) relate these intensities to expected photoreceptor activation and also intensities used in common experimental designs, and (iii) discuss the rationale behind using these intensities during experiments. This will help the reader to interpret the results. For example, did the authors pick these intensities because they are regularly used to dark adapt rats during experiments? Did the authors also test other intensities?

If there would be any concern left here after these analysis, one solution could be to use monochromatic lasers for the experiment.

We further suggest to add a simple control experiment to exclude any light contamination in the experimental setup. For that, the authors should position the spectrometer head at the position of the rat's head during behavioral experiments and record both background light levels and spectra of all LEDs. While this is unlikely to interfere with the experiments, it is a fast test that could be added as a supplementary figure.

We have broken this extended editorial point (2) into a series of problems.

Regarding “discussing the rationale behind using this intensity range in their experiments.” The rationale behind using this intensity range was not to match or mismatch the absorption spectrum of photoreceptors; instead we chose popular, low-cost, commercially available LEDs to mimic the illumination practiced by many laboratories in behavioral neuroscience. However, unlike the uncontrolled “red-tinted” light bulbs used in many studies (examples cited in the Discussion), we chose narrow band LEDs to eliminate the possibility that the tail of a red-centered but wide power spectral distribution might lead to off-peak illumination.

The revised sentence in the manuscript, with new phrasing is:

“In the present work, Long-Evans rats demonstrated substantial visual form capacity under illumination by LEDs emitting long-wavelength red and far-red light – LEDs that are low-cost, easy to use, and thus common in the laboratory.”

Next, we reply to queries about the presentation and analysis of LED data. In the original manuscript we included the relative raw spectral irradiance measures in log-scale in Figure supplement 2. We also included the relative log values (without fitting) in the Figure 1D inset. The values in the log plots were normalized such that the highest light intensity, which belongs to the white LEDs, was 1. Normalization emphasized that the <580 nm-irradiance emitted by the red (626, 652, and 729 nm) LEDs was 2-50 times less than that of the Infrared LEDs, which we know was insufficient to support vision based on the behavioral results. Considering the weak irradiance below 580 nm, visual performance under the red LEDs was nearly impossible to explain by spreading of red LED emission to short-wavelength bands; a more plausible interpretation has to be that rats could see under the longer wavelengths emitted by the red LEDs.

Integrating the power under the curves at wavelengths <580 nm reveals that the infrared LEDs emitted from 2 to 50 times higher intensity as compared to red LEDs, in spite of the infrared LEDs being centered at longer wavelengths (infrared 854 nm and 930 nm LEDs emitted 1.95 and 0.48 mW/cm2, respectively, while red 626, 652, and 729 nm LEDs emitted 0.12, 0.28, and 0.04 mW/cm2, respectively). Even if the infrared LEDs produced higher intensity of short wavelength light, rats performed at chance under illumination with IR LEDs, providing further evidence that visual performance under red light could not be well explained by unintended “leakage” towards shorter wavelengths. If irradiance below 600 nm were the cause of residual performance under 626, 652, and 729 nm LEDs, then performance would have been better, not worse, under the 854 and 930 nm LEDs.

As recommended by the reviewers, instead of normalized intensity values we have now presented the non-normalized raw spectrometer intensity values in logarithmic scale in units of µW/m2/nm in Figure 1D.

In addition, we have included Supplementary file 1 summarizing the intensity of each LED in mW/cm2 and total irradiated power (in mW), as measured through our spectrometer (fiber+cosine corrector with a diameter of 3900 µm) from direct measurement of the LEDs, together with the forward current with which the LEDs were supplied and the power rating from the manufacturer datasheet (for further sanity checking as well as replication).

As a control, we can compare total measured irradiated power (the integral of the power spectral density × the surface area of the spectrometer probe and cosine corrector; table column 3) with expected radiated power (table column 6). Considering that optical coupling between the LED and the optical port of the cosine corrector was not perfect (some light escaped laterally, and the optical port was not at exactly zero distance from the surface of the LED) we can verify that the maximum irradiated power for each of our LEDs used in the experiments was in most cases approximately the same as what would be expected from the datasheet (compare columns 3 and 6). An exception was the 729 nm LED which produced less irradiated power than expected from the datasheet. However this discrepancy – which we are not able to explain – does not affect the study’s main conclusions inasmuch as rats showed good visual performance in spite of the low measured irradiance; output around the peak was sufficient to support visual discrimination.

Regarding the photon absorption rate, the typical powers used in microscopy to generate two-photon excitation without damaging the biological samples are between 1 and 10 mW for the mean incident power. For instance for a laser beam of 1 mW, at a rate of 76 MHz with 100 fs pulse duration, and with an objective covering a surface in the focal plane of 1 μm2, the peak power is 0.13x10⁹ W/cm2 at the focal plane of the sample (Cardin et al., 2010; Lévêque-Fort and Georges, 2005). These intensity values are many orders of magnitude higher than the LEDs in our work. For example, in the case of the 626 nm red LED we have: 19.65x10⁻³ W/cm2/0.13x109W/cm2 = 1.5115x10⁻¹⁰, which means our LED is 10 orders of magnitude less powerful than typically needed to achieve the two-photon quantum IR→UV transition.

Regarding spectrometer calibration, we have included further details in the Methods section. We did not directly calibrate the LED output but rather used a calibrated spectrometer to measure the spectral intensity of each light source. The calibration of the spectrometer precisely accounts for the different sensitivity of the spectrometer across different wavelengths. The spectrometer we used has a software suite that reports the values measured from the calibrated spectrometer as spectral irradiance (the power received by a surface per unit area of the measurement probe per wavelength (in units of microwatts per square centimetre per nanometer [µW/cm2/nm2]). We have included these additional details in the Methods section as requested by the reviewers.

Regarding the suggestion to present a matching white light that would activate the rods or the cones in the same manner, we note that the IR LED spectrum in the visible range is mostly flat (white). This already provides a matching white light, as noted in a preceding reply: in spite of the higher emission at short wavelength, rats performed at chance under illumination with IR LEDs providing further evidence that visual performance under red light could not be well explained by unintended “leakage” towards shorter wavelengths. If irradiance below 600 nm were the cause of residual performance under 626, 652, and 729 nm LEDs, then performance would have been better, not worse, under the 854 and 930 nm LEDs.

(i) State the absolute intensities used in the experiments in the Results section,

We have done this in Figure 1D and Figure-supplement S2.

(ii) Relate these intensities to expected photoreceptor activation and also intensities used in common experimental designs.

We followed the procedure explained by (Franke et al., 2019). Briefly, for each LED we computed the following measurements which we have included as the supplemental information.

Using the spectrophotometer measurements (P(λ)[μW.cm2.nm1]), we can calculate the spectral power density for each LED:

ILED(λ)=102×λminλmaxP(λ)d(λ)[W.m2.nm1] The energy of a single photon at wavelength λ is Qp(λ)=hc/λ[m2.kg.s1], where c=299,792,458m.s1 is the speed of light, and h=6.62607004×1034[J.s] is Planck's constant.

Then we computed the spectral photon count for each LED (SPC(λ)[photons.μm2.s1.nm1]):

SPC(λ)=ILED(λ)Qp(λ)=1012/(h×c)×ILED(λ)×λ[photons.μm2.s1.nm1] Given the d=50cm distance between the LEDs and the stimulus delivery area, the rat’s dilated pupil area of Apupil=0.0314cm2, the rat’s retinal surface area of Aretina=0.8cm2 and the rat’s rod outer segment area of Arod=4×108 cm2 (Mayhew and Astle, 1997), we approximated the photon flux density (C) of an isotropic LED radiation pattern at each photoreceptor as: C=2.Apupil.Arod4πd2.AretinaλminλmaxSPC(λ)d(λ)[photons.μm2.s1] Then, the photon flux per photoreceptor is: Cflux=108. C. Arod[photons.s1] We included a summary of the findings for each LED in the supplemental information.

(iii) Discuss the rationale behind using these intensities during experiments. This will help the reader to interpret the results. For example, did the authors pick these intensities because they are regularly used to dark adapt rats during experiments? Did the authors also test other intensities?

These are low cost and affordable light sources commonly used in neuroscience labs around the world. We chose narrow band LEDs though, because of the risk of lower wavelengths confounding the results. We did not test other intensities.

Regarding the intensities used in common experimental designs we note that in the majority of behavioral neuroscience reports researchers do not report any quantity (e.g. they only report using a “dim” red light), some use photometric measures (e.g.luminance which is expressed in terms of perceived brightness to the human eye hence less meaningful for other species) and a few report radiometric values for their lighting sources. Typical light intensities used in experiments are in the range 1-300 µW/cm2. Our LEDs at a distance of 50 cm from the rats’ head had an intensity of approximately 0.03-5 µW/cm2.

The estimated intensity at the rat’s eye level for all of our LEDs was above the behavioral threshold of 6.28 x 10³ µW/cm2 estimated by (Rosenberger and Ernest, 1971) in scotopic conditions. These values are summarized in Author response table 1 below:

Author response table 1
LED typeTotal power density (µW/cm2)Power density received by rat’s eye (µW/cm2)Photon flux density by each photoreceptor (photons/µm2/s)
White LED1.14e+062.28e+01.19e+05
RED 626 nm1.12e+042.25e-021.38e+03
RED 652 nm3.36e+046.72e-024.31e+03
RED 729 nm6.78e+031.36e-029.75e+02
IR 854 nm2.34e+054.68e-013.92e+04
IR 930 nm7.59e+041.52e-011.40e+04

In reply to the option of using monochromatic lasers for the experiment, the authors appreciate how this approach would “clean up” the issue of wavelength sensitivity, however it would involve repeating the entire study and would digress from the main question posed by the report: Under typical laboratory red-light conditions, do rats see?

Regarding the “simple control experiment to exclude any light contamination in the experimental setup.… position the spectrometer head at the position of the rat's head during behavioral experiments and record both background light levels and spectra of all LEDs,” this would seem to address whether light was present within the apparatus besides the intended LED illumination. We tested this and reported the complete absence of light when LEDs were turned off. The value was 0 cd/mm2 (Konica Minolta LS-100 luminance meter, Tokyo). We refer to the text:

“Behavioral testing was done in a light-proof box, where illumination in the absence of the LED sources was 0 cd/mm2 (Konica Minolta LS-100 luminance meter, Tokyo).”

(3) The paper needs to be improved in terms of considering the mechanisms:

(i) The discussion on this needs to be improved and extended. These findings likely have a fairly straightforward explanation.

To address this, we have included a simple conjecture:

“Although our study does not include direct measures of photoreceptor sensitivity, the results indicate that mechanisms must exist for converting miniscule quantities of receptor activation into meaningful signals, perhaps through some cross-retina population code.”

ii) It goes beyond the scope of the paper to investigate whether this depends on cones, rods or even two-photon effects (note that this is unlikely to explain the data given the wavelength results that they describe, this may have been a bit misplaced). The most straightforward explanation is that the small drive of the cones and rods, combined with adaptation mechanisms, is sufficient to perform the task at hand. This seems testable by using very low-intensity green light (hitting the M-cones and the rods) that elicits a similar drive. This would show there is nothing special about red here, it just means that rats can do this kind of task under very low-level lighting conditions.

The authors appreciate that the present results point to a number of future directions, including the suggested experiment of determining exactly how small an intensity of green light is sufficient to support behavior. While we will entertain this and related problems in the future, the present aim is very simply to ask whether under typical dim red light conditions, rats are deprived of form vision, as is commonly believed. To maintain this as a brief and timely report (that is, without adding the years necessary to retrain and test rats under different conditions), our preference is to make the study tightly bound to the original problem.

(iii) Another very simple experiment that could have been considered is to prevent adaptation, so first prevent adaptation by using green or white light at normal intensity and then put the animal in the red condition – this should prevent the animal from doing the task. The authors write that "Rats were dark-adapted in a light free environment for 20-30 minutes prior to each session". Was this a necessary step?

The adaptation protocol was 20-30 minutes presence in the light-sealed booth, as stated in Methods. The suggested protocol of exposing rats to non-red light and then testing under red light is brilliant in principle. However, it is not clear if the results would advance us much, due to ambiguity. There are two scenarios that might underlie conserved vision under red light.

First, blue-green cones may absorb enough red light to support form perception. In that case, pre-exposure to blue-green light would adapt the cones and they would be less excitable by red light, causing a performance drop.

Second, rods (not cones) may absorb faint red light. But they, too, would be adapted by pre-exposure to blue-green light and their reduced sensitivity would likely cause a drop in performance.

In short, pre-exposure to blue-green would likely reduce the sensitivity of both channels which might support form vision under red light after adaptation to complete darkness. The expected drop in performance would be a neat result but would not take us closer to understanding the basis of form vision under red light.

4) The normalized irradiance plot in 1D does not extend below 350nm though it is stated that rats have cones with peak sensitivity ~360nm. So, is it possible that the 630-730nm wavelength LEDs also give off a small amount of 300-350nm UV light, and this is used by the rats for discrimination? How can this be ruled out? Many long-pass optical filters also pass some light of much shorter wavelengths than the cutoff - to pick one example, see the spectrum for the DMLP650 on this page (https://www.thorlabs.com/newgrouppage9.cfm?objectgroup_id=3313). I don't know whether the LEDs in this study obtain their wavelength selectivity from anything at all related to the mechanisms of filtering in DMLP650 or similar - I'm not an expert - but it seems like it must be ruled out.

Our spectrometer was calibrated in the visible+infrared range, hence the measured wavelengths start from 350 nm. Regarding the emission mechanism, the LEDs used in our work were InGaAlP (Aluminium gallium indium phosphide). These alloys are usually used to make red, orange and yellow LEDs and they do not emit in the blue and UV range because their emission band is limited to the bandgap of the alloy material which is very finely tuned to a specific wavelength with very narrow half-width of the output (~10-20 nm). Assuming a Gaussian output profile (from our measurements as well as the manufacturer’s data sheet) the power at 300-350 nm is smaller than the peak by roughly 10-40. In addition we note again the behavioral evidence previously mentioned in reply to the major concerns regarding short wavelengths as well as the matching white light.

5) What accounts for the difference in findings relative to Jacobs et al 1991? I think this paper is the most classic/foundational, and it included a behavioral test of visual function, but concluded no behavioral sensitivity beyond 600 nm. I think the authors ought to indicate what they think accounts for the discrepancy in conclusions between that work and the present. Difference in species? Difference in behavioral task design? Difference in light source? Difference in range of wavelengths tested? Different analytical methods used to draw conclusions?

1) One possibility is that the spectral sensitivity curves estimated by Jacobs were not accurate for wavelengths longer than 600nm. A more recent study (Rocha et al., 2016) using a more sensitive technique called AC Constant-Response Method expanded the available data points to beyond 600nm.

2) Flicker stimuli used by studies such as Jacobs and Rocha could be less sensitive in determining the retinal absorption of longer wavelengths. Niklaus et al., 2020 argue that their single flash method was substantially more acute than the constant flicker method in detecting responses in the low sensitivity range. Furthermore, retinal responses to flicker might not map directly to form vision under adapted conditions.

3) Regarding the behavioral experiments, Jacobs et al simply tested color (spectral sensitivity) discrimination. In other words, they did not (and could not) determine the ability of their test subjects to carry out visual “form” discrimination. The behavior was not comparable to the visual object discrimination, in real world conditions, in our task. In fact, we do not claim that rats can distinguish red from other colors. We simply state that rats can see under red monochromatic illumination, most likely based on a rod-based (together with M cones) mechanism. Additionally, Jacobs et al, write that "Ceiling-mounted fluorescent tubes were used to illuminate the test chamber (ambient illuminance 70 lx)" while testing the animals. This is clearly a photopic task designed for testing color discrimination. In short, Jacobs et al did not (and could not) conclude “no behavioral sensitivity beyond 600 nm.”

4) Moreover, the behavioral sensitivity of rats was a function of background lighting as shown in Jacobs et al., 2001. The results show spectral sensitivity functions for four different achromatic backgrounds [from top to bottom: log(luminance=1.12, 1.43, 1.76 and 2.09, where luminance is measured in cd.m−2]. Therefore in scotopic conditions one might expect higher sensitivity of photoreceptors to longer wavelengths.

5) In a relevant study, (Williams et al., 2005) trained wild-type as well as coneless mutant mice to discriminate a 600nm test light on an achromatic background (-1.4 log scot. cd/m2). At intensities around 1013 photons/s/cm2 mice achieved ~70% discrimination performance. All red light sources used in our work emitted approximately 1019 - 1020 photons/s/cm2 at rat’s cornea level. Williams et al., 2005 shows psychometric functions for wild-type mice (squares) and coneless mice (triangles) derived for detection of two monochromatic test lights (~500nm and 600nm) added to a dim (-1.4 log scot. cd/m2) background. Importantly in this study the authors could infer the nature of the photopigment underlying this behavior and concluded that at low-level light adaptation both coneless and wild-type mice have equally effective rod-based vision.

6) There might be significant species related sensitivity differences. For instance even among different strains of rats, (Niklaus et al., 2020) showed lower scotopic a- and b-wave amplitudes in red and white ERGs in albino Winstars compared to the pigmented Brown Norway rats.

7) Figure 3 of Jacobs et al 1991 shows 1-2 orders of magnitude loss of short-wavelength sensitivity consequent to long-wavelength adaptation. This suggests that the long-wavelength receptors, now adapted, were previously contributing to the short-wavelength response.

6) In the introduction, it is stated that Rocha et al 2016 found no ERG response above 620nm, while in the discussion it is stated that Niklaus et al 2020 found ERG responses to 650nm. Are the authors claiming that Rocha et al 2016 are simply wrong? If so, it would seem more appropriate to raise that study and call it into question in the discussion rather than the introduction - as is, that study is presented as accepted fact and is never revisited or questioned, which I found very confusing.

There are several experimental differences between the two cited studies, as pointed out by (Niklaus et al., 2020). Importantly Rocha et al (2016) examined spectral sensitivities under light adaptation, which leads to degradation of response to long wavelengths. The light adaptation procedures performed by the authors aimed to measure cone responses without rod influence.

Another difference is that (Niklaus et al., 2020) used a potentially more sensitive technique based on single flash ERG in the dark- as well as light-adapted retina, whereas Rocha et al. (2016) used flicker stimuli between 4 and 12 Hz light on light-adapted retina.

Beyond these important differences in methods, upon a more careful examination of (Rocha et al., 2016) results, as well as their supplemental data, we found their statement regarding retinal sensitivity to long wavelengths not well supported by their own data: there was in fact an ERG response above 620nm.

This is also evident from the poor fit of the measured data as shown in figure 3B-D of Rocha et al., 2016.

https://doi.org/10.7554/eLife.66429.sa2

Article and author information

Author details

  1. Nader Nikbakht

    1. Tactile Perception and Learning Lab, International School for Advanced Studies (SISSA), Trieste, Italy
    2. Department of Brain and Cognitive Sciences, McGovern Institute for Brain Research, Massachusetts Institute of Technology, Cambridge, United States
    Contribution
    Conceptualization, Supervision, Funding acquisition, Resources, Data curation, Software, Formal analysis, Validation, Investigation, Visualization, Methodology, Writing - original draft, Writing - review and editing
    For correspondence
    nikbakht@mit.edu
    Competing interests
    No competing interests declared
    ORCID icon "This ORCID iD identifies the author of this article:" 0000-0002-9726-9115
  2. Mathew E Diamond

    Tactile Perception and Learning Lab, International School for Advanced Studies (SISSA), Trieste, Italy
    Contribution
    Conceptualization, Supervision, Funding acquisition, Resources, Data curation, Software, Formal analysis, Validation, Investigation, Visualization, Methodology, Writing - original draft, Writing - review and editing
    For correspondence
    diamond@sissa.it
    Competing interests
    No competing interests declared
    ORCID icon "This ORCID iD identifies the author of this article:" 0000-0003-2286-4566

Funding

European Research Council (294498)

  • Mathew E Diamond

Human Frontier Science Program (RGP0015/2013)

  • Mathew E Diamond

The funders had no role in study design, data collection and interpretation, or the decision to submit the work for publication.

Acknowledgements

We acknowledge the financial support of the Human Frontier Science Program (MED) (http://www.hfsp.org; project RGP0015/2013) and the European Research Council advanced grant CONCEPT (MED) (http://erc.europa.eu; project 294498). The Regional Laboratory for Advanced Mechatronics, LAMA FVG (http://lamafvg.it), supported the design and construction of custom instrumentation. The funders had no role in study design, data collection and analysis, decision to publish, or preparation of the manuscript. Erik Zorzin assisted in spectral measurements. We are grateful to members of the Diamond lab for fruitful comments and discussions.

Ethics

Animal experimentation: The rats were under the care of a consulting veterinarian. Study protocols conformed to international norms and were approved by the Ethics Committee of SISSA and by the Italian Health Ministry (license numbers 569/2015-PR and 570/2015-PR).

Senior Editor

  1. Joshua I Gold, University of Pennsylvania, United States

Reviewing Editor

  1. Martin Vinck, Ernst Strüngmann Institute (ESI) for Neuroscience in Cooperation with Max Planck Society, Germany

Reviewers

  1. Nick Steinmetz, University of Washington, Washington, United States
  2. Katrin Franke, University of Tübingen, Germany

Version history

  1. Preprint posted: November 6, 2020 (view preprint)
  2. Received: January 11, 2021
  3. Accepted: July 19, 2021
  4. Accepted Manuscript published: July 20, 2021 (version 1)
  5. Version of Record published: August 10, 2021 (version 2)

Copyright

© 2021, Nikbakht and Diamond

This article is distributed under the terms of the Creative Commons Attribution License, which permits unrestricted use and redistribution provided that the original author and source are credited.

Metrics

  • 5,252
    Page views
  • 399
    Downloads
  • 14
    Citations

Article citation count generated by polling the highest count across the following sources: Crossref, PubMed Central, Scopus.

Download links

A two-part list of links to download the article, or parts of the article, in various formats.

Downloads (link to download the article as PDF)

Open citations (links to open the citations from this article in various online reference manager services)

Cite this article (links to download the citations from this article in formats compatible with various reference manager tools)

  1. Nader Nikbakht
  2. Mathew E Diamond
(2021)
Conserved visual capacity of rats under red light
eLife 10:e66429.
https://doi.org/10.7554/eLife.66429

Further reading

    1. Neuroscience
    Stijn A Nuiten, Jan Willem de Gee ... Simon van Gaal
    Research Article

    Perceptual decisions about sensory input are influenced by fluctuations in ongoing neural activity, most prominently driven by attention and neuromodulator systems. It is currently unknown if neuromodulator activity and attention differentially modulate perceptual decision-making and/or whether neuromodulatory systems in fact control attentional processes. To investigate the effects of two distinct neuromodulatory systems and spatial attention on perceptual decisions, we pharmacologically elevated cholinergic (through donepezil) and catecholaminergic (through atomoxetine) levels in humans performing a visuo-spatial attention task, while we measured electroencephalography (EEG). Both attention and catecholaminergic enhancement improved decision-making at the behavioral and algorithmic level, as reflected in increased perceptual sensitivity and the modulation of the drift rate parameter derived from drift diffusion modeling. Univariate analyses of EEG data time-locked to the attentional cue, the target stimulus, and the motor response further revealed that attention and catecholaminergic enhancement both modulated pre-stimulus cortical excitability, cue- and stimulus-evoked sensory activity, as well as parietal evidence accumulation signals. Interestingly, we observed both similar, unique, and interactive effects of attention and catecholaminergic neuromodulation on these behavioral, algorithmic, and neural markers of the decision-making process. Thereby, this study reveals an intricate relationship between attentional and catecholaminergic systems and advances our understanding about how these systems jointly shape various stages of perceptual decision-making.

    1. Neuroscience
    Manfred G Kitzbichler, Daniel Martins ... Neil A Harrison
    Research Article Updated

    The relationship between obesity and human brain structure is incompletely understood. Using diffusion-weighted MRI from ∼30,000 UK Biobank participants, we test the hypothesis that obesity (waist-to-hip ratio, WHR) is associated with regional differences in two micro-structural MRI metrics: isotropic volume fraction (ISOVF), an index of free water, and intra-cellular volume fraction (ICVF), an index of neurite density. We observed significant associations with obesity in two coupled but distinct brain systems: a prefrontal/temporal/striatal system associated with ISOVF and a medial temporal/occipital/striatal system associated with ICVF. The ISOVF~WHR system colocated with expression of genes enriched for innate immune functions, decreased glial density, and high mu opioid (MOR) and other neurotransmitter receptor density. Conversely, the ICVF~WHR system co-located with expression of genes enriched for G-protein coupled receptors and decreased density of MOR and other receptors. To test whether these distinct brain phenotypes might differ in terms of their underlying shared genetics or relationship to maps of the inflammatory marker C-reactive Protein (CRP), we estimated the genetic correlations between WHR and ISOVF (rg = 0.026, P = 0.36) and ICVF (rg = 0.112, P < 9×10⁻⁴) as well as comparing correlations between WHR maps and equivalent CRP maps for ISOVF and ICVF (P<0.05). These correlational results are consistent with a two-way mechanistic model whereby genetically determined differences in neurite density in the medial temporal system may contribute to obesity, whereas water content in the prefrontal system could reflect a consequence of obesity mediated by innate immune system activation.