Extracellular signal-regulated kinase mediates chromatin rewiring and lineage transformation in lung cancer
- Department of Integrative Oncology, BC Cancer Agency, Canada
- Department of Biochemistry and Molecular Biology, Arnie Charbonneau Cancer Institute, Alberta Children’s Hospital Research Institute, Cumming School of Medicine, University of Calgary, Canada
- Human Oncology and Pathogenesis Program, Memorial Sloan Kettering Cancer Center, United States
- Department of Pathology & Laboratory Medicine, University of British Columbia, Canada
Figures
Figure 1 with 3 supplements

Effects of mutant KRAS or EGFR expression on phenotype and neuroendocrine markers in small cell lung cancer cells.
(a) Overview of representative somatic alterations, protein expression profiles, MAPK pathway activity, and neuroendocrine differentiation in small cell lung cancer (SCLC), lung adenocarcinoma (LUAD), and transformed SCLC from EGFR-mutated LUAD. (b) Induction of EGFRL858R or KRASG12V as assessed by western blot and of GFP assessed by fluorescence phase contrast images in SCLC cell lines, H2107, H82, and H524 cells, upon treatment with 100 ng/mL doxycycline (dox) for 3 and 7 days. GAPDH was used as a loading control. (c) Photomicrographs showing the growing morphology in suspending aggregates of GFP-overexpressing H82 cells (left) and in mixed adherent and suspended states of EGFRL858R- (middle) or KRASG12V- (right) overexpressing H82 cells upon treatment with 100 ng/mL dox for 7 days. Yellow and white arrowheads indicate suspending aggregates and adherent cells, respectively. Scale bars, 400 μm. (d) Crystal violet assay of adherent cells with or without induction of GFP, EGFRL858R, or KRASG12V in H2107 (on day 7), H82 (on day 7), and H524 (on day 5) cells. Medium containing suspended cells was removed, and adherent cells were washed with PBS and then fixed and stained with crystal violet. (e) Quantification of cell attachment after GFP, EGFRL858R, or KRASG12V induction in H2107 (on day 7), H82 (on day 7), and H524 (on day 5) cells. After incubation, medium containing suspended cells was removed and adherent cells were washed with PBS. Adherent cells were then cultured in fresh media and viability was assessed using an alamarBlue cell viability agent. Values relative to a no dox control for each cell line are graphed as mean (three biological replicates) ± SEM. The Student’s t test, ****p<0.0001; **p<0.01; and *p<0.05. (f) Representative immunoblot showing the effects of induction of GFP, EGFRL858R, or KRASG12V on neuroendocrine markers as well as phosphorylation status of ERK and AKT upon treatment with 100 ng/mL dox for 3 and 7 days in H2107, H82, and H524 cells. GAPDH was used as a loading control. Numbers below blots show the amounts of respective band relative to the corresponding non-dox-treated control values after normalization to ERK1/2 (for pERK1/2) or GAPDH (for INSM1, BRN2, ASCL1, NEUROD1, CD56, SYP, and MYC) in each condition for each cell line. (g) Gene set enrichment analysis (GSEA) neuroendocrine differentiation scores of H2107-KRASG12V and H82-KRASG12V cells pre- and post-dox treatment (day 7). (h) Enrichment plots of the 50-gene lung-cancer-specific neuroendocrine expression signature gene sets in H2107-KRASG12V and H82-KRASG12V cells post-dox treatment for 7 days compared with GFP-overexpressing controls. Immunoblots are representative of at least two biological replicates.
Figure 1—figure supplement 1
Profiling of EGFR and neuroendocrine factor expression and genomic alterations in the EGFR and KRAS genes in lung cancer.
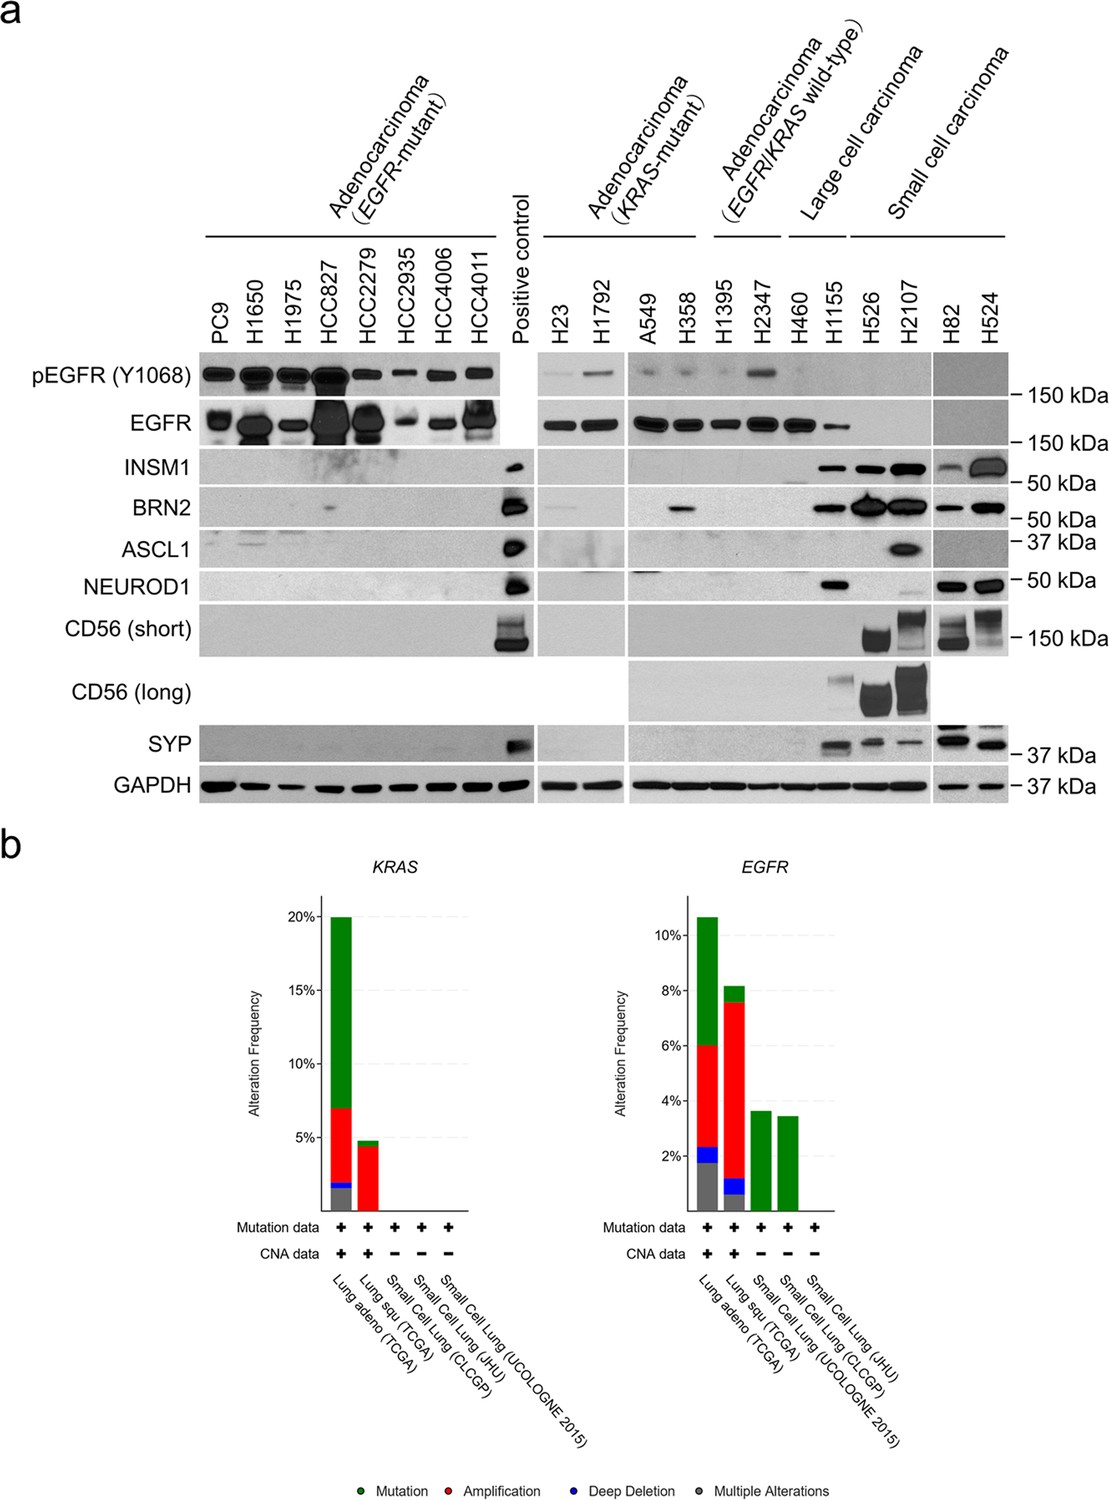
(a) Western blot of phospho-EGFR, EGFR, and neuroendocrine markers in human lung cancer cell lines (N = 20). Lysates from the large cell carcinoma with neuroendocrine differentiation cell line, H1155, were used as a positive control for NE marker expression except for ASCL1. Lysates from the small cell lung cancer cell line, H2107, were used as a positive control for ASCL1. GAPDH was used as a loading control. (b) Frequencies of KRAS and EGFR mutations and copy number alterations among patients with lung adenocarcinoma, lung squamous cell carcinoma, and small cell lung cancer analyzed using data collected from cBioPortal.
Figure 1—figure supplement 2

Effects of EGFRL858R or KRASG12V overexpression in small cell lung cancer cell lines.
(a) Photomicrographs of adherent H2107 cells after transduction of EGFRL858R or KRASG12V upon treatment with 100 ng/mL doxycycline (dox) for 7 days. White arrowheads indicate cell aggregates which sunk on the bottom of culture dishes and are becoming an adherent state. Diffusely distributed adherent cells after KRASG12V transduction are also shown (right). Scale bars, 400 μm. (b) Cell viability of H2107, H82, and H524 cells with or without GFP, EGFRL858R, or KRASG12V transduction. Values relative to day 0 (top) and relative to a no dox control at the same time point (bottom) are plotted. Bars represent mean (three biological replicates) ± SEM. One-way ANOVA with Holm’s adjustment, ***p<0.001; **p<0.01; and *p<0.05. (c) Cell numbers with or without GFP, EGFRL858R, or KRASG12V transduction on day 8 (H2107), day 5 (H82), and day 7 (H524) after seeding. Values relative to a no dox control for each condition are graphed as mean (three biological replicates) ± SEM. The Student’s t test, ****p<0.0001; ***p<0.001; **p<0.01; and *p<0.05. (d) Soft agar assay in H2107, H82, and H524 cells transduced with GFP or KRASG12V. Cell viabilities in colony formation relative to a no dox control for each condition are shown. Bars represent mean (three biological replicates) ± SEM. Statistical significance was evaluated using an unpaired two-tailed t test. (e) Western blot of cleaved PARP after transduction of GFP, EGFRL858R, or KRASG12V for 3 and 7 days in small cell lung cancer cell lines. GAPDH was used as a loading control. Numbers below the cleaved PARP blots indicate the amounts of cleaved PARP relative to the corresponding non-dox-treated control values after normalization to GAPDH in each condition for each cell line. (f) GSEA analysis showing enrichment of a MYC target gene set that is downregulated in H82-KRASG12V cells vs. H82-GFP cells treated with 100 ng/mL dox for 7 days. (g) Western blot of YAP1 in SCLC cell lines with or without induction of KRASG12V for 7 days. G12V mutant-specific RAS expression was confirmed. Lysates from H460 were used as a positive control for YAP1. GAPDH was used as a loading control.
Figure 1—figure supplement 3
Assessment of heterogeneity in KRASG12V-transduced small cell lung cancer cell lines.
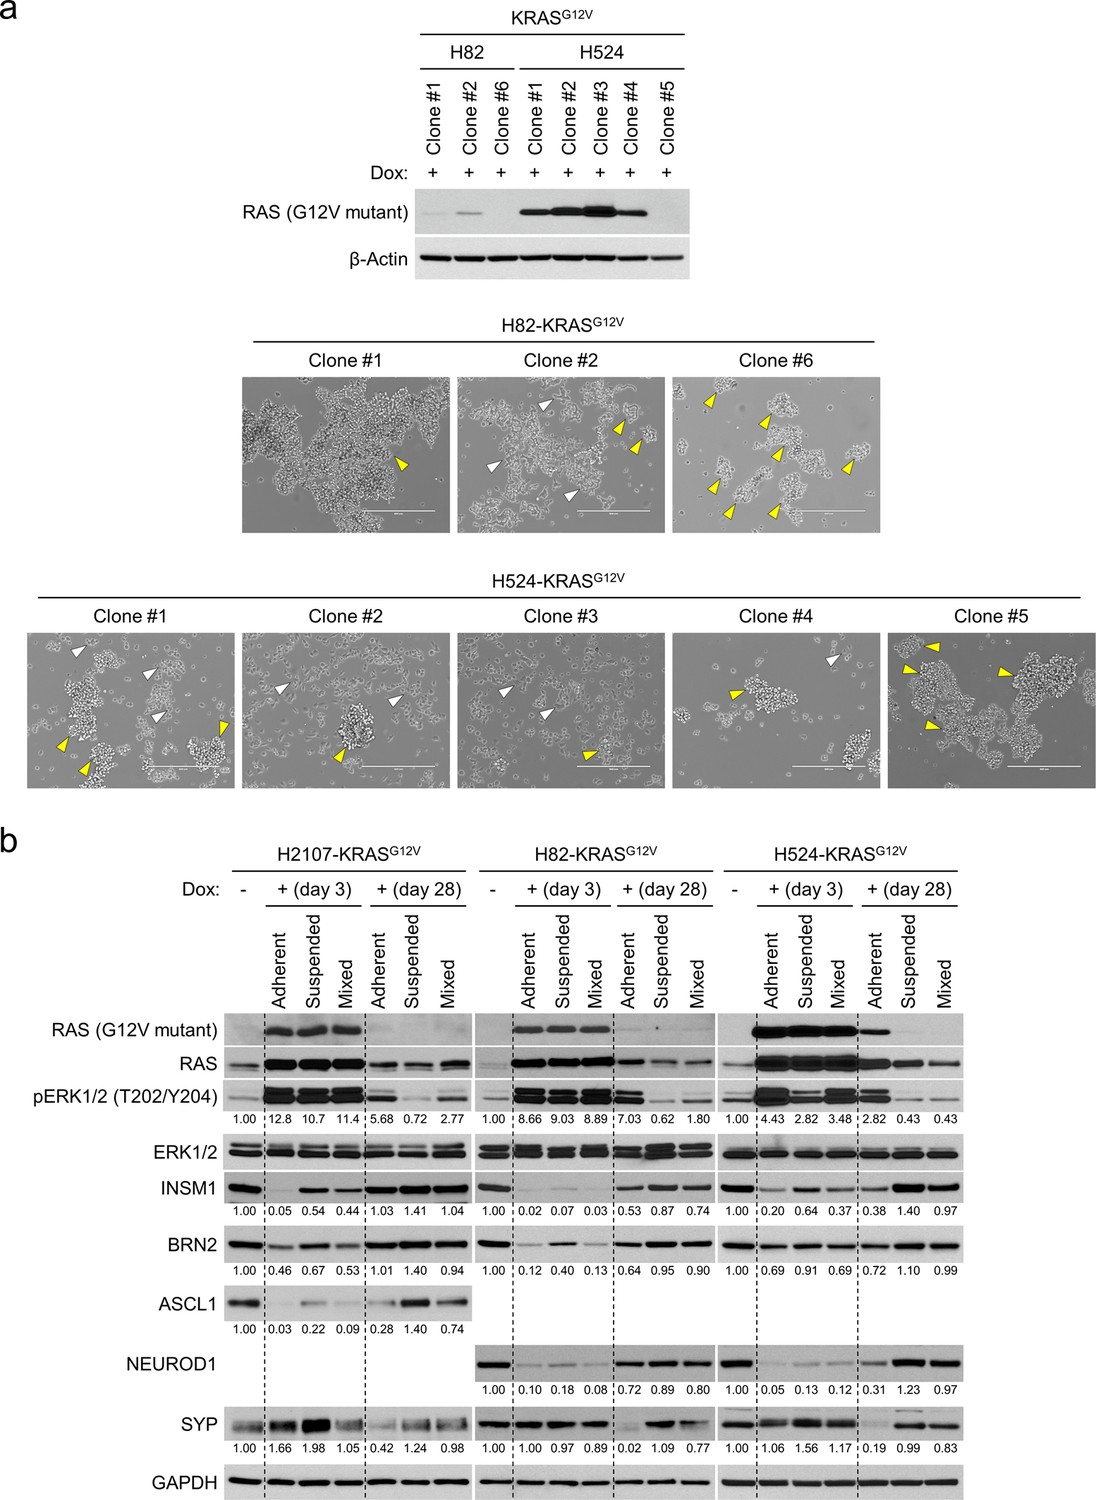
(a) Western blot of G12V mutant RAS in single cell-derived clones of KRASG12V-transduced H82 and H524 cells (top). β-Actin was used as a loading control. Photomicrographs (middle and bottom) show the growing morphology of single cell-derived clones of KRASG12V-transduced H82 and H524 cells. Yellow and white arrowheads indicate suspending aggregates and adherent cells, respectively. Scale bars, 400 μm. (b) Western blot of G12V mutant RAS, ERK, and neuroendocrine factors in KRASG12V-transceduced H2107, H82, and H524 cells. Cells were treated with 100 ng/mL doxycycline (dox) for 3 and 28 days, and lysates from adherent, suspended, or mixed population of cells at each time point were applied for the analysis separately. GAPDH was used as a loading control. Numbers below blots show the amounts of each band relative to the corresponding non-dox-treated control values (set to lane one in each cell line panel) after normalization to ERK1/2 (for pERK1/2) or GAPDH (for INSM1, BRN2, ASCL1, NEUROD1, and SYP).
Figure 2 with 5 supplements
Hyperactivated ERK represses expression of neuroendocrine transcription factors in small cell lung cancer.
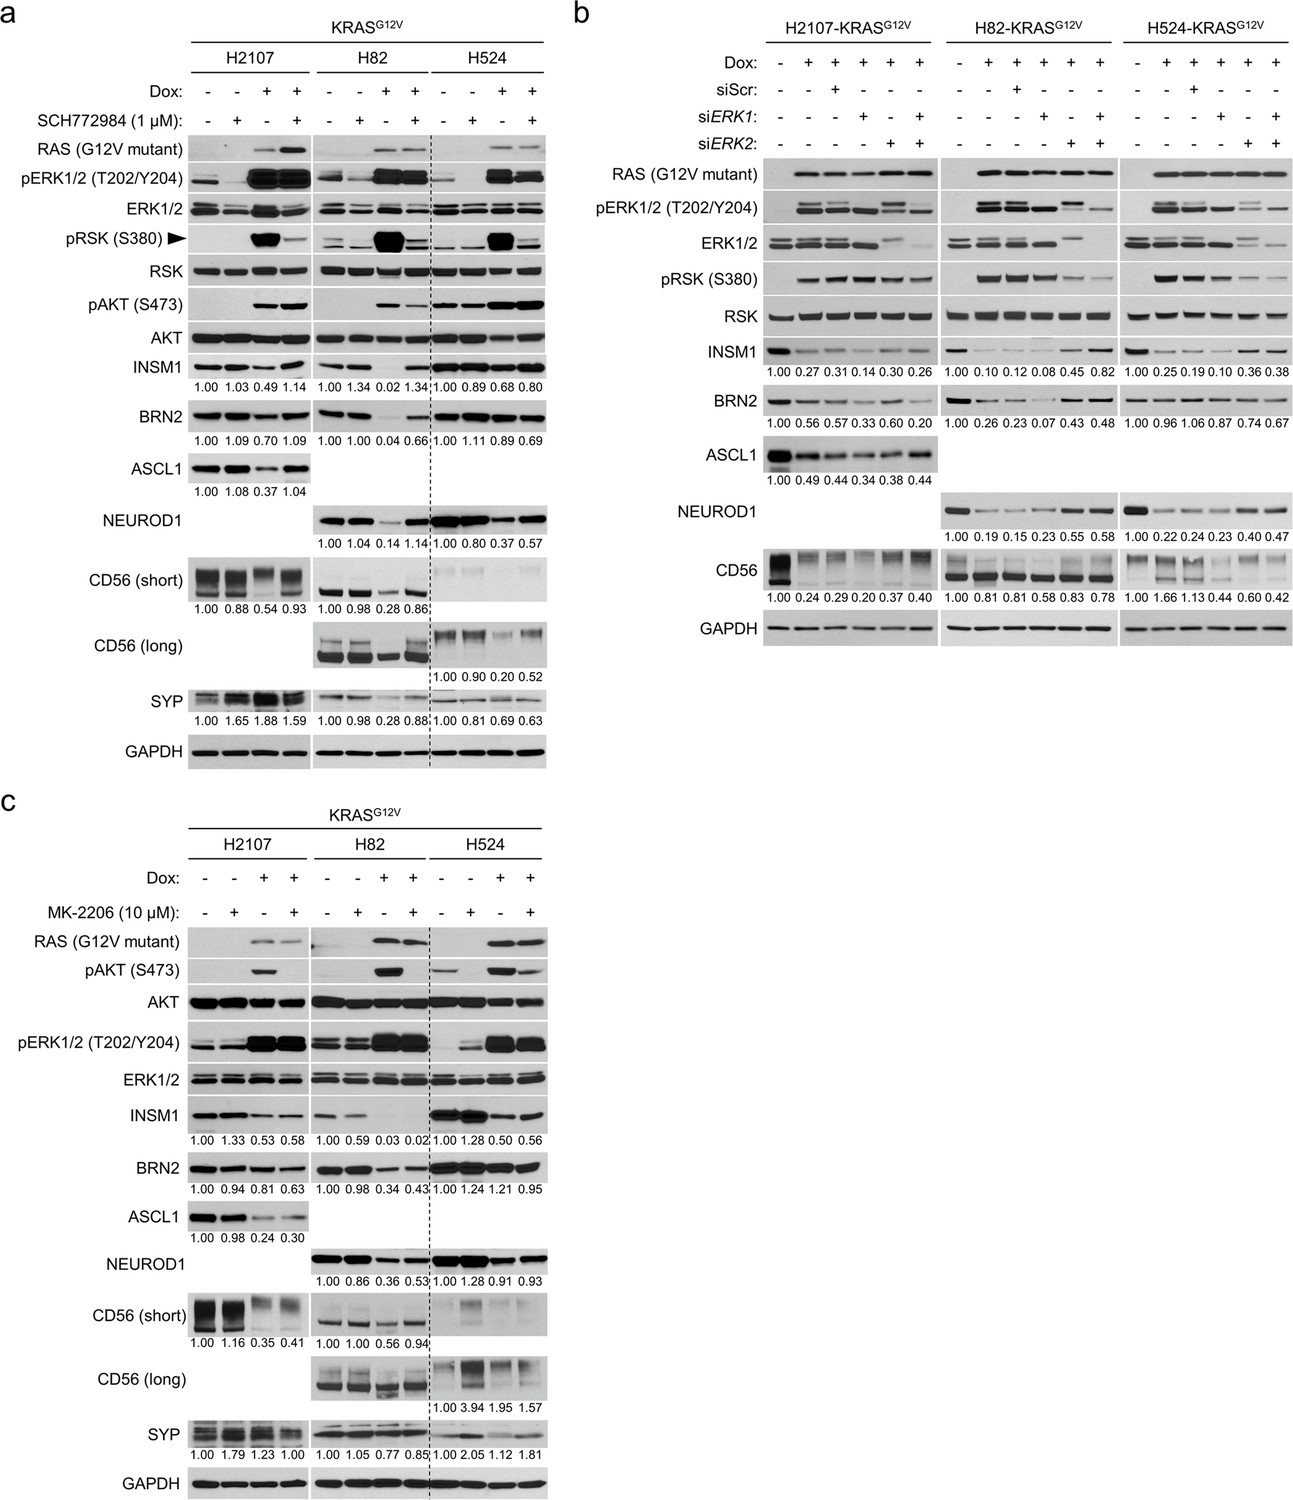
(a) Western blot showing the ERK inhibitor (SCH772984 [1 μM])-mediated restoration of neuroendocrine transcription factors that are repressed by KRASG12V induction in small cell lung cancer cell lines H2107, H82, and H524. Cells were treated with indicated agents for 72 hr. GAPDH was used as a loading control. Numbers below blots show the amounts of each band relative to the corresponding non-doxycycline (dox)-treated and non-SCH772984-treated (DMSO-treated) control values (set to one in each cell line panel) after normalization to GAPDH. (b) Western blot demonstrating the effects of KRASG12V induction and treatment with siRNA pools targeting ERK1, ERK2, or both on expression of neuroendocrine transcription factors in the small cell lung cancer cell lines. Cells were treated with 100 ng/mL dox and indicated siRNAs for 72 hr. Scrambled siRNA (siScr) was used as a negative control. GAPDH was used as a loading control. Numbers below blots show the amounts of each band relative to the corresponding non-dox-treated and non-siRNA-treated control values (set to one in each cell line panel) after normalization to GAPDH. (c) Western blot showing the effects of AKT inhibition using MK-2206 (10 μM) on expression of neuroendocrine factors that are suppressed by KRASG12V in the small cell lung cancer cell lines. Cells were treated with indicated agents for 72 hr. GAPDH was used as a loading control. Numbers below blots show the amounts of each band relative to the corresponding non-dox-treated and non-MK-2206-treated (DMSO-treated) control values (set to one in each cell line panel) after normalization to GAPDH. Immunoblots are representative of at least two biological replicates.
Figure 2—figure supplement 1
Effects of ERK and/or AKT inhibition on the KRASG12V-mediated phenotypic change in small cell lung cancer.
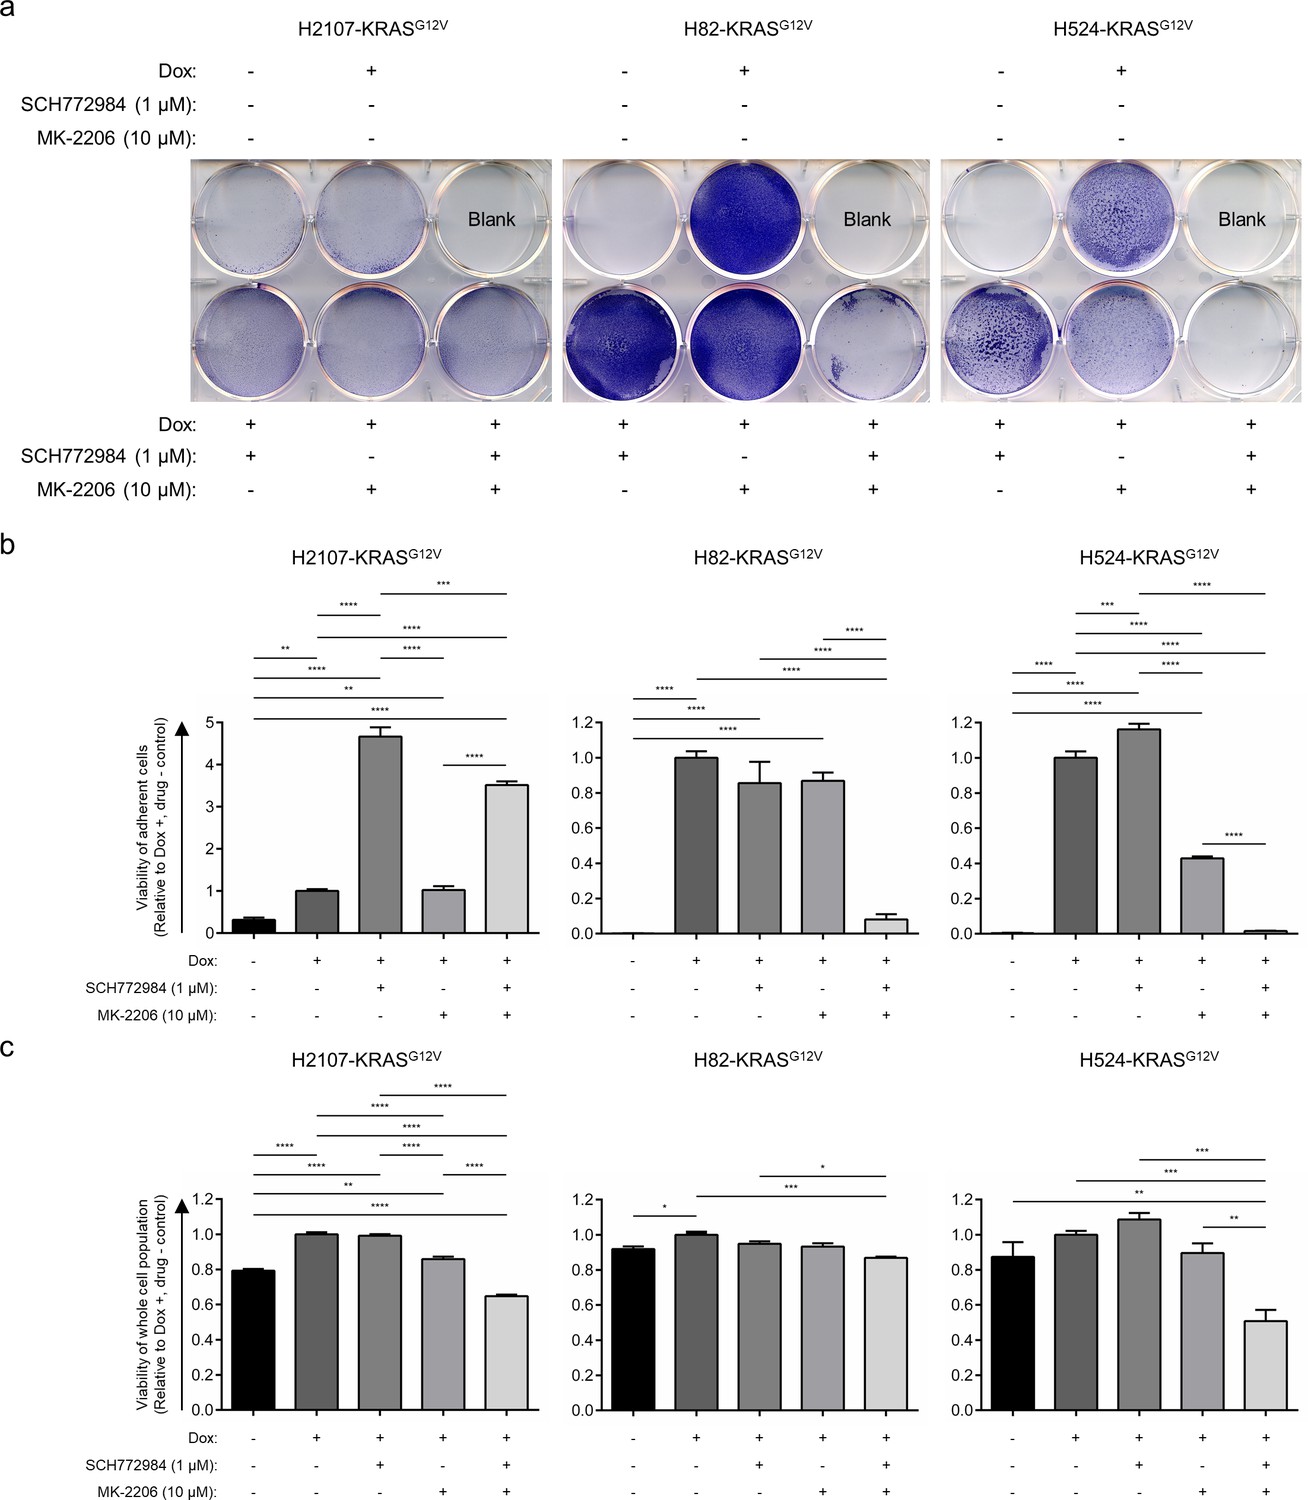
(a) Crystal violet staining of adherent cells with or without KRASG12V induction in H2107, H82, and H524 cells. Cells were treated with 1 μM SCH772984 and/or 10 μM MK-2206 for 72 hr. After incubation, medium containing cells in suspension was aspirated, and adherent cells were washed with PBS, fixed, and stained with crystal violet. (b) Quantification of viability of adherent cells after KRASG12V induction with or without 1 μM SCH772984 and/or 10 μM MK-2206 for 72 hr in H2107, H82, and H524 cells. After incubation, medium containing non-adherent cells were aspirated and media containing dox and/or the indicated drugs was replaced. Cell viability of adherent cells was evaluated using an alamarBlue cell viability agent. Values relative to a dox-treated and non-drug-treated (DMSO-treated) control for each cell line are graphed as mean (three biological replicates) ± SEM. One-way ANOVA with Holm’s adjustment, ****p<0.0001; ***p<0.001; and **p<0.01. (c) Viability of whole population of cells (both suspended and adherent cells) after KRASG12V induction with or without 1 μM SCH772984 and/or 10 μM MK-2206 for 72 hr in H2107, H82, and H524 cells. Cell viability was evaluated using an alamarBlue cell viability agent. Values relative to a dox-treated and non-drug-treated (DMSO-treated) control for each cell line are graphed as mean (three biological replicates) ± SEM. One-way ANOVA with Holm’s adjustment, ****p<0.0001; ***p<0.001; **p<0.01; and *p<0.05.
Figure 2—figure supplement 2
Effects of MSK/RSK and/or AKT inhibition on the KRASG12V-mediated phenotypic change in small cell lung cancer.
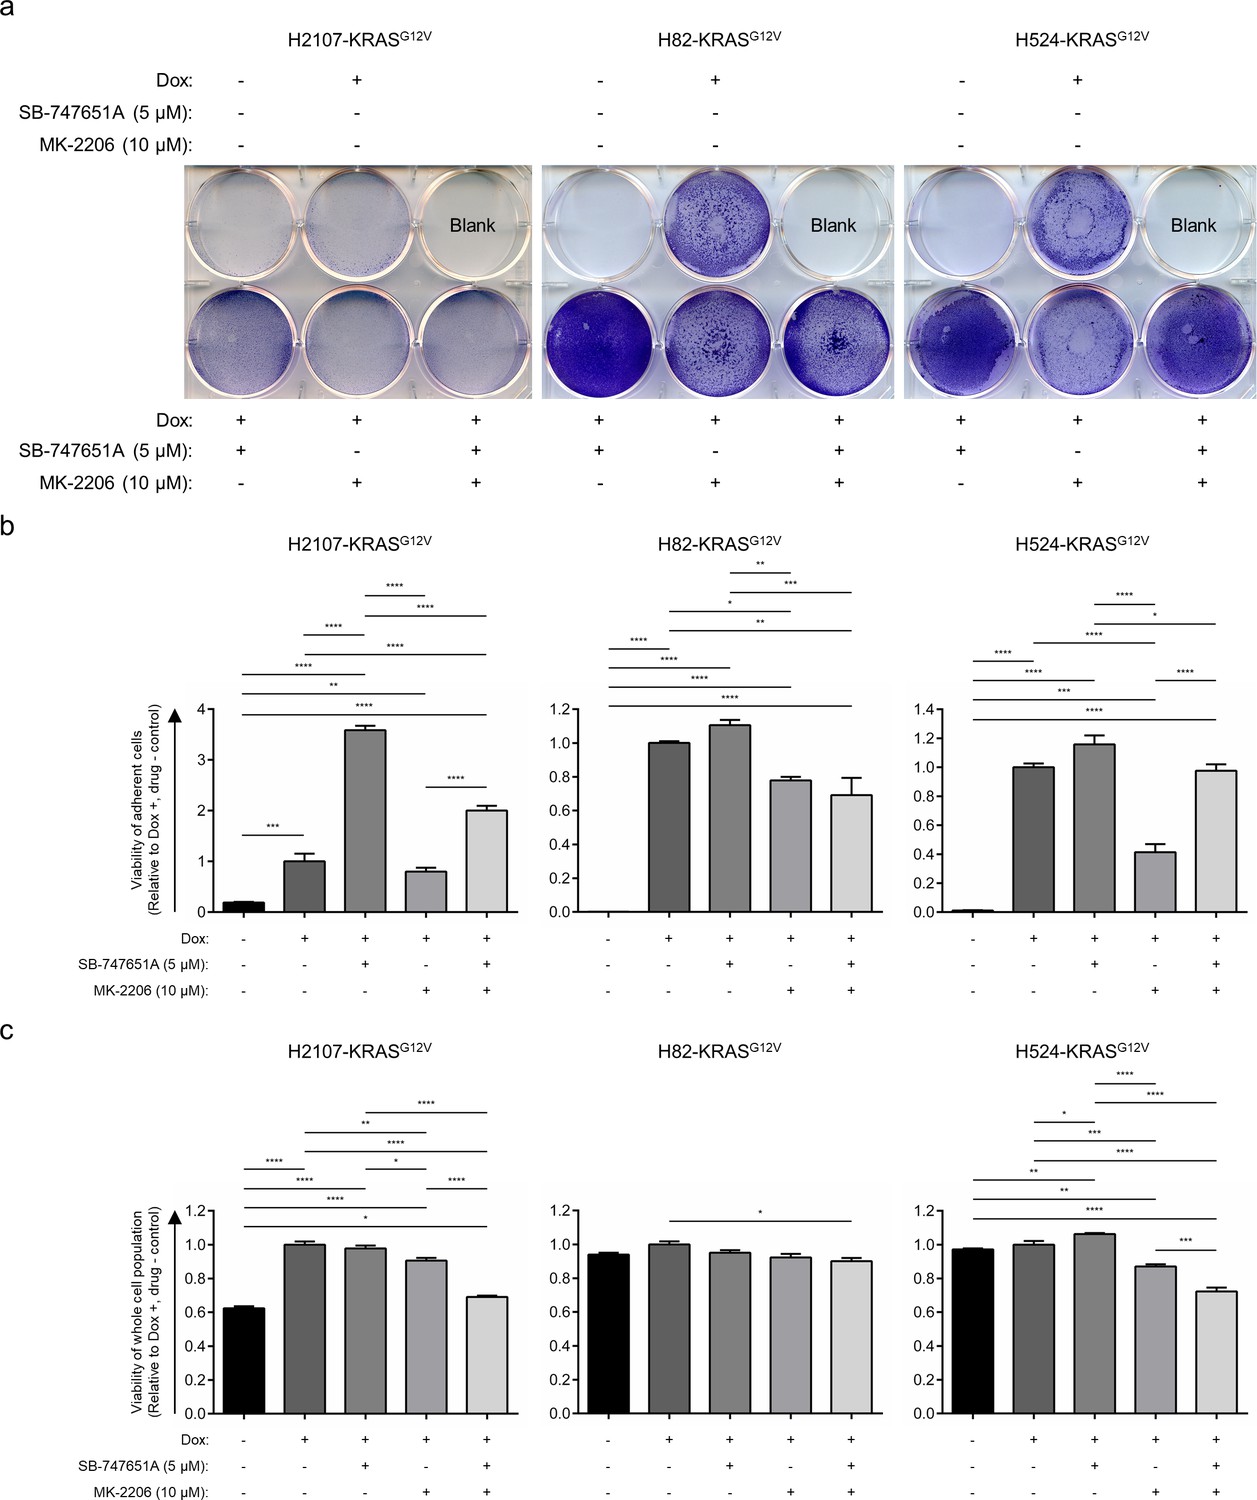
(a) Crystal violet staining of adherent cells with or without KRASG12V induction in H2107, H82, and H524 cells. Cells were treated with 5 μM SB-747651A and/or 10 μM MK-2206 for 72 hr. After incubation, media containing non-adherent cells was removed, and adherent cells were washed with PBS, fixed, and stained with crystal violet. (b) Quantification of viability of adherent cells after KRASG12V induction with or without 5 μM SB-747651A and/or 10 μM MK-2206 for 72 hr in H2107, H82, and H524 cells. After incubation, media containing non-adherent cells were removed and replaced with fresh media containing dox and/or the indicated drugs. Cell viability of adherent cells was evaluated using an alamarBlue cell viability agent. Values relative to a dox-treated and non-drug-treated (DMSO-treated) control for each cell line are graphed as mean (three biological replicates) ± SEM. One-way ANOVA with Holm’s adjustment, ****p<0.0001; ***p<0.001; **p<0.01; and *p<0.05. (c) Viability of whole population of cells (both suspended and adherent cells) after KRASG12V induction with or without 5 μM SB-747651A and/or 10 μM MK-2206 for 72 hr in H2107, H82, and H524 cells. Cell viability was evaluated using an alamarBlue cell viability agent. Values relative to a dox-treated and non-drug-treated (DMSO-treated) control for each cell line are graphed as mean (three biological replicates) ± SEM. One-way ANOVA with Holm’s adjustment, ****p<0.0001; ***p<0.001; **p<0.01; and *p<0.05.
Figure 2—figure supplement 3

Profiling of phospho-kinases with or without MSK/RSK inhibition in H82- and H2107-KRASG12V cells.
Cells were treated with 100 ng/mL doxycycline (dox) as well as 5 μM SB-747651A or 0.1% DMSO for 72 hr. Lysates were subjected to Proteome Profiler Human Phospho-Kinase Array. Red squares indicate phosphoproteins whose expression levels were changed by treatment with SB-747651A.
Figure 2—figure supplement 4
HES1 is induced by ERK independently from NOTCH signaling but does not suppress neuroendocrine transcription factors in small cell lung cancer cell lines.
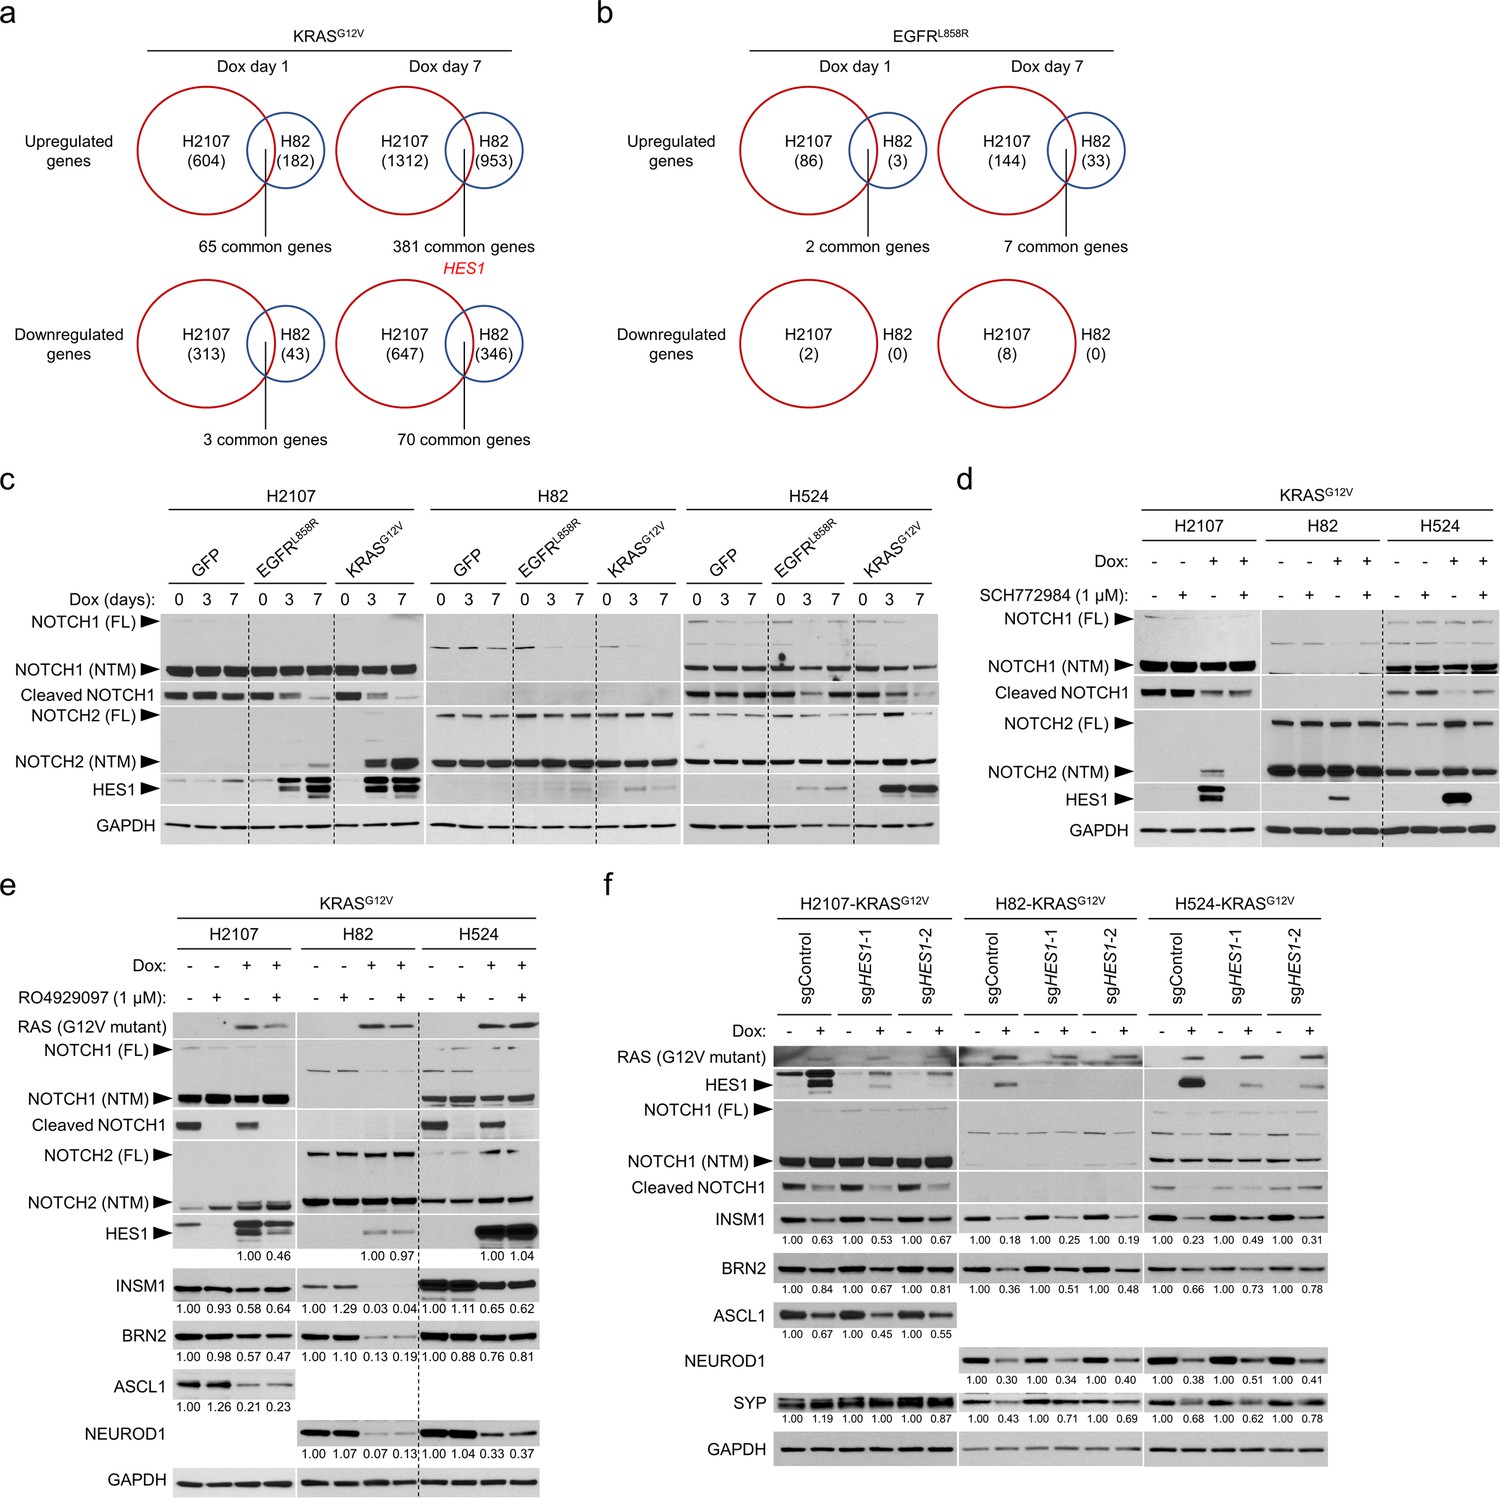
(a) Gene expression profiling in H2107 and H82 cells following KRASG12V transduction on day 1 and day 7. The numbers of genes upregulated (>1.5 fold) or downregulated (<0.67 fold) at each time point in comparison with corresponding GFP overexpression controls are indicated. HES1 is highlighted in red. (b) Numbers of genes upregulated (>1.5 fold) or downregulated (<0.67 fold) by EGFRL858R overexpression for 1 day and 7 days in comparison with GFP control in H2107 and H82 cells. (c) Western blot of NOTCH pathway proteins and HES1 after transduction of GFP, EGFRL858R, or KRASG12V for 3 and 7 days in small cell lung cancer cell lines. GAPDH was used as a loading control. FL, full-length; NTM, NOTCH transmembrane subunit. (d) Western blot showing effects of ERK inhibition using 1 μM SCH772984 on NOTCH pathway proteins and HES1 with or without KRASG12V transduction for 72 hr. GAPDH was used as a loading control. (e) Western blot of NOTCH pathway proteins, HES1, and neuroendocrine factors with or without KRASG12V transduction and inhibition of NOTCH signaling using 1 μM RO4929097 for 72 hr. GAPDH was used as a loading control. Numbers below the HES1 blots indicate the amounts of HES1 relative to the corresponding doxycycline (dox)-treated and non-RO4929097-treated (DMSO-treated) values (set to three in each cell line panel) after normalization to GAPDH. For other targets, numbers below blots show the amounts of each band relative to the corresponding non-dox-treated and non-RO4929097-treated (DMSO-treated) control values (set to one in each cell line panel) after normalization to GAPDH. (f) Western blot showing effects of CRISPR/Cas9-mediated HES1 knockout on expression of neuroendocrine transcription factors that are suppressed by induction of KRASG12V for 72 hr. Two independent HES1-knockout polyclonal KRASG12V-inducible cells were used. GAPDH was used as a loading control. Numbers below blots show the amounts of each band relative to the corresponding non-dox-treated control values after normalization to GAPDH in each condition for each cell line.
Figure 2—figure supplement 5
Upregulation of REST and SOX9 by ERK is not responsible for the suppressed neuroendocrine differentiation in KRASG12V-transduced small cell lung cancer cell lines.
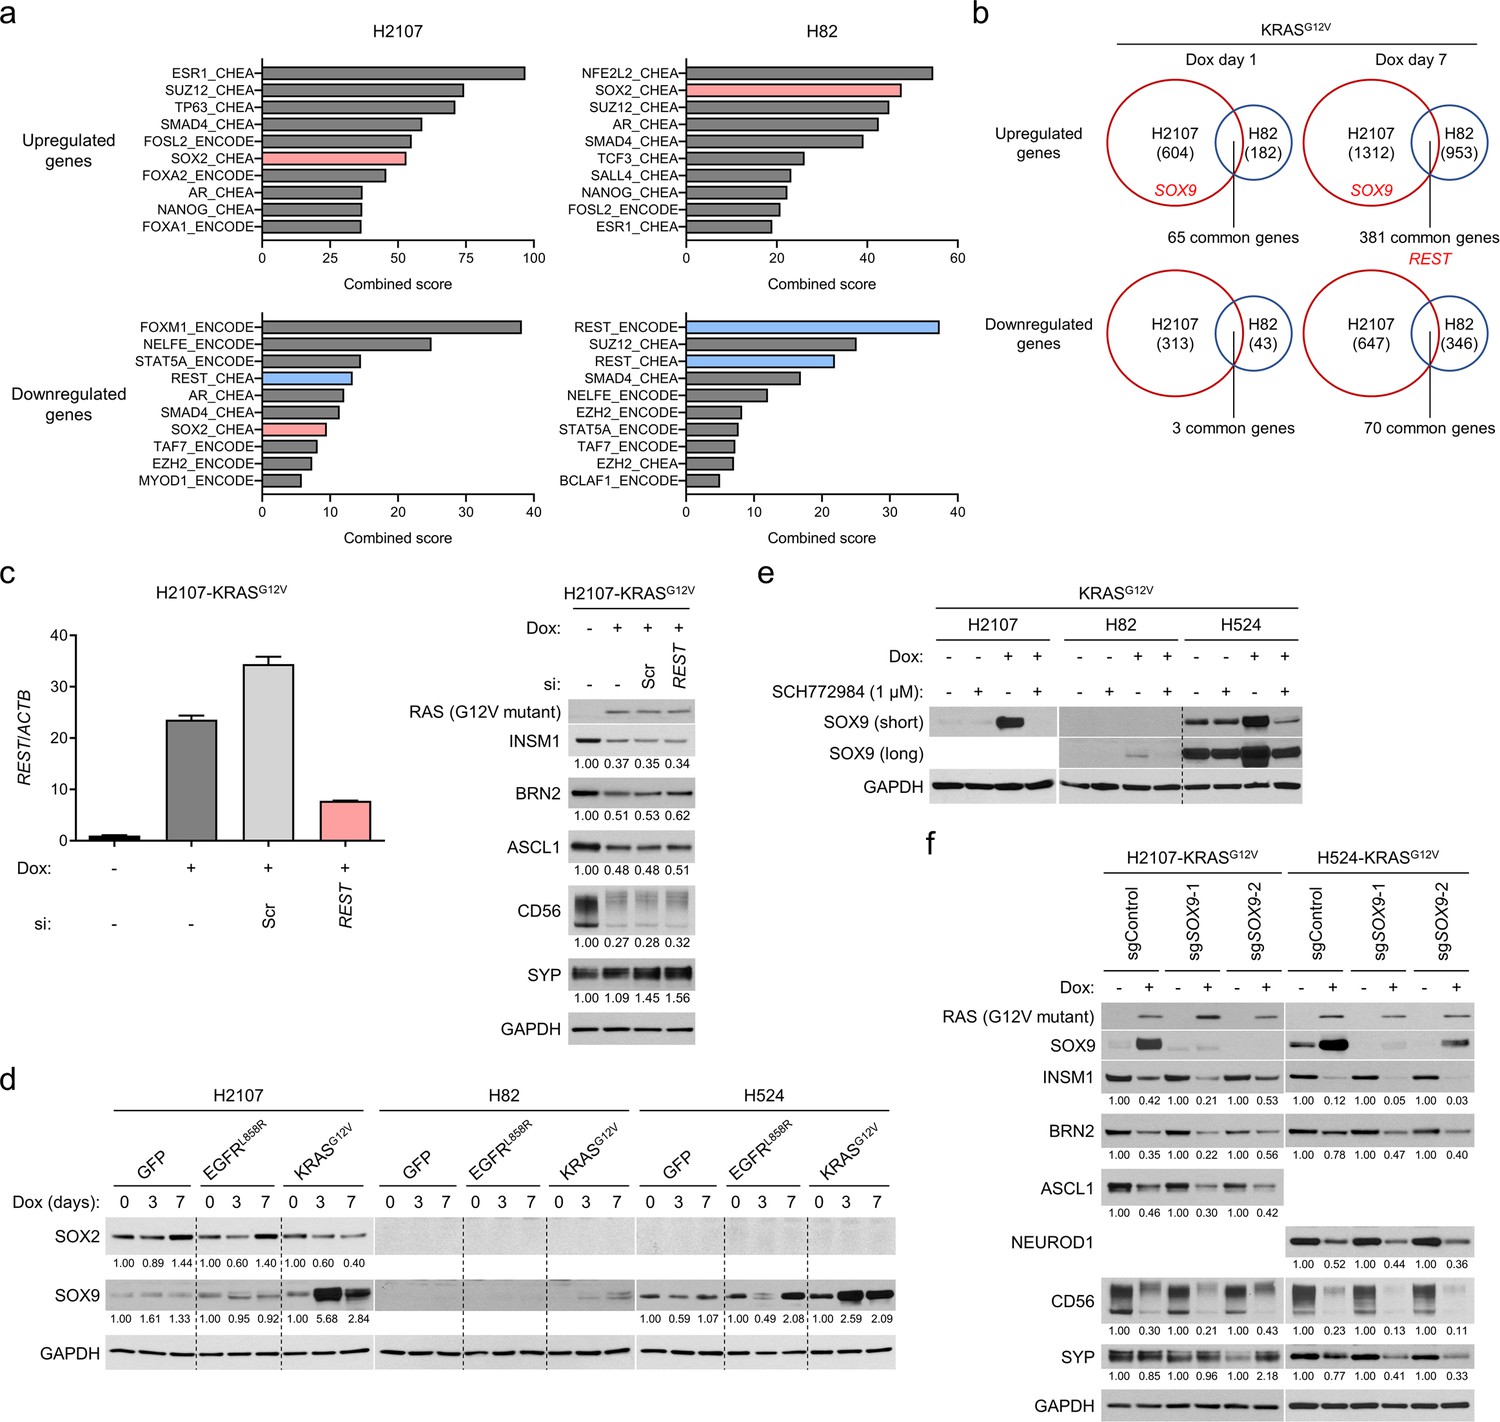
(a) Top 10 candidate transcription factors identified by Enrichr analysis for the regulation of genes upregulated or downregulated in KRASG12V-H2107 and -H82 cells in comparison with GFP control cells after 7 days treatment with 100 ng/mL doxycycline (dox). (b) Upregulated and downregulated genes by KRASG12V overexpression for 1 day and 7 days in comparison with a GFP overexpression control in H2107 and H82 cells. The numbers of genes upregulated (>1.5 fold) or downregulated (<0.67 fold) are indicated. REST and SOX9 are highlighted in red. (c) H2107-KRASG12V cells treated with 100 ng/mL dox and with an siRNA pool targeting REST or scrambled siRNA (Scr) for 72 hr were harvested and subjected to reverse transcription and quantitative real-time PCR analysis for REST (left). Beta-actin (ACTB) was used as a loading control. Expression levels of REST mRNA relative to a non-dox-treated and non-siRNA-treated control are shown. Bars represent mean (three biological replicates) ± SEM. Western blot (right) shows expression of neuroendocrine factors in H2107-KRASG12V cells treated with scrambled siRNA or siREST as well as 100 ng/mL dox for 72 hr. GAPDH was used as a loading control. Numbers below blots show the amounts of each band relative to the corresponding non-dox-treated and non-siRNA-treated control values (set to 1) after normalization to GAPDH. (d) Western blot of SOX2 and SOX9 after transduction of GFP, EGFRL858R, or KRASG12V for 3 and 7 days in H2107, H82, and H524 cells. GAPDH was used as a loading control. Numbers below blots indicate the amounts of each band relative to the corresponding non-dox-treated control values after normalization to GAPDH in each condition for each cell line. (e) Western blot of SOX9 with or without KRASG12V transduction and inhibition of ERK using 1 μM SCH772984 for 72 hr. GAPDH was used as a loading control. (f) Western blot showing effects of CRISPR/Cas9-mediated SOX9 knockout on expression of neuroendocrine transcription factors that are suppressed by induction of KRASG12V for 72 hr. Two independent SOX9-knockout polyclonal H2107- and H524-KRASG12V cells were used. GAPDH was used as a loading control. Numbers below blots show the amounts of each band relative to the corresponding non-dox-treated control values after normalization to GAPDH in each condition for each cell line.
Figure 3
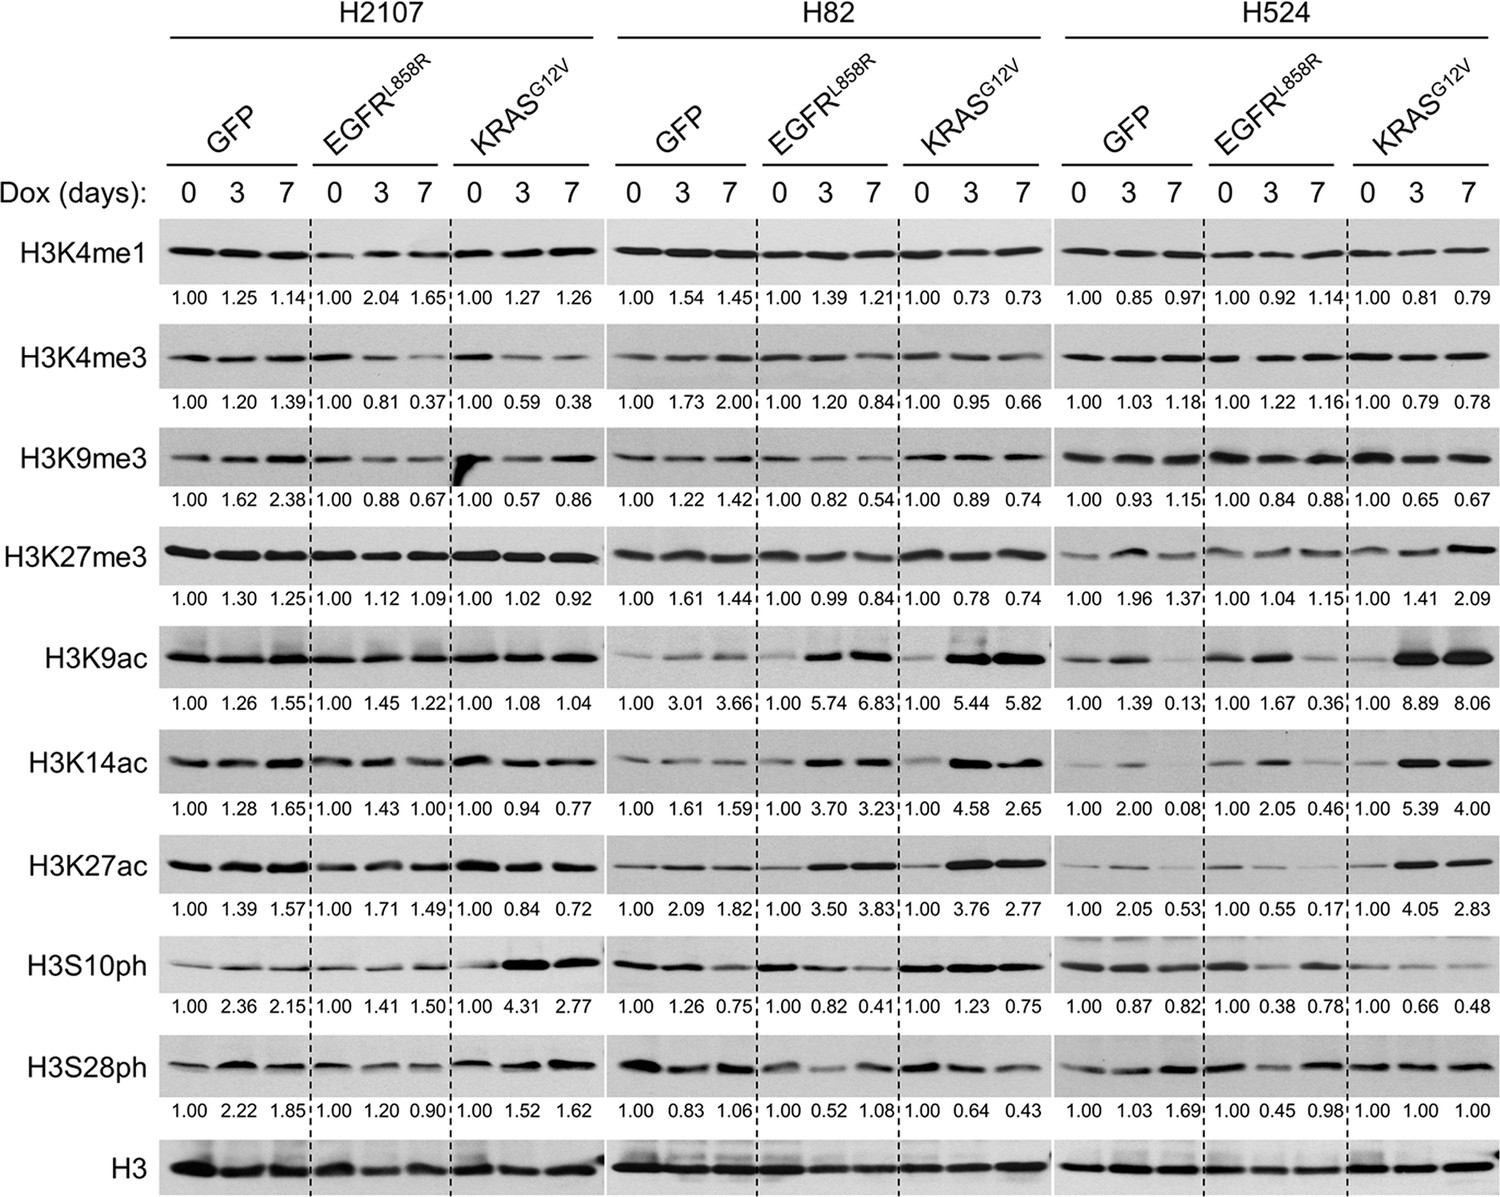
Oncogene-mediated ERK activation alters the global chromatin modifications characterized by histone marks.
Western blot showing the effects of transduction of GFP, EGFRL858R, or KRASG12V on histone marks upon treatment with 100 ng/mL doxycycline (dox) for 3 and 7 days in H2107, H82, and H524 cells. H3 was used as a loading control. Numbers below blots show the amounts of each band relative to the corresponding non-dox-treated control values after normalization to H3 in each condition for each cell line. Immunoblots are representative of at least two biological replicates.
Figure 4 with 1 supplement

ERK-mediated histone 3 lysine 27 acetylation (H3K27ac) is responsible for suppression of neuroendocrine transcription factors in small cell lung cancer.
(a) Known model of receptor tyrosine kinase/RAS/ERK pathway-mediated promotion of H3K27ac. Illustration was created with BioRendrer.com. (b) Western blot showing the effects of MSK/RSK inhibition using 5 μM SB-747651A on expression of neuroendocrine factors as well as on ERK/RSK/CREB pathway activity and AKT phosphorylation with or without KRASG12V transduction for 72 hr. GAPDH was used as a loading control. Numbers below blots show the amounts of each band relative to the corresponding non-doxycycline (dox)-treated and non-SB-747651A-treated (DMSO-treated) control values (set to one in each cell line panel) after normalization to GAPDH. (c) Western blot of neuroendocrine markers and histone 3 lysine acetylation marks in H82-KRASG12V cells. The cells were treated with SB-747651A (5 μM), a CBP/p300 inhibitior A-485 (400 nM), or both, as well as 100 ng/mL dox for 72 hr. H3 and GAPDH were used as loading controls. Numbers below blots show the amounts of each band relative to the corresponding non-dox-treated and non-drug-treated (DMSO-treated) control values (set to lane 1) after normalization to H3 (for H3K27ac, H3K9ac, and H3K14ac) or GAPDH (for INSM1, BRN2, NEUROD1, CD56, and SYP). (d) Western blot of neuroendocrine markers after inhibition of histone deacetylases using trichostatin A (TSA) at different concentrations with or without KRASG12V transduction for 72 hr. H3 and GAPDH were used as loading controls. Immunoblots are representative of at least two biological replicates.
Figure 4—figure supplement 1

Inhibition of CBP/p300 restores neuroendocrine transcription factors suppressed by ERK in H82-KRASG12V cells.
(a) Western blot showing the effects of MSK/RSK and/or CBP/p300 inhibition on expression of neuroendocrine transcription factors that are repressed by KRASG12V transduction in H2107, H82, and H524 cells. Cells were treated with 5 μM SB-747651A and/or fivefold dilutions of A-485 starting at 16 nM as well as 100 ng/mL doxycycline (dox) for 72 hr. H3 and GAPDH were used as loading controls. Numbers below blots are the amounts of each band relative to the corresponding control values after normalization to H3 for H3K27ac and to GAPDH for the others. The controls were set as non-dox-treated and non-drug-treated (DMSO-treated) values (set to one in each cell line panel) except for ETV5 for which the controls were set as dox-treated and non-drug-treated (DMSO-treated) values (set to two in each cell line panel). (b) Western blot showing the effect of MSK/RSK and/or p300 inhibition on expression of neuroendocrine transcription factors that are repressed by KRASG12V transduction in H82 cells. Cells were treated with 100 ng/mL dox, 5 μM SB-747651A, and/or 10 μM C646 for 72 hr. H3 and GAPDH were used as loading controls. Numbers below blots are the amounts of each band relative to the corresponding non-dox-treated and non-drug-treated (DMSO-treated) control values (set to lane 1) after normalization to H3 (for H3K27ac, H3K9ac, and H3K14ac) or GAPDH (for INSM1, BRN2, NEUROD1, and SYP). (c) Western blot showing the effects of HES1 knockout with MSK/RSK or CBP/p300 inhibition (using 5 μM SB-747651A or 16 nM A-485, respectively) on expression of neuroendocrine transcription factors repressed by KRASG12V transduction in H524 cells. H3 and GAPDH were used as loading controls. Numbers below blots are the amounts of each band relative to the corresponding non-dox-treated and non-drug-treated (DMSO-treated) control values after normalization to H3 (for H3K27ac) or GAPDH (for INSM1, BRN2, NEUROD1, CD56, and SYP) in each cell population.
Figure 5 with 2 supplements
ATAC-seq analysis demonstrates chromatin remodeling upon mutant KRAS transduction.
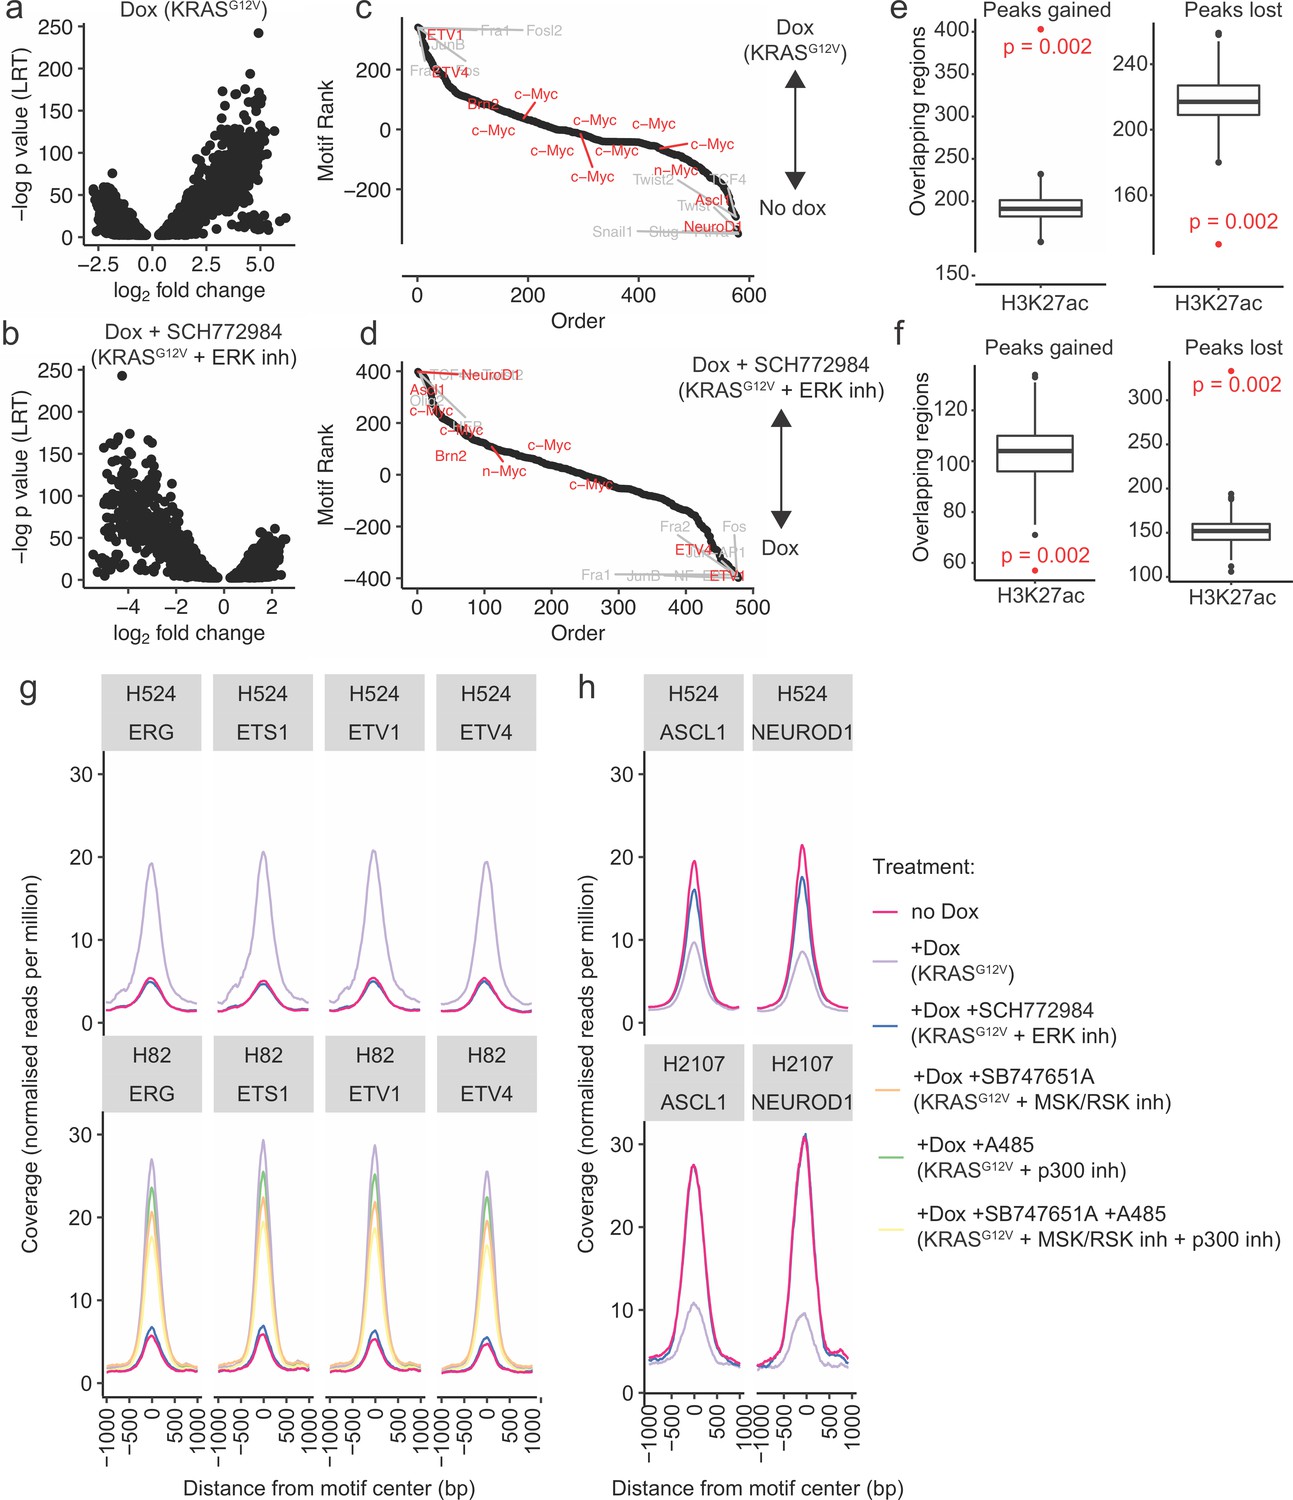
(a) Distribution of differentially accessible regions in H524-KRASG12V cells upon treatment with doxycycline (dox), and (b) treatment with dox + SCH772984 (an ERK inhibitor [inh]). (c) Ranked list of motif enrichment and depletion over differentially accessible regions in H82-KRASG12V, H524-KRASG12V, and H2107-KRASG12V cells upon dox induction. (d) Ranked list of motif enrichment and depletion over differentially accessible regions in H82-KRASG12V, H524-KRASG12V, and H2107-KRASG12V cells upon dox induction with or without SCH772984 treatment. (e) Permutation testing of co-occupancy of H3K27ac with peaks gained and lost in H524-KRASG12V cells upon dox treatment (p value: hypergeometric test). (f) Permutation testing of co-occupancy of H3K27ac with peaks gained and lost in dox-treated H524-KRASG12V cells upon SCH772984 treatment (p value: hypergeometric test). (g and h) Occupancy profiles of selected motifs of the (g) ETS family, and (h) selected proneural motifs.
Figure 5—figure supplement 1
ATAC-seq quality control.
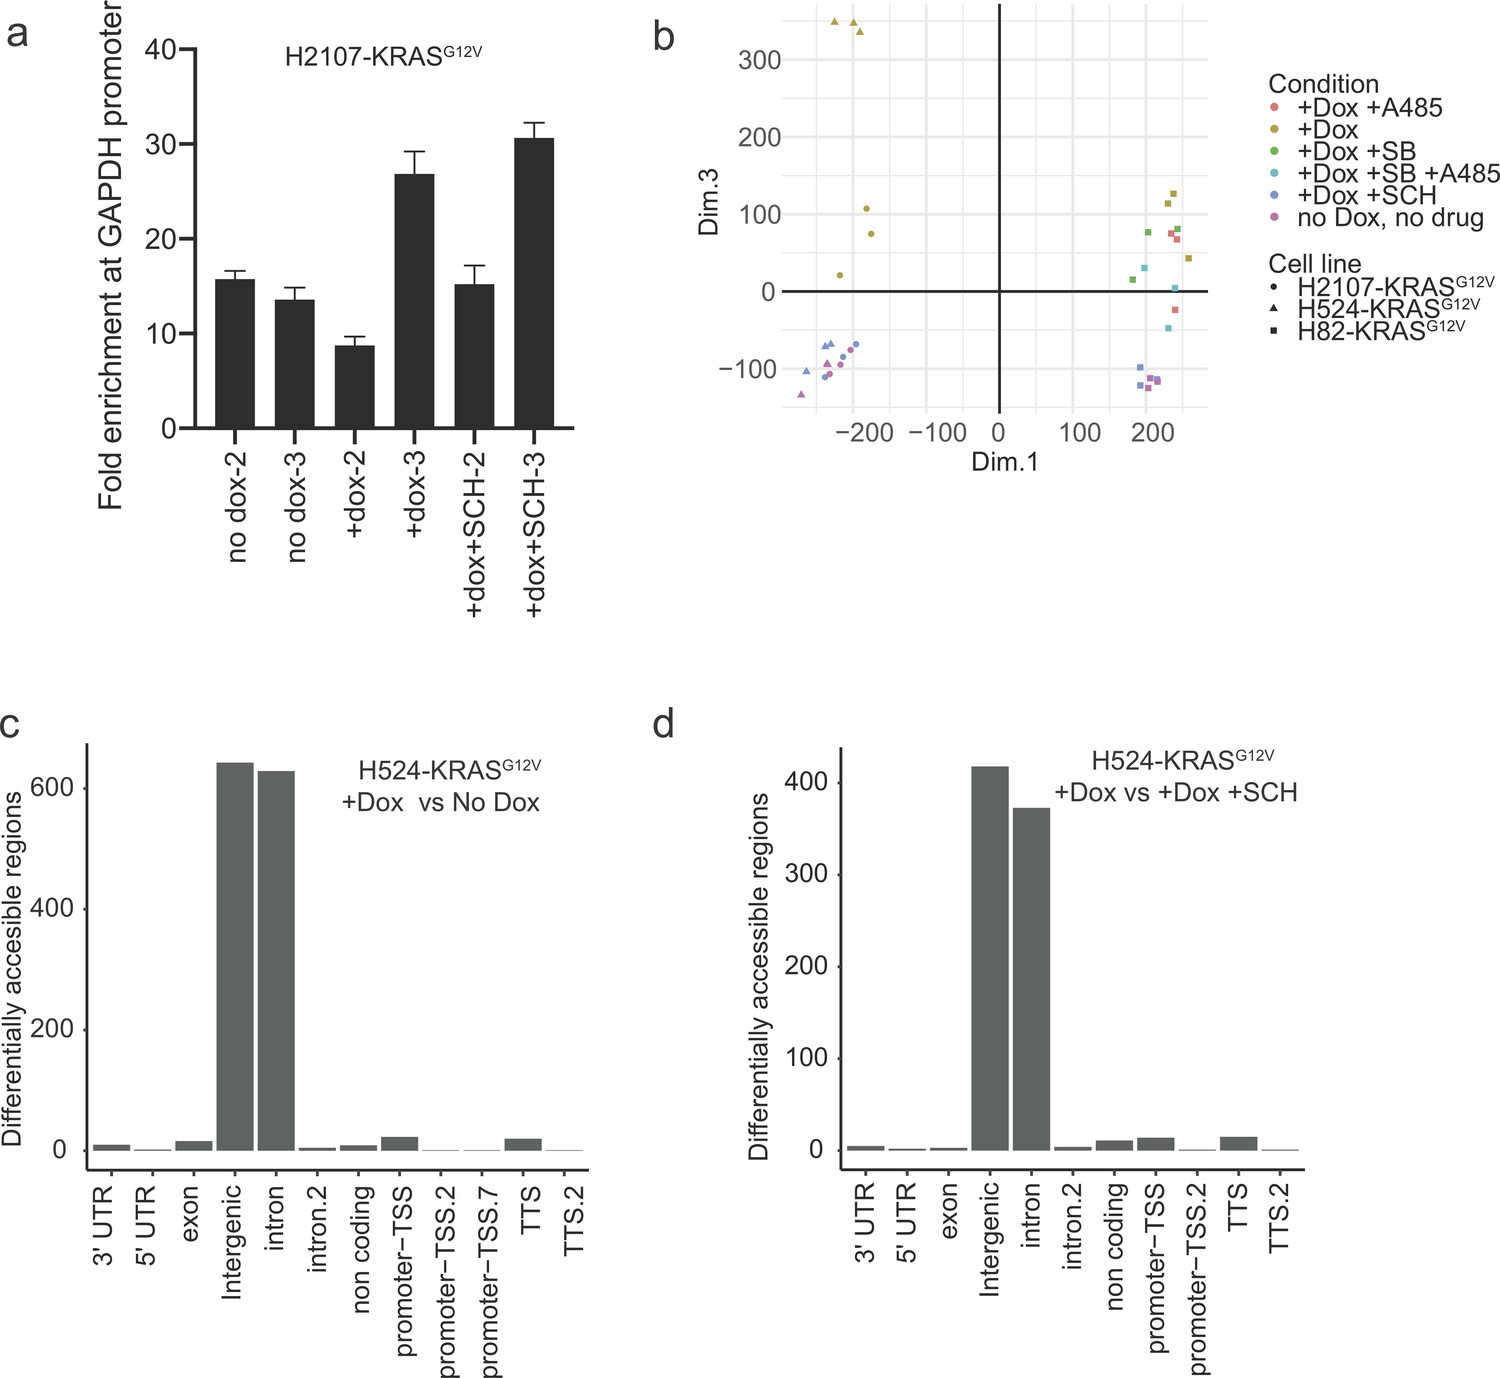
(a) Fold enrichment of representative ATAC-seq libraries at the GAPDH promoter by qPCR (in triplicate). (b) PCA plot showing clustering of ATAC-seq library samples with high concordance between replicates. (c, d) Representative plots of genomic distribution of differentially accessible regions.
Figure 5—figure supplement 2

Additional ATAC-seq motif analyses.
(a-e) Ranked motif order plots for H82-KRASG12V for doxycycline (dox) vs control, dox vs dox +SCH772984, dox vs dox +A-485, dox vs dox +SB-747651A, and dox vs dox +A-485 + SB-747651A, respectively. (f) and (g) Ranked motif order plots for H2107-KRASG12V for dox vs control and dox vs dox +SCH772984. (h) and (i) Ranked motif order plots for H524-KRASG12V dox vs control and dox vs dox +SCH772984. (j) Supplemental motif profiles for all three lines (H2107-KRASG12V, H524-KRASG12V, and H82-KRASG12V) profiled for ETS family and neuroendocrine lineage motifs.
Figure 6 with 5 supplements
The roles of ETS family transcription factors in the regulation of neuroendocrine differentiation in small cell lung cancer cell lines.
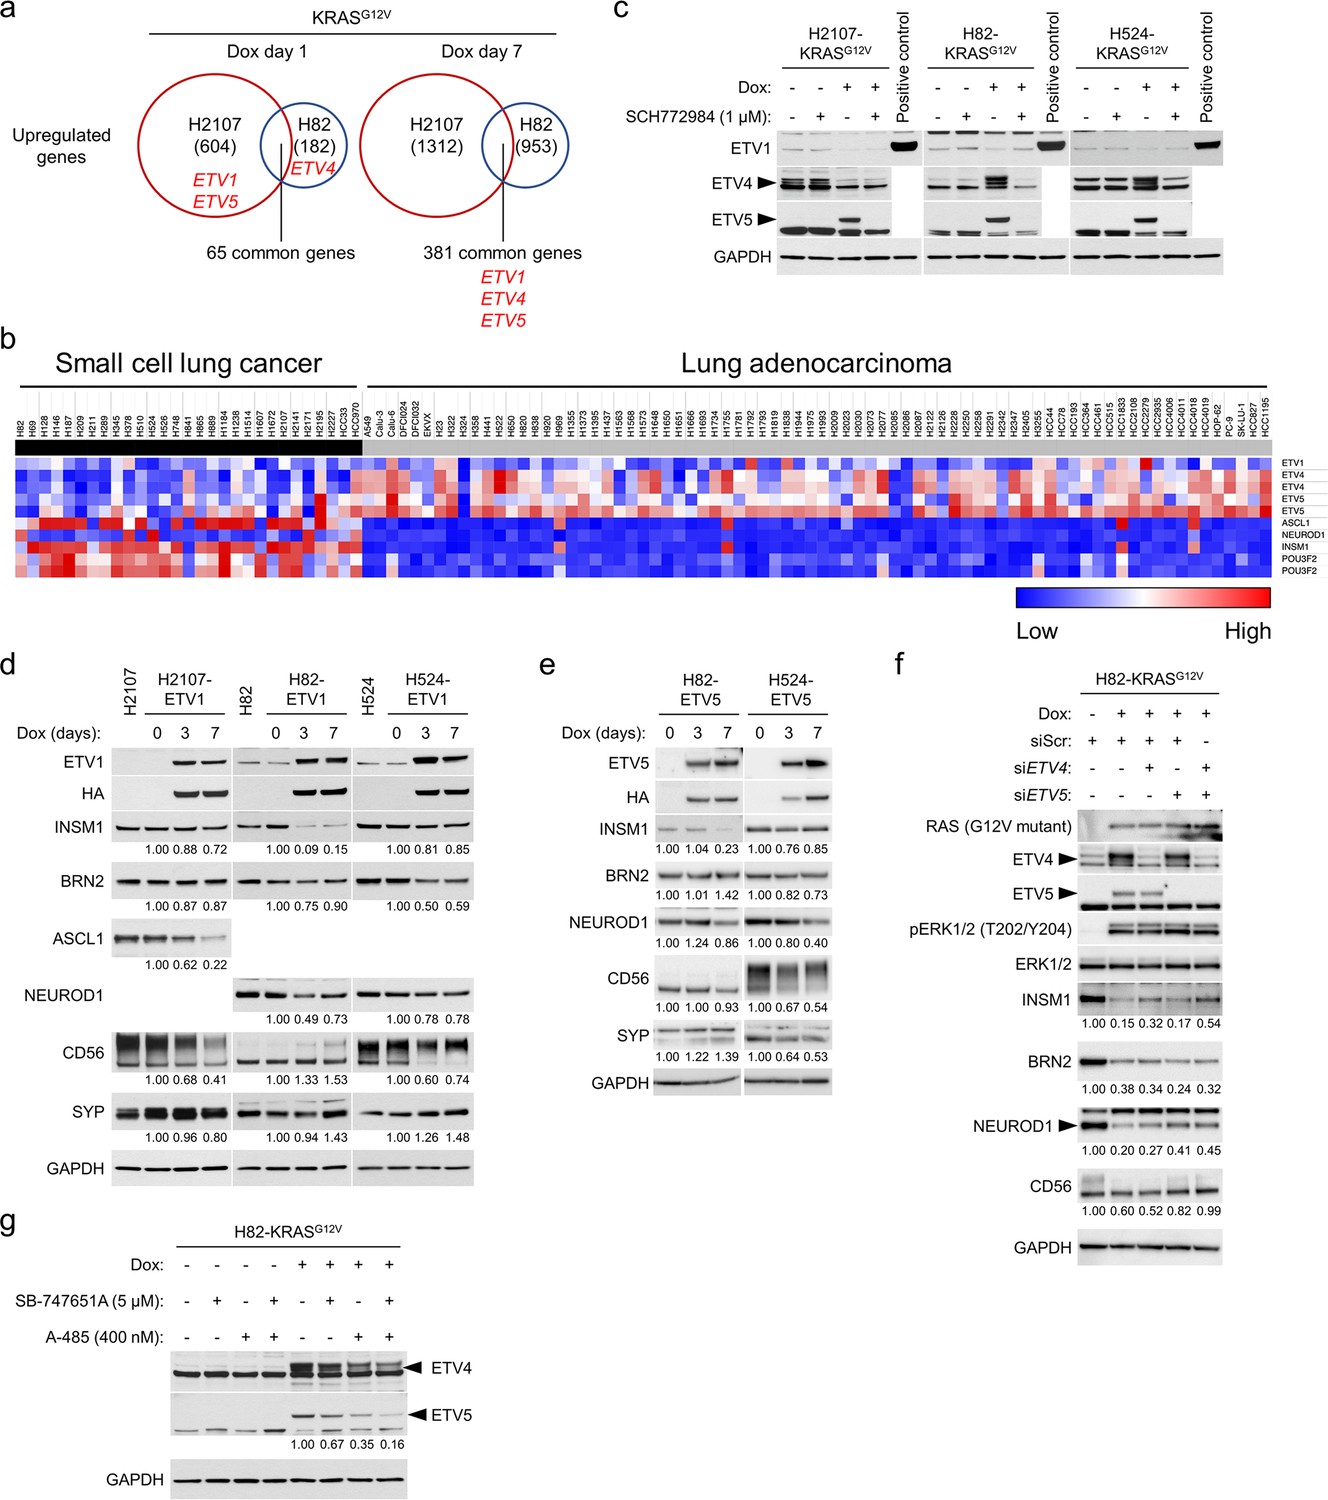
(a) Upregulated genes by KRASG12V overexpression for 1 day and 7 days in comparison with a GFP overexpression control in H2107 and H82 cells. The numbers of genes upregulated (>1.5 fold) are indicated. ETV1, ETV4, and ETV5 are shown in red. (b) Heat map of the PEA3 family ETS transcription factors (ETV1, ETV4, and ETV5) and neuroendocrine transcription factors (ASCL1, NEUROD1, INSM1, and POU3F2 [BRN2]) in small cell lung cancer and lung adenocarcinoma cell lines. Red and blue denote high and low expression, respectively. (c) Western blot showing the effects of ERK inhibition using 1 μM SCH772984 on the expression of ETV1, ETV4, and ETV5 with or without KRASG12V transduction for 72 hr. Lysates from HA-tagged ETV1-overexpressing H524 cells were used as a positive control for ETV1. GAPDH was used as a loading control. (d) Effects of HA-tagged ETV1 induction as assessed by western blot in H2107, H82, and H524 cells, upon treatment with 100 ng/mL doxycycline (dox) for 3 and 7 days. GAPDH was used as a loading control. Numbers below blots show the amounts of each band relative to the corresponding non-dox-treated control values (set to two in each panel) after normalization to GAPDH. (e) Effects of HA-tagged ETV5 induction as assessed by western blot in H82 and H524 cells, upon treatment with 100 ng/mL dox for 3 and 7 days. GAPDH was used as a loading control. Numbers below blots show the amounts of each band relative to the corresponding non-dox-treated control values (set to one in each cell line panel) after normalization to GAPDH. (f) Western blot showing the effects of KRASG12V induction and treatment with siRNA pools targeting ETV4, ETV5, or both on expression of neuroendocrine transcription factors in H82 cells. Cells were treated with 100 ng/mL dox and indicated siRNAs for 72 hr. Scrambled siRNA (siScr) was used as a negative control. GAPDH was used as a loading control. Numbers below blots show the amounts of each band relative to the corresponding non-dox-treated and siScr-treated control values (set to 1) after normalization to GAPDH. (g) Western blot showing the effects of MSK/RSK and/or CBP/p300 inhibition on KRASG12V-mediated expression of ETV4 and ETV5 in H82 cells. Cells were treated with 5 μM SB-747651A (a MSK-RSK inhibitor) and/or 400 nM A-485 (a CBP/p300 inhibitor) as well as 100 ng/mL dox for 72 hr. GAPDH was used as a loading control. Numbers below the ETV5 blots indicate the amounts of ETV5 relative to the dox-treated and non-drug-treated (DMSO-treated) control values (set to lane 5) after normalization to GAPDH. Immunoblots are representative of at least two biological replicates.
Figure 6—figure supplement 1
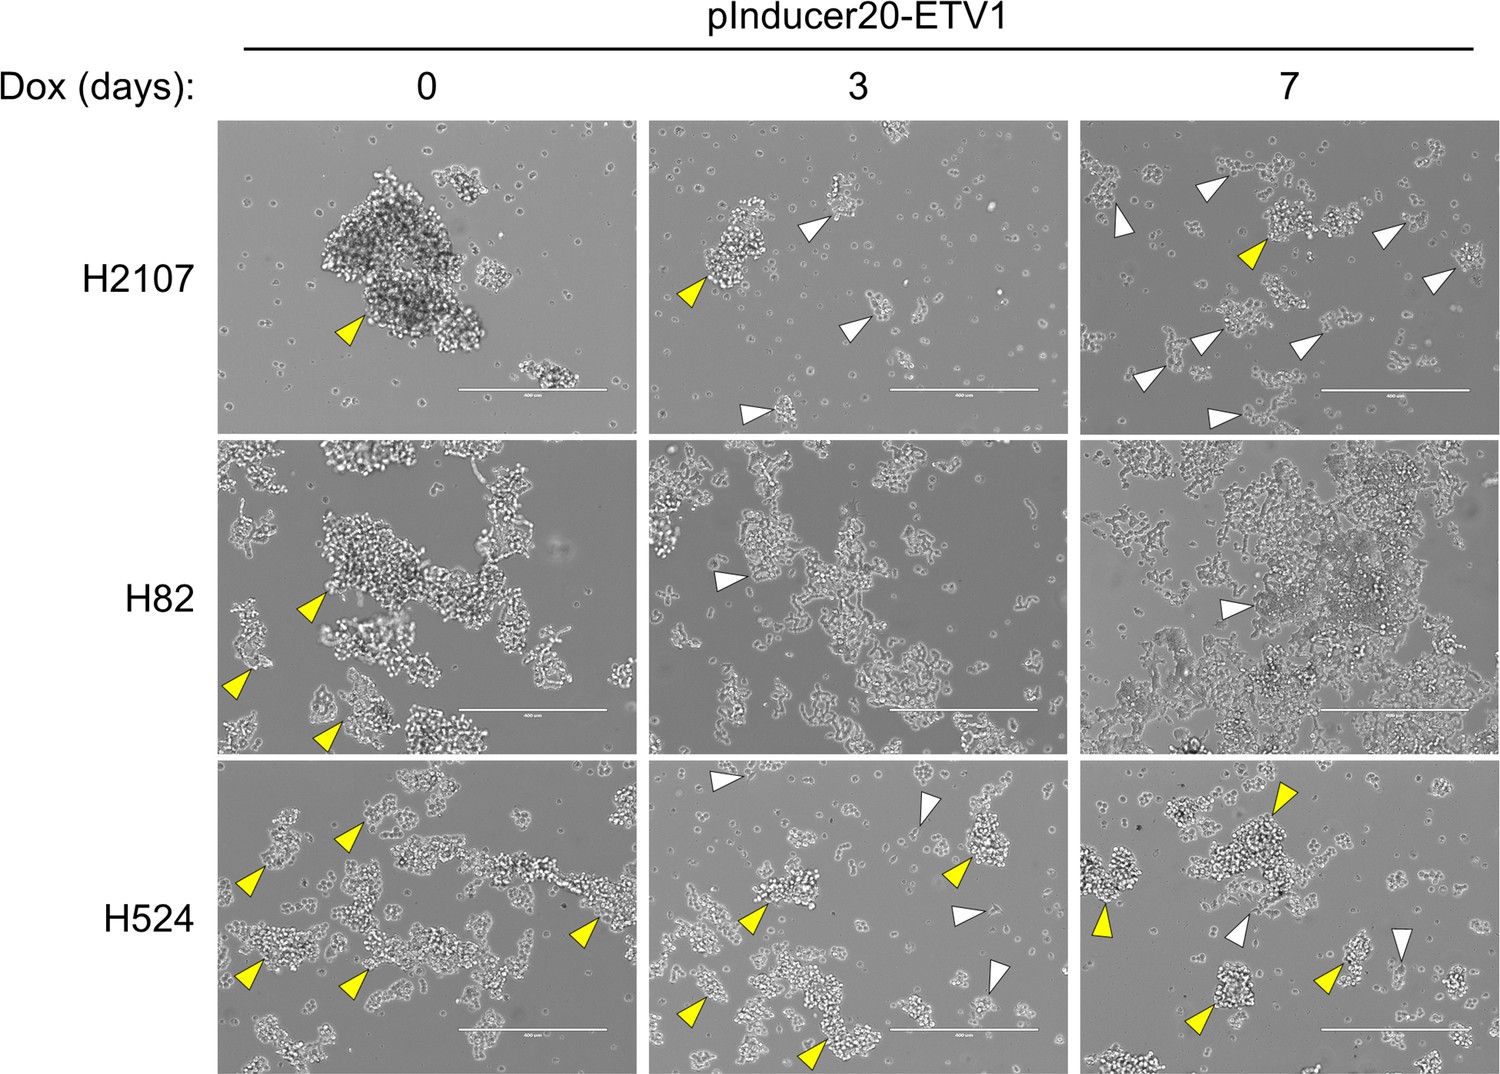
ETV1-induced phenotypic change in the growing pattern in small cell lung cancer cell lines.
Yellow and white arrowheads indicate floating aggregates and adherent cells, respectively. Scale bars, 400 μm.
Figure 6—figure supplement 2
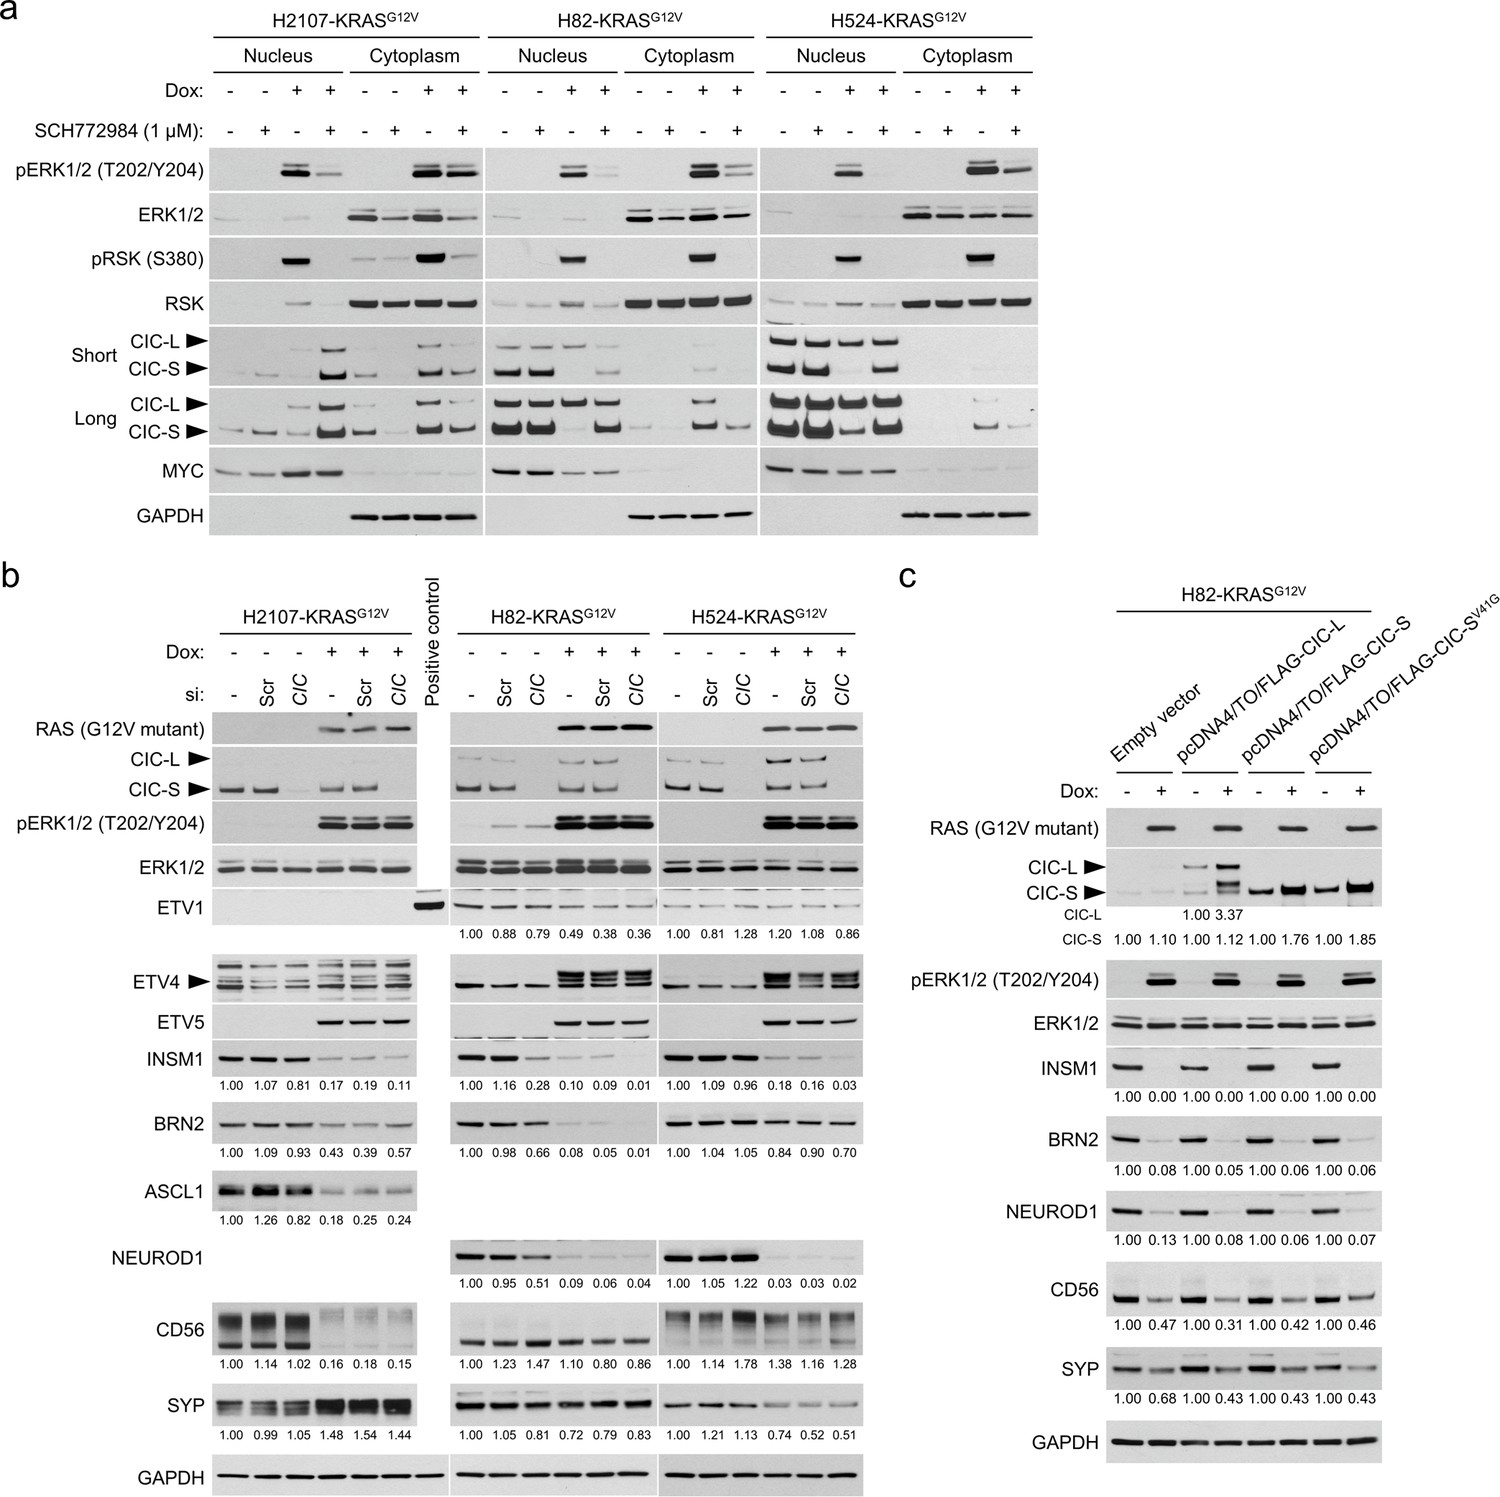
The roles of CIC in the regulation of neuroendocrine differentiation in small cell lung cancer cell lines.
(a) Western blot assessment of the effects of KRASG12V transduction and 1 μM SCH772984 treatment on CIC expression and subcellular localization using fractionated cell lysates after 72 hr of drug treatment. MYC and GAPDH were used as loading controls for the nuclear and cytoplasmic fractions, respectively. (b) Western blot analysis of the effects of CIC knockdown using an siRNA pool against CIC on neuroendocrine markers with or without KRASG12V transduction for 72 hr. Scrambled siRNA (siScr) was used as a negative control. GAPDH was used as a loading control. Numbers below blots show the amounts of each band relative to the corresponding non-doxycycline (dox)-treated and non-siRNA-treated control values (set to one in each cell line panel) after normalization to GAPDH. (c) Western blot showing the effects of transient overexpression of CIC isoforms for 72 hr with 100 ng/mL dox in H82-KRASG12V cells. Effects of CIC-L, CIC-S, or V41G mutant CIC-S overexpression on neuroendocrine factor expression was assessed. CIC-SV41G is known to lack the ability to interact with ATXN1L that forms a complex with CIC and enhances CIC function as a transcriptional co-repressor. GAPDH was used as a loading control. Numbers below blots show the amounts of each band relative to the corresponding non-dox-treated control values after normalization to GAPDH in each condition based on constructs used.
Figure 6—figure supplement 3

Western blot showing the effects of different combinations of inhibitors targeting MSK/RSK, CBP/p300, or ERG on expression of neuroendocrine transcription factors that are repressed by KRASG12V transduction in small cell lung cancer cells.
(a) Western blot showing the effects of MSK/RSK and/or ERG inhibition on expression of neuroendocrine transcription factors that are repressed by KRASG12V transduction in H2107, H82, and H524 cells. Cells were treated with 5 μM SB-747651A and/or different concentrations of ERGi-USU starting at 0.2 μM as well as 100 ng/mL doxycycline (dox) for 72 hr. GAPDH was used as a loading control. Numbers below blots are the amounts of each band relative to the corresponding control values after normalization to GAPDH. The controls were set as non-dox-treated and non-drug-treated (DMSO-treated) values (set to one in each cell line panel) except for ERG and ETV5 for which the controls were set as dox-treated and non-drug-treated (DMSO-treated) values (set to two in each cell line panel). (b) Western blot showing the effects of combined inhibition of MSK/RSK, CBP/p300, and/or ERG on expression of neuroendocrine transcription factors as well as MYC that are repressed by KRASG12V transduction in H82 cells. Cells were treated with 100 ng/mL dox, 5 μM SB-747651A, 400 nM A-485, and/or C646 (0.3 or 0.6 μM) for 72 hr. H3 and GAPDH were used as loading controls. Numbers below blots are the amounts of each band relative to the corresponding control values after normalization to H3 (for H3K27ac) or GAPDH (for ERG, ETV5, INSM1, BRN2, NEUROD1, CD56, SYP, and MYC). The controls were set as non-dox-treated and non-drug-treated (DMSO-treated) values (set to 1) except for ERG and ETV5 for which the controls were set as dox-treated and non-drug-treated (DMSO-treated) values (set to 2).
Figure 6—figure supplement 4

Effects of RB1 knockout on sensitivity and resistance mechanisms to osimertinib in TP53 and EGFR double-mutant lung adenocarcinoma cell lines.
(a) Western blot of RB in RB1-proficient parental PC9 and H1975 cells as well as RB1-knockout polyclonal and clonal cells. GAPDH was used as a loading control. (b) Western blot showing effects of 100 nM osimertinib treatment for up to 5 days on protein expression of neuroendocrine transcription factors and SOX2 in RB1-proficient and -deficient PC9 and H1975 cells. Lysates from the small cell lung cancer cell line, H2107 or H82, were used as a positive control for neuroendocrine markers. Lysates from H2107 were used as a positive control for SOX2. GAPDH was used as a loading control. (c) Mean relative proliferation of parental PC9 and H1975 cells with or without RB1 knockout treated with osimertinib. Cells were treated with osimertinib or DMSO for 72 hr. Bars represent mean (three biological replicates) ± SD. The IC50 values for each clone are as follows: PC9-sgControl, 7.0 nM; PC9-sgRB1 #1, 5.9 nM; PC9-sgRB1 #15, 4.8 nM; H1975-sgControl, 19 nM; H1975-sgRB1 #9, 145 nM; and H1975-sgRB1 #22, 57 nM. IC50 analysis of dose-response curves were compared by the extra sum-of-squares F test. (d) Mean relative proliferation of PC9 and H1975 cells with acquired resistance to osimertinib are plotted. Osimertinib-resistant RB1-proficient cells as well as RB1-knockout clonal cells were treated with osimertinib for 72 hr. Control cells were treated with DMSO as a vehicle control. Osimertinib-resistant cells were generated by either a stepwise dose-escalation or initial high-dose method. Bars represent mean (three biological replicates) ± SD. (e) Profiling of acquired genetic alterations through osimertinib treatment in PC9 and H1975 cells with or without RB1 knockout assessed by MSK-IMPACT. Abbreviations: stepwise, stepwise dose-escalation method; initial, initial high-dose method. (f) Western blot for profiling expression of EGFR, ERK, RAS, and neuroendocrine factors in parental and osimertinib-resistant PC9 and H1975 cells with or without RB1 knockout. Parental and resistant cells were harvested under treatment with 0.1% DMSO or osimertinib (2 μM for H1975 [stepwise dose-escalation method] and 1 μM for the others), respectively. Lysates from the small cell lung cancer cell line, H2107 or H82, were used as a positive control for neuroendocrine markers. GAPDH was used as a loading control. (g) Western blot for profiling expression of CIC as well as its downstream targets ETV1, ETV4, and ETV5 in parental and osimertinib-resistant H1975 cells. Parental cells were treated with 100 nM osimertinib or DMSO for 3 days. Osimertinib-resistant cells were cultured with 2 μM (stepwise dose-escalation method) or 1 μM (initial high-dose method) osimertinib. GAPDH was used as a loading control.
Figure 6—figure supplement 5

Cell morphology and profiling of neuroendocrine transcription factors in H1975 cells cultured in stem cell culture media (SCCM).
(a) Representative morphologic images of H1975 cells with or without RB1 knockout cultured in SCCM with DMSO or indicated drugs for 72 hr. In comparison with control cells cultured in RPMI 1640 (left), cells show suspending aggregates in SCCM (middle). By contrast, cells remain adherent and a neuronal-like phenotype is induced in SCCM with inhibition of ERK and MSK/RSK (right). Scale bars, 400 μm. (b) Western blot assessment of the effects of pharmacological inhibition of EGFR (with osimertinib), ERK (with SCH772984), MSK/RSK (with SB-747651A), and/or CBP/p300 (with A-485), on expression of AKT and neuroendocrine factors in H1975-sgRB1 #9 cells cultured in RPMI 1640 or SCCM for 72 hr. H3 and GAPDH were used as loading controls. Numbers below blots show the amounts of each band relative to the corresponding non-drug-treated (DMSO-treated) RPMI 1640 control values (set to 1) after normalization to GAPDH (for pEGFR and EGFR) or AKT (for pAKT). (c) Western blot assessment of the effects of pharmacological inhibition of ERK (with SCH772984), MSK/RSK (with SB-747651A), and/or CBP/p300, on expression of neuroendocrine factors in H1975-sgRB1 #9 cells cultured in RPMI 1640 or SCCM for 7 days. A-485 was used to inhibit the histone acetyltransferase activity of both CBP and p300, while C646 was used to inhibit the histone acetyltransferase activity of p300. H3 and GAPDH were used as loading controls.
Figure 7

Schematic representation of the mechanism of ERK-mediated repression of neuroendocrine differentiation through chromatin dysregulation in small cell lung cancer.
(a) and (c) Different mechanisms according to cell lines ((a), for H82; (c), for H2107 and H524) are depicted. (b) Overview of characteristics of cell lines used in this study. Illustration was created with BioRendrer.com. HDAC, histone deacetylase; TFs, transcription factors; NETFs, neuroendocrine transcription factors.
Tables
Key resources table
| Reagent type (species) or resource | Designation | Source or reference | Identifiers | Additional information |
|---|---|---|---|---|
| Cell line (Homo sapiens) | NCI-H2107 | ATCC | CRL-5983_FL | |
| Cell line (Homo sapiens) | NCI-H82 | ATCC | HTB-175 | |
| Cell line (Homo sapiens) | NCI-H524 | ATCC | CRL-5831 | |
| Cell line (Homo sapiens) | NCI-H526 | ATCC | CRL-5811 | |
| Cell line (Homo sapiens) | PC-9 | Adi Gazdar | ||
| Cell line (Homo-sapiens) | NCI-H1650 | ATCC | CRL-5883 | |
| Cell line (Homo sapiens) | NCI-H1975 | ATCC | CRL-5908 | |
| Cell line (Homo-sapiens) | HCC827 | ATCC | CRL-2868 | |
| Cell line (Homo sapiens) | HCC2279 | ATCC | CRL-2870 | |
| Cell line (Homo sapiens) | HCC2935 | ATCC | CRL-2869 | |
| Cell line (Homo sapiens) | HCC4006 | ATCC | CRL-2871 | |
| Cell line (Homo sapiens) | HCC4011 | Adi Gazdar | RRID:CVCL_S700 | |
| Cell line (Homo-sapiens) | NCI-H23 | ATCC | CRL-5800 | |
| Cell line (Homo sapiens) | NCI-H1792 | ATCC | CRL-5895 | |
| Cell line (Homo sapiens) | A549 | ATCC | CCL-185 | |
| Cell line (Homo sapiens) | NCI-H358 | ATCC | CRL-5807 | |
| Cell line (Homo sapiens) | NCI-H1395 | ATCC | CRL-5868 | |
| Cell line (Homo sapiens) | NCI-H2347 | ATCC | CRL-5942 | |
| cell line (Homo sapiens) | NCI-H460 | ATCC | HTB-177 | |
| Cell line (Homo sapiens) | NCI-H1155 | ATCC | CRL-5818 | |
| Transfected construct (human) | lentiCRISPRv2 | Addgene | RRID:Addgene_52961 | Lentiviral construct to transfect and express hSpCas9 and sgRNA. |
| Transfected construct (human) | pcDNA4/TO | Wong et al., 2019 PMID:30093628 | Tetracycline-regulated mammalian expression vector | |
| Transfected construct (human) | siRNA to MAPK3 (SMARTpool) | Horizon Discovery | L-003592–00 | transfected construct (human) |
| Transfected construct (human) | siRNA to MAPK1 (SMARTpool) | Horizon Discovery | L-003555–00 | transfected construct (human) |
| Transfected construct (human) | siRNA to REST (SMARTpool) | Horizon Discovery | L-006466–00 | transfected construct (human) |
| Transfected construct (human) | siRNA to CIC (SMARTpool) | Horizon Discovery | L-015185–01 | transfected construct (human) |
| Transfected construct (human) | siRNA to ETV4 (SMARTpool) | Horizon Discovery | L-004207–00 | transfected construct (human) |
| Transfected construct (human) | siRNA to ETV5 (SMARTpool) | Horizon Discovery | L-008894–00 | transfected construct (human) |
| Antibody | anti-phospho-EGFR (Tyr1068) (Rabbit polyclonal) | Cell Signaling Technology | Cat. #: 2234 | WB (1:1000) |
| Antibody | anti-EGFR (Rabbit polyclonal) | Cell Signaling Technology | Cat. #: 2232 | WB (1:1000) |
| Antibody | anti-Brn2/POU3F2 (D2C1L) (Rabbit monoclonal) | Cell Signaling Technology | Cat. #: 12137 | WB (1:1000) |
| Antibody | anti-INSM1 (A-8) (Mouse monoclonal) | Santa Cruz Biotechnology | Cat. #: sc-271408 | WB (1:1000) |
| Antibody | anti-MASH1 (24B72D11.1) (Mouse monoclonal) | BD Pharmingen Inc | Cat. #: 556604 | WB (1:1000) |
| Antibody | anti-NeuroD1 (D35G2) (Rabbit monoclonal) | Cell Signaling Technology | Cat. #: 4373 | WB (1:1000) |
| Antibody | anti-NCAM1 (CD56) (123C3) (Mouse monoclonal) | Cell Signaling Technology | Cat. #: 3576 | WB (1:1000) |
| Antibody | anti-Synaptophysin (Rabbit polyclonal) | Cell Signaling Technology | Cat. #: 4329 | WB (1:1000) |
| Antibody | anti-phospho-p44/42 MAPK (Thr202/Tyr204) (Rabbit polyclonal) | Cell Signaling Technology | Cat. #: 9101 | WB (1:1000) |
| Antibody | anti-p44/42 MAPK (137F5) (Rabbit monoclonal) | Cell Signaling Technology | Cat. #: 4695 | WB (1:1000) |
| Antibody | anti-Akt (Ser473) (D9E) (Rabbit monoclonal) | Cell Signaling Technology | Cat. #: 4060 | WB (1:2000) |
| Antibody | anti-Akt (pan) (C67E7) (Rabbit monoclonal) | Cell Signaling Technology | Cat. #: 4691 | WB (1:1000) |
| Antibody | anti-Ras (G12V mutant specific) (D2H12) (Rabbit monoclonal) | Cell Signaling Technology | Cat. #: 14412 | WB (1:1000) |
| Antibody | anti-Ras (D2C1) (Rabbit monoclonal) | Cell Signaling Technology | Cat. #: 8955 | WB (1:1000) |
| Antibody | anti-c-Myc (D84C12) (Rabbit monoclonal) | Cell Signaling Technology | Cat. #: 5605 | WB (1:1000) |
| Antibody | anti-cleaved PARP (Asp214) (D64E10) (Rabbit monoclonal) | Cell Signaling Technology | Cat. #: 5625 | WB (1:1000) |
| Antibody | anti-YAP (D8H1X) (Rabbit monoclonal) | Cell Signaling Technology | Cat. #: 14074 | WB (1:1000) |
| Antibody | anti-phospho-p90RSK (Ser380) (D3H11) (Rabbit monoclonal) | Cell Signaling Technology | Cat. #: 11989 | WB (1:1000) |
| Antibody | anti-RSK1/RSK2/RSK3 (D7A2H) (Rabbit monoclonal) | Cell Signaling Technology | Cat. #: 14813 | WB (1:1000) |
| Antibody | anti-phospho-CREB (Ser133) (1B6) (Mouse monoclonal) | Cell Signaling Technology | Cat. #: 9196 | WB (1:1000) |
| Antibody | anti-CREB (48H2) (Rabbit monoclonal) | Cell Signaling Technology | Cat. #: 9197 | WB (1:1000) |
| Antibody | anti-Notch1 (D1E11) (Rabbit monoclonal) | Cell Signaling Technology | Cat. #: 3608 | WB (1:1000) |
| Antibody | anti-cleaved Notch1 (Val1744) (D3B8) (Rabbit monoclonal) | Cell Signaling Technology | Cat. #: 4147 | WB (1:1000) |
| Antibody | anti-Notch2 (D76A6) (Rabbit monoclonal) | Cell Signaling Technology | Cat. #: 5732 | WB (1:1000) |
| Antibody | anti-HES1 (D6P2U) (Rabbit monoclonal) | Cell Signaling Technology | Cat. #: 11988 | WB (1:1000) |
| Antibody | anti-Sox2 (D6D9) (Rabbit monoclonal) | Cell Signaling Technology | Cat. #: 3579 | WB (1:1000) |
| Antibody | anti-Sox9 (D8G8H) (Rabbit monoclonal) | Cell Signaling Technology | Cat. #: 82630 | WB (1:1000) |
| Antibody | anti-H3K4me3 (C42D8) (Rabbit monoclonal) | Cell Signaling Technology | Cat. #: 9751 | WB (1:1000) |
| Antibody | anti-H3K9me3 (D4W1U) (Rabbit monoclonal) | Cell Signaling Technology | Cat. #: 13969 | WB (1:1000) |
| Antibody | anti-H3K9ac (C5B11) (Rabbit monoclonal) | Cell Signaling Technology | Cat. #: 9649 | WB (1:1000) |
| Antibody | anti-H3K14ac (D4B9) (Rabbit monoclonal) | Cell Signaling Technology | Cat. #: 7627 | WB (1:1000) |
| Antibody | anti-H3K27ac (D5E4) (Rabbit monoclonal) | Cell Signaling Technology | Cat. #: 8173 | WB (1:1000) |
| Antibody | anti-H3S10ph (Ser10) (Rabbit polyclonal) | Cell Signaling Technology | Cat. #: 9701 | WB (1:1000) |
| Antibody | anti-H3S28ph (Ser28) (Rabbit polyclonal) | Cell Signaling Technology | Cat. #: 9713 | WB (1:1000) |
| Antibody | anti-Histone H3 (D1H2) (Rabbit monoclonal) | Cell Signaling Technology | Cat. #: 4499 | WB (1:2000) |
| Antibody | anti-CIC (Rabbit polyclonal) | Thermo Fisher Scientific | Cat. #: PA1-46018 | WB (1:1000) |
| Antibody | anti-HA-Tag (C29F4) (Rabbit monoclonal) | Cell Signaling Technology | Cat. #: 3724 | WB (1:1000) |
| Antibody | anti-ETV1 (Rabbit polyclonal) | Thermo Fisher Scientific | Cat. #: PA5-41484 | WB (1:1000) |
| Antibody | anti-Pea3 (Rabbit polyclonal) | Abcam | Cat. #: ab189826 | WB (1:1000) |
| Antibody | anti-ERM/Etv5 (Rabbit polyclonal) | Abcam | Cat. #: ab102010 | WB (1:1000) |
| Antibody | anti-ERG (A7L1G) (Rabbit monoclonal) | Cell Signaling Technology | Cat. #: 97249 | WB (1:1000) |
| Antibody | anti-Rb (4H1) (Mouse monoclonal) | Cell Signaling Technology | Cat. #: 9309 | WB (1:2000) |
| Antibody | anti-β-Actin (D6A8) (Rabbit monoclonal) | Cell Signaling Technology | Cat. #: 12620 | WB (1:1000) |
| Antibody | anti-GAPDH (0411) (Mouse monoclonal) | Santa Cruz Biotechnology | Cat. #: sc-47724 | WB (1:3000) |
| Recombinant DNA reagent | pInducer20 (plasmid) | Addgene | RRID:Addgene_44012 | Tet-inducible lentiviral vector for ORF expression |
| Recombinant DNA reagent | pInducer20-GFP (plasmid) | Unni et al., 2015 PMID:26047463 | GFP version of pInducer20 | |
| Recombinant DNA reagent | pInducer20-EGFRL858R (plasmid) | Unni et al., 2015 PMID:26047463 | EGFRL858R version of pInducer20 | |
| Recombinant DNA reagent | pInducer20-KRASG12V (plasmid) | Unni et al., 2015 PMID:26047463 | KRASG12V version of pInducer20 | |
| Recombinant DNA reagent | pInducer20-ETV1 (plasmid) | This paper – Materials and methods Section | Lockwood Lab | ETV1 version of pInducer20 |
| Recombinant DNA reagent | pInducer20-ETV5 (plasmid) | This paper – Materials and methods Section | Lockwood Lab | ETV5 version of pInducer20 |
| Recombinant DNA reagent | pcDNA4/TO/FLAG-CIC-L | Wong et al., 2019 PMID:30093628 | Tetracycline-regulated CIC-L expression vector | |
| Recombinant DNA reagent | pcDNA4/TO/FLAG-CIC-S | Wong et al., 2019 PMID:30093628 | Tetracycline-regulated CIC-S expression vector | |
| Recombinant DNA reagent | pcDNA4/TO/FLAG-CIC-SV41G | Wong et al., 2019 PMID:30093628 | Tetracycline-regulated CIC-SV41G expression vector | |
| Sequence-based reagent | sgHES1-1 | This paper | sgRNA sequence | GTGCTGGGGAAGTACCGAGC |
| Sequence-based reagent | sgHES1-2 | This paper | sgRNA sequence | GGTATTAACGCCCTCGCACG |
| Sequence-based reagent | sgSOX9-1 | This paper | sgRNA sequence | CAAAGGCTACGACTGGACGC |
| Sequence-based reagent | sgSOX9-2 | This paper | sgRNA sequence | AGGTGCTCAAAGGCTACGAC |
| Sequence-based reagent | sgRB1-1 | PMID:26314710 Nicolay et al., 2015 | sgRNA sequence | GCTCTGGGTCCTCCTCAGGA |
| Sequence-based reagent | siRNA: non-targeting control | Horizon Discovery | D-001810–10 | transfected construct (human) |
| Commercial assay or kit | Proteome Profiler Human Phospho-Kinase Array Kit | R and D Systems | Cat. #: ARY003B | |
| Commercial assay or kit | Quick-RNA Miniprep Kit | Zymo Research | Cat. #: R1054 | |
| Commercial assay or kit | DNeasy Blood and Tissue Kit | Qiagen | Cat. #: 69506 | |
| Commercial assay or kit | High-Capacity RNA-to-cDNA Kit | Thermo Fisher Scientific | Cat. #: 4387406 | |
| Commercial assay or kit | Gateway LR Clonase II enzyme mix | Thermo Fisher Scientific | Cat. #: 11791020 | |
| Commercial assay or kit | TaqMan Gene Expression Assay Mix for REST | Thermo Fisher Scientific | Cat. #: Hs05028212_s1 | |
| Commercial assay or kit | TaqMan Gene Expression Assay Mix for ACTB | Thermo Fisher Scientific | Cat. #: Hs99999903_m1 | |
| Commercial assay or kit | NE-PER Nuclear and Cytoplasmic Extraction Reagents | Thermo Fisher Scientific | Cat. #: 78833 | |
| Chemical compound, drug | Doxycycline hyclate | Sigma Aldrich | D9891 | |
| Chemical compound, drug | SCH772984 | Selleck Chemicals | S7101 | |
| Chemical compound, drug | MK-2206 2HCl | Selleck Chemicals | S1078 | |
| Chemical compound, drug | RO4929097 | Selleck Chemicals | S1575 | |
| Chemical compound, drug | SB-747651A dihydrochloride | Tocris Bioscience | 4630 | |
| Chemical compound, drug | A-485 | Tocris Bioscience | 6387 | |
| Chemical compound, drug | Trichostatin A | Selleck Chemicals | S1045 | |
| Chemical compound, drug | C646 | Selleck Chemicals | S7152 | |
| Chemical compound, drug | ERGi-USU | Tocris Bioscience | 6632 | |
| Chemical compound, drug | Osimertinib | Selleck Chemicals | S7297 | |
| Software, algorithm | R software | R Foundation for Statistical Computing | Version 3.6.1 | |
| Software, algorithm | GSEA software | PMID:16199517 | Version 4.0.3 | |
| Software, algorithm | GraphPad Prism | GraphPad Software | Version 8.2.1 |
Additional files
-
Supplementary file 1
Genes differentially expressed in H82 and H2107 cells after induction of KRASG12V or EGFRL858R for 1 or 7 days.
- https://cdn.elifesciences.org/articles/66524/elife-66524-supp1-v3.xlsx
-
Transparent reporting form
- https://cdn.elifesciences.org/articles/66524/elife-66524-transrepform-v3.pdf
Download links
A two-part list of links to download the article, or parts of the article, in various formats.
Downloads (link to download the article as PDF)
Open citations (links to open the citations from this article in various online reference manager services)
Cite this article (links to download the citations from this article in formats compatible with various reference manager tools)
Extracellular signal-regulated kinase mediates chromatin rewiring and lineage transformation in lung cancer
eLife 10:e66524.
https://doi.org/10.7554/eLife.66524


