Phases of cortical actomyosin dynamics coupled to the neuroblast polarity cycle
- Institute of Molecular Biology, Department of Chemistry and Biochemistry, University of Oregon, United States
Figures
Figure 1 with 1 supplement
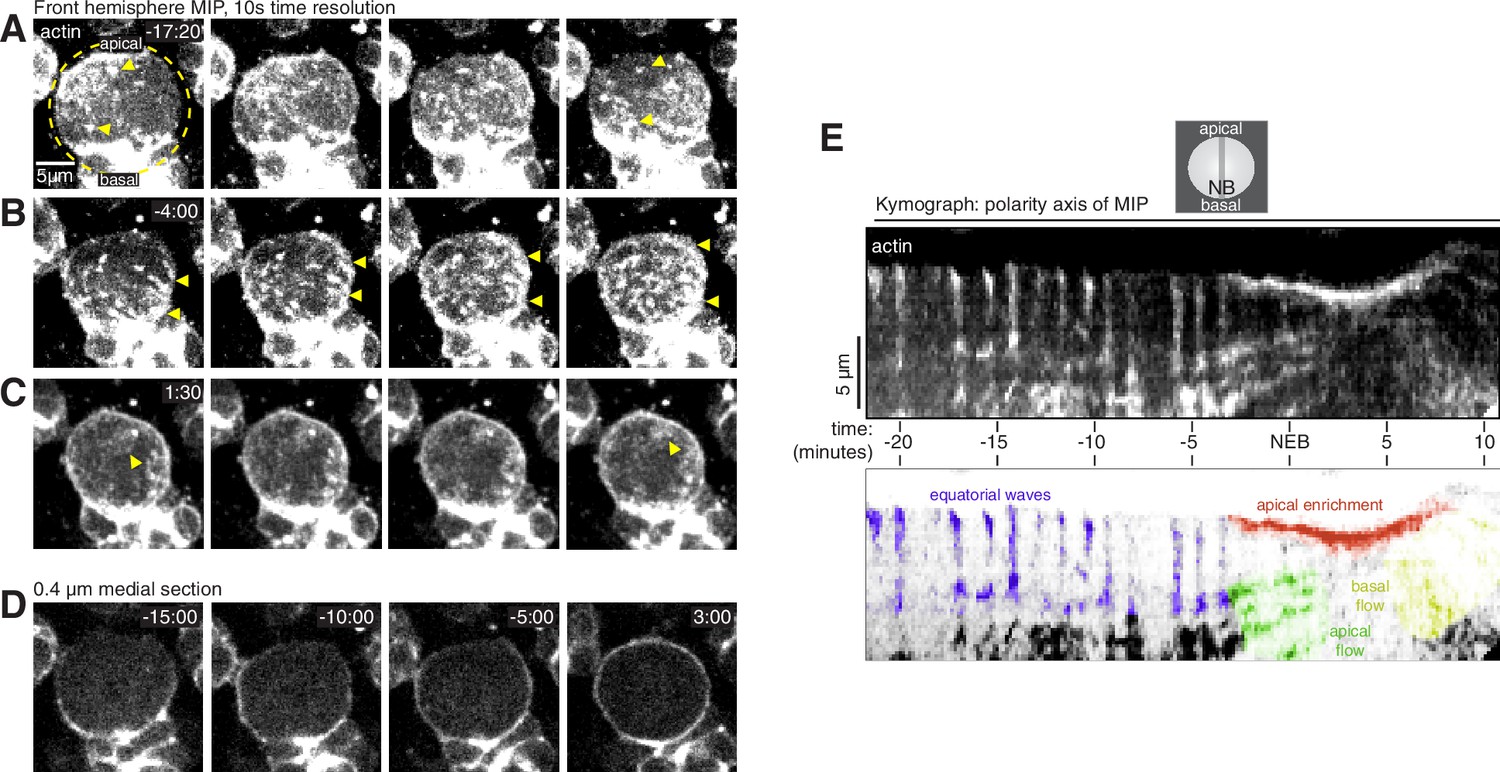
Cortical F-actin dynamics in asymmetrically dividing Drosophila larval brain neuroblasts.
(A) Selected frames from Video 1 showing cortical actin pulses during interphase. mRuby-LifeAct expressed via insc-GAL4/UAS (“actin”) is shown via a maximum intensity projection (MIP) constructed from optical sections through the front hemisphere of the cell. The outline of the neuroblast is shown by a dashed yellow circle. In this example, the pulse moves from the upper left of the cell to the lower right. Arrowheads mark several cortical actin patches. Time (mm:ss) is relative to nuclear envelope breakdown. (B) Selected frames from Video 1 as in panel A showing cortical actin moving apically. Arrowheads delineate apical and basal extent of dynamic actin. (C) Selected frames from Video 1 as in panel A showing cortical actin enriched on the apical cortex. (D) Selected frames from Video 1 showing how actin becomes cortically enriched near nuclear envelope breakdown (NEB). A single 0.4 µM medial section of the cortical actin signal is relatively discontinuous before NEB, with areas of very low actin signal, but becomes more evenly distributed as the cell rounds in mitosis (3:00 time point). (E) Kymograph constructed from frames of Video 1 using sections along the apical-basal axis as indicated (NB, neuroblast). A legend with the features in the kymograph depicting the cortical dynamic phases and apical enrichment of actin is included below.
Figure 1—figure supplement 1
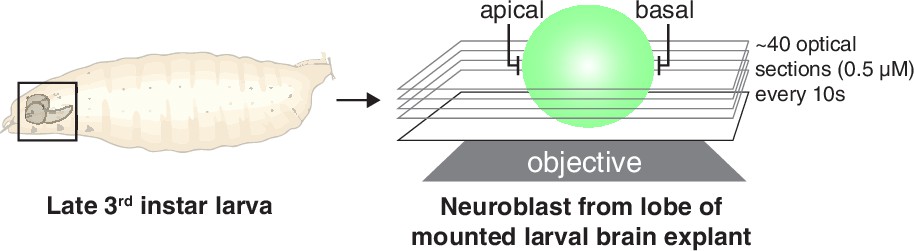
Imaging and analysis scheme for rapid, full volume imaging of Drosophila neuroblasts from larval brain explants.
Larval brains from 3rd instar larvae were mounted and imaged along the neuroblast polarity axis (‘apical’ and ‘basal’). Optical sections across the full cell volume were acquired every 10–15 s and used to construct maximum intensity projections.
Figure 2 with 1 supplement
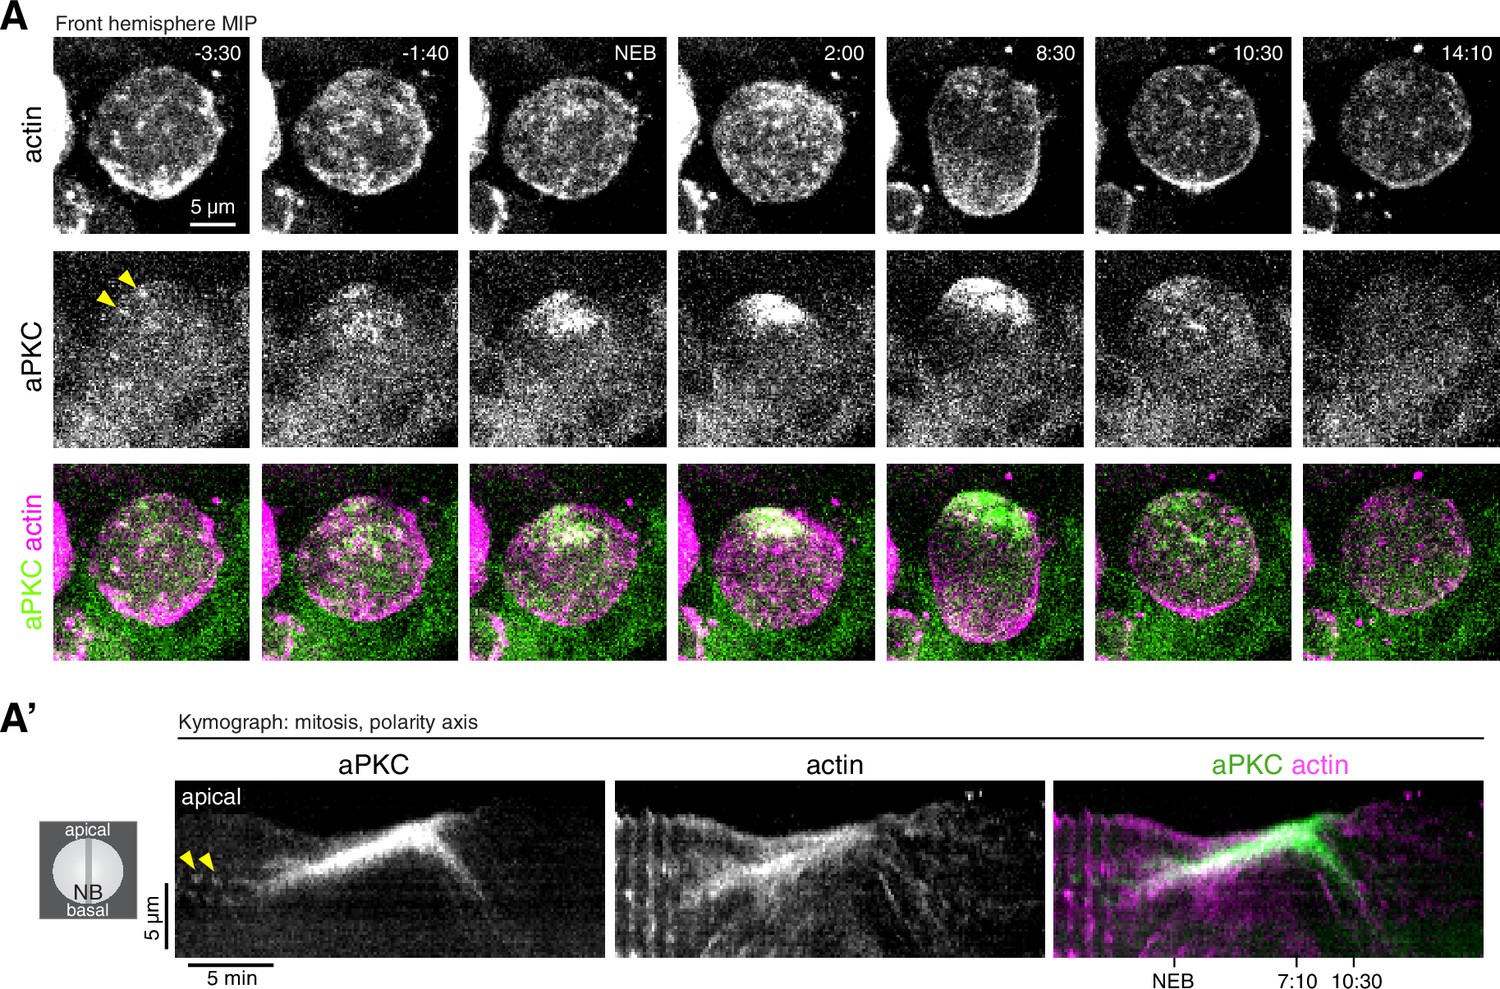
Coordinated actin and aPKC dynamics during the neuroblast polarity cycle.
Figure 2—video 1
Videos used to calculate when apically directed aPKC and actin movements begin.
aPKC-GFP expressed from its endogenous promoter (left panel) and mRuby-LifeAct expressed via insc-GAL4/UAS (middle panel) and merge (right panel with aPKC green and LifeAct magenta) are shown via a maximum intensity projection (MIP) constructed from optical sections through the front hemisphere of the cell. Each replicate is labeled with the larva and neuroblast number. Time (mm:ss) relative to NEB is shown in the upper left corner.
Figure 3 with 5 supplements
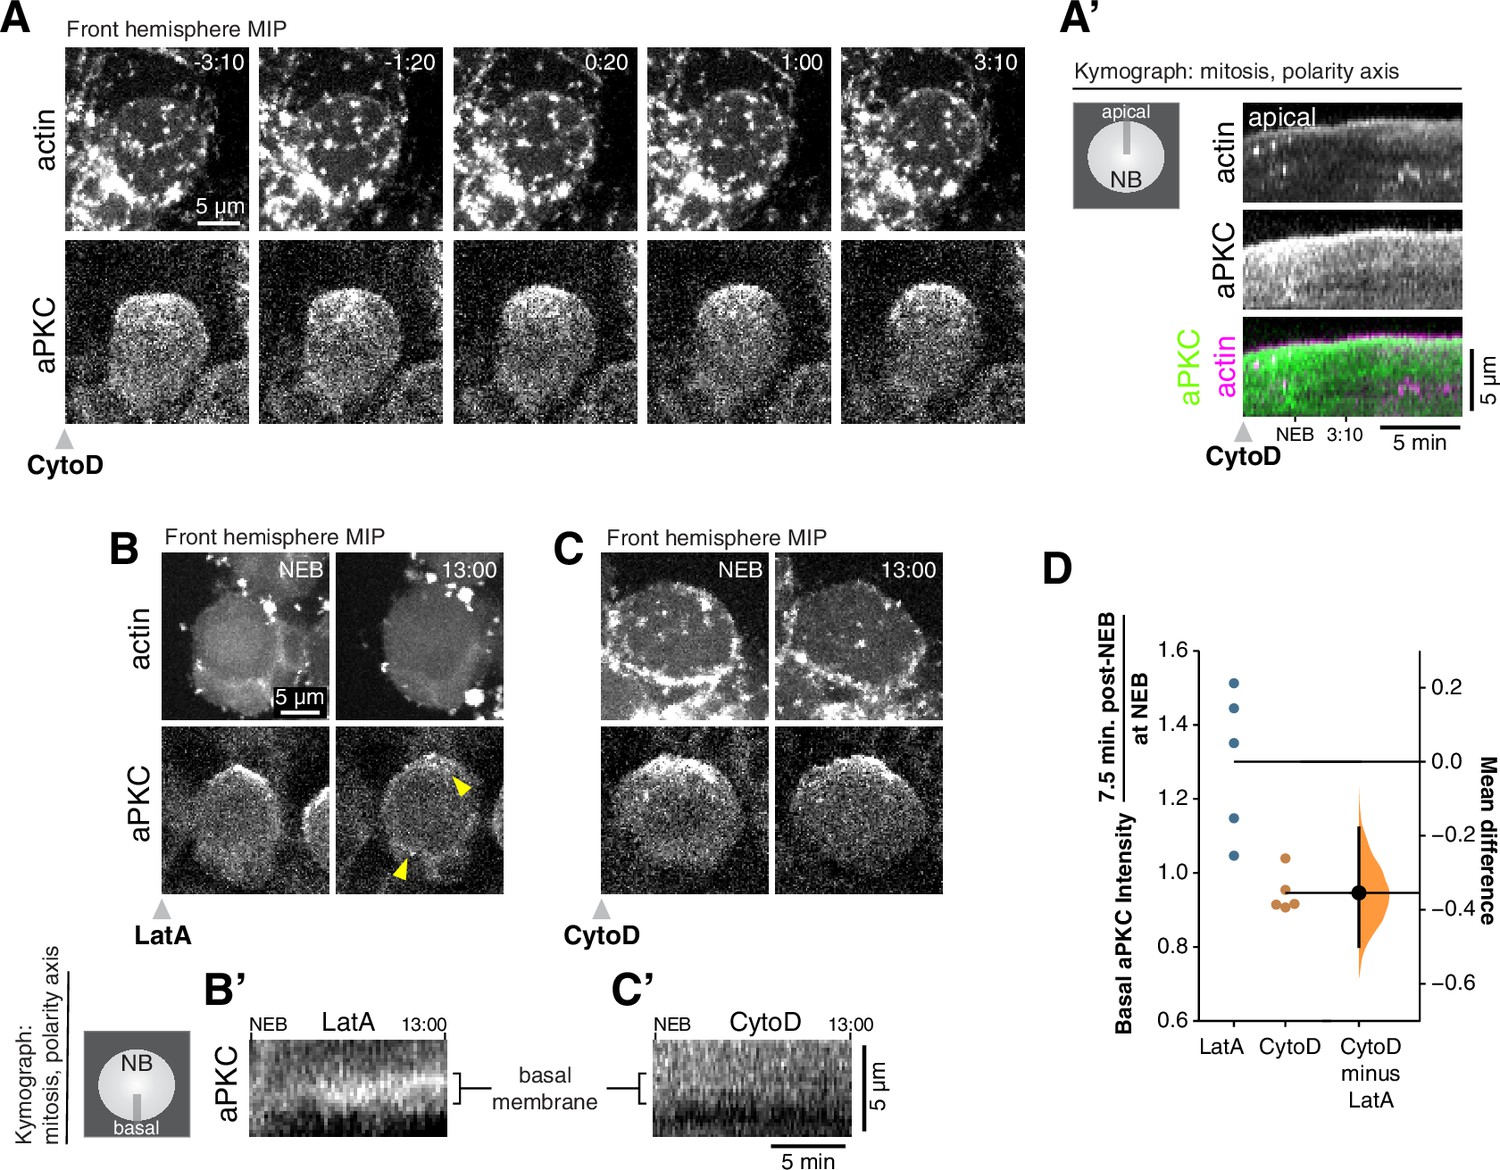
Cortical F-actin is required for aPKC coalescence and polarity maintenance.
(A) Disruption of cortical F-actin dynamics using a low dosage (50 µM) of cytochalasin D (CytoD) causes immediate cessation of aPKC cortical movement. Selected frames from Figure 3—video 1 showing the inhibition of actin dynamics and accompanying loss of apically-directed aPKC movements. aPKC-GFP expressed from its endogenous promoter (‘aPKC’) and mRuby-LifeAct expressed via insc-GAL4/UAS (‘actin’) are shown via a maximum intensity projection (MIP) constructed from optical sections through the front hemisphere of the cell. (A’) Kymograph made from Figure 3—video 1 using a section of each frame along the apical-basal axis, as indicated. (B) Selected frames from Figure 3—video 3 showing significant entry of aPKC into the basal hemisphere (i.e. depolarization) following LatA treatment. Upper arrowhead highlights a localized enrichment of aPKC that is retained in the apical region. Lower arrowhead highlights increased aPKC in basal hemisphere. (B’) Kymograph made from Figure 3—video 3 using a section of each frame along the basal membrane near the cell’s equator as indicated. (C) Selected frames from Figure 3—video 4 showing the maintenance of aPKC polarization following CytoD treatment. (C’) Kymograph made from Figure 3—video 4 using a section of each frame along the basal membrane as indicated. (D) Gardner-Altman estimation plot of the fold increase in basal aPKC membrane signal following Latrunculin A (LatA) and CytoD treatments. The ratio of aPKC membrane signal on the basal membrane shortly after NEB to that at NEB is shown for individual LatA- and CytoD-treated neuroblasts (shown in Figure 3—video 5), along with the difference in means of the measurements. Statistics: bootstrap 95 % confidence interval (bar in ‘CytoD minus LatA’ column shown with bootstrap resampling distribution).
Figure 3—video 1
Inhibition of cortical actin and aPKC dynamics by Cytochalasin D.
GFP-aPKC expressed from its endogenous promoter and the mRuby-LifeAct sensor expressed from the UAS promoter and insc-GAL4 (drives expression in neuroblasts and progeny) are shown from simultaneously acquired optical sections with a maximum intensity projection of the front hemisphere of the cell. CytoD was added to the media surrounding the larval brain explant at 2 min prior to the beginning of the movie.
Figure 3—video 2
Movies used to quantify apical movements of aPKC in Cytochalasin D-treated neuroblasts.
GFP-aPKC expressed from its endogenous promoter (left panel), the mRuby-LifeAct sensor expressed from the UAS promoter and insc-GAL4 (middle panel), and a merge of the two channels (aPKC–green, LifeAct–magenta) are shown from simultaneously acquired optical sections with a maximum intensity projection of the front hemisphere of the cell. CytoD was added to the media surrounding the larval brain explant at 2 min prior to the beginning of the movie as indicated. Each replicate is labeled with the larva and neuroblast number. Time (mm:ss) relative to NEB is shown in the upper left corner.
Figure 3—video 3
Depolarization of aPKC induced by Latrunculin A.
GFP-aPKC expressed from its endogenous promoter and the mRuby-Lifeact sensor expressed from the UAS promoter and insc-GAL4 (drives expression in neuroblasts and progeny) are shown from simultaneously acquired optical sections with a maximum intensity projection of the front hemisphere of the cell. LatA was added to the media surrounding the larval brain explant at 2 min prior to the beginning of the movie.
Figure 3—video 4
Maintenance of polarized aPKC in a Cytochalasin D-treated neuroblast.
GFP-aPKC expressed from its endogenous promoter and the mRuby-Lifeact sensor expressed from the UAS promoter and insc-GAL4 (drives expression in neuroblasts and progeny) are shown from simultaneously acquired optical sections with a maximum intensity projection of the front hemisphere of the cell. CytoD was added to the media surrounding the larval brain explant at 2 min prior to the beginning of the movie.
Figure 3—video 5
Movies used to quantify maintenance of aPKC in Latrunculin A- and Cytochalasin D-treated neuroblasts.
GFP-aPKC expressed from its endogenous promoter (left panel), the mRuby-LifeAct sensor expressed from the UAS promoter and insc-GAL4 (middle panel), and a merge of the two channels (aPKC–green, LifeAct–magenta) are shown from simultaneously acquired optical sections with a maximum intensity projection of the front hemisphere of the cell. CytoD or LatA (as indicated) was added to the media surrounding the larval brain explant at 2 min prior to the beginning of the movie as indicated. Each replicate is labeled with the larva and neuroblast number. Time (mm:ss) relative to NEB is shown in the upper left corner.
Figure 4
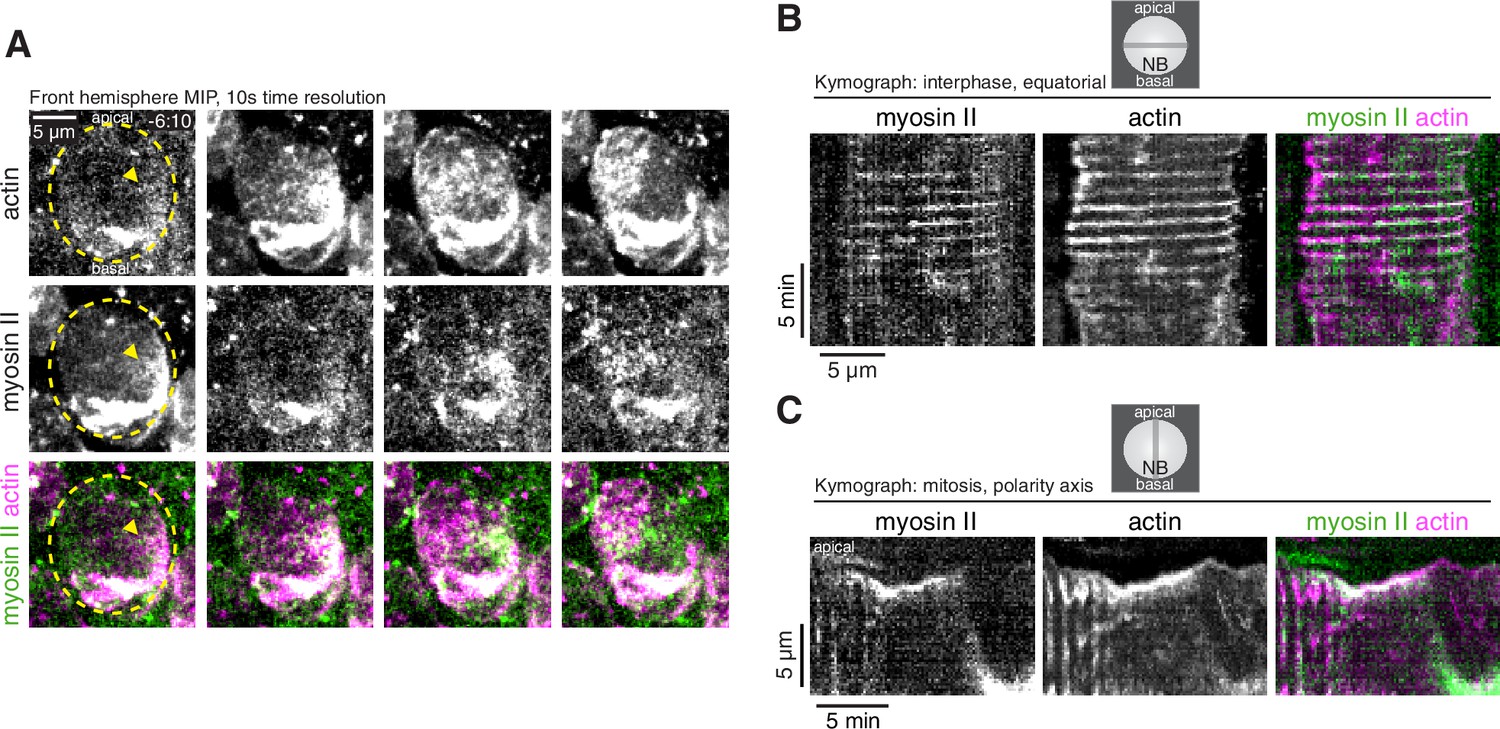
Dynamics of cortical actomyosin in asymmetrically dividing Drosophila larval brain neuroblasts.
(A) Selected frames from Video 3 showing cortical actomyosin dynamics. GFP-Sqh expressed from its endogenous promoter (‘Myosin II’) and mRuby-LifeAct expressed via worniu-GAL4/UAS (‘actin’) are shown via a maximum intensity projection (MIP) constructed from optical sections through the front hemisphere of the cell. The outline of the neuroblast is shown by a dashed yellow line and arrowheads indicate the starting position of the cortical patches. Time is relative to nuclear envelope breakdown. (B) Kymograph constructed from frames of Video 3 during interphase using sections through the equatorial region of the cell as indicated. (C) Kymograph constructed from frames of Video 3 during mitosis using sections along the polarity axis of the cell as indicated.
Figure 5
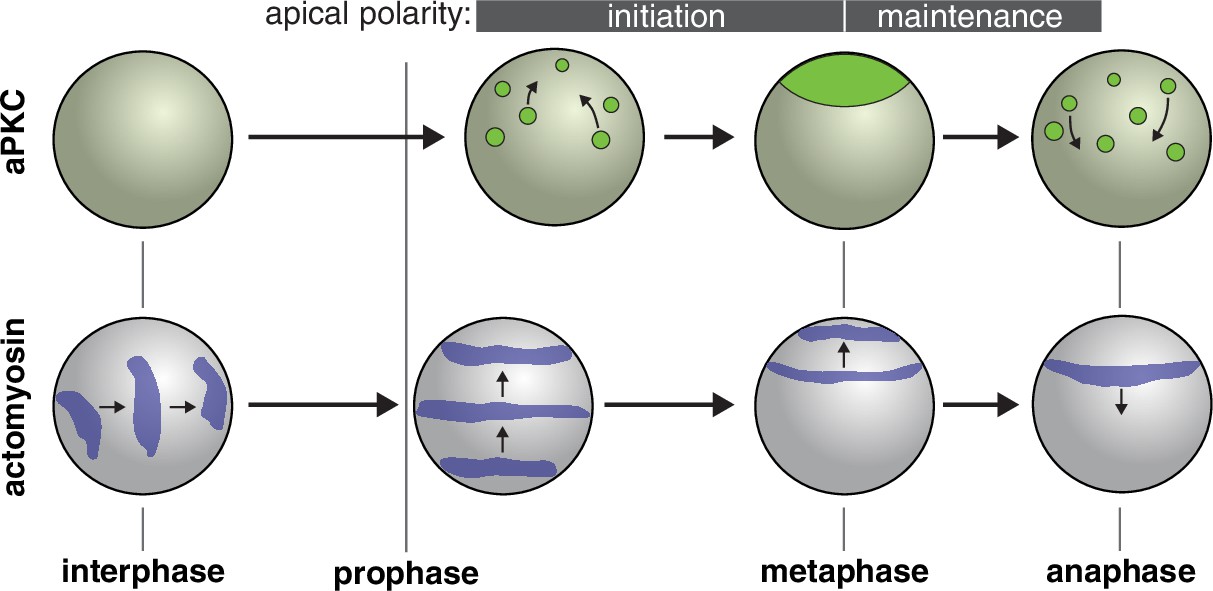
Model for role of actomyosin in neuroblast Par polarity.
During interphase when aPKC is cytoplasmic, actomyosin pulsatile contractions are predominantly equatorial. During apical polarity initiation in prophase and shortly before when discrete aPKC cortical patches begin to coalesce, actomyosin transitions to more continuous movements directed toward the apical cortex. At anaphase apical actomyosin is cleared as it flows toward the cleavage furrow while the aPKC cap is disassembled.
Videos
Video 1
Actin dynamics in a larval brain neuroblast.
The mRuby-Lifeact sensor expressed from the UAS promoter and insc-GAL4 (expressed in neuroblasts and their progeny) is shown with a maximum intensity projection of the front hemisphere of the cell.
Video 2
Correlated dynamics of the Par protein aPKC and actin in a larval brain neuroblast.
GFP-aPKC expressed from its endogenous promoter and the mRuby-Lifeact sensor expressed from the UAS promoter and insc-GAL4 (drives expression in neuroblasts and progeny) are shown from simultaneously acquired optical sections with a maximum intensity projection of the front hemisphere of the cell.
Video 3
Correlated dynamics of myosin II and actin in a larval brain neuroblast.
GFP-Sqh (the myosin II regulatory light chain, Spaghetti squash) expressed from its endogenous promoter and the mRuby-Lifeact sensor expressed from the UAS promoter and worniu-GAL4 (expressed in neuroblasts and their progeny) are shown from simultaneously acquired optical sections with a maximum intensity projection of the front hemisphere of the cell and the medial optical section. The neuroblast is highlighted by a dashed circle.
Tables
Key resources table
| Reagent type (species) or resource | Designation | Source or reference | Identifiers | Additional information |
|---|---|---|---|---|
| Genetic reagent (Drosophila melanogaster) | Lifeact-Ruby | Bloomington Drosophila Stock Center | BDSC:35545; FLYB:FBti0143328; RRID:BDSC_35545 | FlyBase symbol: P{UAS-Lifeact-Ruby}VIE-19A |
| Genetic reagent (D. melanogaster) | insc-Gal4 | Chris Doe Lab; Bloomington Drosophila Stock Center | BDSC:8751; FLYB:FBti0148948; RRID:BDSC_8751 | FlyBase symbol: P{GawB}inscMz1407 |
| Genetic reagent (D. melanogaster) | aPKC-GFP | François Schweisguth Lab; Besson et al., 2015 | BAC encoded aPKC-GFP | |
| Genetic reagent (D. melanogaster) | wor-Gal4 | Chris Doe Lab; Bloomington Drosophila Stock Center | BDSC:56553; FLYB:FBti0161165; RRID:BDSC_56553 | FlyBase symbol: P{wor.GAL4.A}2 |
| Genetic reagent (D. melanogaster) | Sqh-GFP | Royou et al., 2002 | Expressed by natural sqh promoter | |
| Chemical compound, drug | Latrunculin A | Sigma-Aldrich | Sigma-Aldrich: L5163 | (50 µM) |
| Chemical compound, drug | Cytochalasin D | Enzo Life Sciences | Enzo Life Sciences: BML-T109-0001 | (50 µM) |
Additional files
Download links
A two-part list of links to download the article, or parts of the article, in various formats.
Downloads (link to download the article as PDF)
Open citations (links to open the citations from this article in various online reference manager services)
Cite this article (links to download the citations from this article in formats compatible with various reference manager tools)
Phases of cortical actomyosin dynamics coupled to the neuroblast polarity cycle
eLife 10:e66574.
https://doi.org/10.7554/eLife.66574


