Phases of cortical actomyosin dynamics coupled to the neuroblast polarity cycle
Abstract
The Par complex dynamically polarizes to the apical cortex of asymmetrically dividing Drosophila neuroblasts where it directs fate determinant segregation. Previously, we showed that apically directed cortical movements that polarize the Par complex require F-actin (Oon and Prehoda, 2019). Here, we report the discovery of cortical actomyosin dynamics that begin in interphase when the Par complex is cytoplasmic but ultimately become tightly coupled to cortical Par dynamics. Interphase cortical actomyosin dynamics are unoriented and pulsatile but rapidly become sustained and apically-directed in early mitosis when the Par protein aPKC accumulates on the cortex. Apical actomyosin flows drive the coalescence of aPKC into an apical cap that depolarizes in anaphase when the flow reverses direction. Together with the previously characterized role of anaphase flows in specifying daughter cell size asymmetry, our results indicate that multiple phases of cortical actomyosin dynamics regulate asymmetric cell division.
Editor's evaluation
Oon and Prehoda report pulsatile contraction of apical membrane in the process of Par protein polarization in Drosophila neuroblasts. This explains how/why actin filament was required to localize/polarize Par complex. This very much resembles the observation in C. elegans embryos, and nicely unifies observations across systems.
https://doi.org/10.7554/eLife.66574.sa0Introduction
The Par complex polarizes animal cells by excluding specific factors from the Par cortical domain (Lang and Munro, 2017; Venkei and Yamashita, 2018). In Drosophila neuroblasts, for example, the Par domain forms at the apical cortex during mitosis where it prevents the accumulation of neuronal fate determinants, effectively restricting them to the basal cortex. The resulting cortical domains are bisected by the cleavage furrow leading to fate determinant segregation into the basal daughter cell where they promote differentiation (Homem and Knoblich, 2012). It was recently discovered that apical Par polarization in the neuroblast is a multistep process in which the complex is initially targeted to the apical hemisphere early in mitosis where it forms a discontinuous meshwork (Kono et al., 2019; Oon and Prehoda, 2019). Cortical Par proteins then move along the cortex toward the apical pole, ultimately leading to formation of an apical cap that is maintained until shortly after anaphase onset (Oon and Prehoda, 2019). Here, we examine how the cortical movements that initiate and potentially maintain neuroblast Par polarity are generated.
An intact actin cytoskeleton is required for the movements that polarize Par proteins to the neuroblast apical cortex, but its role in the polarization process has been unclear. Depolymerization of F-actin causes apical aPKC to spread to the basal cortex (Hannaford et al., 2018; Oon and Prehoda, 2019), prevents aPKC coalescence, and induces disassembly of the apical aPKC cap (Oon and Prehoda, 2019), suggesting that actin filaments are important for both apical polarity initiation and its maintenance. How the actin cytoskeleton participates in polarizing the Par complex in neuroblasts has been unclear, but actomyosin plays a central role in generating the anterior Par cortical domain in the C. elegans zygote. Contractions oriented toward the anterior pole transport the Par complex from an evenly distributed state (Illukkumbura et al., 2020; Lang and Munro, 2017). Bulk transport is mediated by advective flows generated by highly dynamic, transient actomyosin accumulations on the cell cortex (Goehring et al., 2011). While cortical movements of actomyosin drive formation of the Par domain in the worm zygote and F-actin is required for neuroblast apical Par polarity, no apically directed cortical actomyosin dynamics have been observed during the neuroblast polarization process, despite extensive examination (Barros et al., 2003; Cabernard et al., 2010; Connell et al., 2011; Koe et al., 2018; Roth et al., 2015; Roubinet et al., 2017; Tsankova et al., 2017). Instead, both F-actin and myosin II have been reported to be cytoplasmic or uniformly cortical in interphase, and apically enriched at metaphase (Barros et al., 2003; Koe et al., 2018; Tsankova et al., 2017), before undergoing cortical flows toward the cleavage furrow that are important for cell size asymmetry (Cabernard et al., 2010; Connell et al., 2011; Roubinet et al., 2017).
The current model for neuroblast actomyosin dynamics is primarily based on the analysis of fixed cells or by imaging a small number of medial sections in live imaging experiments and we recently found that rapid imaging of the full neuroblast volume can reveal dynamic phases of movement that are not detected with other methods (LaFoya and Prehoda, 2021; Oon and Prehoda, 2019). Here, we use rapid full volume imaging to investigate whether cortical actomyosin dynamics are present in neuroblasts when the Par complex undergoes its polarity cycle.
Results and discussion
Cortical actin dynamics during the neuroblast polarity cycle
We imaged larval brain neuroblasts expressing an mRuby fusion of the actin sensor LifeAct (mRuby-LA) using spinning disk confocal microscopy. The localization of this sensor in neuroblasts has been reported (Abeysundara et al., 2018; Roubinet et al., 2017), but only during late mitosis. To follow cortical actin dynamics across full asymmetric division cycles, we collected optical sections through the entire neuroblast volume (~40 0.5 µm sections) at 10 s intervals beginning in interphase and through at least one mitosis (Figure 1—figure supplement 1). Maximum intensity projections constructed from these data revealed localized actin enrichments on the cortex, some of which were highly dynamic (Figure 1 and Video 1). We observed three discrete phases of cortical actin dynamics that preceded the previously characterized basally directed flows that occur in late anaphase (Roubinet et al., 2017).

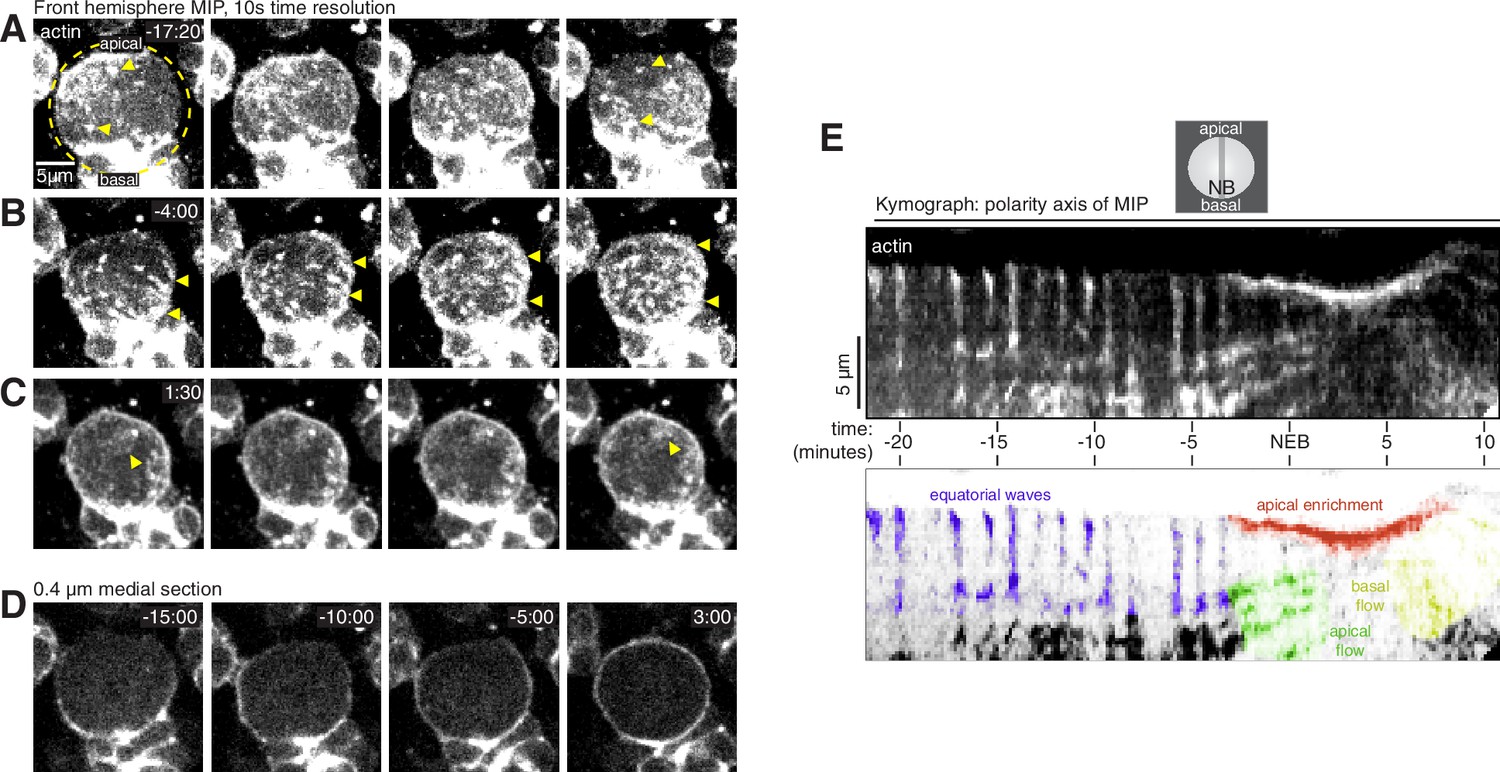
Cortical F-actin dynamics in asymmetrically dividing Drosophila larval brain neuroblasts.
(A) Selected frames from Video 1 showing cortical actin pulses during interphase. mRuby-LifeAct expressed via insc-GAL4/UAS (“actin”) is shown via a maximum intensity projection (MIP) constructed from optical sections through the front hemisphere of the cell. The outline of the neuroblast is shown by a dashed yellow circle. In this example, the pulse moves from the upper left of the cell to the lower right. Arrowheads mark several cortical actin patches. Time (mm:ss) is relative to nuclear envelope breakdown. (B) Selected frames from Video 1 as in panel A showing cortical actin moving apically. Arrowheads delineate apical and basal extent of dynamic actin. (C) Selected frames from Video 1 as in panel A showing cortical actin enriched on the apical cortex. (D) Selected frames from Video 1 showing how actin becomes cortically enriched near nuclear envelope breakdown (NEB). A single 0.4 µM medial section of the cortical actin signal is relatively discontinuous before NEB, with areas of very low actin signal, but becomes more evenly distributed as the cell rounds in mitosis (3:00 time point). (E) Kymograph constructed from frames of Video 1 using sections along the apical-basal axis as indicated (NB, neuroblast). A legend with the features in the kymograph depicting the cortical dynamic phases and apical enrichment of actin is included below.
Actin dynamics in a larval brain neuroblast.
The mRuby-Lifeact sensor expressed from the UAS promoter and insc-GAL4 (expressed in neuroblasts and their progeny) is shown with a maximum intensity projection of the front hemisphere of the cell.
The interphase neuroblast cortex was a mixture of patches of concentrated actin, highly dynamic pulsatile waves that traveled across the entire width of the cell, and areas with little to no detectable actin (Figure 1 and Video 1). Pulsatile movements consisted of irregular patches of actin forming on the cortex and rapidly moving across the surface before disappearing (Figure 1A and E). Concentrated actin patches were relatively static, but sometimes changed size over the course of several minutes. Static patches were mostly unaffected by the pulsatile waves that occasionally passed over them (Figure 1A). Pulses were sporadic in early interphase but became more regular near mitosis, with a new pulse appearing immediately following the completion of the prior one (Figure 1E and Video 1). The direction of the pulses during interphase was highly variable, but often along the cell’s equator (i.e. orthogonal to the polarity/division axis). In general, actin in the interphase cortex was highly discontinuous and included large areas with little to no detectable actin in addition to the patches and dynamic pulses described above (Figure 1D and Video 1). Interphase pulses were correlated with cellular scale morphological deformations in which these areas of low actin signal were displaced away from the cell center while the cortex containing the actin pulse was compressed toward the center of the cell (Figure 1D and Video 1).
Near nuclear envelope breakdown (NEB), the static cortical actin patches began disappearing from the cortex while dynamic cortical actin reoriented toward the apical pole (Figure 1 and Video 1). In contrast to the sporadic and relatively unoriented interphase pulses observed earlier in the cell cycle, the apically directed cortical actin dynamics that began near NEB were highly regular and were apically-directed (Figure 1E and Video 1). This phase of cortical actin dynamics continued until anaphase–consistent with previous descriptions of actin accumulation at the apical cortex throughout metaphase (Barros et al., 2003; Tsankova et al., 2017). Additionally, while the interphase cortex had areas with very little actin, actin was more evenly-distributed following the transition, as was apparent in medial sections (e.g. comparing –15:00 and 3:00 in Figure 1D and Video 1).
Another transition in cortical actin dynamics occurred shortly after anaphase onset when the apically directed cortical actin movements rapidly reversed direction such that the F-actin that had accumulated in the apical hemisphere began to move basally toward the emerging cleavage furrow (Figure 1E and Video 1). The basally directed phase of movement that begins shortly after anaphase onset and includes both actin and myosin II was reported previously (Barros et al., 2003; Roubinet et al., 2017; Tsankova et al., 2017).
Cortical actin and aPKC dynamics are coupled
Previously, we showed that Par polarity proteins undergo complex cortical dynamics during neuroblast asymmetric cell division and that polarity cycle movements require an intact actin cytoskeleton (Oon and Prehoda, 2019). Here, we have found that the cortical actin cytoskeleton is also highly dynamic at points in the cell cycle when Par proteins undergo coordinated cortical movement (Figure 1 and Video 1). Furthermore, the transitions in cortical actin dynamic phases appeared to occur when similar transitions take place in the polarity cycle. We examined the extent to which cortical actin and aPKC dynamics are correlated by simultaneously imaging GFP-aPKC expressed from its endogenous promoter with mRuby-Lifeact (Figure 2 and Video 2). Apical targeting of aPKC began approximately ten minutes before NEB, when small, discontinuous aPKC foci began to appear, as previously reported (Oon and Prehoda, 2019). The interphase pulses of actin had no noticeable effect on these aPKC enrichments, suggesting that at this stage of the cell cycle, cortical actin dynamics are not coupled to aPKC movement (Figure 1C).

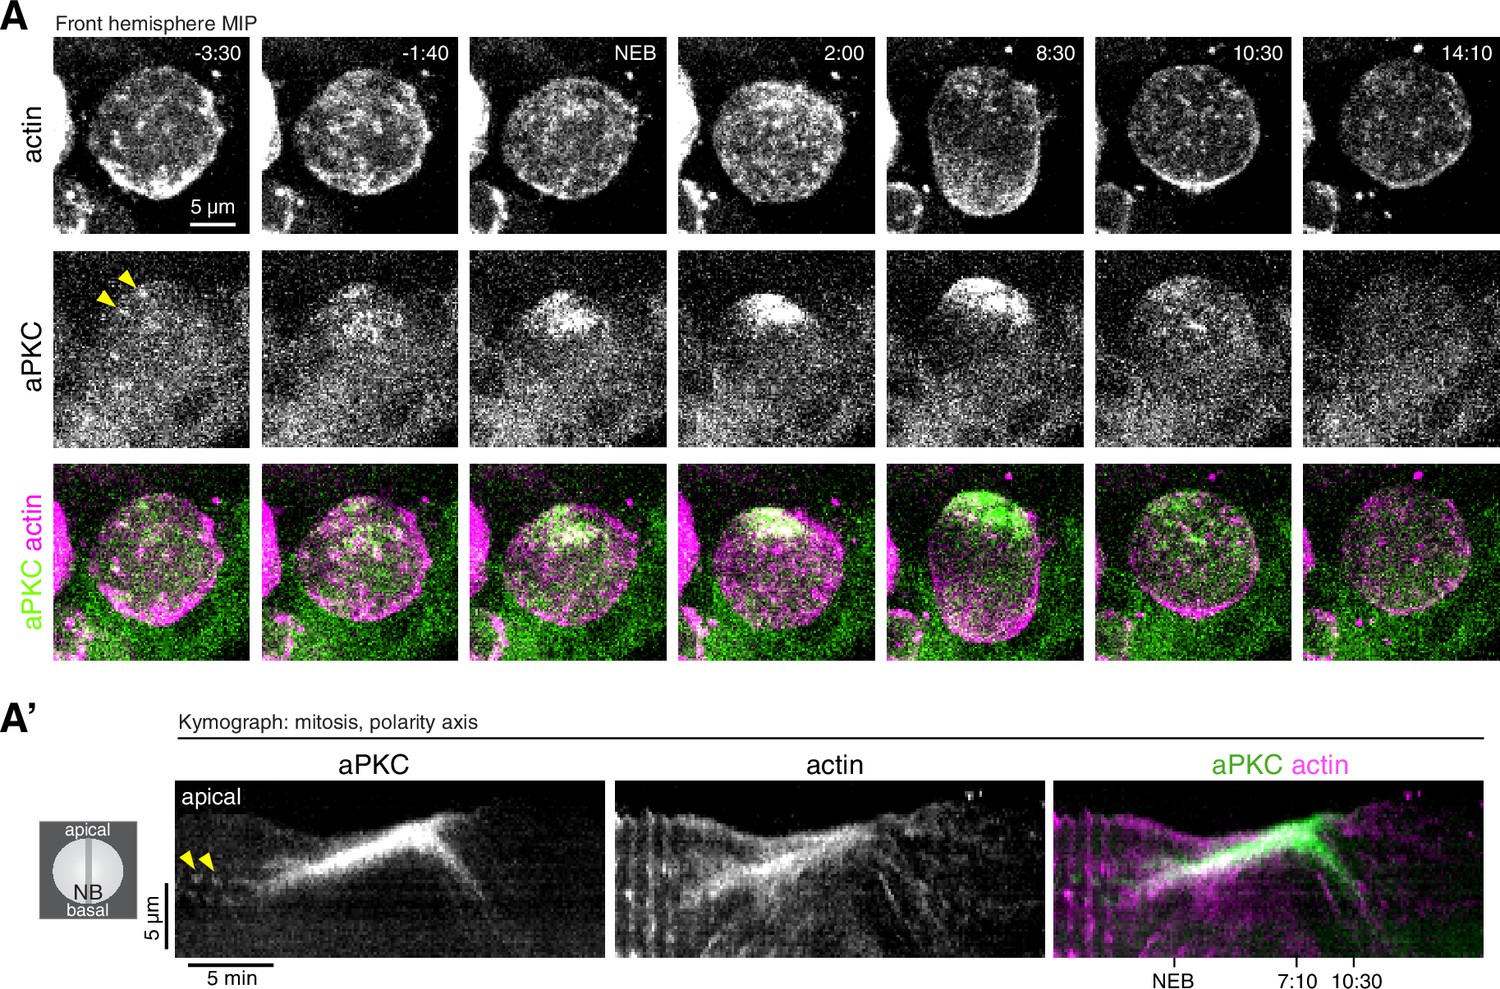
Coordinated actin and aPKC dynamics during the neuroblast polarity cycle.
Correlated dynamics of the Par protein aPKC and actin in a larval brain neuroblast.
GFP-aPKC expressed from its endogenous promoter and the mRuby-Lifeact sensor expressed from the UAS promoter and insc-GAL4 (drives expression in neuroblasts and progeny) are shown from simultaneously acquired optical sections with a maximum intensity projection of the front hemisphere of the cell.
While cortical actin and aPKC did not appear to be coupled during interphase, the two protein’s movements were highly correlated beginning in early mitosis (Figure 2 and Video 2). When cortical actin began flowing apically, the sparsely distributed aPKC patches that had accumulated on the cortex also began moving toward the apical pole. The transition to apically directed movement was nearly simultaneous for both proteins, although actin’s apical movement began slightly before aPKC’s (actin: 1.9 ± 1.0 min prior to NEB; aPKC: 1.3 ± 1.1 min; n = 13 neuroblasts with movies in Figure 2—video 1). Furthermore, while aPKC and actin both moved toward the apical cortex, actin dynamics occurred over the entire cortex whereas aPKC movements were limited to the apical hemisphere consistent with its specific targeting to this area (Figure 2 and Video 2). The continuous apical movements resulted in the concentration of both aPKC and actin at the apical pole. Interestingly, however, once aPKC was collected near the pole into an apical cap, it appeared to be static while cortical actin continued flowing apically. This phase of dynamic, apically directed actin with an apparently static aPKC apical cap continued for several minutes (e.g. until approximately 7:10 in Video 2). At this point actin and aPKC movements reversed, moving simultaneously toward the basal pole and the emerging cleavage furrow (Figure 2 and Video 2). We conclude that cortical actin and aPKC dynamics become highly correlated after interphase actin pulses transition to sustained, apically directed movements.
The correlation between actin and aPKC dynamics is consistent with our previous finding that depolymerization of actin with LatrunculinA (LatA) inhibits aPKC’s apically directed cortical movements (Oon and Prehoda, 2019). We further examined the relationship between F-actin dynamics and aPKC using low doses of Cytochalasin D (CytoD) that inhibit actin dynamics but maintain cortical structure (An et al., 2017; Mason et al., 2013). The apically directed movements of actin during early mitosis were inhibited by CytoD with the cortex rapidly becoming relatively static (Figure 3A and A’ and Figure 3—video 1). The loss of actin dynamics was immediately followed by cessation of apically directed aPKC movement such that it failed to form an apical cap (n = 11; neuroblasts shown in Figure 3—video 2). While both LatA and CytoD inhibited aPKC coalescence into an apical cap, we noticed that aPKC was maintained in the apical hemisphere for a longer period in CytoD-treated neuroblasts (Figure 3B–D, Figure 3—video 3, Figure 3—video 4, and neuroblasts used for measurements in Figure 3—video 5). Some localized enrichments remained in the apical hemisphere in neuroblasts treated with either drug, possibly due to their association with localized membrane enrichments, as recently reported (LaFoya and Prehoda, 2021). However, aPKC signal entered the basal hemisphere more rapidly in LatA- versus CytoD-treated neuroblasts (Figure 3D). Thus, aPKC appears to be better maintained in its polarized state when the cortical actin cytoskeleton remains intact (CytoD) compared to when it is completely depolymerized (LatA). We conclude that the cortical dynamics that drive the formation of the aPKC apical cap require the apically directed phase of actin dynamics that occurs during late prophase and metaphase. Furthermore, cortical actin structure may prolong the aPKC polarized state by slowing its diffusion into the basal hemisphere.

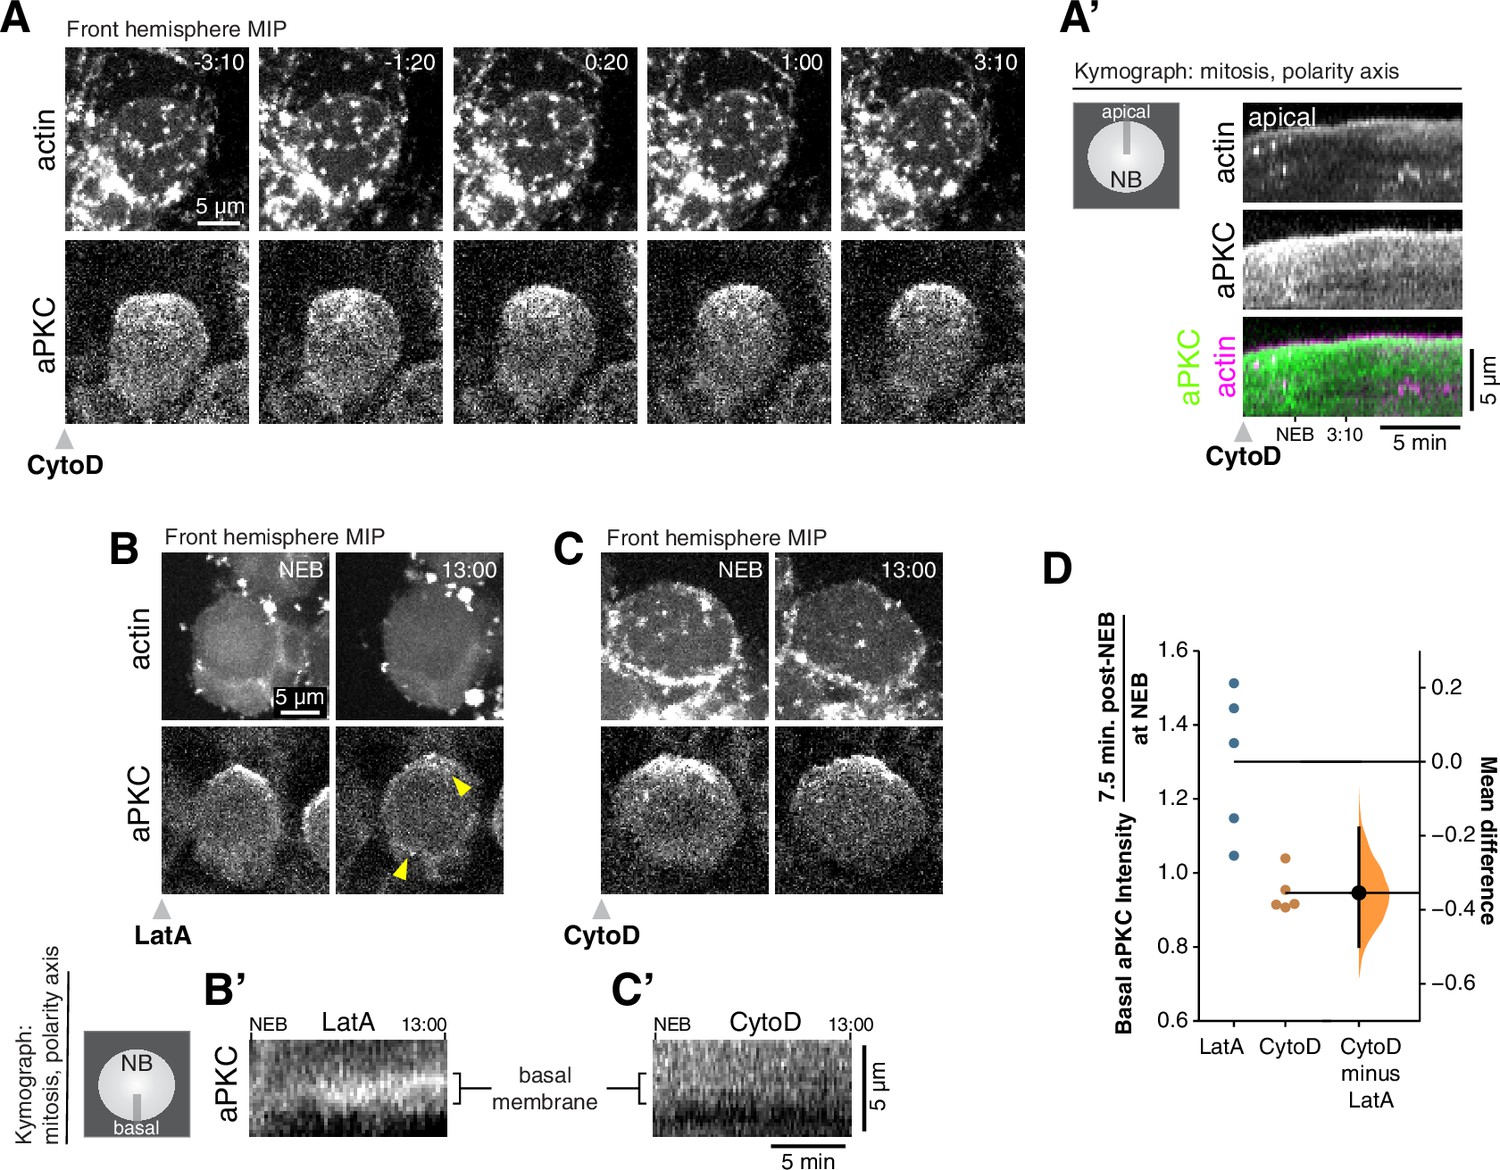
Cortical F-actin is required for aPKC coalescence and polarity maintenance.
(A) Disruption of cortical F-actin dynamics using a low dosage (50 µM) of cytochalasin D (CytoD) causes immediate cessation of aPKC cortical movement. Selected frames from Figure 3—video 1 showing the inhibition of actin dynamics and accompanying loss of apically-directed aPKC movements. aPKC-GFP expressed from its endogenous promoter (‘aPKC’) and mRuby-LifeAct expressed via insc-GAL4/UAS (‘actin’) are shown via a maximum intensity projection (MIP) constructed from optical sections through the front hemisphere of the cell. (A’) Kymograph made from Figure 3—video 1 using a section of each frame along the apical-basal axis, as indicated. (B) Selected frames from Figure 3—video 3 showing significant entry of aPKC into the basal hemisphere (i.e. depolarization) following LatA treatment. Upper arrowhead highlights a localized enrichment of aPKC that is retained in the apical region. Lower arrowhead highlights increased aPKC in basal hemisphere. (B’) Kymograph made from Figure 3—video 3 using a section of each frame along the basal membrane near the cell’s equator as indicated. (C) Selected frames from Figure 3—video 4 showing the maintenance of aPKC polarization following CytoD treatment. (C’) Kymograph made from Figure 3—video 4 using a section of each frame along the basal membrane as indicated. (D) Gardner-Altman estimation plot of the fold increase in basal aPKC membrane signal following Latrunculin A (LatA) and CytoD treatments. The ratio of aPKC membrane signal on the basal membrane shortly after NEB to that at NEB is shown for individual LatA- and CytoD-treated neuroblasts (shown in Figure 3—video 5), along with the difference in means of the measurements. Statistics: bootstrap 95 % confidence interval (bar in ‘CytoD minus LatA’ column shown with bootstrap resampling distribution).
Correlated phases of cortical myosin II and actin dynamics
The morphological changes in interphase cells (Figure 1D and Video 1) and cortical aPKC movements that were correlated with cortical actin dynamics in early mitosis (Figure 2 and Video 2), are consistent with a force generating process. While actin can generate force directly through polymerization, contractile forces are generated by the combined activity of F-actin and myosin II (i.e. actomyosin), and cortical pulsatile contractions of actomyosin have been observed in many other systems (Vicker, 2000; Munro et al., 2004; Michaux et al., 2018). The localization of myosin II in neuroblasts has been described as uniformly cortical or cytoplasmic in interphase and before metaphase in mitosis (Barros et al., 2003; Tsankova et al., 2017; Koe et al., 2018). We used rapid imaging of the full cell volume, simultaneously following a GFP fusion of the myosin II regulatory light chain Spaghetti squash (GFP-Sqh) with mRuby-Lifeact, to determine if myosin II dynamics share any of the cortical dynamic phases we observed for actin. For each phase of actin dynamics, we found that myosin II is localized to the cortex in a similar pattern (Figure 4 and Video 3), including during the apically directed continuous movements that polarize aPKC. Interestingly, however, the localization between the two was not absolute and there were often large cortical regions where the two did not colocalize in addition to the region where they overlapped (Figure 4 and Video 3). A similar pattern of overlapping cortical actin and myosin II localization has been reported in the polarizing worm zygote (Reymann et al., 2016; Michaux et al., 2018). Given the similarities in behavior of actin and myosin II, we conclude that the phases of cortical actin dynamics that occur during neuroblast asymmetric cell division include both actin and myosin II.

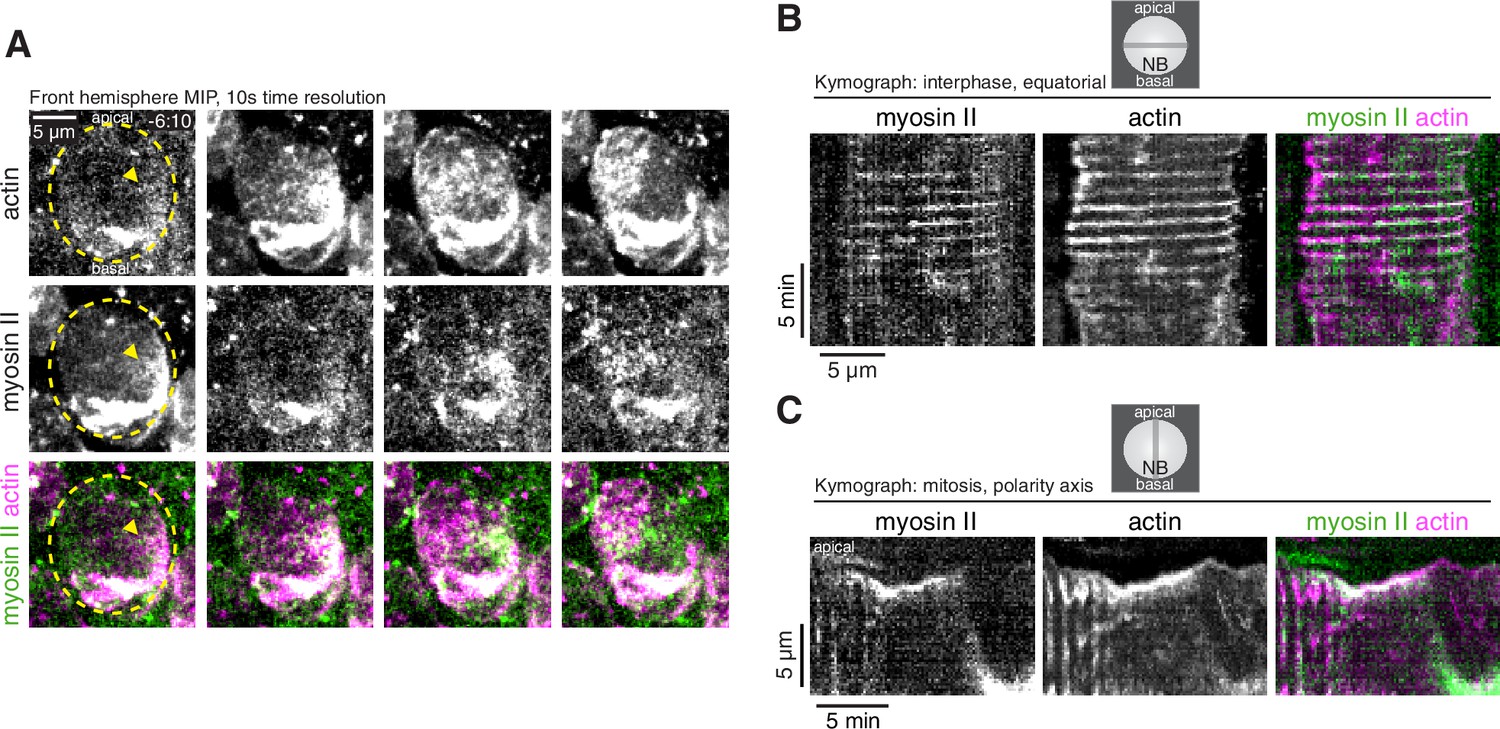
Dynamics of cortical actomyosin in asymmetrically dividing Drosophila larval brain neuroblasts.
(A) Selected frames from Video 3 showing cortical actomyosin dynamics. GFP-Sqh expressed from its endogenous promoter (‘Myosin II’) and mRuby-LifeAct expressed via worniu-GAL4/UAS (‘actin’) are shown via a maximum intensity projection (MIP) constructed from optical sections through the front hemisphere of the cell. The outline of the neuroblast is shown by a dashed yellow line and arrowheads indicate the starting position of the cortical patches. Time is relative to nuclear envelope breakdown. (B) Kymograph constructed from frames of Video 3 during interphase using sections through the equatorial region of the cell as indicated. (C) Kymograph constructed from frames of Video 3 during mitosis using sections along the polarity axis of the cell as indicated.
Correlated dynamics of myosin II and actin in a larval brain neuroblast.
GFP-Sqh (the myosin II regulatory light chain, Spaghetti squash) expressed from its endogenous promoter and the mRuby-Lifeact sensor expressed from the UAS promoter and worniu-GAL4 (expressed in neuroblasts and their progeny) are shown from simultaneously acquired optical sections with a maximum intensity projection of the front hemisphere of the cell and the medial optical section. The neuroblast is highlighted by a dashed circle.
Phases of cortical actomyosin dynamics coupled to neuroblast polarization, maintenance, and depolarization
Our results reveal previously unrecognized phases of cortical actomyosin dynamics during neuroblast asymmetric division, several of which coincide with the neuroblast’s cortical polarity cycle (Figure 5). During interphase, transient cortical patches of actomyosin undergo highly dynamic movements in which they rapidly traverse the cell cortex, predominantly along the cell’s equator, before dissipating and beginning a new cycle (Figure 1A). Shortly after mitotic entry the movements become more continuous and aligned with the polarity axis (orthogonal to the equatorial interphase pulses). The transition to apically directed cortical actin movements occurs shortly before the establishment of apical Par polarity, when discrete cortical patches of aPKC undergo coordinated movements toward the apical pole to form an apical cap. Importantly, cortical actin dynamics are required for aPKC to coalesce into an apical cap (Figure 3A and Figure 3—video 1). Apically directed actin dynamics continue beyond metaphase when apical aPKC cap assembly is completed (Figure 2), suggesting that actomyosin dynamics may also be involved in cap maintenance. A role for actomyosin in aPKC cap assembly and maintenance is supported by the lack of coalescence when the actin cytoskeleton is completely depolymerized (Oon and Prehoda, 2019), or when actin dynamics are inhibited but the cytoskeleton is left intact (Figure 3B and B’). The cycle of cortical actomyosin dynamics is completed when the movement abruptly changes direction at anaphase leading to the cleavage furrow-directed flows that have been previously characterized (Barros et al., 2003; Roubinet et al., 2017). While we have examined the relationship between actomyosin dynamics and cortical protein polarity, we note that a neuroblast membrane polarity cycle was recently discovered and found to require the actin cytoskeleton (LaFoya and Prehoda, 2021). The mechanical phases of the membrane polarity cycle may be related to the phases of cortical actomyosin dynamics we report here.

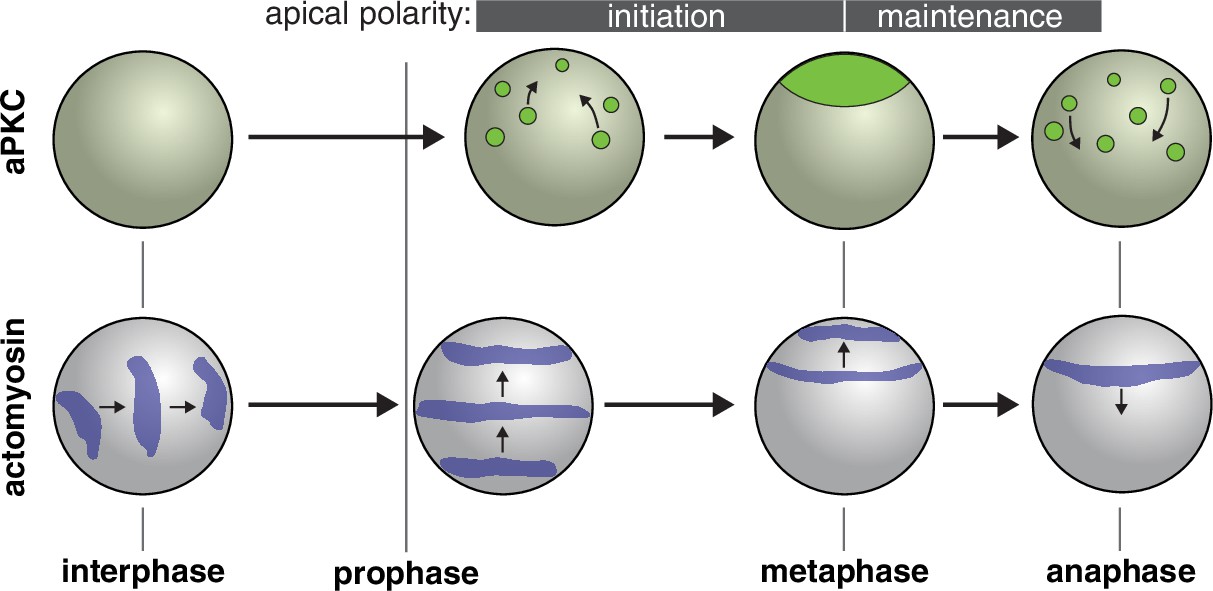
Model for role of actomyosin in neuroblast Par polarity.
During interphase when aPKC is cytoplasmic, actomyosin pulsatile contractions are predominantly equatorial. During apical polarity initiation in prophase and shortly before when discrete aPKC cortical patches begin to coalesce, actomyosin transitions to more continuous movements directed toward the apical cortex. At anaphase apical actomyosin is cleared as it flows toward the cleavage furrow while the aPKC cap is disassembled.
While cortical actomyosin dynamics had not been reported during neuroblast polarization, myosin II pulses have been observed in delaminating neuroblasts from the Drosophila embryonic neuroectoderm (An et al., 2017; Simões et al., 2017). The actomyosin dynamics reported here may be related to those that occur during delamination and provide a framework for understanding how actomyosin participates in neuroblast apical polarity. First, apically directed movements of actomyosin are consistent with the requirement for F-actin in the coalescence of discrete aPKC patches into an apical cap (Figure 3; Oon and Prehoda, 2019). How might cortical actomyosin dynamics induce aPKC coalescence and maintenance? In the worm zygote, pulsatile contractions generate bulk cortical flows (i.e. advection) that lead to non-specific transport of cortically localized components (Goehring et al., 2011; Illukkumbura et al., 2020). Whether the cortical motions of polarity proteins that occur during the neuroblast polarity cycle are also driven by advection will require further study.
The more rapid depolarization of aPKC in Lat- compared to CytoD-treated neuroblasts (Figure 3B–D), is also consistent with a potentially passive role for the actin cytoskeleton in polarity maintenance. Complete loss of the cortical actin cytoskeleton (LatA; Figure 3B) leads to more rapid entry of aPKC into the basal neuroblast membrane compared to when cortical actin dynamics is inhibited but the structure maintained (CytoD; Figure 3C). The difference could arise simply from an increase in cortical diffusion constant when the cortical actin mesh is removed. In this case, the actin cytoskeleton would participate in Par polarity via at least two mechanisms: by generating non-diffusive movements of polarity proteins through actomyosin-generated cortical flows (Figures 2 and 3), and by maintaining the polarized state by slowing the rate of diffusion (Figure 3).
Materials and methods
Reagent type (species) or resource | Designation | Source or reference | Identifiers | Additional information |
---|---|---|---|---|
Genetic reagent (Drosophila melanogaster) | Lifeact-Ruby | Bloomington Drosophila Stock Center | BDSC:35545; FLYB:FBti0143328; RRID:BDSC_35545 | FlyBase symbol: P{UAS-Lifeact-Ruby}VIE-19A |
Genetic reagent (D. melanogaster) | insc-Gal4 | Chris Doe Lab; Bloomington Drosophila Stock Center | BDSC:8751; FLYB:FBti0148948; RRID:BDSC_8751 | FlyBase symbol: P{GawB}inscMz1407 |
Genetic reagent (D. melanogaster) | aPKC-GFP | François Schweisguth Lab; Besson et al., 2015 | BAC encoded aPKC-GFP | |
Genetic reagent (D. melanogaster) | wor-Gal4 | Chris Doe Lab; Bloomington Drosophila Stock Center | BDSC:56553; FLYB:FBti0161165; RRID:BDSC_56553 | FlyBase symbol: P{wor.GAL4.A}2 |
Genetic reagent (D. melanogaster) | Sqh-GFP | Royou et al., 2002 | Expressed by natural sqh promoter | |
Chemical compound, drug | Latrunculin A | Sigma-Aldrich | Sigma-Aldrich: L5163 | (50 µM) |
Chemical compound, drug | Cytochalasin D | Enzo Life Sciences | Enzo Life Sciences: BML-T109-0001 | (50 µM) |
Fly strains and genetics
Request a detailed protocolUAS-Lifeact-Ruby (Bloomington stock 35545), BAC-encoded aPKC-GFP (Besson et al., 2015) and Sqh-GFP (Royou et al., 2002) transgenes were used to assess F-actin, aPKC and myosin II dynamics, respectively. Expression of Lifeact was specifically driven in nerve cells upon crossing UAS-Lifeact-Ruby to insc-Gal4 (1407-Gal4, Bloomington stock 8751) or to worniu-Gal4 (Bloomington stock 56553). The following genotypes were examined through dual channel live imaging: BAC-aPKC-GFP / Y; insc-Gal4, +/+, UAS-Lifeact-Ruby; and; worGal4, Sqh-GFP, +/+, UAS-Lifeact-Ruby.
Live imaging
Request a detailed protocolThird instar larvae were incubated in 30 ºC overnight (~12 hr) prior to imaging and were dissected to isolate the brain lobes and ventral nerve cord, which were placed in Schneider’s Insect media (SIM). Larval brain explants were placed in lysine-coated 35 mm cover slip dishes (WPI) containing modified minimal hemolymph-like solution (HL3.1). Explants were imaged on a Nikon Ti2 microscope equipped with a Nikon 60 × 1.2 NA Plan Apo VC water immersion objective, a Yokogawa CSU-W1 spinning disk, and two Photometrics Prime BSI Scientific CMOS cameras for simultaneous dual channel imaging. Explants expressing Lifeact-Ruby, and either aPKC-GFP or Sqh-GFP were illuminated with 488 nm and 561 nm laser light. Approximately 40 optical sections with step size of 0.5 µm were acquired throughout the neuroblast volume at time intervals of 10–15 s. For drug treatments, the culture media surrounding the explants were brought to final concentrations of 50 µM LatA (2 % DMSO) or 50 µM CytoD (0.5 % DMSO) at the start of the imaging session.
Image processing, analysis, and visualization
Request a detailed protocolMovies were analyzed using the ImageJ (via the FIJI distribution) and Imaris (Bitplane) software packages. To quantify transitions between cortical actin dynamic phases, we identified the frame when actin or aPKC began moving toward the apical pole persistently (for at least several minutes, unlike the interphase, pulsatile motions). Likewise, the start of basally directed actin flow was indicated by the initial frame when apical actin or aPKC moved persistently toward the basal hemisphere. To investigate the effects of LatA and CytoD on neuroblast cortical dynamics, we examined aPKC and actin signals in early prophase to first determine if actin dynamics had ceased (i.e. the drug had taken effect), which typically occurred within five minutes of treatment for both drugs. To measure the degree to which aPKC polarity was maintained, we quantified the basal intensity of aPKC (via a 3-µm-thick line scan) across the basal membrane of a single medial section at NEB and at 7.5 min after NEB. The fold change in basal intensity across time was calculated using the following equation, with the mean background intensity obtained from a featureless area outside the neuroblast:
Data availability
All data generated or analysed during this study are included in the manuscript and supporting files.
References
-
Moesin is involved in polarity maintenance and cortical remodeling during asymmetric cell divisionMolecular Biology of the Cell 29:419–434.https://doi.org/10.1091/mbc.E17-05-0294
-
Asymmetric cortical extension shifts cleavage furrow position in Drosophila neuroblastsMolecular Biology of the Cell 22:4220–4226.https://doi.org/10.1091/mbc.E11-02-0173
-
Drosophila neuroblasts: a model for stem cell biologyDevelopment 139:4297–4310.https://doi.org/10.1242/dev.080515
-
Patterning and polarization of cells by intracellular flowsCurrent Opinion in Cell Biology 62:123–134.https://doi.org/10.1016/j.ceb.2019.10.005
-
Excitable RhoA dynamics drive pulsed contractions in the early C. elegans embryoThe Journal of Cell Biology 217:4230–4252.https://doi.org/10.1083/jcb.201806161
-
Myosin II promotes the anisotropic loss of the apical domain during Drosophila neuroblast ingressionThe Journal of Cell Biology 216:1387–1404.https://doi.org/10.1083/jcb.201608038
-
Emerging mechanisms of asymmetric stem cell divisionThe Journal of Cell Biology 217:3785–3795.https://doi.org/10.1083/jcb.201807037
Decision letter
-
Yukiko M YamashitaReviewing Editor; Whitehead Institute/MIT, United States
-
Utpal BanerjeeSenior Editor; University of California, Los Angeles, United States
-
Yukiko M YamashitaReviewer; Whitehead Institute/MIT, United States
Our editorial process produces two outputs: (i) public reviews designed to be posted alongside the preprint for the benefit of readers; (ii) feedback on the manuscript for the authors, including requests for revisions, shown below. We also include an acceptance summary that explains what the editors found interesting or important about the work.
Decision letter after peer review:
[Editors’ note: the authors submitted for reconsideration following the decision after peer review. What follows is the decision letter after the first round of review.]
Thank you for submitting your work entitled "Myosin II pulsatile contractions during the polarization of Drosophila neuroblasts" for consideration by eLife. Your article has been reviewed by 3 peer reviewers, including Yukiko M Yamashita as the Reviewing Editor and Reviewer #1, and the evaluation has been overseen by a Senior Editor.
Our decision has been reached after consultation between the reviewers. Based on these discussions and the individual reviews below, we regret to inform you that your work will not be considered further for publication in eLife. Although eLife encourages recent updates to previous work, our reviewers did not feel that the additional data constitutes the essential increment to justify publication.
This manuscript by Oon and Prehoda follows up on their previous work on how Drosophila neuroblasts may be polarized in preparation of asymmetric cell division. Now, by analyzing a probe for myosin, they show that neuroblasts undergo pulsatile contraction to achieve cell polarization. Although the reviewers appreciated the progress, they also felt that the study would require more in-depth analysis to warrant publication in eLife. Even for Research Advance format, of which contribution is expected to build upon a previous eLife paper, the reviewers felt that need of deeper, mechanistic analysis.
Reviewer #1:
This manuscript by Oon and Prehoda follows up on their previous work on how Drosophila neuroblasts may be polarized in preparation of asymmetric cell division. Now, by improving their live imaging conditions, they show that neuroblasts undergo pulsatile contraction to achieve cell polarization. This is reminiscent of C. elegans zygotes, unifying the known requirement of the same/similar set of genes between these two systems and the cell biological processes. Overall, this is a well-conceived, and well-executed work providing important insights into how Par system regulates cell polarity through the regulation of Myosin-dependent contractile system.
Their description about Myosin II's dynamic localization/ pulsatile movement is convincing. Unfortunately, due to photosensitivity, the were not able to image aPKC. I understand that this is a technical limitation difficult to overcome but drawing a conclusion about a relationship between Myosin II and aPKC purely based on previous studies, which had missed interesting aspects of Myosin movement, seems to be go beyond what can/should be extrapolated. If simultaneous imaging is not possible, at least can they conduct live imaging of aPKC only? Or any other 'apical' proteins (such as Baz, Par6) can be visualized simultaneously as Myosin II? Alternatively, now that their live imaging revealed the importance of imaging the full volume of the neuroblast, co-staining of fixed samples for aPKC and Myosin (combined with full volume imaging) might reveal additional spatial relationship between aPKC and Myosin during the phase of pulsatile movement? I feel that correlating Myosin II behavior with polarity complex is critically important for this manuscript to have a significant contribution to the field.
Reviewer #2:
In this manuscript, Oon and Prehoda used live-imaging technique to describe pulsatile dynamics of cortical myosin II during neuroblast asymmetric division and its linkage to the initiation and maintenance of apical Par polarity. While the dynamics described is novel to the field, the evidence provided on its causative relationship to the initiation and maintenance of apical Par polarity is weak and lacks convincing proofs. The reviewer suggests more experimental efforts be directed at strengthening the afore mentioned causative relationship.
In conclusion, it is in the view of the reviewer that the results in the manuscript are descriptive in nature and lacks mechanistic insights. Given the amount of the experiments required, the reviewer would not suggest that the manuscript be accepted for further evaluation.
List of suggested experiments:
– While the timing of apical cortical recruitment of aPKC has been described by the authors in their previous paper (Oon CH & Prehoda KE, eLife 2019) and analyzed in supplementary Figure 1D, it was under the wild-type condition, i.e. no GFP-Sqh overexpression. It will be prudent to revisit the aPKC recruitment dynamics under the condition of Sqh overexpression as the aPKC recruitment dynamics might differ.
– The causative relationship between myosin II and initiation and maintenance of apical polarity can be further strengthened via:
– Drug (i.e. blebbistatin, a myosin II inhibitor) treatment experiment to test whether the loss of myosin II activity will lead to delayed or distorted initiation and maintenance of apical polarity.
– Experiments using non-phosphorylatable and constitutive phosphorylated mutants of sqh, i.e. sqhA20A21 and sqhE20E21, respectively, to test whether these will lead to defect in initiation and maintenance of apical polarity.
– Test whether over-activating and under-activating myosin II activity via overexpressing myosin light chain kinase (MLCK) and myosin light chain phosphatase (MLCP) would affect apical polarity.
– Test for null allele of sqh, i.e. sqhAX3, in MARCM clones and investigate its effect on aPKC recruitment dynamics.
– Test for the role of upstream regulator of sqh, i.e. ROCK, in its downstream effect on aPKC recruitment dynamics.
– Test for drug inhibitor of ROCK, i.e. Y27632 compound, in is effect on aPKC recruitment dynamics.
– Test for under aPKC RNAi and mutant background whether GFP-Sqh dynamics is still the same, to further strengthen the argument the causative effect between GFP-Sqh and aPKC dynamics.
Reviewer #3:
This paper describes the high-resolution, live behavior of myosin-GFP as a Drosophila neuroblast undergoes asymmetric division. The data are analyzed in several ways for a detailed, high-quality description of myosin localization and dynamics during the polarization process. Because this is the only new data presented in the paper, the paper is very limited in scope. The data are also not surprisingly given the authors 2019 eLife publication about actin dynamics in this system, and other related papers. The paper is descriptive and confirmatory, and would be better suited for PLoS One or microPublication.
[Editors’ note: further revisions were suggested prior to acceptance, as described below.]
Thank you for submitting your article "Pulsatile actomyosin contractions underlie Par polarity during the neuroblast polarity cycle" for consideration by eLife. Your article has been reviewed by 3 peer reviewers, including Yukiko M Yamashita as the Reviewing Editor and Reviewer #1, and the evaluation has been overseen by Utpal Banerjee as the Senior Editor.
The reviewers have discussed their reviews with one another, and the Reviewing Editor has drafted this to help you prepare a revised submission.
Essential revisions:
– The pulsatile nature of broad F-actin networks is evident during interphase, but these pulsations substantially subside upon entry into mitosis, and at this stage an apically directed flow of F-actin is the main behavior evident. This transition from pulses to flow is evident in both the movies and the kymographs of the F-actin probe. However, the authors state that the pulsations continue at the onset of mitosis and as the apical cap of aPKC matures. It is unclear whether the apical flow of aPKC and F-actin is associated with small-scale defined F-actin pulses, or small-scale random fluctuations of F-actin. The F-actin flow alone is an informative finding. The authors should consider revising their descriptions of these data (including in the manuscript title), or provide clearer examples of defined F-actin pulsations during the stage when aPKC polarizes.
– It would strengthen the paper considerably if the authors can show the causal link between actomyosin pulses and Par polarity by other experiments, such as the use of low dose cytochalasin D treatment, as reported in Mason et al., Nature Cell Biology 2014 and An Y. et al., Development, 2017.
– There are two papers that described pulsatile behavior during apical constriction in the process of neuroblast delamination in embryonic development. Although these are not the same process as what is described in this paper, it is likely that some underlying mechanisms are shared, and mention and reasonable discussion on these findings in relation to the current manuscript must be included.
An Y, Xue G, Shaobo Y, Mingxi D, Zhou X, Yu W, Ishibashi T, Zhang L, Yan Y. Apical constriction is driven by a pulsatile apical myosin network in delaminating Drosophila neuroblasts. Development. 2017 Jun 15;144(12):2153-2164. doi: 10.1242/dev.150763. Epub 2017 May 15. PMID: 28506995.
Simões S, Oh Y, Wang MFZ, Fernandez-Gonzalez R, Tepass U. Myosin II promotes the anisotropic loss of the apical domain during Drosophila neuroblast ingression. J Cell Biol. 2017 May 1;216(5):1387-1404. doi: 10.1083/jcb.201608038. Epub 2017 Mar 31. PMID: 28363972; PMCID: PMC5412560.
– In Figure 3A, following LatA treatment, apical aPKC foci/patch could still be observed at 19:40, while in Figure 2, aPKC starts to depolarize at 10:30 (mm:ss) after NEB. This seems to suggest that LatA treatment delays the depolarization of aPKC, which contradicts the conclusion that "aPKC is recruited to the apical cortex but rapidly depolarizes (Figure 3A and A')". Similarly, aPKC patch was still seen at 15:00 (Figure 3C), whereas apical aPKC should be completely gone in wild type condition at this time point (Figure 1). Also, in line 134-136, "we see aPKC begins diffusing away from the apical immediately following the disappearance of the cortical actin signal (Figure 3C,C' and Figure 3-video 3)" is an overstatement. It is more appropriate to conclude that aPKC had a slower diffusion rate following actin disruption.
– No listings of sample sizes in the main text, methods, figures and figure legends, which must be included.
– On page 4, line 105-122 (corresponding to Figure 2), authors described their observations at various time points such as 0:30 (line 109), -2:30 (line 112), 3:50 (line 115), and 7:20 (line 117), however, there are no corresponding still images for these time-points in Figure 2. Please show them.
– Lack of labeling to point out where readers should focus on in Figure 1B makes reader difficult to understand.
– Lack of abbreviation of nuclear envelope breakdown, NEB, in the main text (line 84-85).
– Lack of labeling for concentrated actin patches in Figure 1A.
– It would be better for readers if NEB is labeled in Figure 3A', 3B', and 3C'.
– Lack of sufficient description on the difference of LatA treatment in this study and previous study they published in eLife (2019).
Reviewer #1:
Oon and Prehoda report pulsatile contraction of apical membrane in the process of Par protein polarization in Drosophila neuroblasts. This explains how/why actin filament was required to localize/polarize Par complex. Specifically, using spinning disc confocal microscopy with high temporal resolution, they found the directed actin movement toward the apical pole, which nicely correlates with concentration of aPKC. They also show that myosin II is involved in this pulsatile movement of actin filament. This very much resembles the observation in C. elegans embryos, and nicely unifies observations across systems. Although descriptive in nature, I think this is an important observation and indicates a universal mechanism by which cells are polarized. I think this is a well-executed study and warrants publication in eLife as research advance.
Reviewer #2:
Previously, Oon and Prehoda showed apically directed movement of aPKC clusters during polarization of the neuroblast prior to asymmetric cell division. They found that these movements required F-actin, but the distribution of F-actin has only been reported for later stages of neuroblast polarization and division. Here, the authors report pulses of cortical F-actin during interphase, followed by an apically directed flow at the onset of mitosis, a strong apical accumulation of F-actin at metaphase and anaphase, followed by fragmentation and basally directed flow of the fragments. aPKC clusters are shown to colocalize with the F-actin networks as they flow apically. The F-actin networks are also shown have partial colocalization with non-muscle myosin II, suggesting a possible mechanism for their movement. Finally, the authors solidify the results of actin inhibitor studies from their 2019 study by showing that reported effects on aPKC localization are preceded by F-actin loss as would be expected but was not previously shown. Overall, the Research Advance extends the past study by more directly showing the involvement of F-actin and myosin in the apical localization mechanism of aPKC, and by describing F-actin and myosin dynamics prior to this transition. The following concerns should be addressed.
1. The pulsatile nature of broad F-actin networks is evident during interphase, but these pulsations substantially subside upon entry into mitosis, and at this stage an apically directed flow of F-actin is the main behavior evident. This transition from pulses to flow is evident in both the movies and the kymographs of the F-actin probe. However, the authors state that the pulsations continue at the onset of mitosis and as the apical cap of aPKC matures. It is unclear whether the apical flow of aPKC and F-actin is associated with small-scale defined F-actin pulses, or small-scale random fluctuations of F-actin. The F-actin flow alone is an informative finding. The authors should consider revising their descriptions of these data (including in the manuscript title), or provide clearer examples of defined F-actin pulsations during the stage when aPKC polarizes.
2. I checked the main text, methods, figures and figure legends, but could not find listings of sample sizes. Thus, the reproducibility of the findings has not been reported.
Reviewer #3:
In this revised manuscript (Oon and Prehoda), the authors performed additional live-imaging experiments and recorded aPKC and actin dynamics simultaneously in larval neuroblasts. They also provide evidence that aPKC polarization is lost upon F-actin disruption by Latrunculin A treatment. These are great improvements. The pulsatile dynamics of actin and myosin II showed in the manuscript are compelling. Images presented in this manuscript are of high-quality and impressive.
However, the pulsatile apical myosin network in delaminating neuroblasts in Drosophila embryos was reported previously (An Y. et al., Development, 2017). This important and relevant paper should be cited in the introduction of the current manuscript. Therefore, the finding on the pulsatile actomyosin in larval brain neuroblasts reported in this manuscript is not a total novel discovery. Another major concern is that Lat-A did not specifically disrupt actomyosin pulsatile movements, as it generally disrupts the F-actin network. So these experiments only strengthened the link between the F-actin network and Par polarity (which was already demonstrated in Kono et al., 2019; Oon 22 and Prehoda, 2019). Low doses of Cytochalasin D are known to disrupt myosin pulses still allowing the assembly of the actomyosin network (Mason et al., Nature Cell Biology 2014). The author should treat neuroblasts with low doses of CytoD to only disrupt actomyosin pulses, not the entire F-actin network, and examine the effect on Par polarity. It is also worthwhile to knockdown sqh to disrupt apical pulsatile actin dynamics. Besides, most of the concerns previously raised by the reviewer were not addressed in the revised manuscript.
https://doi.org/10.7554/eLife.66574.sa1Author response
[Editors’ note: the authors resubmitted a revised version of the paper for consideration. What follows is the authors’ response to the first round of review.]
Reviewer #1:
This manuscript by Oon and Prehoda follows up on their previous work on how Drosophila neuroblasts may be polarized in preparation of asymmetric cell division. Now, by improving their live imaging conditions, they show that neuroblasts undergo pulsatile contraction to achieve cell polarization. This is reminiscent of C. elegans zygotes, unifying the known requirement of the same/similar set of genes between these two systems and the cell biological processes. Overall, this is a well-conceived, and well-executed work providing important insights into how Par system regulates cell polarity through the regulation of Myosin-dependent contractile system.
Their description about Myosin II's dynamic localization/ pulsatile movement is convincing. Unfortunately, due to photosensitivity, the were not able to image aPKC. I understand that this is a technical limitation difficult to overcome but drawing a conclusion about a relationship between Myosin II and aPKC purely based on previous studies, which had missed interesting aspects of Myosin movement, seems to be go beyond what can/should be extrapolated. If simultaneous imaging is not possible, at least can they conduct live imaging of aPKC only? Or any other 'apical' proteins (such as Baz, Par6) can be visualized simultaneously as Myosin II? Alternatively, now that their live imaging revealed the importance of imaging the full volume of the neuroblast, co-staining of fixed samples for aPKC and Myosin (combined with full volume imaging) might reveal additional spatial relationship between aPKC and Myosin during the phase of pulsatile movement? I feel that correlating Myosin II behavior with polarity complex is critically important for this manuscript to have a significant contribution to the field.
We thank the reviewer for the enthusiasm for our work and recognize that the data in the original submission was limited because of our inability to simultaneously image aPKC and the cytoskeleton. We have worked hard to overcome this limitation and the revised manuscript includes data (Video 2) in which aPKC and actin dynamics are followed simultaneously. As implied by the reviewer, these data represent the most compelling case for the correlated dynamics of Par proteins and the cytoskeleton. We hope the reviewer agrees that the revision has a more complete mechanistic connection to our original paper – the actin cytoskeleton is required for aPKC dynamics (both our original paper and the current Research Advance), and actin and Par dynamics are highly correlated (the current Research Advance).
Reviewer #2:
In this manuscript, Oon and Prehoda used live-imaging technique to describe pulsatile dynamics of cortical myosin II during neuroblast asymmetric division and its linkage to the initiation and maintenance of apical Par polarity. While the dynamics described is novel to the field, the evidence provided on its causative relationship to the initiation and maintenance of apical Par polarity is weak and lacks convincing proofs. The reviewer suggests more experimental efforts be directed at strengthening the afore mentioned causative relationship.
In conclusion, it is in the view of the reviewer that the results in the manuscript are descriptive in nature and lacks mechanistic insights. Given the amount of the experiments required, the reviewer would not suggest that the manuscript be accepted for further evaluation.
List of suggested experiments:
– While the timing of apical cortical recruitment of aPKC has been described by the authors in their previous paper (Oon CH & Prehoda KE, eLife 2019) and analyzed in supplementary Figure 1D, it was under the wild-type condition, i.e. no GFP-Sqh overexpression. It will be prudent to revisit the aPKC recruitment dynamics under the condition of Sqh overexpression as the aPKC recruitment dynamics might differ.
– The causative relationship between myosin II and initiation and maintenance of apical polarity can be further strengthened via:
– Drug (i.e. blebbistatin, a myosin II inhibitor) treatment experiment to test whether the loss of myosin II activity will lead to delayed or distorted initiation and maintenance of apical polarity.
– Experiments using non-phosphorylatable and constitutive phosphorylated mutants of sqh, i.e. sqhA20A21 and sqhE20E21, respectively, to test whether these will lead to defect in initiation and maintenance of apical polarity.
– Test whether over-activating and under-activating myosin II activity via overexpressing myosin light chain kinase (MLCK) and myosin light chain phosphatase (MLCP) would affect apical polarity.
– Test for null allele of sqh, i.e. sqhAX3, in MARCM clones and investigate its effect on aPKC recruitment dynamics.
– Test for the role of upstream regulator of sqh, i.e. ROCK, in its downstream effect on aPKC recruitment dynamics.
– Test for drug inhibitor of ROCK, i.e. Y27632 compound, in is effect on aPKC recruitment dynamics.
– Test for under aPKC RNAi and mutant background whether GFP-Sqh dynamics is still the same, to further strengthen the argument the causative effect between GFP-Sqh and aPKC dynamics.
We have recast the paper to focus on actin dynamics rather than myosin for two reasons. First, a focus on actin is most relevant to our original paper (which this Research Advance builds on) as that paper showed that the actin cytoskeleton is required for aPKC dynamics. Second, using the Lifeact actin sensor allowed us to obtain simultaneous imaging for aPKC and the actin cytoskeleton (Video 2) which shows the highly correlated dynamics of the two. Thus, the mechanistic connection to the first paper is very clear – the actin cytoskeleton is required for aPKC dynamics (both our original paper and the current Research Advance), and actin and Par dynamics are highly correlated (the current Research Advance). The myosin II dynamics from the first version of this Research Advance are still included in this revised version, but only to show that myosin II is a component of the cortical pulses we discovered.
Reviewer #3:
This paper describes the high-resolution, live behavior of myosin-GFP as a Drosophila neuroblast undergoes asymmetric division. The data are analyzed in several ways for a detailed, high-quality description of myosin localization and dynamics during the polarization process. Because this is the only new data presented in the paper, the paper is very limited in scope. The data are also not surprisingly given the authors 2019 eLife publication about actin dynamics in this system, and other related papers. The paper is descriptive and confirmatory, and would be better suited for PLoS One or microPublication.
eLife describes a Research Advance as “a short article that … build[s] on the original research paper in an important way.” By our estimation, our original submission satisfied this criteria but we recognize the reviewer’s objections. We have added significant new data to the revised paper most importantly including simultaneous imaging of aPKC and the actin cytoskeleton, clearly demonstrating their correlated dynamics. We believe this builds on our original paper, which had identified a requirement for the actin cytoskeleton in aPKC dynamics, by providing a role for actin in the polarity cycle.
The reviewer states that the data we report are “not surprising”. As the authors of the original paper, we were certainly surprised when we first observed pulsatile contractions of actomyosin in neuroblasts. For one thing, there are numerous reports of actin and myosin II dynamics in neuroblasts dating back to 2003 without any mention of these dynamics. Additionally, a very recent model for actomyosin’s role in neuroblast polarity (Hannaford et al. 2018 eLife) posits that it forms a static scaffold at the basal cortex. We respectfully disagree that the current neuroblast literature, including our 2019 paper, points clearly to the presence of actomyosin pulsatile contractions playing a role in apical polarization.
The reviewer states that the data we report are “descriptive and confirmatory”. While we do describe a previously unreported phenomenon, we disagree that this detracts from the impact of our work. This description provides mechanistic insight into the polarization process – we knew previously that the actin cytoskeleton was required but had no idea why. The current work fills this mechanistic gap. Since there is little to no explanation in the neuroblast literature for how the actin cytoskeleton contributes to apical polarity, we respectfully disagree that our results are confirmatory.
[Editors’ note: what follows is the authors’ response to the second round of review.]
Essential Revisions:
– The pulsatile nature of broad F-actin networks is evident during interphase, but these pulsations substantially subside upon entry into mitosis, and at this stage an apically directed flow of F-actin is the main behavior evident. This transition from pulses to flow is evident in both the movies and the kymographs of the F-actin probe. However, the authors state that the pulsations continue at the onset of mitosis and as the apical cap of aPKC matures. It is unclear whether the apical flow of aPKC and F-actin is associated with small-scale defined F-actin pulses, or small-scale random fluctuations of F-actin. The F-actin flow alone is an informative finding. The authors should consider revising their descriptions of these data (including in the manuscript title), or provide clearer examples of defined F-actin pulsations during the stage when aPKC polarizes.
The reviewers make an important point regarding the difference between actomyosin dynamics in interphase and mitotic neuroblasts. Whereas the interphase dynamics are more clearly pulsatile in the sense that they begin and end, the movements during mitosis appear to be more continuous. To account for this difference we have extensively revised our description throughout the manuscript (c.f. the paragraph beginning at line 84), and have also changed the
title.
– It would strengthen the paper considerably if the authors can show the causal link between actomyosin pulses and Par polarity by other experiments, such as the use of low dose cytochalasin D treatment, as reported in Mason et al., Nature Cell Biology 2014 and An Y. et al., Development, 2017.
We appreciate the suggestion to analyze the requirement for F-actin dynamics in aPKC coalescence in more detail and have added such an analysis to the revised manuscript. We determined the concentration of cytochalasin D that inhibited F-actin dynamics but did not ablate cortical F-actin (unlike our latrunculin A experiments in which cortical F-actin signal was undetectable following treatment). In neuroblasts treated with this concentration of the drug (50 µM CytoD), apically directed cortical flows of aPKC did not occur. In contrast to LatA treated neuroblasts, however, in which asymmetrically targeted aPKC rapidly depolarized (i.e. was not maintained), aPKC in cytoD-treated neuroblasts did not enter the basal hemisphere as rapidly (Figure 3D). These results support a model in which F-actin plays two roles in neuroblast polarization – an active role where actin dynamics are essential for apically directed cortical flows, and a more passive one in which the presence of cortical F-actin prevents depolarization (perhaps by slowing the rate of cortical diffusion).
– There are two papers that described pulsatile behavior during apical constriction in the process of neuroblast delamination in embryonic development. Although these are not the same process as what is described in this paper, it is likely that some underlying mechanisms are shared, and mention and reasonable discussion on these findings in relation to the current manuscript must be included.
An Y, Xue G, Shaobo Y, Mingxi D, Zhou X, Yu W, Ishibashi T, Zhang L, Yan Y. Apical constriction is driven by a pulsatile apical myosin network in delaminating Drosophila neuroblasts. Development. 2017 Jun 15;144(12):2153-2164. doi: 10.1242/dev.150763. Epub 2017 May 15. PMID: 28506995.
Simões S, Oh Y, Wang MFZ, Fernandez-Gonzalez R, Tepass U. Myosin II promotes the anisotropic loss of the apical domain during Drosophila neuroblast ingression. J Cell Biol. 2017 May 1;216(5):1387-1404. doi: 10.1083/jcb.201608038. Epub 2017 Mar 31. PMID: 28363972; PMCID: PMC5412560.
We agree with the reviewer that the processes described in these papers may be related to the phenomenon in our work and have gladly added a reference to them along with a short discussion of their possible relationship to our results.
– In Figure 3A, following LatA treatment, apical aPKC foci/patch could still be observed at 19:40, while in Figure 2, aPKC starts to depolarize at 10:30 (mm:ss) after NEB. This seems to suggest that LatA treatment delays the depolarization of aPKC, which contradicts the conclusion that "aPKC is recruited to the apical cortex but rapidly depolarizes (Figure 3A and A')". Similarly, aPKC patch was still seen at 15:00 (Figure 3C), whereas apical aPKC should be completely gone in wild type condition at this time point (Figure 1). Also, in line 134-136, "we see aPKC begins diffusing away from the apical immediately following the disappearance of the cortical actin signal (Figure 3C,C' and Figure 3-video 3)" is an overstatement. It is more appropriate to conclude that aPKC had a slower diffusion rate following actin disruption.
The reviewer is correct that the behavior of aPKC following LatA treatment is more nuanced than we had described in our original manuscript. While most aPKC does indeed rapidly dissipate upon LatA treatment, aPKC at localized enrichments or patches can persist. We have modified the text to explain this more clearly and included a quantification comparing the basal signal of aPKC shortly after treatment with LatA and CytoD. We have also included a citation to a recent paper from our lab suggesting that the LatA resistant regions are associated with polarized membrane domains.
– No listings of sample sizes in the main text, methods, figures and figure legends, which must be included.
We have included the sample size for each of the relevant experiments in the revised manuscript. Additionally, we have included the movies used for making measurements as figure videos (e.g. Figure 2-video 1 contains the 13 movies used to calculate when actin and aPKC began apical movement relative to NEB).
– On page 4, line 105-122 (corresponding to Figure 2), authors described their observations at various time points such as 0:30 (line 109), -2:30 (line 112), 3:50 (line 115), and 7:20 (line 117), however, there are no corresponding still images for these time-points in Figure 2. Please show them.
– Lack of labeling to point out where readers should focus on in Figure 1B makes reader difficult to understand.
– Lack of abbreviation of nuclear envelope breakdown, NEB, in the main text (line 84-85).
– Lack of labeling for concentrated actin patches in Figure 1A.
– It would be better for readers if NEB is labeled in Figure 3A', 3B', and 3C'.
We have remedied these items in the revised text and figures.
– Lack of sufficient description on the difference of LatA treatment in this study and previous study they published in eLife (2019).
We significantly changed this portion of the manuscript, adding the CytoD treatment to more specifically test the role of cortical actin dynamics in aPKC coalescence. The LatA-treated neuroblasts are only included in the revised manuscript to compare how quickly aPKC depolarizes relative to CytoD treatment.
https://doi.org/10.7554/eLife.66574.sa2Article and author information
Author details
Funding
National Institutes of Health (GM127092)
- Kenneth E Prehoda
The funders had no role in study design, data collection and interpretation, or the decision to submit the work for publication.
Senior Editor
- Utpal Banerjee, University of California, Los Angeles, United States
Reviewing Editor
- Yukiko M Yamashita, Whitehead Institute/MIT, United States
Reviewer
- Yukiko M Yamashita, Whitehead Institute/MIT, United States
Version history
- Preprint posted: January 15, 2021 (view preprint)
- Received: January 18, 2021
- Accepted: November 12, 2021
- Accepted Manuscript published: November 15, 2021 (version 1)
- Version of Record published: December 2, 2021 (version 2)
Copyright
© 2021, Oon and Prehoda
This article is distributed under the terms of the Creative Commons Attribution License, which permits unrestricted use and redistribution provided that the original author and source are credited.
Metrics
-
- 815
- Page views
-
- 143
- Downloads
-
- 6
- Citations
Article citation count generated by polling the highest count across the following sources: Crossref, PubMed Central, Scopus.
Download links
Downloads (link to download the article as PDF)
Open citations (links to open the citations from this article in various online reference manager services)
Cite this article (links to download the citations from this article in formats compatible with various reference manager tools)
Further reading
-
- Cell Biology
Cell spreading and migration play central roles in many physiological and pathophysiological processes. We have previously shown that MFN2 regulates the migration of human neutrophil-like cells via suppressing Rac activation. Here, we show that in mouse embryonic fibroblasts, MFN2 suppresses RhoA activation and supports cell polarization. After initial spreading, the wild-type cells polarize and migrate, whereas the Mfn2-/- cells maintain a circular shape. Increased cytosolic Ca2+ resulting from the loss of Mfn2 is directly responsible for this phenotype, which can be rescued by expressing an artificial tether to bring mitochondria and endoplasmic reticulum to close vicinity. Elevated cytosolic Ca2+ activates Ca2+/calmodulin-dependent protein kinase II, RhoA, and myosin light-chain kinase, causing an overactivation of nonmuscle myosin II, leading to a formation of a prominent F-actin ring at the cell periphery and increased cell contractility. The peripheral actin band alters cell physics and is dependent on substrate rigidity. Our results provide a novel molecular basis to understand how MFN2 regulates distinct signaling pathways in different cells and tissue environments, which is instrumental in understanding and treating MFN2-related diseases.
-
- Cell Biology
- Microbiology and Infectious Disease
Lateral partitioning of proteins and lipids shapes membrane function. In model membranes, partitioning can be influenced both by bilayer-intrinsic factors like molecular composition and by bilayer-extrinsic factors such as interactions with other membranes and solid supports. While cellular membranes can departition in response to bilayer-intrinsic or -extrinsic disruptions, the mechanisms by which they partition de novo are largely unknown. The plasma membrane of Mycobacterium smegmatis spatially and biochemically departitions in response to the fluidizing agent benzyl alcohol, then repartitions upon fluidizer washout. By screening for mutants that are sensitive to benzyl alcohol, we show that the bifunctional cell wall synthase PonA2 promotes membrane partitioning and cell growth during recovery from benzyl alcohol exposure. PonA2’s role in membrane repartitioning and regrowth depends solely on its conserved transglycosylase domain. Active cell wall polymerization promotes de novo membrane partitioning and the completed cell wall polymer helps to maintain membrane partitioning. Our work highlights the complexity of membrane–cell wall interactions and establishes a facile model system for departitioning and repartitioning cellular membranes.