Matriptase activation of Gq drives epithelial disruption and inflammation via RSK and DUOX
- Lee Kong Chian School of Medicine, Experimental Medicine Building, Yunnan Garden Campus, 59 Nanyang Drive, Nanyang Technological University, Singapore
- Institute of Molecular and Cell Biology (IMCB), A*STAR (Agency for Science, Technology and Research), Singapore
- Division of Cell Matrix Biology and Regenerative Medicine, School of Biological Sciences, Faculty of Biology, Medicine and Health, University of Manchester, United Kingdom
- Department of Molecular Biology and Biotechnology, University of Sheffield, United Kingdom
- Department of Biological Sciences, National University of Singapore, Singapore
- Department of Pediatrics, Yong Loo Ling School of Medicine, National University of Singapore, Singapore
Figures
Figure 1 with 1 supplement
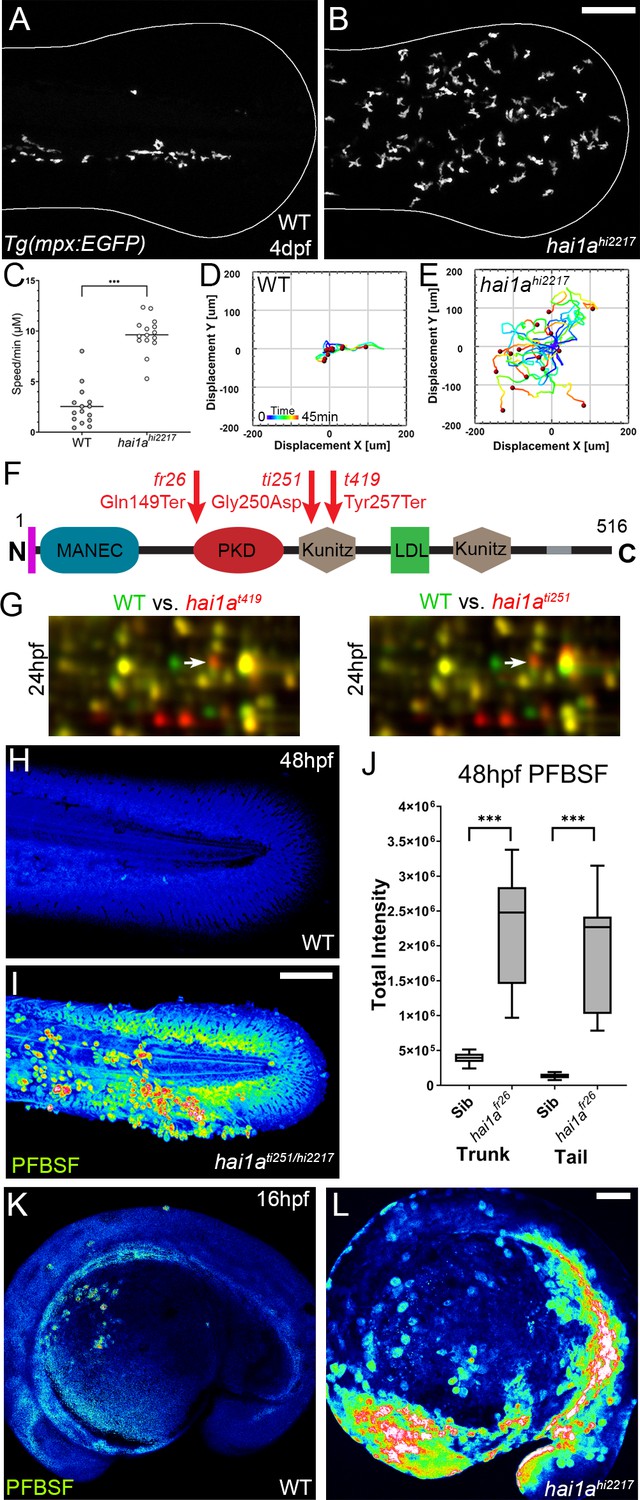
The epidermis of hai1a mutants displays elevated hydrogen peroxide.
(A, B) Projected confocal images showing neutrophils populate the tail of hai1ahi2217 mutants (B) but just the vasculature of WT (A) at 4dpf labelled by the Tg(mpx:EGFP)i114 line. Fin extremity outlined in white. (C) Neutrophils move significantly faster in hai1ahi2217 than WT. n = 15; t-test; ***p<0.001. (D, E) Tracks of neutrophil migration taken from Video 1 in WT (D) and hai1ahi2217 (E). (F) Schematic of the Hai1a protein with protein domains given, signal peptide as purple line and transmembrane domain as grey line. Location and nature of the fr26 and two dandruff alleles, ti251 and t419 given. (G) Selected region of 2D gel of protein extracted from 24hpf embryos for hai1at419 (left) or hai1ati251 (right) in red, superimposed over WT protein samples (green in both). The shift in pI of peroxiredoxin4 in both alleles is indicated with an arrow. (H, I) Projected lateral confocal views of pentafluorobenzenesulfonyl fluorescein (PFBSF) staining of WT (H) and hai1ati251/hi2217 (I) tail fins at 48hpf. (J) Box and whiskers plot of PFBSF fluorescent staining intensity of WT and hai1afr26 mutants at 48hpf in trunk and tail. n = 9; t-test ***p<0.001. (K, L) Projected lateral confocal views of PFBSF staining of WT (K) and hai1ahi2217 (L) at 16hpf. Scale bars: (B, I, L) = 100 µm.
-
Figure 1—source data 1
2D proteomics protein ID report list of the spot identities with significant ratio changes.
- https://cdn.elifesciences.org/articles/66596/elife-66596-fig1-data1-v2.xls
-
Figure 1—source data 2
2D proteomics protein ratio changes for each of the protein spots identified as significantly changed.
- https://cdn.elifesciences.org/articles/66596/elife-66596-fig1-data2-v2.xls
-
Figure 1—source data 3
2D proteomics top 50 proteins significantly changed in hai1a mutants.
- https://cdn.elifesciences.org/articles/66596/elife-66596-fig1-data3-v2.pdf
Figure 1—figure supplement 1
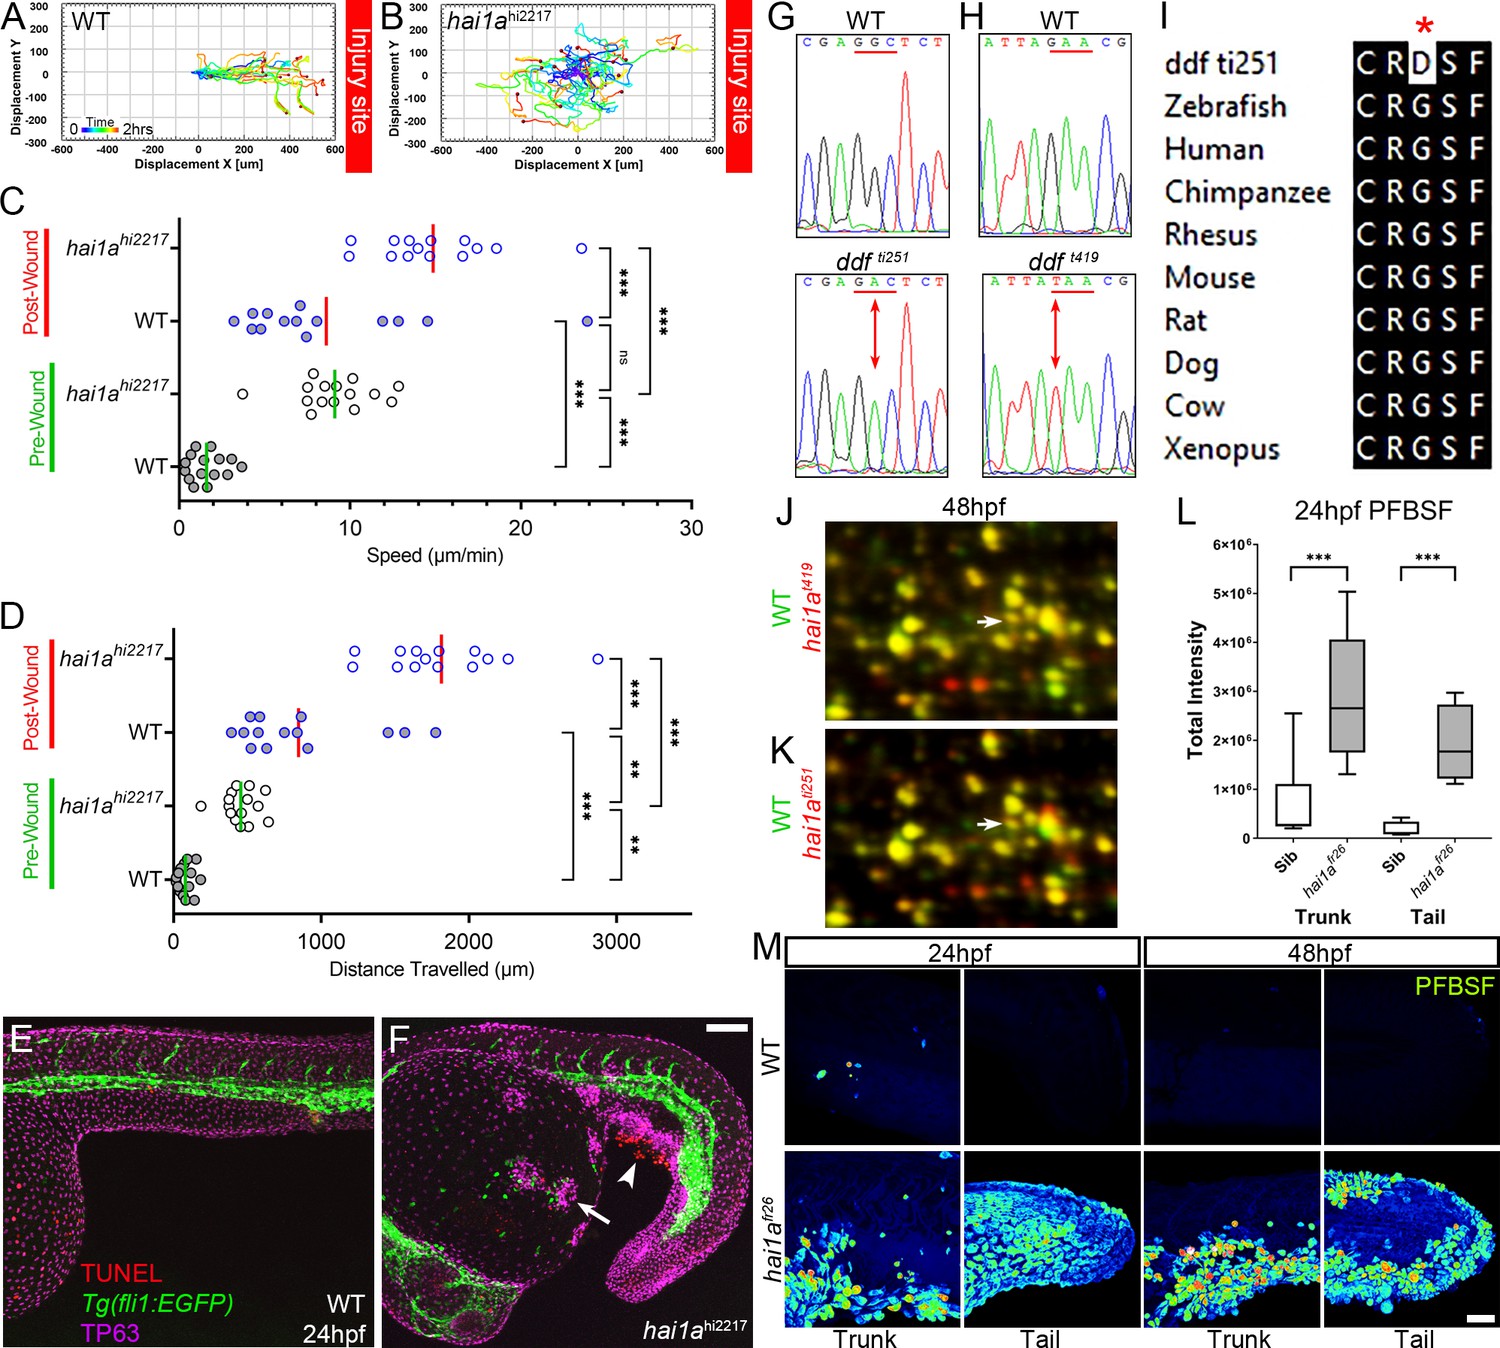
The epidermis of hai1a mutants displays elevated hydrogen peroxide.
(A, B) Tracks of neutrophil migration taken from Video 2 in WT (A) and hai1ahi2217 (B) from immediately after wounding tail fin at indicated site. (C, D) Graph of neutrophil speed (C) and distance travelled (D) before and after wounding in WT and hai1ahi2217. Neutrophils in wounded WT move as fast as unwounded hai1a mutants. Wounding hai1a mutants accelerates neutrophils. n = 15; ANOVA with Bonferroni post-test ***p<0.001, **p<0.01. (E, F) Projected confocal images showing neutrophils (green, labelled by Tg(fli1:egfp)y1 transgenic line) are not attracted to regions of apoptosis (arrowhead, red, stained by TUNEL), but to epidermal aggregates (arrow, magenta, stained by anti-TP63) in 24hpf hai1ahi2217 mutants (F) but not WT (E). (G, H) Sequence chromatograms of genomic DNA from WT (upper panels) and dandruff alleles ti251 (G) and t419 (H) (lower panels). Altered codon is underlined in red with altered base indicated by arrow. (I) ClustalW protein alignment of the amino acid substitution in the ti251 allele showing broad conservation of across vertebrates. (J, K) Selected regions of 2D gel of protein extracted from 48hpf embryos for hai1at419 (J) or hai1ati251 (K) in red, superimposed over WT protein samples (green in both). The shift in pI of Peroxiredoxin4 in both alleles is indicated with an arrow. (L) Box and whiskers plot of pentafluorobenzenesulfonyl fluorescein (PFBSF) fluorescent staining intensity of WT and hai1afr26 mutants at 24hpf in trunk and tail. n = 9; t-test ***p<0.001. (M) Lateral projected confocal views of PFBSF staining of WT (upper row) and hai1afr26 (lower row) trunks and tails at 24hpf and 48hpf. Scale bars (F) = 100 µm; (M) = 50 µm.
Figure 2 with 1 supplement
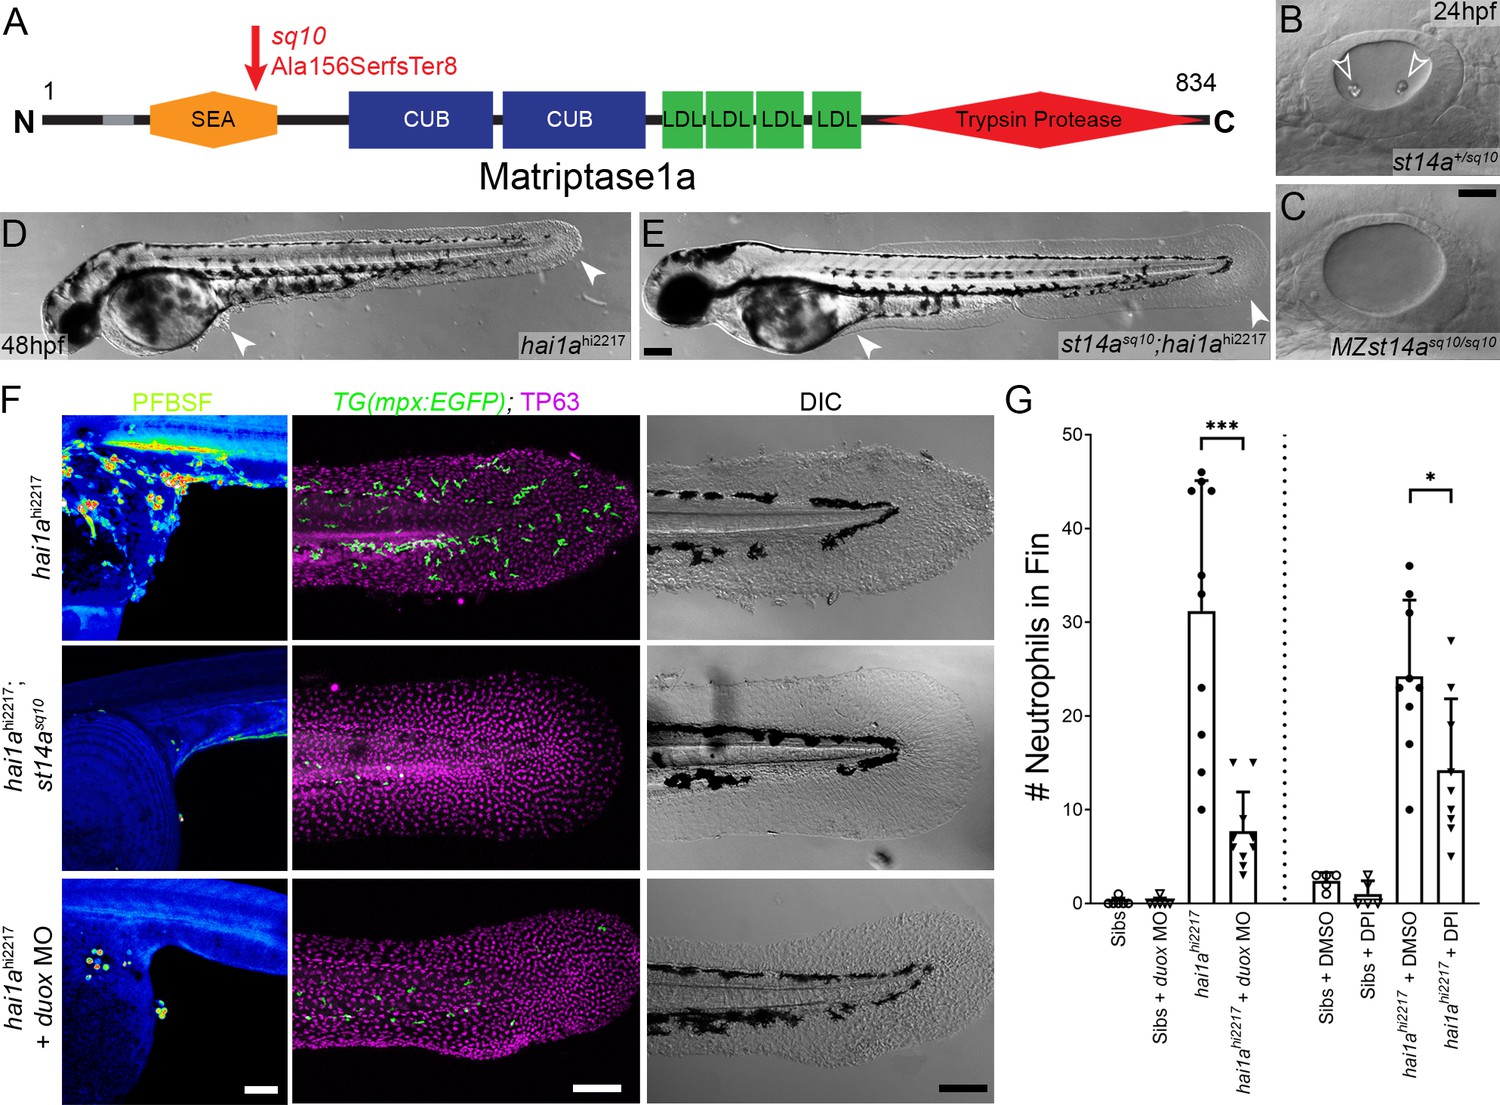
Loss of Matriptase1a or Duox1 reduces H2O2 and neutrophils in hai1a mutants.
(A) Schematic of the Matriptase1a protein with domains given and transmembrane domain as grey line. Location and nature of the sq10 allele given by red arrow. (B, C) Lateral DIC (Differential Interference Contrast) images of st14a+/sq10 (B) and MZ st14asq10 (C) otic vesicles at 24hpf showing absence of otoliths (arrowheads in B) in the maternal zygotic st14a mutants. (D, E) Lateral DIC images of hai1ahi2217 single mutant (D) and st14asq10; hai1ah12217 double mutant (E) at 48hpf highlighting rescue of epidermal aggregates and fin morphology (arrowheads) in the double mutants. (F) Projected confocal images of pentafluorobenzenesulfonyl fluorescein (PFBSF) staining at 24hpf (left column), TP63 (magenta), and eGFP (green) antibody staining at 48hpf (middle column) with DIC imaging (right column) for hai1ahi2217 single mutants (top row), st14asq10; hai1ahi2217 double mutants (middle row), and hai1ahi2217 mutants injected with 0.4 mM, duox MO + 0.2 mM tp53 morpholino (bottom row). Individuals for middle and right columns were hemizygous for the Tg(mpx:eGFP)i114 transgene. (G) Counts of eGFP-positive neutrophils on the fins of hai1ahi2217; Tg(mpx:eGFP)i114 or Tg(mpx:eGFP)i114, and either uninjected, injected with morpholino against duox (left side of graph), treated with 0.5% DMSO (Dimethyl sulfoxide) or 40 µM diphenyleneiodonium (DPI) (right side of graph). n = 10; t-test; ***p<0.001; *p<0.05. Scale bars: (C) = 20 µm; (E, F) = 100 µm.
Figure 2—figure supplement 1
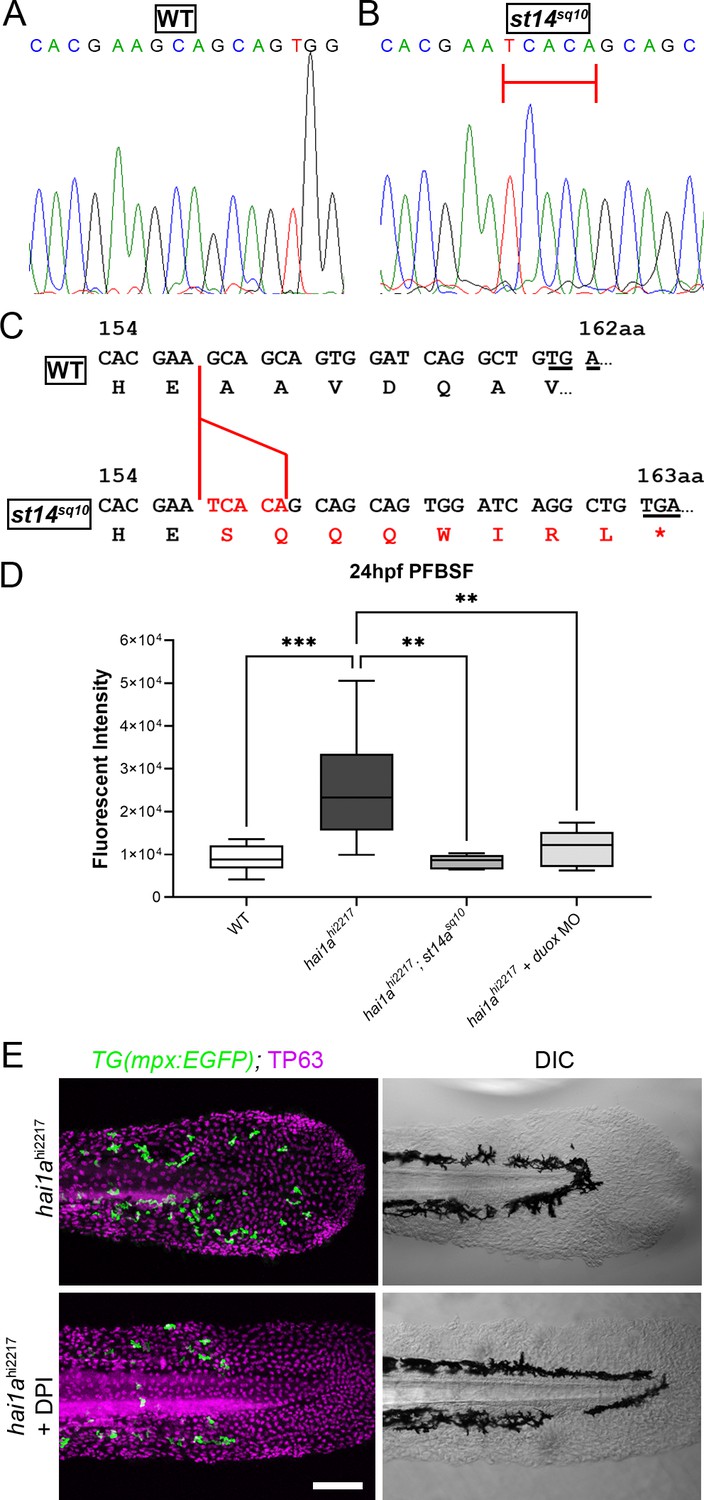
Generation of st14a mutant and Duox inhibition reduces hydrogen peroxide and neutrophils in hai1a mutants.
(A, B) Sequence chromatograms of part of exon 6 of the zebrafish st14a gene from WT (A) and the st14asq10 allele showing the 5 bp insertion highlighted by red bar. (C) Effect of the 5 bp insertion (red) in the sq10 allele leads to alteration of reading frame, eight aberrant amino acids followed by a termination codon (red lettering). The codon altered to nonsense codon is underlined in both WT and mutant sequences. (D) Box and whiskers plot of pentafluorobenzenesulfonyl fluorescein (PFBSF) fluorescent staining intensity of 24hpf WT, hai1ahi2217 mutants, hai1ah12217; st14asq10 double mutants, and hai1ahi2217 injected with duox MO. n = 8; ANOVA with Bonferroni post-test ***p<0.001, **p<0.01. (E) TP63 (magenta) and eGFP (green) antibody staining (left column) with DIC imaging (right column) for 48hpf hai1ahi2217; Tg(mpx:eGFP)i114 mutants either untreated (top row) or treated with 40 µM diphenyleneiodonium (DPI) (bottom row). Scale bar: (D) = 100 µm.
Figure 3 with 1 supplement
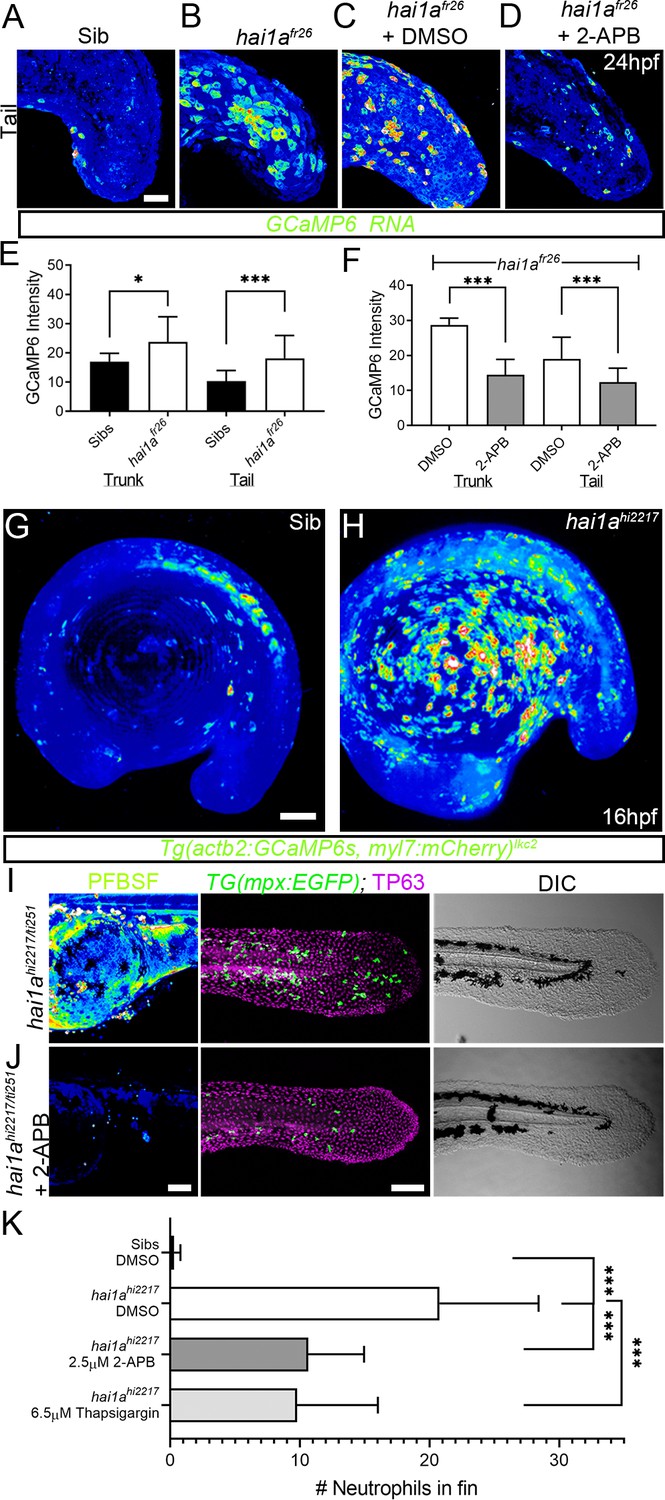
Calcium dynamics in hai1a mutants regulate H2O2 and inflammation.
(A–D) Projected confocal images of eGFP in the tail of WT (A) or hai1afr26; (B–D) injected with GCaMP6s RNA, imaged at 24hpf, indicating calcium dynamics. Embryos are either untreated (A, B), treated with DMSO (C), or with 2.5 µM 2-APB (D). Images are temporal projections of timelapse movies taken at maximum speed intervals (2 min) and projected by time. (E, F) Graphs comparing eGFP intensities from GCaMP6s RNA timelapses in trunk and tail between 24hpf WT and hai1afr26 (E) and between hai1afr26 treated with DMSO and 2.5 µM 2-APB (F). n = 10; t-test; *p<0.05, ***p<0.001. (G, H) Projected light-sheet images of Tg(actb2:GCaMP6s, myl7:mCherry)lkc2 embryos indicating calcium dynamics at 16hpf of sibling (G) or hai1ahi2217 (H). Images are temporal projections of timelapse movies taken at 45 s intervals and projected by time. (I, J) Pentafluorobenzenesulfonyl fluorescein (PFBSF) staining at 24hpf (left column), TP63 (magenta), and eGFP (green) antibody staining at 48hpf (middle column) with DIC imaging (right column) for hai1ahi2217/ti251 mutants (J), or hai1ahi2217/ti247 mutants treated with 2.5 µM 2-APB (I). Individuals for middle and right columns were hemizygous for the Tg(mpx:eGFP)i114 transgene. (K) Counts of eGFP-positive neutrophils in the fins at 48hpf of Tg(mpx:eGFP)i114, or hai1ahi2217; Tg(mpx:eGFP)i114 treated with 0.5% DMSO, 2.5 µM 2-APB, or 6.5 µM thapsigargin. n = 20; t-test; ***p<0.001. Scale bars (A–D) = 50 µm; (G, I, J) = 100 µm.
Figure 3—figure supplement 1
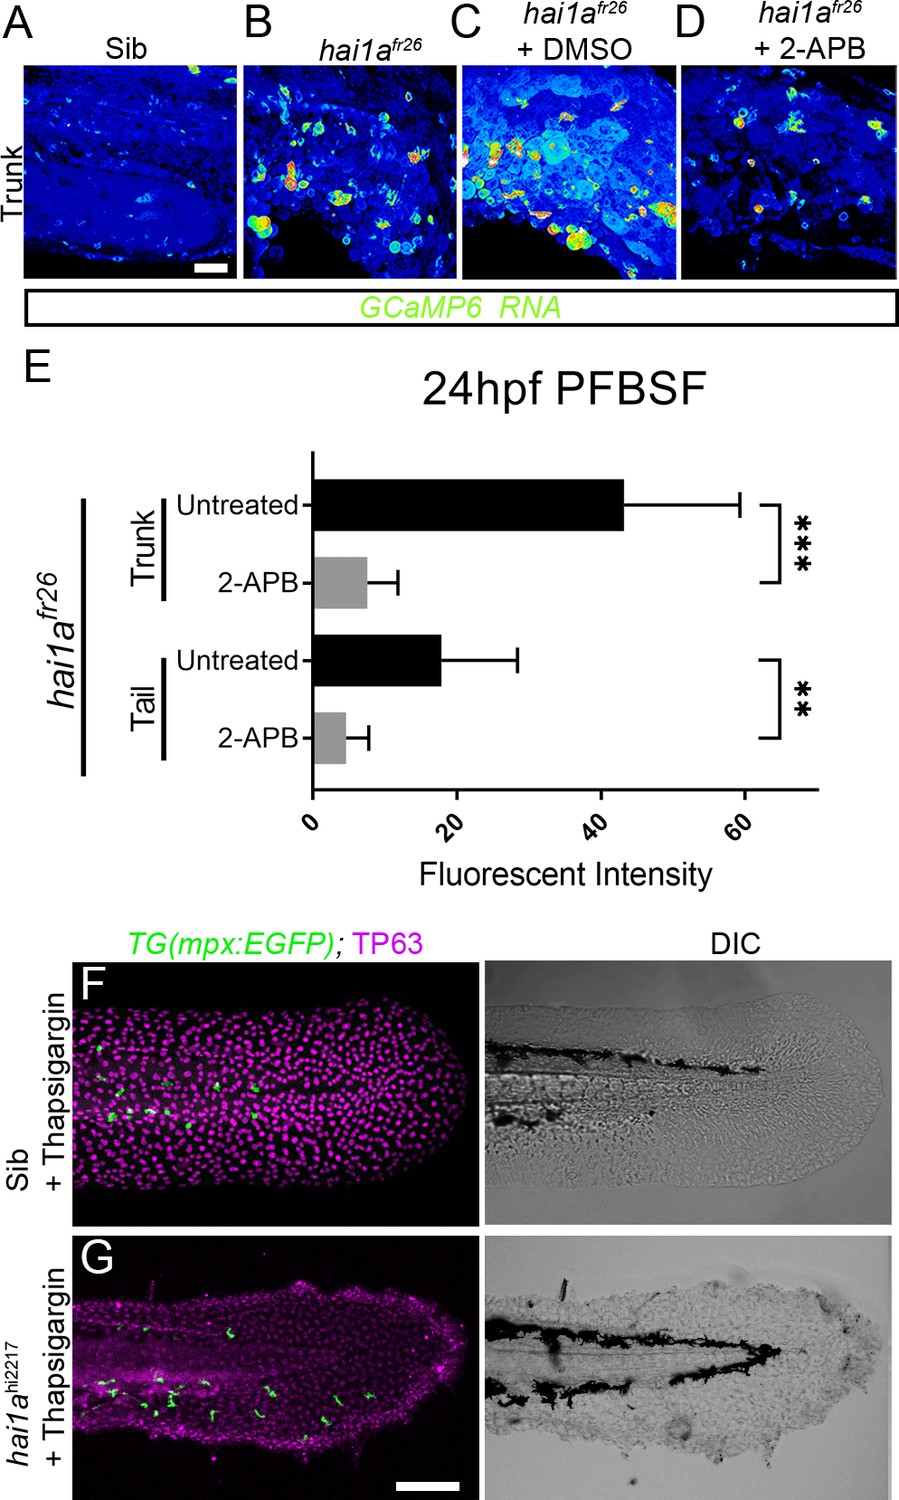
Thapsigargin and 2-APB reduce neutrophil inflammation but not epidermal defects in hai1a mutants.
(A–D) Projected confocal images of eGFP in the trunk of WT (A) or hai1afr26; (B–D) injected with GCaMP6s RNA, imaged at 24hpf, indicating calcium dynamics. Embryos are either untreated (A, B), treated with DMSO (C), or with 2.5 µM 2-APB (D). Images are temporal projections of timelapse movies taken at maximum speed intervals (3 min) and projected by time. (E) Plot of pentafluorobenzenesulfonyl fluorescein (PFBSF) fluorescent staining intensity of hai1afr26 mutants at 24hpf in trunk and tail, either untreated or treated with 2-APB. n = 14; ANOVA with Bonferroni post-test ***p<0.001, **p<0.01. (F, G) Projected confocal images of tail fins of 48hpf larvae immunostained with TP63 (magenta) and eGFP (green) (left column) with DIC imaging (right column). Larvae were both hemizygous for Tg(mpx:eGFP)i114 transgene and were treated with 6.5 µM thapsigargin. Genotypes are hai1a+/hi2217 sibling (F) and hai1ahi2217 mutant (G). Rescue of neutrophil inflammation, but not epidermal defect, is apparent in treated hai1a mutant. Scale bars: (A) = 50 µm; (G) = 100 µm.
Figure 4 with 1 supplement

NfkB signalling is elevated in hai1a mutants and is necessary for neutrophil inflammation.
(A, B) Lateral confocal projections of Tg(6xHsa.NFKB:EGFP)nc1 embryos reporting NfkB signalling levels at 48hpf for WT (A) and hai1afr26 (B). (C) qPCR of cDNA levels of NfkB target gene nfkbiaa in hai1afr26 vs. sibs at 48hpf. n = 3, 200 embryos pooled in each, t-test *p<0.05. (D–E′) Projected confocal images of the tail fins of 48hpf Tg(mpx:eGFP)i114; hai1ahi2217 embryos, immunostained for TP63 (magenta) and eGFP (green) (D, E) with corresponding DIC image (D′, E′). Embryos were either mutant for ikbkg (ikbkgsq304, E–E′) or heterozygous (ikbkg+/sq304; D–D′). (F) Counts of eGFP-positive neutrophils in the fins at 48hpf of hai1ahi2217; ikbkg+/sq304 and hai1ahi2217; ikbkgsq304. Embryos were hemizygous for Tg(mpx:eGFP)i114. n = 9; t-test; ***p<0.001. (G–I) Lateral DIC images of the trunk of hai1a+/hi2217; ikbkg+/sq304 (G), hai1ahi2217; ikbkg+/sq304 (H), and hai1ahi2217; ikbkgsq304 (I). Loss of IKBKG does not rescue epidermal defects of hai1a mutants (arrowheads). (J, K) Lateral confocal projections of Tg(6xHsa.NFKB:EGFP)nc1 embryos reporting NfkB signalling levels at 32hpf of hai1ahi2217 uninjected (J) or injected with duox MO (K). Loss of H2O2 reduces NfkB signalling levels in hai1a mutants. Scale bars: (A, K) = 200 µm; (D′, I) = 50 µm.
Figure 4—figure supplement 1
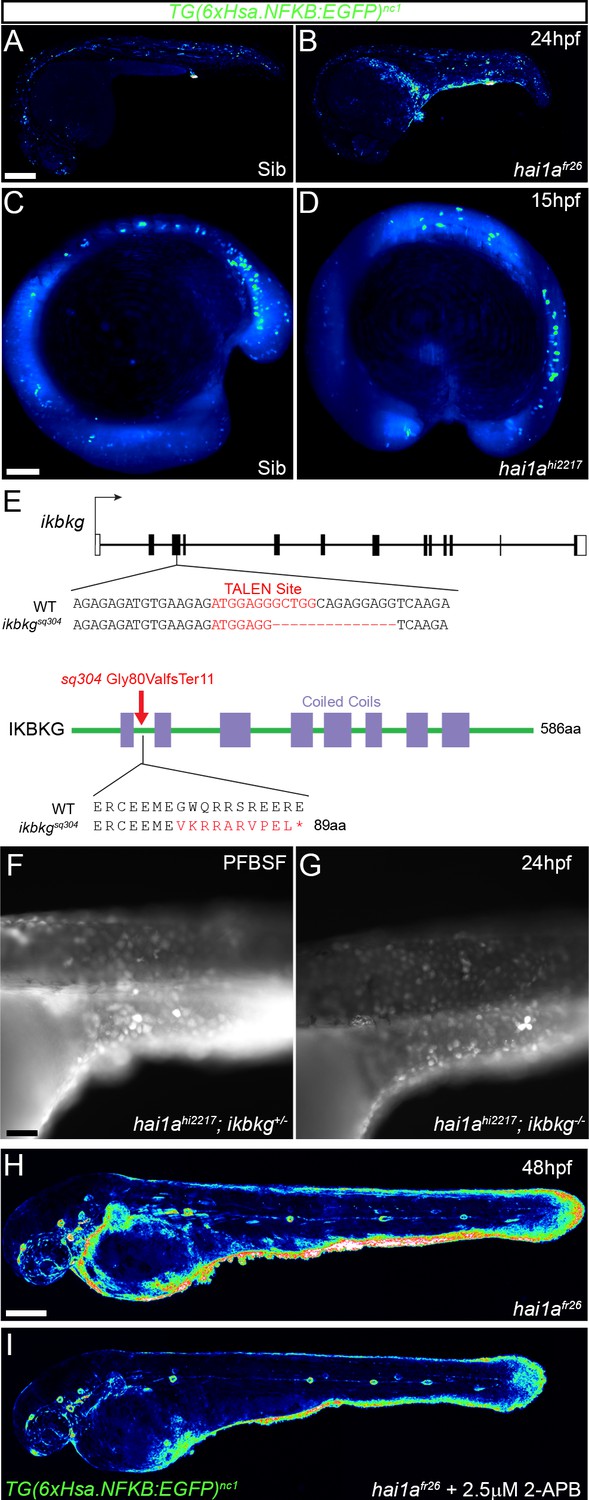
NfkB signalling is elevated in hai1a mutants, and mutation of ikbkg rescues neutrophil inflammation.
(A–D) Lateral confocal projections of Tg(6xHsa.NFKB:EGFP)nc1 embryos reporting NfkB signalling levels of hai1afr26 at 24hpf (B), hai1ahi2217 at 15hpf, and siblings at 24hpf (A) and 15hpf (C). The increase in NfkB reporter signal occurs after overt phenotype onset. (E) Nature of the ikbkgsq304 mutant allele showing TALEN site location within the intron-exon structure of the gene (coding and non-coding exons depicted as filled and open boxes, respectively). Sequence of part of exon 3 shown below with the TALEN binding site in red. The 14 bp deletion in the ikbkgsq304 allele is indicated under the WT sequence as dashes. This leads to a frameshift changing codon 80 from GGC (Gly) to GGT (Val), then nine aberrant amino acids followed by a stop codon. (F, G) Lateral widefield fluorescent images of hai1ahi2217; ikbkg+/sq304 (F) and hai1ahi2217; ikbkgsq304 (G) embryos at 24hpf stained with pentafluorobenzenesulfonyl fluorescein (PFBSF) showing no loss of H2O2 in hai1a mutants upon mutation of ikbkg. (H, I) Lateral confocal projections of 48hpf hai1afr26; Tg(6xHsa.NFKB:EGFP)nc1 embryos, treated with DMSO (H) or with 2.5 µM 2-APB (I). Scale bars: (A, H) = 200 µm; (C) = 100 µm; (F) = 50 µm.
Figure 5
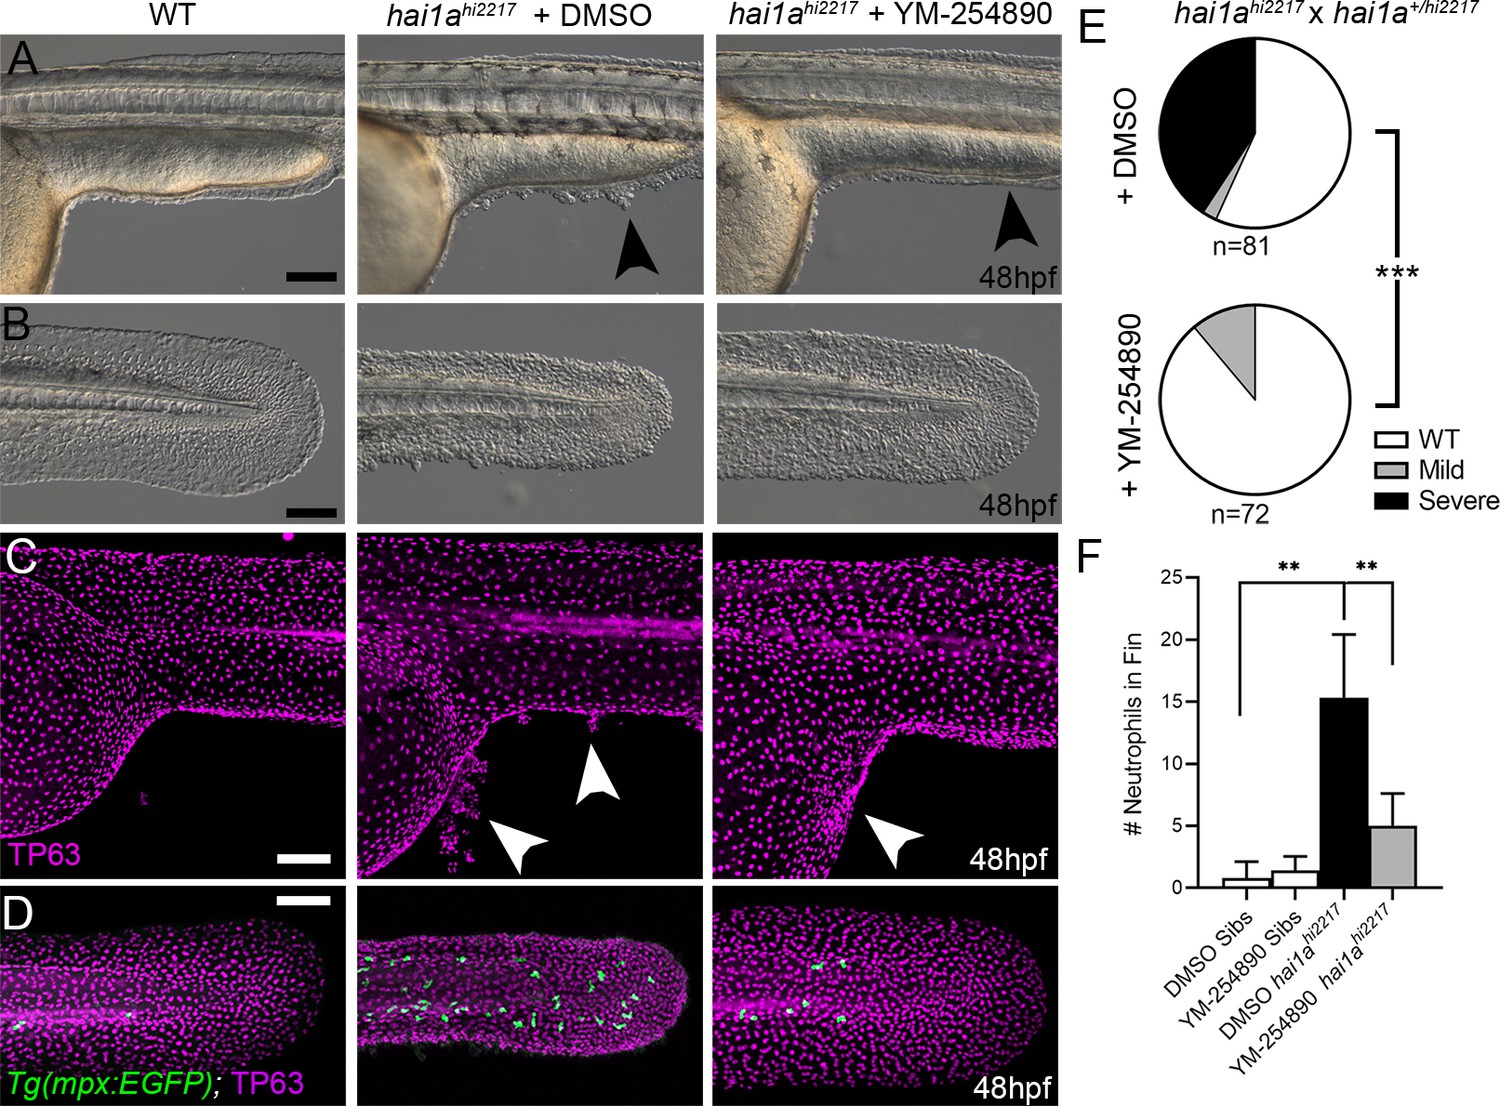
Gq inhibition rescues both epidermal and inflammation phenotypes of hai1a mutants.
(A–D) Lateral images of ventral trunk and tail at 48hpf for WT (left panels), hai1ahi2217 treated with 0.5% DMSO (middle panels), and hai1ahi2217 treated with 32 µM YM-254890 (right panels). DIC micrographs are shown in (A, B), whilst projected confocal images are shown in (C, D), where embryos are immunostained for TP63 (C, D; magenta) and eGFP (D; green). Embryos in (D) are hemizygous for Tg(mpx:eGFP)i114. Arrowheads indicate region of aggregate formation lost upon treatment with Gq inhibitor YM-254890. (E) Pie charts showing proportion of embryos with no (WT; white), mild (grey) or severe (black) hai1a mutant epidermal phenotypes. Embryos were derived from hai1ahi2217/hi2217 × hai1a+/hi2217 crosses and assayed at 48hpf. Clutches treated with 0.5% DMSO (upper pie chart) were compared to those treated with 32 µM YM-254890 (lower pie chart) by Chi-squared analysis. ***p<0.001; n = 72. (F) Graph of counts of eGFP-positive neutrophils in the fins at 48hpf of Tg(mpx:eGFP)i114, or hai1ahi2217; Tg(mpx:eGFP)i114 treated with 0.5% DMSO, or 32 µM YM-254890. n = 6; Mann–Whitney test; **p<0.01. Scale bars: (A–D) = 100 µm.
Figure 6
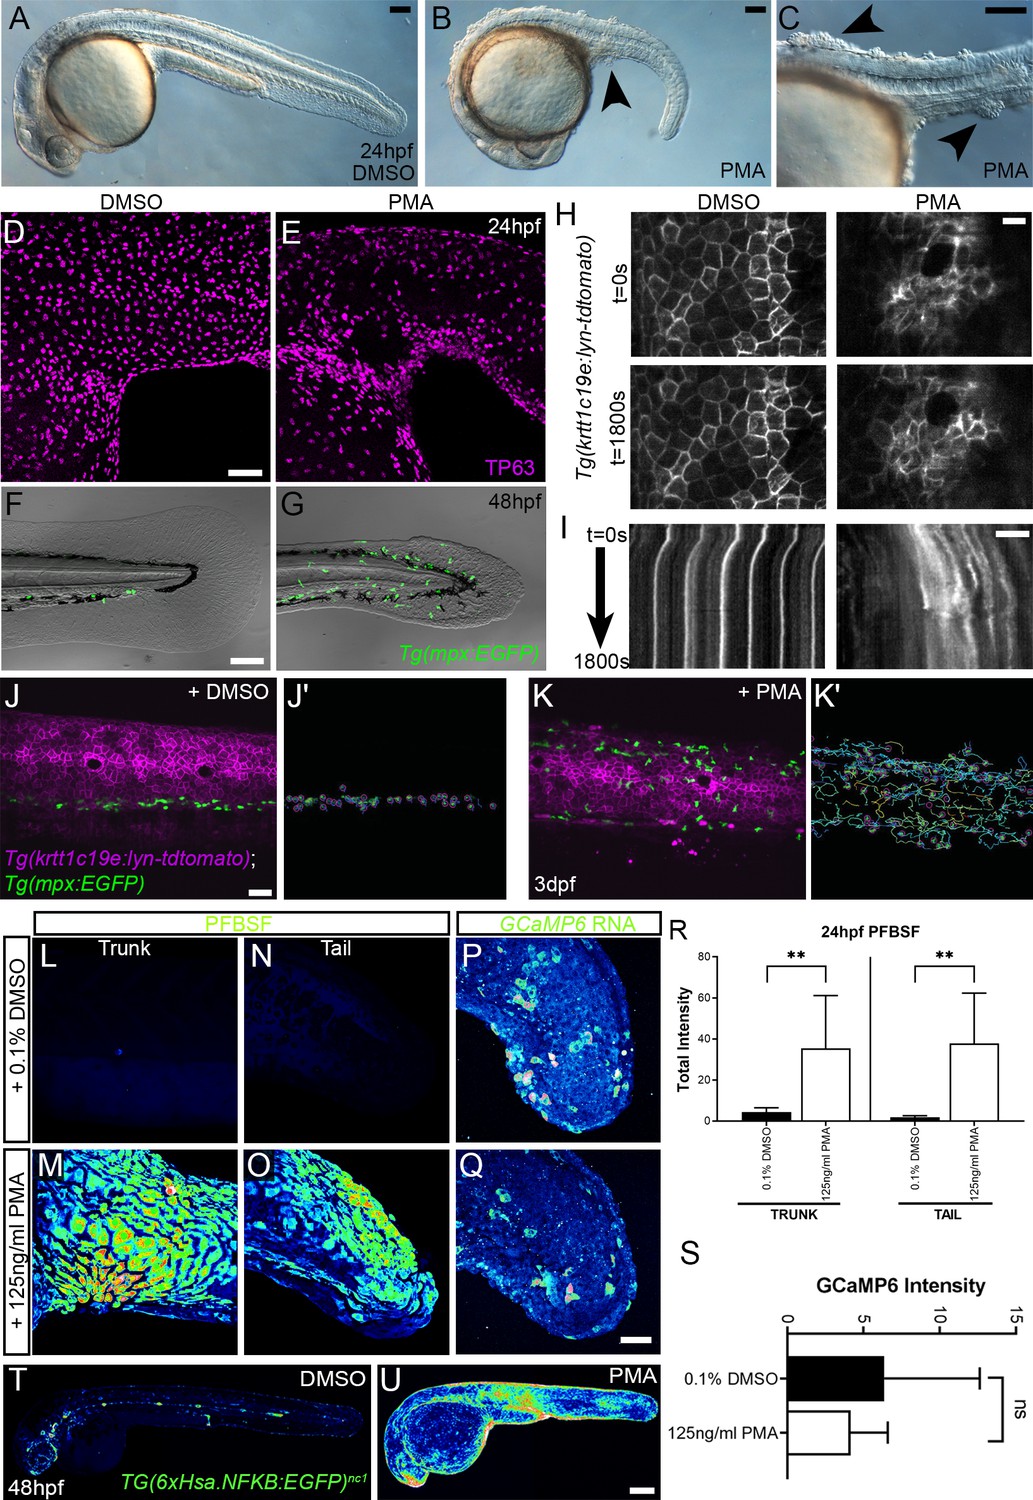
Phorbol 12-myristate 13-acetate (PMA) induces epidermal aggregates, motility, H2O2, NfkB, and inflammation.
(A, B) Lateral micrographs of embryos treated with DMSO (A) or 125 ng/ml PMA (B, C) showing generation of epidermal aggregates (arrowheads). (D, E) Projected confocal images of the trunk of 24hpf WT embryos treated with 0.1% DMSO (D) or 125 ng/ml PMA (E) and immunostained for TP63 (magenta), showing aggregation of TP63-positive cells. (F, G) Projected confocal images superimposed on DIC image of the tail of 48hpf Tg(mpx:eGFP)i114 embryos treated with 0.1% DMSO (F) or 125 ng/ml PMA (G) showing fin defect and activation of eGFP-positive neutrophils (green, G). (H, I) Single timepoint images at t = 0 (top panels, H) and t = 1800 s (lower panels, H) and kymographs (I) derived from light-sheet movies (Video 7) of the epidermis of 3dpf Tg(krtt1c19e:lyn-tdtomato)sq16 larvae treated with 0.1% DMSO (left panels) or 37.5 ng/ml PMA (right panels) showing the lack of membrane stability following PMA treatment. (J–K′) Single frames (J, K) and tracks of eGFP- positive neutrophils (J′, K′) from light-sheet (Video 8) showing neutrophils labelled by eGFP and basal keratinocyte cell membranes labelled by lyn-tdTomato in the trunk of a 3dpf Tg(krtt1c19e:lyn-tdtomato)sq16 larva treated with 0.1% DMSO (J, J′) or 37.5 ng/ml PMA (K, K′) for 18 hr, and imaged every 20 s for 30 min. Track colour in (J′, K′) denotes mean velocity (dark blue 0.0 – red 0.2). (L–O) Projected lateral confocal views of pentafluorobenzenesulfonyl fluorescein (PFBSF) staining of 24hpf WT embryos treated with 0.1% DMSO (L, N) or 125 ng/ml PMA (M, O) showing elevation of H2O2 in the trunk (L, M) and tail (N, O). (P, Q) Projected confocal images of eGFP in the tail at 24hpf of WT injected with GCaMP6s RNA, treated with DMSO (P), or with 125 ng/ml PMA (Q). Images are temporal projections of timelapse movies taken at maximum speed intervals (2 min) and projected by time. (R) Plot of PFBSF fluorescent staining intensity of WT embryos treated with 0.1% DMSO or 125 ng/ml PMA in the trunk and tail. n = 6; ANOVA with Bonferroni post-test **p<0.01. (S) Graph comparing eGFP intensities from 24hpf GCaMP6s RNA timelapses in tail following treatment with DMSO and 125 ng/ml PMA. n = 10; t-test. (T–U) Lateral confocal projections of Tg(6xHsa.NFKB:EGFP)nc1 embryos reporting NfkB signalling levels at 48hpf in WT treated with DMSO (T) and WT treated with 125 ng/ml PMA (U). Scale bars: (A, B, C, F) = 100 µm; (D, J, Q) = 50 µm; (H, I) = 20 µm; (U) = 200 µm.
Figure 7 with 1 supplement
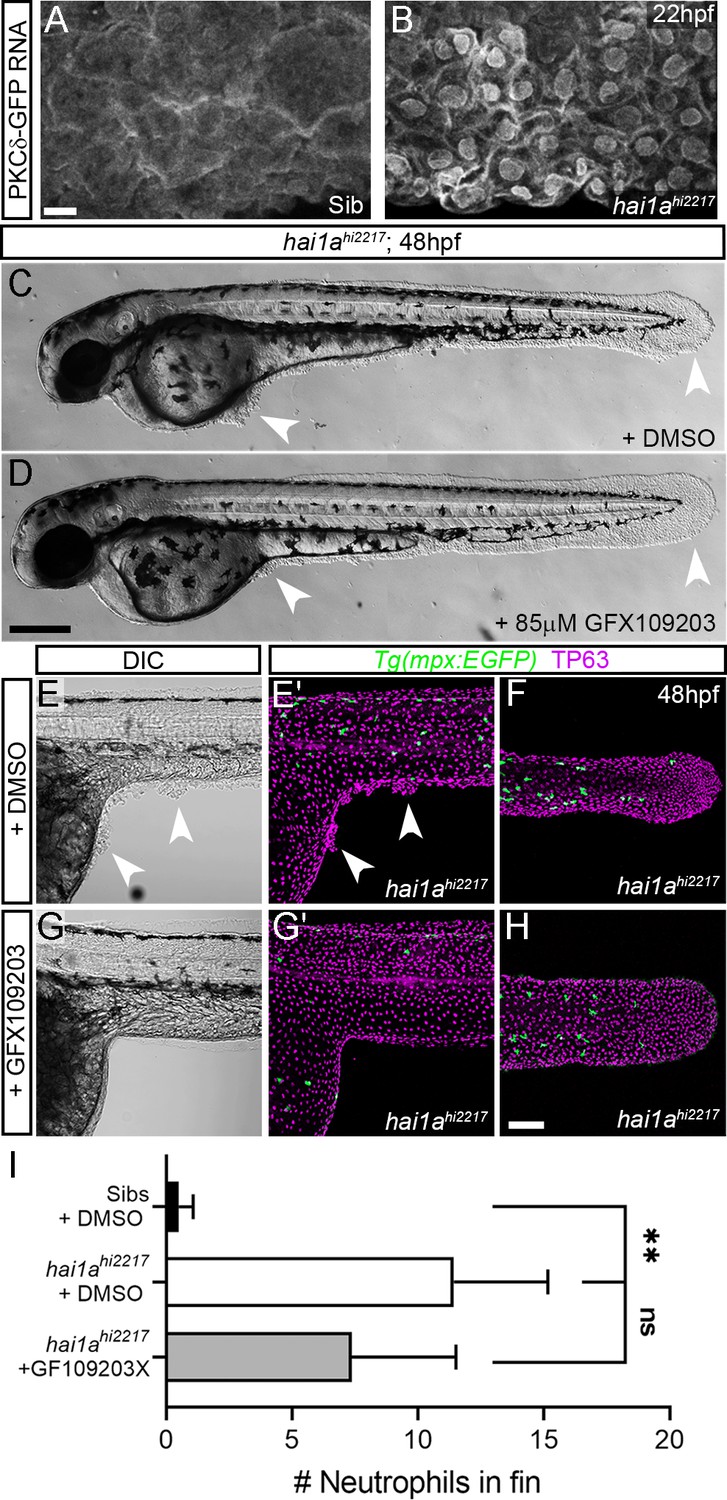
Inhibition of PKC rescues epidermal defects of hai1a.
(A, B) Confocal images of the ventral fin of 22hpf sibling (A) or hai1ahi2217 (B) embryos injected with RNA encoding PKCδ-GFP. Mostly cytoplasmic distribution in sibling was relocated to cell and nuclear membranes in hai1a mutants. (C, D) Lateral brightfield images of 48hpf hai1ahi2217 larvae treated with 0.5% DMSO (C) or 85 µM GFX109203 (D). Epidermal aggregates and fin deterioration are rescued by the PKC inhibitor (arrowheads). (E–H) DIC (E, G) and projected confocal images (E′, G′, F, H) of hai1ahi2217; Tg(mpx:eGFP)i114 trunk at 24hpf (E–E′, G–G′) and tail at 48hpf (F, H), either treated with 0.5% DMSO (E–F) or 85 µM GFX109203 (G–H). Embryos are immunostained for TP63 (magenta) and eGFP (green), highlighting rescue of epidermal phenotype and partial rescue of neutrophils by GFX109203. (I) Counts of eGFP-positive neutrophils in the fins at 48hpf of Tg(mpx:eGFP)i114, or hai1ahi2217; Tg(mpx:eGFP)i114 treated with 0.5% DMSO or 85 µM GFX109203. n = 8; ANOVA, Dunn’s multiple comparisons; **p<0.01. Scale bars: (A) = 10 µm; (D) = 200 µm; (H) = 100 µm.
Figure 7—figure supplement 1
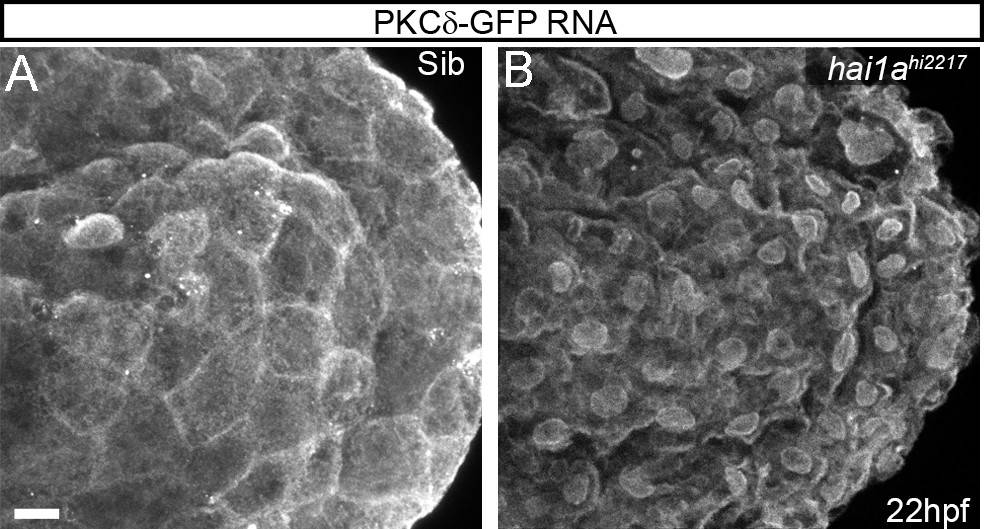
Relocation of PKCδ-GFP to membranes in hai1a mutants.
(A, B) Projected confocal images of the tail of 22hpf sibling (A) or hai1ahi2217 (B) embryos injected with RNA encoding PKCδ-GFP. Mostly cytoplasmic distribution in siblings was relocated to cell and nuclear membranes in hai1a mutants, suggesting increased cellular diacyl glycerol levels. Scale bar: (A) = 10 µm.
Figure 8 with 1 supplement
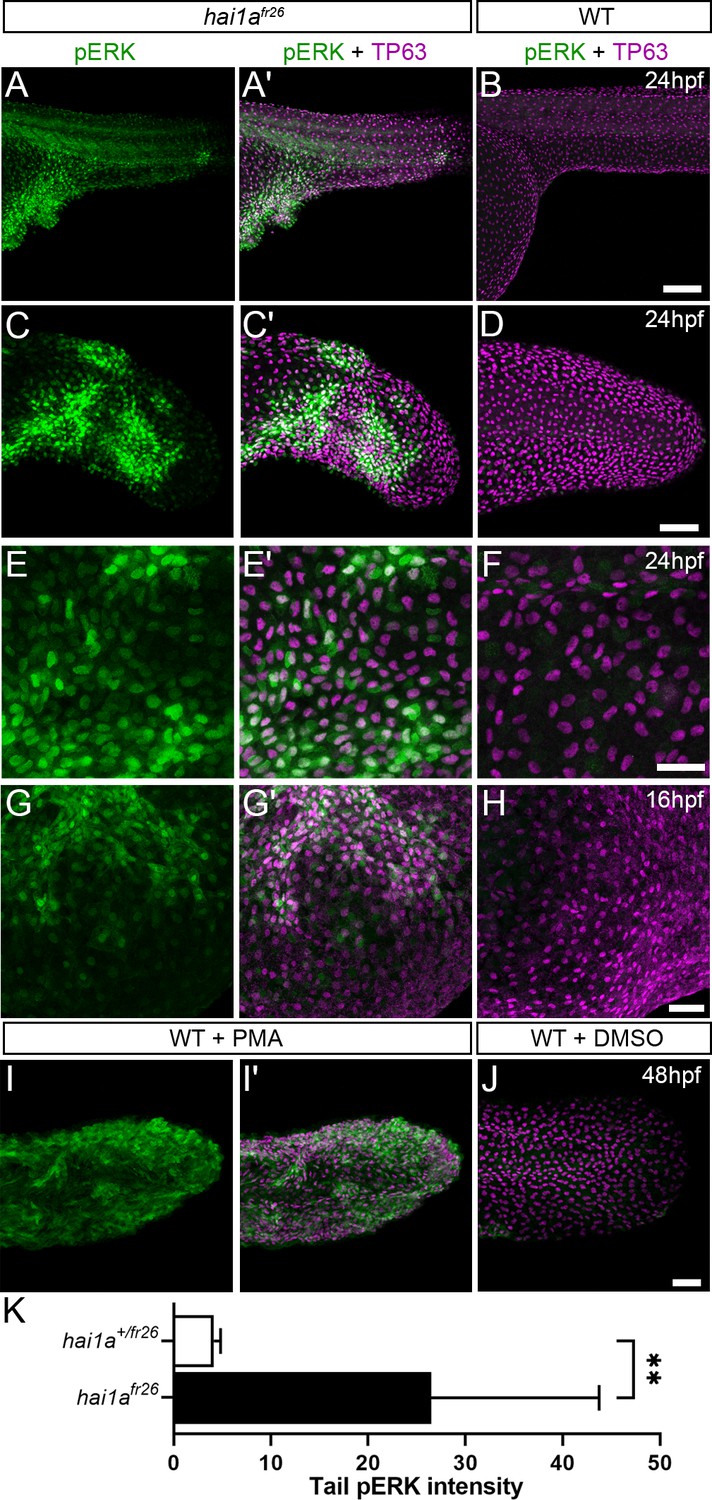
Elevation of pERK levels in phorbol 12-myristate 13-acetate (PMA)-treated and hai1a mutant epidermis.
(A–L) Lateral projected confocal images of trunks (A, A′, B, E, E′, F), yolk surface (G, G′, H) and tails (C, C′, D, I, I′, J) of embryos immunostained for TP63 (A′, B, C′, D, E′, F, G′, H, I′, J; magenta) and pERK (A, J; green) at 24hpf (A–F), 16hpf (G–H), and 48hpf (I–J). Both hai1afr26 (A, A′, C, C′, E, E′, G, G′) and 125 ng/ml PMA-treated (I, I′) embryos show increased epidermal pERK levels compared to untreated WT (B, D, F, H, J). Elevation of epidermal pERK in hai1afr26 mutants and PMA- treated embryos is seen in the trunk (A, E) and tail (C, I) as well as in epidermis over the yolk prior to overt phenotype manifestation (G). (K) Quantification of pERK immunofluorescent intensity in the tail of 24hpf hai1afr26 larvae compared to siblings. n = 5; Mann–Whitney test; **p<0.01. Scale bars: (B) = 100 µm; (D, H, J) = 50 µm; (F) = 20 µm.
Figure 8—figure supplement 1
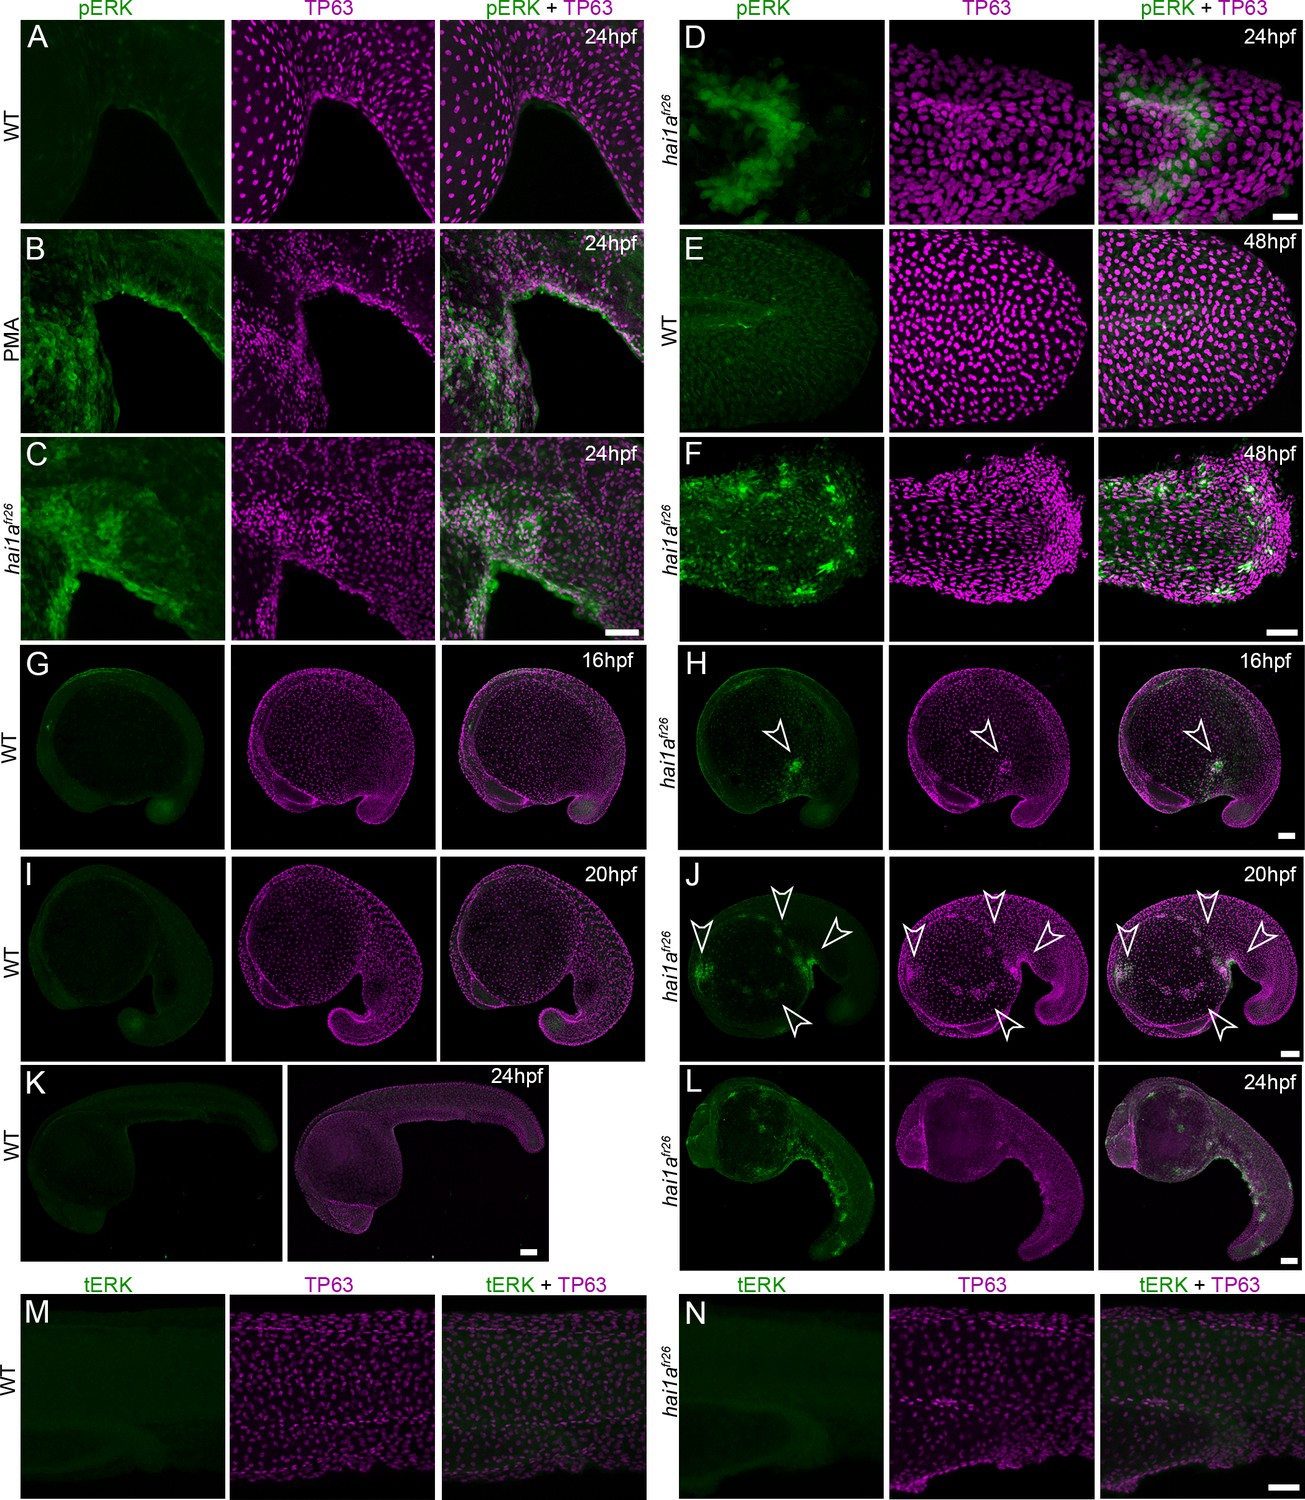
Elevation of pERK levels in phorbol 12-myristate 13-acetate (PMA)-treated and hai1a mutant epidermis.
(A–J) Lateral projected confocal images of ventral trunks (A–C), tails (D–F), and whole embryos (G–L) immunostained for TP63 (magenta) and pERK (green) at 24hpf (A–D, K, L), 48hpf (E, F), 16hpf (G, H), and 20hpf (I, J). Both hai1afr26 (C, D, F, H, J, L) and 125 ng/ml PMA-treated (B) embryos show increased epidermal pERK levels compared to untreated WT (A, E, G, I, K). Elevation of epidermal pERK is seen in hai1afr26 mutants and PMA treated embryos as well as in nascent aggregates (arrowheads, H, J). (M, N) Lateral projected confocal images of the trunks of WT (M) and hai1afr26 (N) embryos immunostained with total ERK (tERK; green) and TP63 (magenta). There was no change in tERK in hai1afr26 (N) compared to WT (M). Scale bars: (C, F, N) = 50 µm; (D) = 20 µm; (H, J, K, L) = 100 µm.
Figure 9 with 2 supplements
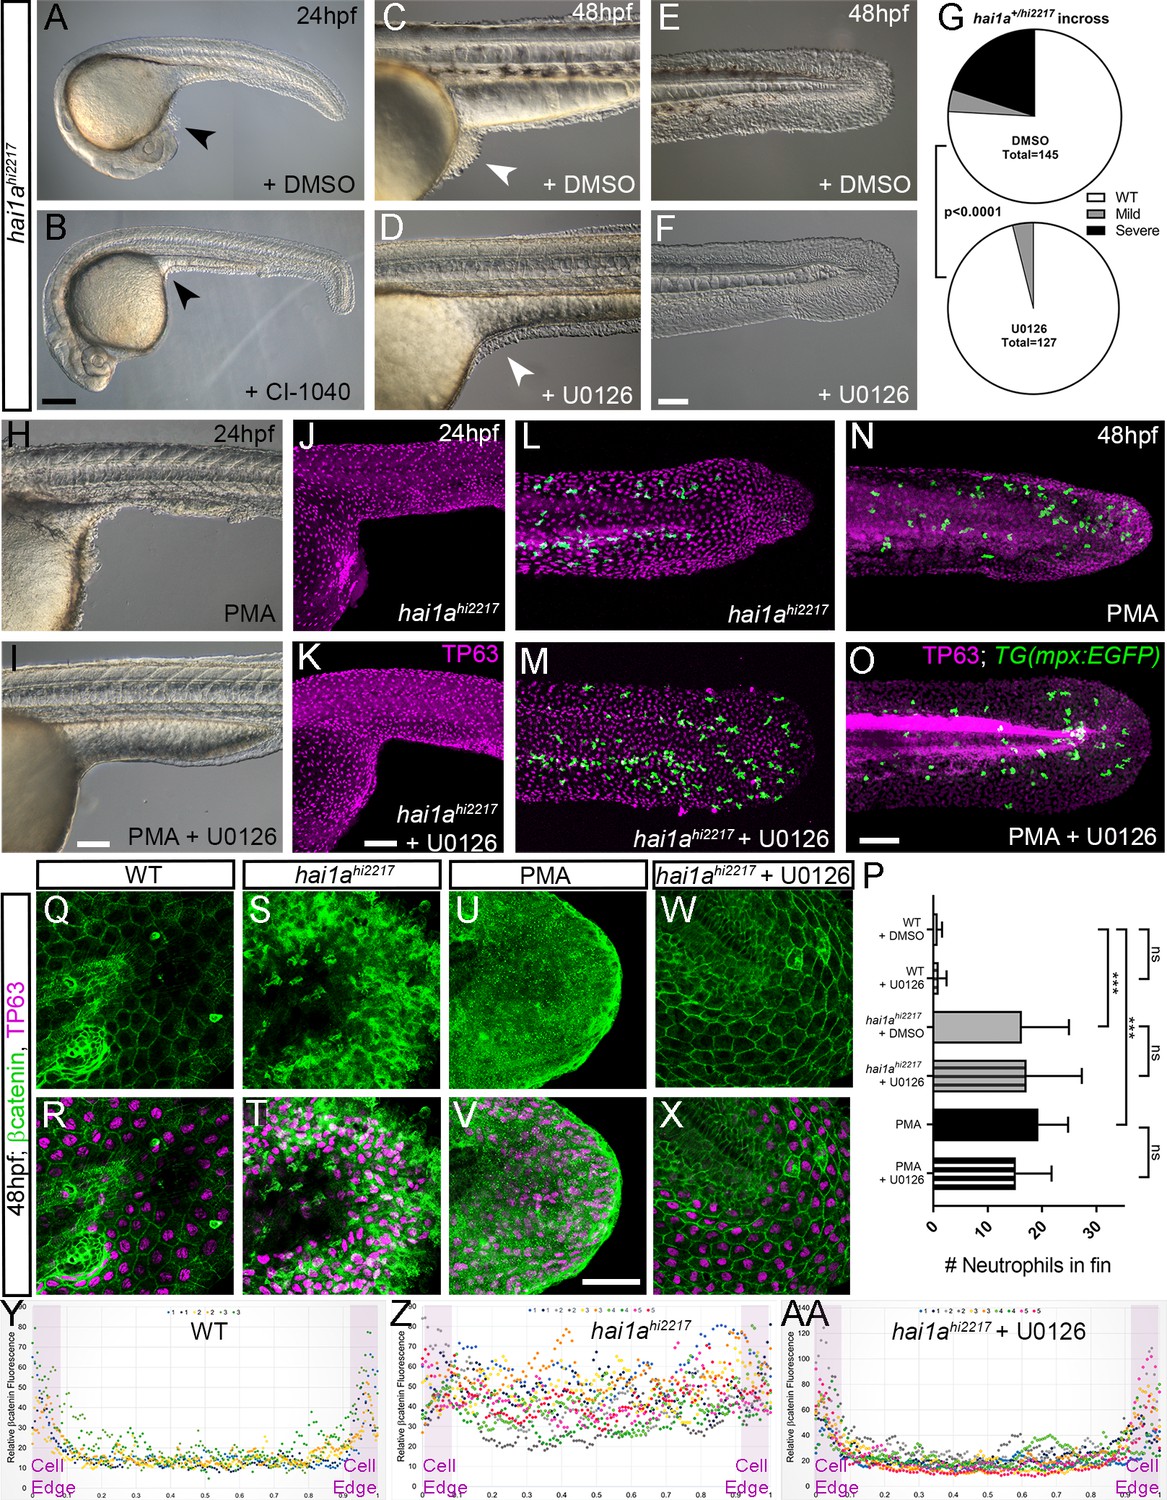
Rescue of the hai1a epidermal phenotype by pERK inhibitors.
(A–F) Lateral DIC images of 24hpf (A, B) or 48hpf (C–F) hai1ahi2217 embryos treated with either DMSO (A, C, E), 1.3 µM CI-1040 (B), or 100 µM U0126 (D, F) showing rescue of general morphology (B), trunk (D), and tail (F) epidermal phenotypes compared to DMSO-treated hai1ahi2217. Epidermal aggregates under the yolk are reduced in the treated mutants (A–D; arrowheads). (G) Proportion of 48hpf larvae derived from hai1a+/hi2217 incross showing mild or severe hai1a epidermal phenotype following DMSO (upper) or U0126 (lower) treatment (Chi-squared test). (H, I) Lateral DIC images of 24hpf embryo treated with 125 ng/ml phorbol 12-myristate 13-acetate (PMA) (H) or PMA and U0126 (I). Yolk-associated epidermal aggregates are reduced. (J–M) Lateral projected confocal images of hai1ahi2217; Tg(mpx:eGFP)i114 trunk at 24hpf (J, K) and tail at 48hpf (L, M), either treated with 0.5% DMSO (J, L) or U0126 (K, M). Embryos are immunostained for TP63 (magenta) and eGFP (green), highlighting rescue of epidermal phenotype but no reduction of neutrophils. (N, O) Lateral projected confocal images of Tg(mpx:eGFP)i114 treated with PMA alone (N) or PMA with U0126 (O) and immunostained for TP63 (magenta) and eGFP (green). Fin morphology is restored but neutrophils are still present. (P) Quantification of neutrophils in the fins showing U0126 does not reduce inflammation induced by loss of hai1a or PMA treatment. n = 8; ANOVA with Bonferroni post-test; ***p<0.001. (Q–X) Projected confocal images of 48hpf larval tails immunostained for β-catenin (green) and TP63 (magenta; R, T, V, X) of WT (Q, R, U, V) and hai1ahi2217 (S, T, W, X), either untreated (Q–T), treated with PMA (U, V) or U0126 (W, X). (Y–AA) Profile plots of fluorescence distribution across cells of WT (Y), hai1ahi2217 (Z), and hai1ahi2217 treated with U0126 (AA). X-axis represents width of the cell. β-catenin immunofluorescence intensity (Y-axis) shows majority at cell edge (demarcated in light purple) in WT and rescued hai11a mutants, but is distributed in cytoplasm in mutant. Two cells per 3–5 larvae were analysed. Scale bars: (B) = 200 µm, (F, I, K, O) = 100 µm, (V) = 20 µm.
Figure 9—figure supplement 1
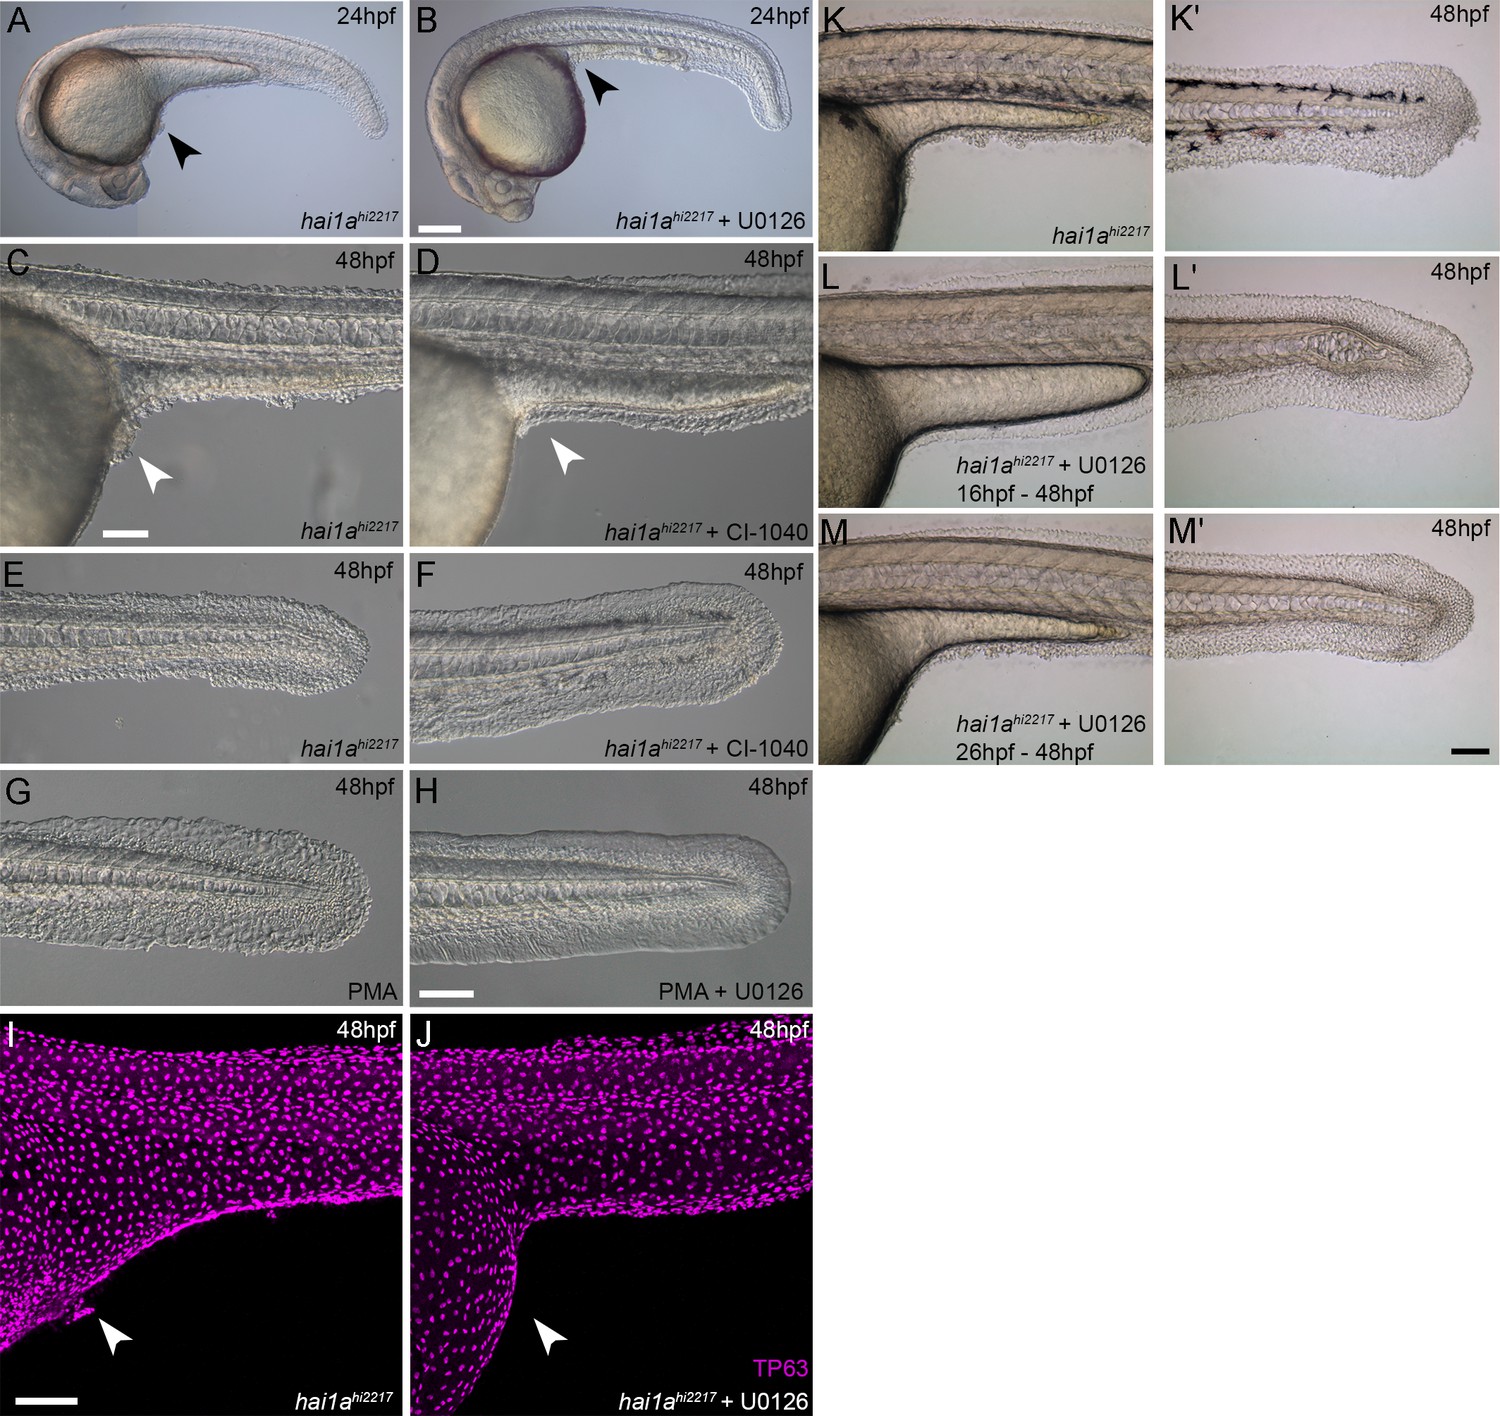
Rescue of the hai1a epidermal phenotype by pERK inhibitors.
(A–F) Lateral DIC images of 24hpf (A, B) or 48hpf (C–F) hai1ahi2217 embryos treated with either DMSO (A, C, E), U0126 (B), or CI-1040 (D, F) showing rescue of general morphology (B), trunk (D), and tail (F) epidermal phenotypes compared to DMSO-treated hai1ahi2217. (G, H) Lateral DIC images of tails of 48hpf WT treated with 125 ng/ml phorbol 12-myristate 13-acetate (PMA) alone (G) or PMA and U0126 (H). (I, J) Lateral projected confocal images of trunks of 48hpf hai1ahi2217 embryos treated with DMSO (I) or U0126 (J) and then fluorescently immunostained for TP63. (K–M′) Lateral DIC images of the trunks (K, L, M) and tails (K′, L′, M′) of 48hpf hai1ahi2217 embryos either untreated (M, M′), treated with 100 µM U0126 from 16hpf to 48hpf (L, L′), or treated with U0126 from 26hpf to 48hpf (M, M′). Whilst treatment from 16hpf led to a complete rescue, initiating treatment later resulted in only partial rescue. Scale bars: (B) = 200 µm; (C, H, I, M′) = 100 µm.
Figure 9—figure supplement 2
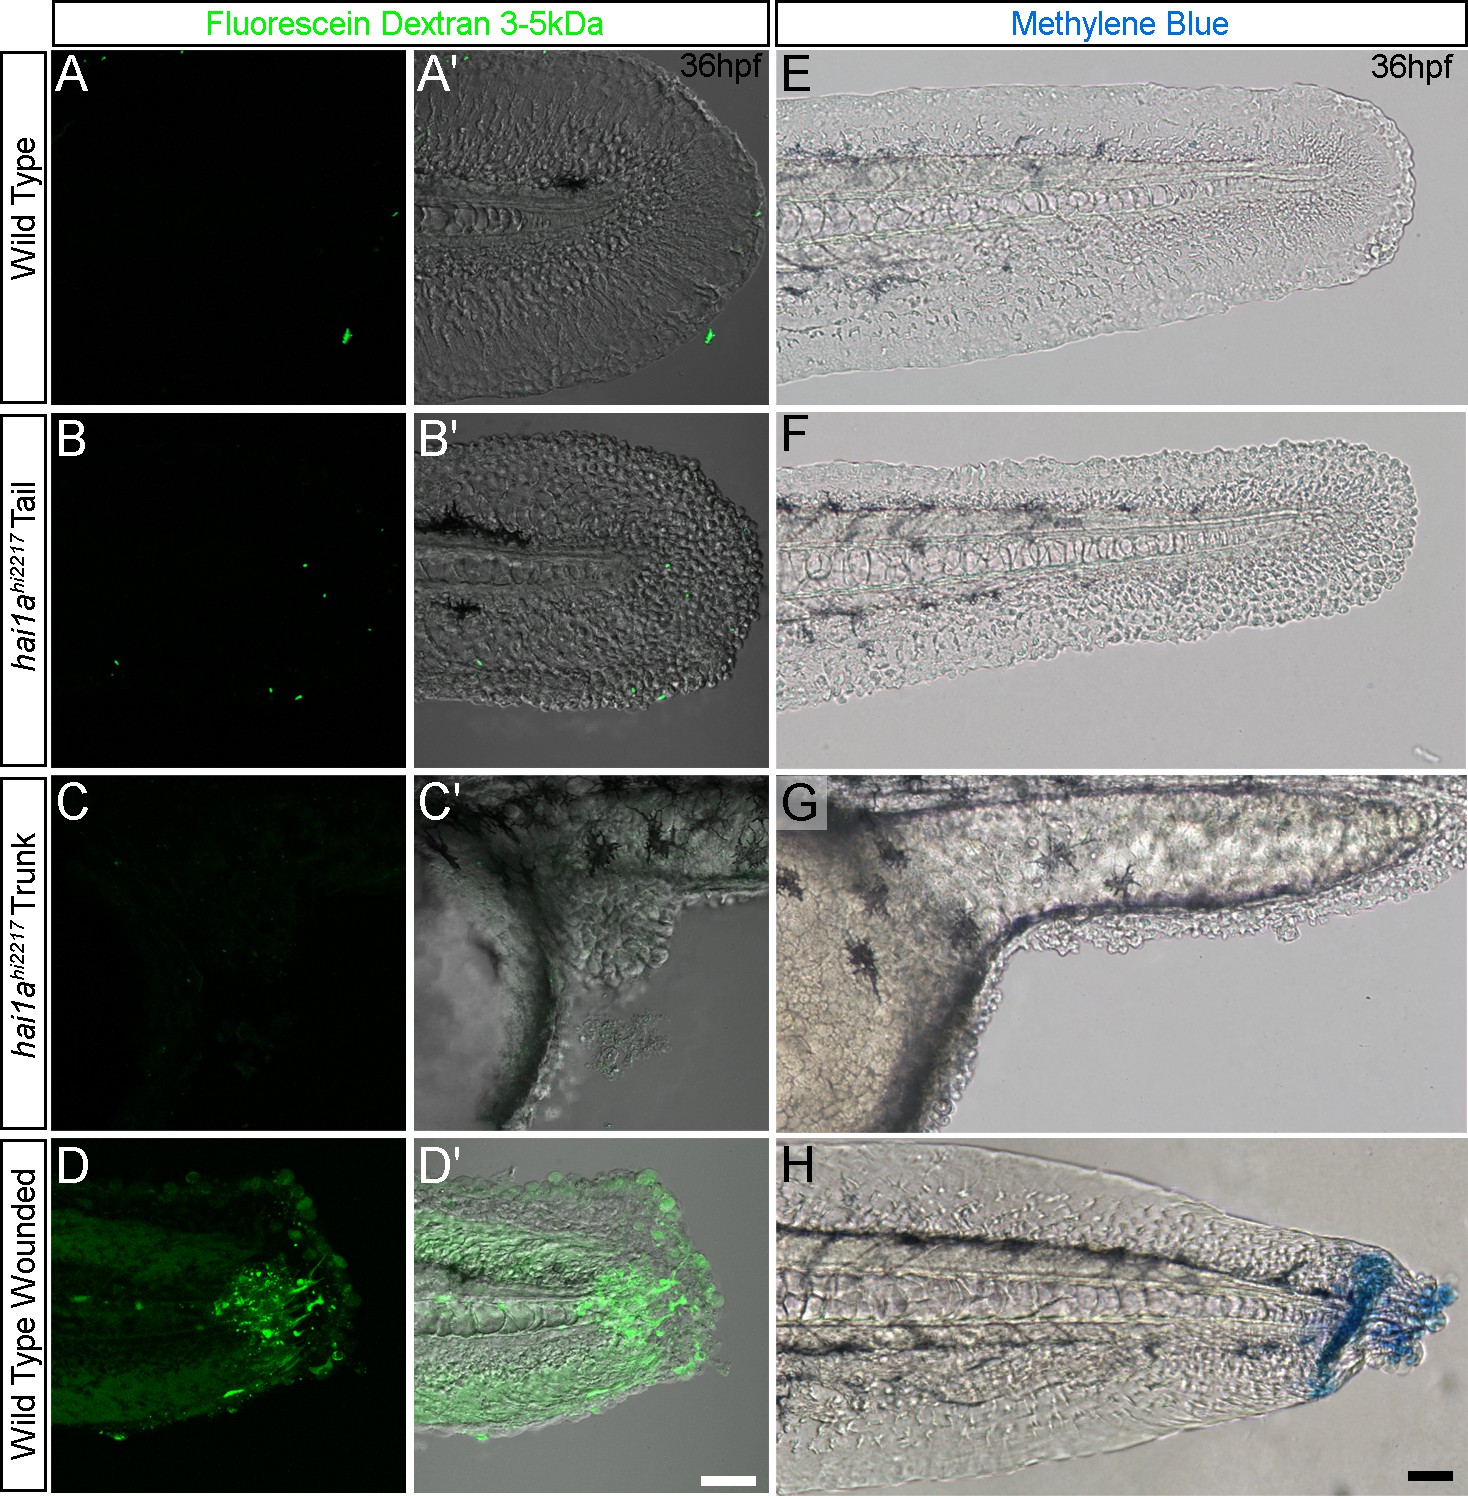
The barrier function of the hai1a epidermis is not grossly compromised.
(A–D′) Lateral confocal images of the tails (A–B′; D, D′) and trunk (C, C′) of 36hpf WT (A, A′; D, D′) and hai1ahi2217 embryos (B–C′) immersed in 2.5 mg/ml of 3–5 kDa fluorescein dextran for 30 min before brief destaining. Fluorescent images (A–D) are also shown overlaying DIC images (A′–D′). (E, F) Lateral DIC images of the tails (E, F, H) and trunk (G) of 36hpf WT (E, H) and hai1ahi2217 embryos (F, G) immersed in 0.075% of methylene blue for 30 min before brief destaining. Tails of WT embryos in (H) were wounded by scalpel cut before immersion. Scale bars: (D′, H) = 50 µm.
Figure 10 with 1 supplement

Altered RSK status in hai1ahi2217 accounts for epidermal defects.
(A, B) In situ hybridisation of rps6ka3a at 24hpf under low- (A) and high-power (B) magnification showing expression in basal keratinocytes. Open arrowheads in (B) indicate borders of EVL cells bisecting nuclei of underlying rps6ka3a-positive cells. (C–H′) Lateral projected confocal images of the tails of embryos immunostained for p90RSK (Phospho-Thr348) (C–H′) and TP63 (C′–H′). In both the hai1ahi2217 (D, D′) and 125 ng/ml phorbol 12-myristate 13-acetate (PMA)-treated (G, G′) embryos, there is an increase in cytoplasmic levels of p90RSK (Phospho-Thr348) signal above the nuclear only signal seen in WT (C, C′) or DMSO (F, F′). Treatment with the pERK inhibitor U0126 reduced cytoplasmic levels but did not affect nuclear signal (E, E′; H, H′), (I, J) Quantification of immunofluorescent intensity of cytoplasmic levels of p90RSK (Phospho-Thr348) in basal keratinocytes of tails of 48hpf WT and hai1ahi2217, treated with DMSO or U0126 (I), and PMA or PMA plus U0126 (J). Nucleus signal was excluded by masking from the DAPI channel. n = 5; t-test; ***p<0.001, **p<0.01, *p<0.05. (K–N) Lateral DIC images of hai1ahi2217 embryos at 24hpf (K, L) and 48hpf (M, N) untreated (K, M) or treated with 1.2 µM BI-D1870 (L) or 9 µM dimethyl fumarate (DMF). Locations of epidermal aggregates and loss of tail fin morphology in hai1a mutants, and their rescue by RSK inhibitor treatment are indicated by arrowheads. (O–Q) Lateral projected confocal images of the tails of embryos immunostained with antibodies against E-cadherin and TP63in WT (O, P) and hai1ahi2217 treated with DMF (Q). (O′–Q′) Profile plots of fluorescence distribution across cells of WT (O), hai1ahi2217 (P′), and hai1ahi2217 treated with DMF (Q′). X-axis represents width of the cell. β-Catenin immunofluorescence intensity (Y-axis) shows majority at cell edge (E-cadherin domain demarcated in light purple) and centre of cell (nucleus demarcated in light green) in WT and rescued hai11a mutants, but there is no clear membrane signal in the untreated hai1a mutants. Two cells per five larvae were analysed. Scale bars: (A, K, N) = 100 µM; (B, H) p=20 µM.
Figure 10—figure supplement 1

RSK inhibitors rescue the hai1a phenotype.
(A, B) Lateral projected confocal images of the yolk surface of 17hpf WT (A) and hai1ahi2217/ti251 (B) embryos immunostained for p90RSK (Phospho-Thr348). (C) Quantification of immunofluorescent intensity of cytoplasmic levels of p90RSK (Phospho-Thr348) in cells over the yolk of 17hpf WT and hai1ahi2217/ti251. Measurements were limited to keratinocyte cytoplasm by reading at sites between TP63-positive nuclei. n = 9 (three cells from three embryos each); Mann–Whitney test; **p<0.01. (D–G) Lateral projected confocal images of the tails of 48hpf hai1ahi2217 embryos, untreated (D, F) or treated with GFX109203 to inhibit PKC (E) or dimethyl fumarate (DMF) (G) and then immunostained for p90RSK (Phospho-Thr348). Levels of cytoplasmic p90RSK-Thr348 are reduced by both inhibitors. (H, I) Lateral DIC images of hai1ahi2217 embryos at 24hpf either untreated (H) or treated with 9 µM DMF (I). Locations of epidermal aggregates and loss of tail fin morphology in hai1a mutants, and their rescue by RSK inhibitor treatment are indicated by arrowheads. (J) Proportions of epidermal phenotypes from hai1ahi2217/hi2217 × hai1a+/hi2217 determined at 24hpf and 48hpf following treatments with DMSO, BI-D1870, or DMF. n = 100; Chi-squared test; ***p<0.001. (K, L) Lateral projected confocal images of trunks of 48hpf hai1ahi2217 embryos, untreated (K) or treated with 9 µM DMF (L), and then fluorescently immunostained for TP63. Scale bars: (A) = 200 µm; (D) = 100 µm.
Figure 11
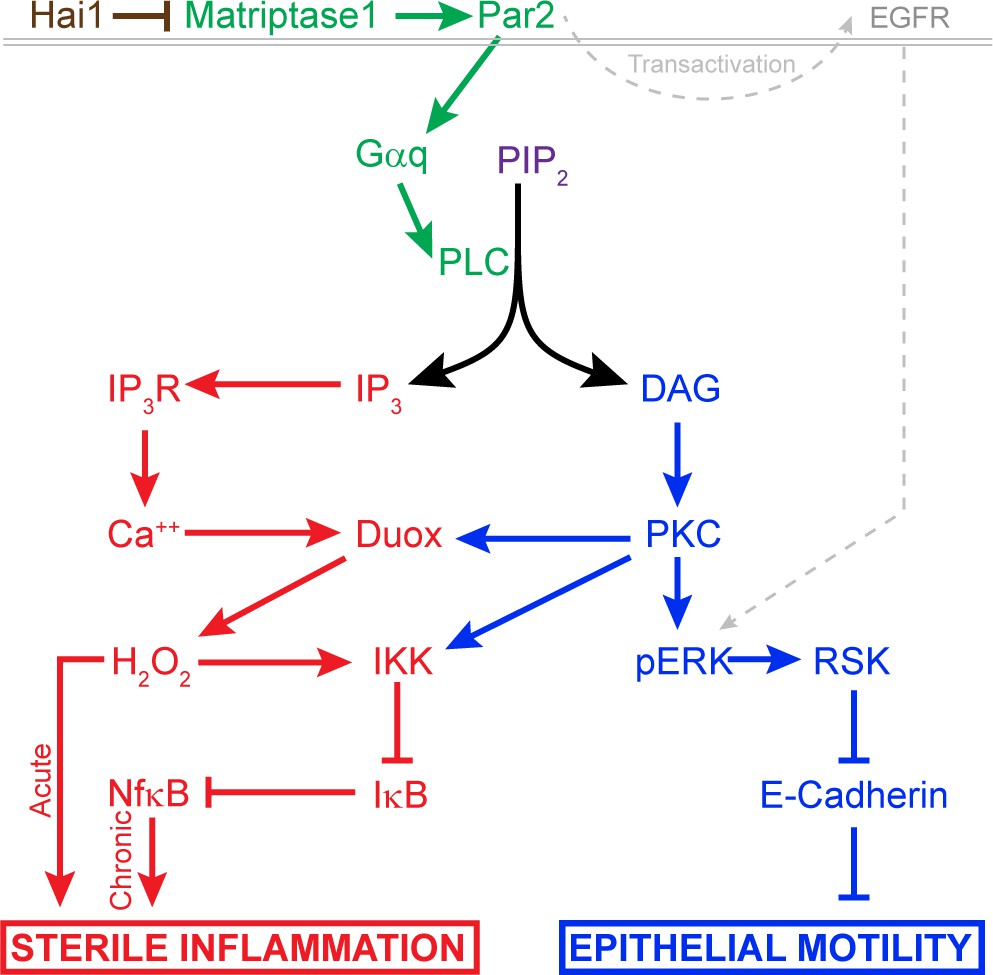
Model of pathway-activated downstream of Hai1 and Matriptase.
Proposed model of pathways downstream of Hai1 which drives chronic and acute sterile inflammation (red) and epithelial motility (blue). A previously defined transactivation of EGFR is also integrated. Other pathways known to act downstream of Matriptase, involving cMet, PI3K, AKT, and mTOR, are not shown.
Author response image 1
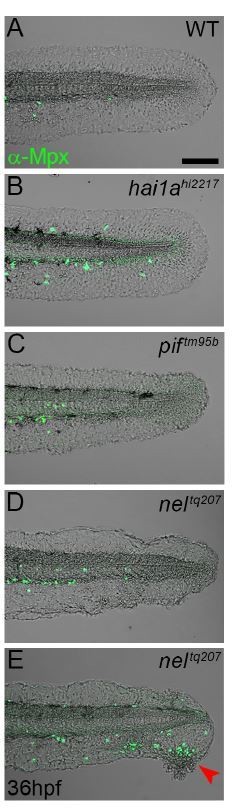
Epidermal detachment does not lead to increased neutrophil motility.
A-E: Lateral confocal images of the tails of 36hpf WT (A), hai1ahl227 (B), piftm95b (C), and neltq207 (D-E) immunofluorescently stained for Mpx (Green) and superimposed on the DIC channel. The sub-lamina densa blistering of the fins in pif and nel mutants does not lead to the epidermal inflammation seen in hai1a mutants. Only where there is epidermal damage and degeneration are neutrophils seen outside the vasculature, and then they only migrate to the damage site (E, red arrowhead). Scale bar A = 100μm.
Videos
Video 1
Neutrophils in WT and hai1ahi2217 4dpf larva.
Projected confocal timelapses of eGFP-positive neutrophils in the tail region of 4dpf Tg(mpx:eGFP)i114 (left) and hai1ahi2217; Tg(mpx:eGFP)i114 (right) larvae taken every 45 s for 45 min. Scale bar: 50 µm.
Video 2
Neutrophils in WT and hai1ahi2217 4dpf larva before and after fin wound.
Projected confocal timelapses of eGFP-positive neutrophils in the tail region of 4dpf Tg(mpx:eGFP)i114 (left) and hai1ahi2217; Tg(mpx:eGFP)i114 (right) larvae taken every 50 s for 250 min with the tail fin cut at 50 min. GFP is overlaid on DIC (Differential Interference Contrast) channel. Scale bar: 50 µm.
Video 3
Calcium dynamics in WT and hai1afr26 embryos at 24hpf.
Projected confocal timelapses of eGFP in the trunks (left side) and tails (right side) of a 24hpf WT (top row) and hai1afr26 (bottom row) embryos injected with GCaMP6s RNA, indicating calcium dynamics. Scale bar: 50 µm.
Video 4
Calcium dynamics in WT and hai1ahi2217 embryos at 16hpf.
Projected light-sheet timelapses of eGFP in WT (left side) and hai1ahi2217 (right side) embryos at 16hpf. Both embryos carried the Tg(actb2:GCaMP6s, myl7:mCherry)lkc2 transgene reporting calcium dynamics, which were higher in the hai1a mutant, particularly over the yolk. Images were taken every 45 s for 19 min. Scale bar: 50 µm.
Video 5
Calcium dynamics in DMSO and 2-APB-treated hai1afr26 embryos at 24hpf.
Projected confocal timelapses of eGFP signal in the trunks (left side) and tails (right side) of 24hpf hai1afr26 embryos injected with GCaMP6s RNA and treated with 0.03% DMSO (top row) and 2.5 µM 2-APB (bottom row), indicating reduced calcium dynamics following 2-APB treatment. Scale bar: 50 µm.
Video 6
Basal keratinocyte membrane and neutrophil dynamics in 3dpf wild-type and hai1ahi2217 larvae carrying the Tg(krtt1c19e:lyn-tdtomato)sq16 and Tg(mpx:eGFP)i114 transgenes.
Projected light-sheet timelapses of the trunk of 3dpf WT (left) and hai1ahi2217 (right) larvae with neutrophils and basal keratinocyte membranes labelled by eGFP and lyn-tdTomato, respectively. Both larvae carried the Tg(krtt1c19e:lyn-tdtomato)sq16; Tg(mpx:eGFP)i114 transgenes. The hai1a mutants have highly dynamic neutrophils and keratinocyte membrane dynamics. Scale bar: 20 µm.
Video 7
Basal keratinocyte membranes in DMSO and phorbol 12-myristate 13-acetate (PMA)-treated 3dpf Tg(krtt1c19e:lyn-tdtomato)sq16 larvae.
Zoomed projected light-sheet timelapses of basal keratinocyte membranes labelled by lyn-tdTomato in the trunk of 3dpf Tg(krtt1c19e:lyn-tdtomato)sq16 larvae treated with 0.1% DMSO (left) and 37.5 ng/ml PMA (middle and right) for 18 hr. Membranes are stable in DMSO-treated larvae but were dynamic in PMA-treated larvae. Images were captured every 20 s. Scale bar: 10 µm.
Video 8
Neutrophils and basal keratinocyte membranes in DMSO and phorbol 12-myristate 13-acetate (PMA)-treated 3dpf Tg(krtt1c19e:lyn-tdtomato)sq16; Tg(mpx:eGFP)i114 larvae.
Lateral projection of light-sheet timelapse of neutrophils labelled by eGFP and basal keratinocyte cell membranes labelled by lyn-tdTomato in the trunks of 3dpf Tg(krtt1c19e:lyn-tdtomato)sq16 larva treated with 0.1% DMSO (left) and 37.5 ng/ml PMA (right) for 18 hr. PMA treatment leads to slightly dynamic cell membranes and motile neutrophils. Images were captured every 20 s for 30 min. Scale bar: 50 µm.
Tables
Table 1
Prevalence of otolith and epithelial phenotypes in hai1a and st14a double mutants: p<0.0001 (Chi-squared test).
| hai1a+/hi2217; st14a+/sq10 ♂ × hai1ahi2217/hi2217; st14asq10/sq10 ♀ | |||
|---|---|---|---|
| Observed (expected) | WT epidermis | hai1a epidermis | Total |
| Wild-type otoliths | 72 (65) | 60 (65) | 132 (130) |
| No otoliths | 128 (65) | 0 (65) | 128 (130) |
| Total | 200 (130) | 60 (130) | 260 |
Key resources table
| Reagent type (species) or resource | Designation | Source or reference | Identifiers | Additional information |
|---|---|---|---|---|
| Gene (Danio rerio) | hai1a | GenBank | NM_213152 | =spint1a |
| Gene (Danio rerio) | matriptase1a | GenBank | NM_001040351 | =st14 a |
| Gene (Danio rerio) | duox | GenBank | XM_017354273 | =dual oxidase |
| Gene (Danio rerio) | ikbkg | GenBank | NM_001014344 | =ikky =nemo |
| Gene (Danio rerio) | nfkbiaa | GenBank | NM_213184 | =ikbaa |
| Gene (Danio rerio) | rps6ka3a | GenBank | NM_212786 | =RSK2a =p90RSK2a |
| Gene (Danio rerio) | tp63 | GenBank | NM_152986 | =delta Np63 |
| Strain, strain background (Escherichia coli) | Top10 | Invitrogen | C404010 | Chemical competent cells |
| Strain, strain background (Danio rerio) | AB | ZIRC | Wild-type strain | |
| Strain, strain background (Danio rerio) | TL | ZIRC | Wild-type strain | |
| Genetic reagent (Danio rerio) | Tg(mpx:EGFP)i114 | Uni of Sheffield PMID:16926288 | ZFIN ID: ZDB-ALT-070118-2 | |
| Genetic reagent (Danio rerio) | Tg(fli1:EGFP)y1 | ZIRC PMID:16671106 | ZFIN ID: ZDB-ALT-011017-8 | |
| Genetic reagent (Danio rerio) | hai1afr26 | Hammerschmidt lab; Max Planck Freiburg PMID:31819976 | ZFIN ID: ZDB-ALT-200618-2 | =spint1afr26 |
| Genetic reagent (Danio rerio) | hai1ahi2217 | Nancy Hopkins lab; Massachusetts Institute of Technology PMID:17728346 | ZFIN ID: ZDB-ALT-040924-4 | =spint1ahi2217Tg |
| Genetic reagent (Danio rerio) | ddfti251 | Nuesslein-Volhard lab; Max Planck Tuebingen PMID:9007245 | ZFIN ID: ZDB-ALT-980203-1462 | =dandruff spint1ati251 ==hai1ati251 |
| Genetic reagent (Danio rerio) | ddft419 | Nuesslein-Volhard lab; Max Planck Tuebingen PMID:9007245 | =dandruff spint1at419 ==hai1at419 | |
| Genetic reagent (Danio rerio) | st14asq10 | Our lab PMID:31645615 | ZFIN ID: ZDB-ALT-200219-5 | |
| Genetic reagent (Danio rerio) | Tg(6xNFkB:EGFP)nc1 | Rawls lab PMID:21439961 | ZFIN ID: ZDB-ALT-120409-6 | |
| Genetic reagent (Danio rerio) | Tg(krtt1c19e:LY-Tomato)sq16 | Our lab. Lee et al: PMID:24400120 | ZFIN ID: ZDB-ALT-140424-2 | |
| Genetic reagent (Danio rerio) | Tg(actb2:GCaMP6s, myl7:mCherry)lkc2 | This paper | Plasmid from Solnica-Krezel Lab. Injected with Tol2 RNA to make line | |
| Antibody | Chicken anti-eGFP antibody | Abcam | ab13970, RRID:AB_300798 | 1:500 |
| Antibody | Rabbit anti-eGFP | Torrey Pines Biolabs | Tp401 RRID:AB_10013661 | 1:500 |
| Antibody | Rabbit anti-FITC | Thermo Fisher Scientific | 71-1900 RRID:AB_2533978 | 1:200 |
| Antibody | Rabbit anti-p90RSK (Phospho-Thr348) | GenScript | A00487 | 1:100 |
| Antibody | Rabbit anti-beta catenin | Abcam | ab6302 RRID:AB_305407 | 1:200 |
| Antibody | Mouse anti-E-cadherin | BD Biosciences | 610181 RRID:AB_397580 | 1:200 |
| Antibody | Mouse anti-Tp63 | Biocare Medical | CM163 RRID:AB_10582730 | 1:200 |
| Antibody | Rabbit anti-phospho-p44/42 MAPK (Erk1/2) (Thr202/Tyr204) | Cell Signaling Technology | Cat# 4370, RRID:AB_2315112 | 1:100 |
| Antibody | Rabbit anti-p44/42 MAPK (Erk1/2) | Cell Signaling Technology | Cat# 9102, RRID:AB_330744 | 1:100 |
| Antibody | Alexa Fluor-488 Donkey anti-rabbit | Life Technologies | A21206 RRID:AB_2535792 | 1:700 |
| Antibody | Alexa Fluor-647 Donkey anti-rabbit | Life Technologies | A31573 RRID:AB_253618 | 1:700 |
| Antibody | Alexa Fluor-546 Donkey anti-mouse | Life Technologies | A10036 RRID:AB_2534012 | 1:700 |
| Antibody | Alexa Fluor-488 Goat anti-chicken | Life Technologies | A11039 RRID:AB_2534096 | 1:700 |
| Recombinant DNA reagent | pCS2+-PKCδ-GFP | Amaya Lab, Uni of Manchester PMID:15866160 | For making PKCd-GFP RNA | |
| Recombinant DNA reagent | pT3Ts-Tol2 | Ekker Lab, Mayo Clinic PMID:17096595 | Addgene Plasmid #31831 RRID:Addgene_31831 | |
| Recombinant DNA reagent | pCS2+-GCaMP6s | Solnica-Krezel Lab, Washington University School of Medicine, St. Louis, MO | For making GCaMP6s RNA | |
| Recombinant DNA reagent | p(actb2:GCaMP6s, myl7:mCherry) | Solnica-Krezel Lab, Washington University School of Medicine, St. Louis, MO. PMID:28322738 | For making stable transgenic line | |
| Sequence-based reagent | duox morpholino | GeneTools | PMID:19494811 | 5′ AGTGAATTAGAGAAATGCACCTTTT 3′ (0.4 mM) |
| Sequence-based reagent | p53 morpholino | GeneTools | PMID:19494811 | 5′ GCGCCATTGCTTTGCAAGAATTG 3′ (0.2 mM) |
| Sequence-based reagent | Oligo(dT)12–18 Primer | Invitrogen | PMID:18418012 | |
| Sequence-based reagent | nfkbiaa | This paper | PCR primers | F-5′ AGACGCAAAGGAGCAGTGTAG 3′ R- 5′ TGTGTGTCTGCCGAAGGTC 3′ |
| Sequence-based reagent | eef1a1l1 | This paper | PCR primers | F′-5′ CTGGAGGCCAGCTCAAACAT 3′ R-5′ ATCAAGAAGAGTAGTACCGCTAGCATTAC 3′ |
| Sequence-based reagent | rps6ka3a in situ probe | This paper | PCR primers for cloning probe | F′-5′ ATACTCCAGTCCCACCGGA 3′ R- 5′TGGTGATGATGGTAGACTCGC 3′ |
| Peptide, recombinant protein | Proteinase K | Thermo Scientific | EO0491 | 0.5 μg/μl |
| Commercial assay or kit | SuperScript III Reverse Transcriptase | Invitrogen | 18080093 | |
| Commercial assay or kit | TRIzol Reagent | Invitrogen | 15596026 | |
| Commercial assay or kit | GoTaq G2 Green Master Mix | Promega | M7823 | Functions used: TrackMate Reslice Average Intensity |
| Commercial assay or kit | iTaq Universal SYBR Green Supermix | Bio-Rad | 1725121 | Functions used: Spot |
| Commercial assay or kit | mMESSAGE mMACHINE SP6 Transcription Kit | Invitrogen | AM1340 | Tests: Student’s t-test, Chi-squared test, Mann–Whitney test, ANOVA with Bonferroni or Dunn’s post-tests |
| Commercial assay or kit | mMESSAGE mMACHINE T3 Transcription Kit | Invitrogen | AM1348 | |
| Commercial assay or kit | MEGAshortscript T7 Transcription Kit | Invitrogen | AM1350 | |
| Commercial assay or kit | pGEM-T Easy | Promega | A137A | |
| Commercial assay or kit | pCR 2.1-TOPO TA vector | Invitrogen | K450040 | |
| Commercial assay or kit | QIAquick PCR Purification Kit | Qiagen | 28104 | |
| Commercial assay or kit | DIG RNA Labeling Kit | Roche | 11175025910 | |
| Commercial assay or kit | SP6 RNA Polymerase | Roche | 10 810 274 001 | |
| Commercial assay or kit | NBT/BCIP Stock Solution | Roche | 11681451001 | |
| Chemical compound, drug | Diphenyleneiodonium chloride | Sigma-Aldrich | D2926 | 40 μM |
| Chemical compound, drug | Thapsigargin | Sigma-Aldrich | T9033 | 6.25 μM |
| Chemical compound, drug | Bisindolylmaleimide I (GF109203X) | Selleckchem | S7208 | 85 μM |
| Chemical compound, drug | YM-254890 | FocusBiomolecules | 10-1590-0100 | 32 μM |
| Chemical compound, drug | 2-Aminoethyl diphenylborinate | Sigma-Aldrich | D9754 | 2.5 μM |
| Chemical compound, drug | BI-D1870 | Axon Medchem | Axon-1528 | 1.2 μM |
| Chemical compound, drug | Dimethyl fumarate | Sigma-Aldrich | 242926 | 9 μM |
| Chemical compound, drug | Phorbol 12-myristate 13-acetate | Sigma-Aldrich | P8139 | 37.5 or 125 ng/ml |
| Chemical compound, drug | U0126 | Cell Signaling Technology | 9903 | 100 μM |
| Chemical compound, drug | PD184352 (CI-1040) | Selleckchem | S1020 | 1.3 μM |
| Chemical compound, drug | DAPI (4′,6-diamidino-2-phenylindole, dihydrochloride) | Invitrogen | D1306 | 5 µg/ml |
| Chemical compound, drug | Penta-fluorobenzenesulfonyl fluorescein | Cayman Chemicals | 10005983 | 12.5 μM |
| Chemical compound, drug | Fluorescein isothiocyanate–dextran | Sigma-Aldrich | FD4 | 2.5 mg/ml |
| Software, algorithm | Fiji (ImageJ 1.52p) | NIH | https://imagej.nih.gov/ | Functions used: TrackMate Reslice Average Intensity |
| Software, algorithm | Imaris 9.6.0 | Oxford Instruments | Functions used: Spot | |
| Software, algorithm | Prism 9.1.1 | GraphPad | Tests: Student’s t-test, Chi-squared test, Mann–Whitney test, ANOVA with Bonferroni or Dunn’s post-tests | |
| Software, algorithm | Photoshop 22.1.1 release | Adobe |
Additional files
Download links
A two-part list of links to download the article, or parts of the article, in various formats.
Downloads (link to download the article as PDF)
Open citations (links to open the citations from this article in various online reference manager services)
Cite this article (links to download the citations from this article in formats compatible with various reference manager tools)
Matriptase activation of Gq drives epithelial disruption and inflammation via RSK and DUOX
eLife 10:e66596.
https://doi.org/10.7554/eLife.66596


