Matriptase activation of Gq drives epithelial disruption and inflammation via RSK and DUOX
- Lee Kong Chian School of Medicine, Experimental Medicine Building, Yunnan Garden Campus, 59 Nanyang Drive, Nanyang Technological University, Singapore
- Institute of Molecular and Cell Biology (IMCB), A*STAR (Agency for Science, Technology and Research), Singapore
- Division of Cell Matrix Biology and Regenerative Medicine, School of Biological Sciences, Faculty of Biology, Medicine and Health, University of Manchester, United Kingdom
- Department of Molecular Biology and Biotechnology, University of Sheffield, United Kingdom
- Department of Biological Sciences, National University of Singapore, Singapore
- Department of Pediatrics, Yong Loo Ling School of Medicine, National University of Singapore, Singapore
Abstract
Epithelial tissues are primed to respond to insults by activating epithelial cell motility and rapid inflammation. Such responses are also elicited upon overexpression of the membrane-bound protease, Matriptase, or mutation of its inhibitor, Hai1. Unrestricted Matriptase activity also predisposes to carcinoma. How Matriptase leads to these cellular outcomes is unknown. We demonstrate that zebrafish hai1a mutants show increased H2O2, NfκB signalling, and IP3R -mediated calcium flashes, and that these promote inflammation, but do not generate epithelial cell motility. In contrast, inhibition of the Gq subunit in hai1a mutants rescues both the inflammation and epithelial phenotypes, with the latter recapitulated by the DAG analogue, PMA. We demonstrate that hai1a has elevated MAPK pathway activity, inhibition of which rescues the epidermal defects. Finally, we identify RSK kinases as MAPK targets disrupting adherens junctions in hai1a mutants. Our work maps novel signalling cascades mediating the potent effects of Matriptase on epithelia, with implications for tissue damage response and carcinoma progression.
eLife digest
Cancer occurs when normal processes in the cell become corrupted or unregulated. Many proteins can contribute, including one enzyme called Matriptase that cuts other proteins at specific sites. Matriptase activity is tightly controlled by a protein called Hai1. In mice and zebrafish, when Hai1 cannot adequately control Matriptase activity, invasive cancers with severe inflammation develop. However, it is unclear how unregulated Matriptase leads to both inflammation and cancer invasion.
One outcome of Matriptase activity is removal of proteins called Cadherins from the cell surface. These proteins have a role in cell adhesion: they act like glue to stick cells together. Without them, cells can dissociate from a tissue and move away, a critical step in cancer cells invading other organs. However, it is unknown exactly how Matriptase triggers the removal of Cadherins from the cell surface to promote invasion.
Previous work has shown that Matriptase switches on a receptor called Proteinase-activated receptor 2, or Par2 for short, which is known to activate many enzymes, including one called phospholipase C. When activated, this enzyme releases two signals into the cell: a sugar called inositol triphosphate, IP3; and a lipid or fat called diacylglycerol, DAG. It is possible that these two signals have a role to play in how Matriptase removes Cadherins from the cell surface.
To find out, Ma et al. mapped the effects of Matriptase in zebrafish lacking the Hai1 protein. This revealed that Matriptase increases IP3 and DAG levels, which initiate both inflammation and invasion. IP3 promotes inflammation by switching on pro-inflammatory signals inside the cell such as the chemical hydrogen peroxide. At the same time, DAG promotes cell invasion by activating a well-known cancer signalling pathway called MAPK. This pathway activates a protein called RSK. Ma et al. show that this protein is required to remove Cadherins from the surface of cells, thus connecting Matriptase’s activation of phospholipase C with its role in disrupting cell adhesion.
An increase in the ratio of Matriptase to HAI-1 (the human equivalent of Hai1) is present in many cancers. For this reason, the signal cascades described by Ma et al. may be of interest in developing treatments for these cancers. Understanding how these signals work together could lead to more direct targeted anti-cancer approaches in the future.
Introduction
The transmembrane serine protease, Matriptase, encoded by the ST14 gene, has potent oncogenic properties and is consistently dysregulated in human carcinomas. Overexpression of Matriptase in the mouse epidermis leads to epidermal papillomas, ulcerative and invasive carcinomas, and inflammation (List et al., 2005; Martin and List, 2019). These effects of Matriptase are mitigated by a cognate serine protease inhibitor, HAI-1. Clinically, an increase in the Matriptase:HAI-1 ratio has been found in a range of tumours and is predictive of poor outcome (Martin and List, 2019). Loss of mouse Hai1 leads to epidermal and intestinal barrier defects, epithelial inflammation, and failure of placental labyrinth formation, which are all due to unrestricted Matriptase activity (Kawaguchi et al., 2011; Nagaike et al., 2008; Szabo et al., 2007). The response of epithelia to unregulated Matriptase activity appears conserved across vertebrates. Mutation of the zebrafish orthologue, Hai1a, also results in epidermal defects, including loss of membrane E-cadherin, aberrant mesenchymal behaviour of keratinocytes, which form cell aggregations over the body and loss of fin fold integrity. The epidermis also displays sterile inflammation and is invaded by highly active neutrophils. Genetic ablation of the myeloid lineage demonstrated that the keratinocyte phenotypes are not a consequence of the inflammation (Carney et al., 2007). The strong hai1afr26 allele is embryonic lethal, dying within the first week, whilst the more mild allele, hai1ahi2217, is semi-viable, with epithelial defects resolved through sphingosine-1-phosphate-mediated entosis and cell extrusion (Armistead et al., 2020). All hai1a mutant phenotypes can be ameliorated by reduction of Matriptase levels (Carney et al., 2007; Mathias et al., 2007).
Due to the clinical implications of its dysregulation, the signalling pathways activated pathologically by Matriptase are of interest. The G-protein-coupled receptor, proteinase-activated receptor-2 (Par2), is essential for the oncogenic and inflammatory effects of uninhibited Matriptase in zebrafish and mouse (Sales et al., 2015; Schepis et al., 2018). Par2 is directly activated by Matriptase proteolysis and signals through a number of heterotrimeric Gα protein subunits. Early studies in keratinocytes linked Par2 activation with intracellular Ca++ mobilisation via phospholipase C, thus implicating Gq subunit as the canonical target (Schechter et al., 1998). Alternate Gα subunits, including Gi, Gs, and G12/13, are now known to also be activated by Par2 (Zhao et al., 2014). Par2 displays biased agonism, and the logic of the pathway utilised depends on cell context and the activating protease. In vitro experiments using HEK293 cells implicated both Par2 and Gi in Matriptase-mediated Nfκb pathway activation (Sales et al., 2015). Whilst this explains the inflammatory phenotype of uninhibited Matriptase, it does not address whether Par2 promotes carcinoma phenotypes directly in keratinocytes in vivo. In zebrafish, as the keratinocyte defects are not dependent on inflammation, but are dependent on Par2, it is likely that there is a direct effect of Par2 on promoting keratinocyte motility. Par2 can also transactivate EGFR through an unknown mechanism, and inhibition of EGFR alleviates certain basal keratinocyte phenotypes of zebrafish hai1a mutants (Schepis et al., 2018). Thus, the identity, contribution, and interactions of the pathways downstream of Matriptase and Par2 remain unclear. Here through use of the zebrafish hai1a mutant, we comprehensively map the essential pathways downstream of zebrafish Matriptase and Par2, leading to inflammation and epithelial disruption.
Results
Increased hydrogen peroxide and calcium flashes contribute to inflammation in hai1a mutants
Neutrophils in hai1a embryos invade the epidermis, are highly motile, but move randomly (Carney et al., 2007; Mathias et al., 2007; Figure 1A–E, Video 1). To establish the nature of their stimulus, we tested if neutrophils in hai1a altered their behaviour in the presence of a large fin wound. In wild-type larvae, neutrophils were recruited from a great distance and tracked to the wound with high directionality. However, neutrophils in the hai1a mutant appeared largely apathetic to the wound and remained migrating randomly. There was a mild increase in neutrophil speed in hai1a larvae following wounding, indicating that they retain capacity to respond to additive stimuli (Figure 1—figure supplement 1A–D, Video 2). Co-labelling of basal keratinocyte nuclei (using TP63 immunostaining), neutrophils (Tg(fli1:EGFP)y1 transgenic), and TUNEL labelling of apoptotic cells highlighted that whilst the epidermis of hai1a mutants, unlike WT, had regions of apoptosis at 24hpf (arrowhead, Figure 1—figure supplement 1E, F), neutrophils were not associated, but rather found at nascent TUNEL-negative aggregates of basal keratinocytes (arrow). We conclude that epidermal cell death does not directly contribute to inflammation and that the effector stimulating neutrophils in hai1a mutants is as, or more, potent as that of wounds.
Figure 1 with 1 supplement see all
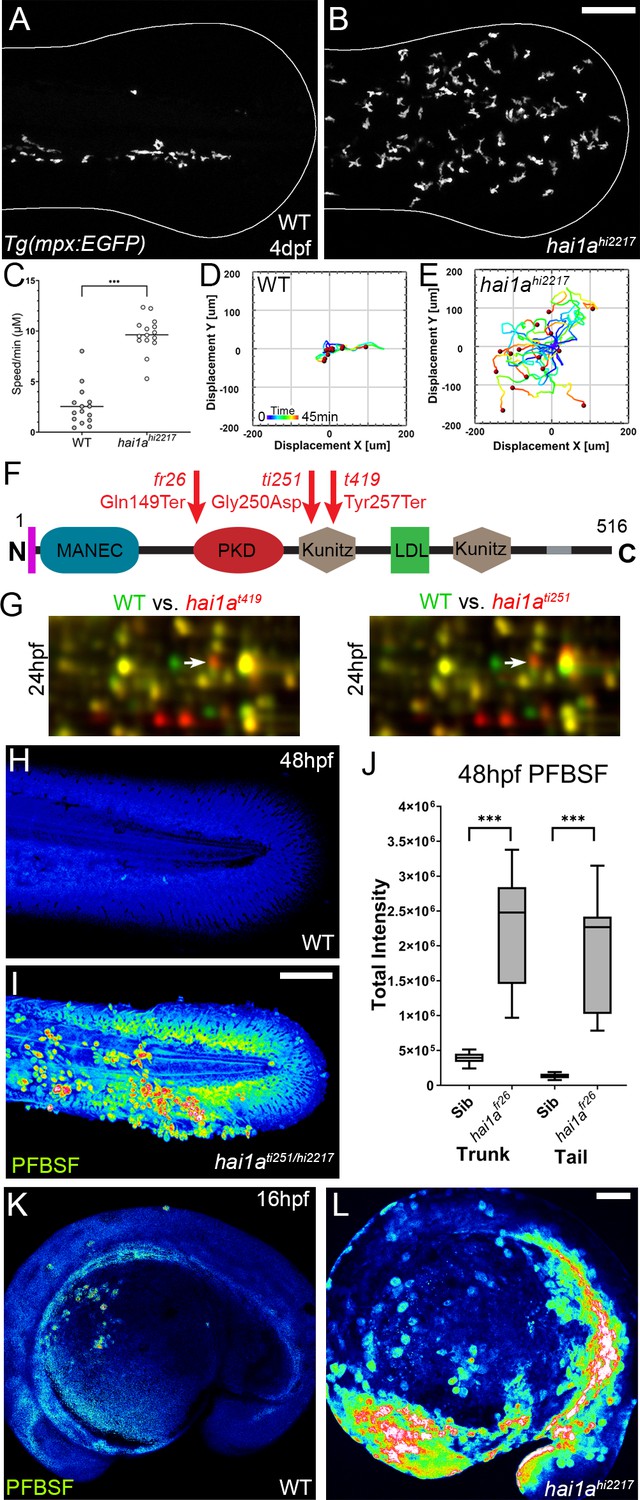
The epidermis of hai1a mutants displays elevated hydrogen peroxide.
(A, B) Projected confocal images showing neutrophils populate the tail of hai1ahi2217 mutants (B) but just the vasculature of WT (A) at 4dpf labelled by the Tg(mpx:EGFP)i114 line. Fin extremity outlined in white. (C) Neutrophils move significantly faster in hai1ahi2217 than WT. n = 15; t-test; ***p<0.001. (D, E) Tracks of neutrophil migration taken from Video 1 in WT (D) and hai1ahi2217 (E). (F) Schematic of the Hai1a protein with protein domains given, signal peptide as purple line and transmembrane domain as grey line. Location and nature of the fr26 and two dandruff alleles, ti251 and t419 given. (G) Selected region of 2D gel of protein extracted from 24hpf embryos for hai1at419 (left) or hai1ati251 (right) in red, superimposed over WT protein samples (green in both). The shift in pI of peroxiredoxin4 in both alleles is indicated with an arrow. (H, I) Projected lateral confocal views of pentafluorobenzenesulfonyl fluorescein (PFBSF) staining of WT (H) and hai1ati251/hi2217 (I) tail fins at 48hpf. (J) Box and whiskers plot of PFBSF fluorescent staining intensity of WT and hai1afr26 mutants at 48hpf in trunk and tail. n = 9; t-test ***p<0.001. (K, L) Projected lateral confocal views of PFBSF staining of WT (K) and hai1ahi2217 (L) at 16hpf. Scale bars: (B, I, L) = 100 µm.
-
Figure 1—source data 1
2D proteomics protein ID report list of the spot identities with significant ratio changes.
- https://cdn.elifesciences.org/articles/66596/elife-66596-fig1-data1-v2.xls
-
Figure 1—source data 2
2D proteomics protein ratio changes for each of the protein spots identified as significantly changed.
- https://cdn.elifesciences.org/articles/66596/elife-66596-fig1-data2-v2.xls
-
Figure 1—source data 3
2D proteomics top 50 proteins significantly changed in hai1a mutants.
- https://cdn.elifesciences.org/articles/66596/elife-66596-fig1-data3-v2.pdf
Video 1
Neutrophils in WT and hai1ahi2217 4dpf larva.
Projected confocal timelapses of eGFP-positive neutrophils in the tail region of 4dpf Tg(mpx:eGFP)i114 (left) and hai1ahi2217; Tg(mpx:eGFP)i114 (right) larvae taken every 45 s for 45 min. Scale bar: 50 µm.
Video 2
Neutrophils in WT and hai1ahi2217 4dpf larva before and after fin wound.
Projected confocal timelapses of eGFP-positive neutrophils in the tail region of 4dpf Tg(mpx:eGFP)i114 (left) and hai1ahi2217; Tg(mpx:eGFP)i114 (right) larvae taken every 50 s for 250 min with the tail fin cut at 50 min. GFP is overlaid on DIC (Differential Interference Contrast) channel. Scale bar: 50 µm.
To identify the neutrophil activator in hai1a, we employed an unbiased approach using 2D gel proteomics to compare the wild-type proteome with that of strong hai1a alleles. The dandruff (ddf) mutant has many phenotypic similarities to the strong hai1afr26 allele (van Eeden et al., 1996). Crosses between ddfti251 or ddft419 and hai1ahi2217 failed to complement, and sequencing of hai1a cDNA from both ddf alleles identified a nonsense mutation in the ddft419 allele (c.771T>G; p.Tyr257Ter) and a missense mutation of a highly conserved amino acid in the ddfti251 allele (c.749G>A; p.Gly250Asp) (Figure 1F, Figure 1—figure supplement 1G–I). We used both alleles for comparative 2D protein gel analysis at 24hpf and 48hpf. Rather than finding proteins with altered molecular weight, Peroxiredoxin4 (Prdx4) was identified as having a higher pI in both hai1at419 and hai1ati251 mutants at 24hpf and 48hpf, indicative of a change in oxidation state (Figure 1G, Figure 1—figure supplement 1J, K). Peroxiredoxins are hydrogen peroxide scavengers, and its altered oxidation state suggested that hai1a has higher H2O2 levels, a known activator of inflammation in larval zebrafish (Niethammer et al., 2009). Pentafluorobenzenesulfonyl fluorescein (PFBSF) staining Maeda et al., 2004 demonstrated significantly higher levels of H2O2 in the trunk and tails of hai1a mutants at 24hpf and 48hpf (Figure 1H–J, Figure 1—figure supplement 1L, M). This increase in H2O2 in hai1a was observed as early as 16hpf, and thus preceded presentation of hai1a phenotypes (Figure 1K, L).
To demonstrate that, as with other phenotypes, the H2O2 increase in hai1a was due to unrestrained activity of Matriptase1a, we used a matriptase1a mutant allele, st14asq10, which prematurely terminates the protein at 156 amino acids (Figure 2A, Figure 2—figure supplement 1A–C; Lin et al., 2019). Zygotic st14a mutants showed no overt phenotype; however, maternal zygotic mutants lacked ear otoliths (Figure 2B, C). As expected, when crossed into the hai1a background, embryos lacking otoliths (st14asq10; hai1ahi2217 double mutants) never displayed the hai1a epidermal and neutrophil phenotypes (Figure 2D–F; Table 1). Double mutants also had significantly reduced H2O2 levels (Figure 2F, Figure 2—figure supplement 1D). To determine if reduced H2O2 could account for the rescue of hai1a phenotypes by st14a mutation, we used genetic and pharmacological inhibition of the main enzyme responsible for generating H2O2 in zebrafish, Duox. A morpholino directed against duox successfully reduced H2O2 levels (Figure 2, Figure 2—figure supplement 1D) and neutrophil inflammation in hai1a mutants but did not rescue the epithelial defects (Figure 2F, G). Treatment with a known Duox inhibitor, diphenyleneiodonium (DPI), also resulted in amelioration of neutrophil inflammation, but not epithelial aggregates, in hai1a mutants (Figure 2G, Figure 2—figure supplement 1E). We conclude that Matriptase1 activity leads to excess H2O2 in hai1a mutants, which partially accounts for the neutrophil inflammation, but not epidermal defects.
Figure 2 with 1 supplement see all
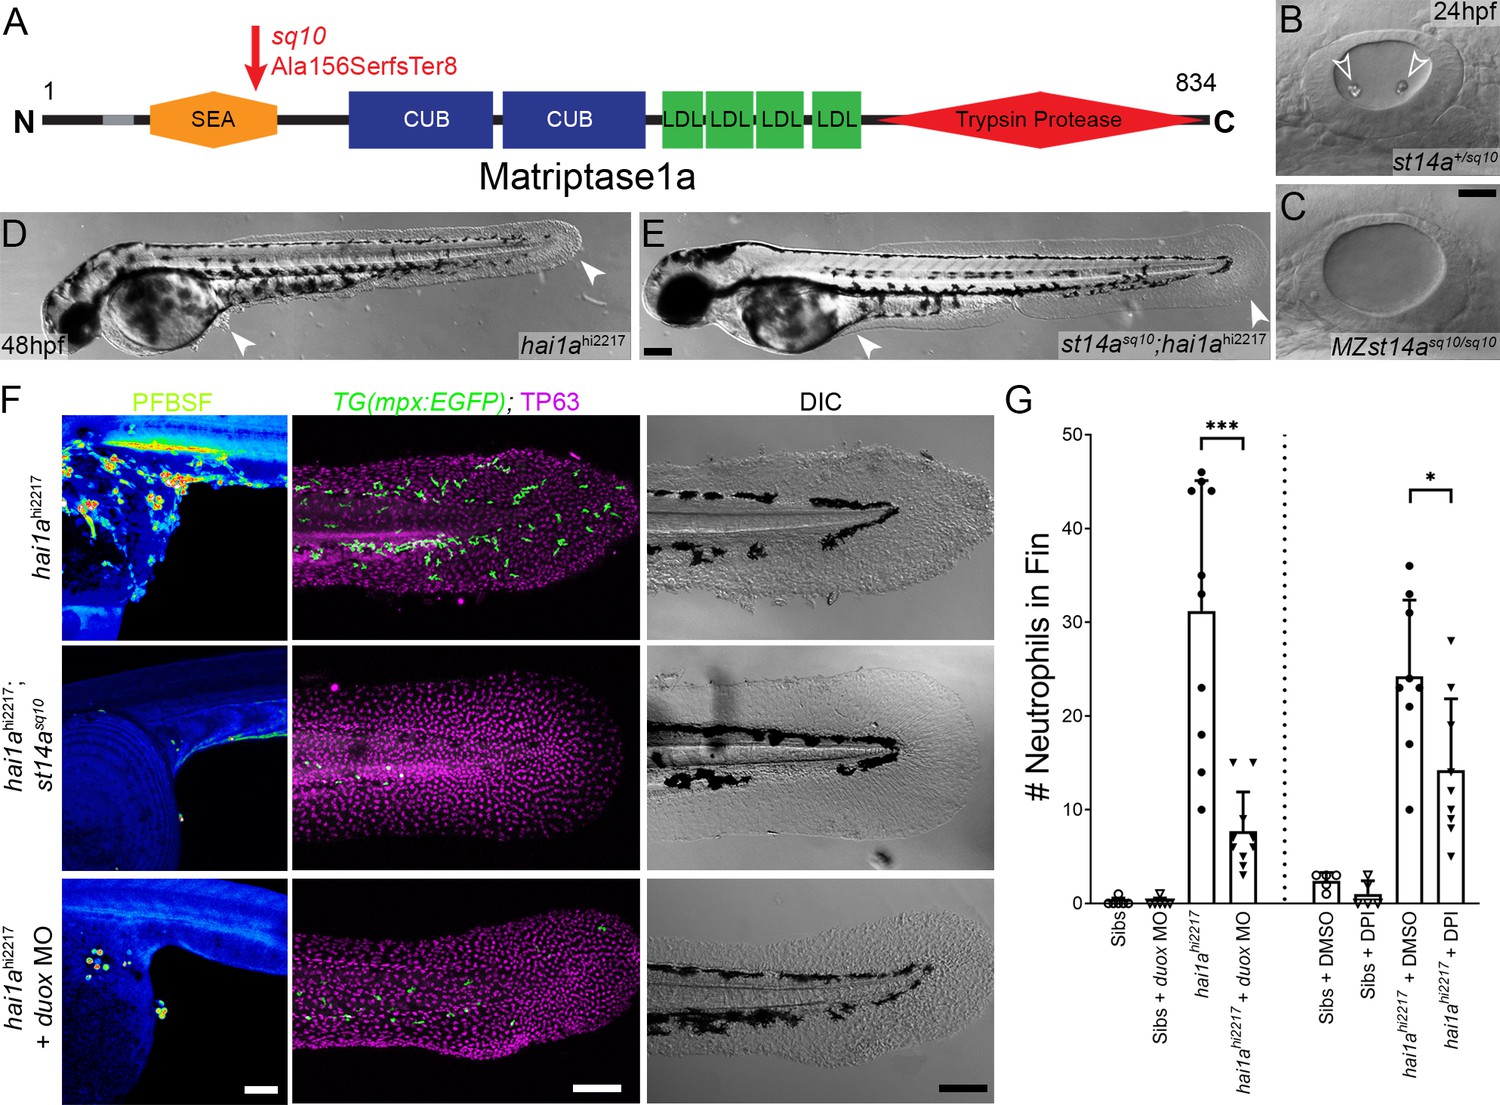
Loss of Matriptase1a or Duox1 reduces H2O2 and neutrophils in hai1a mutants.
(A) Schematic of the Matriptase1a protein with domains given and transmembrane domain as grey line. Location and nature of the sq10 allele given by red arrow. (B, C) Lateral DIC (Differential Interference Contrast) images of st14a+/sq10 (B) and MZ st14asq10 (C) otic vesicles at 24hpf showing absence of otoliths (arrowheads in B) in the maternal zygotic st14a mutants. (D, E) Lateral DIC images of hai1ahi2217 single mutant (D) and st14asq10; hai1ah12217 double mutant (E) at 48hpf highlighting rescue of epidermal aggregates and fin morphology (arrowheads) in the double mutants. (F) Projected confocal images of pentafluorobenzenesulfonyl fluorescein (PFBSF) staining at 24hpf (left column), TP63 (magenta), and eGFP (green) antibody staining at 48hpf (middle column) with DIC imaging (right column) for hai1ahi2217 single mutants (top row), st14asq10; hai1ahi2217 double mutants (middle row), and hai1ahi2217 mutants injected with 0.4 mM, duox MO + 0.2 mM tp53 morpholino (bottom row). Individuals for middle and right columns were hemizygous for the Tg(mpx:eGFP)i114 transgene. (G) Counts of eGFP-positive neutrophils on the fins of hai1ahi2217; Tg(mpx:eGFP)i114 or Tg(mpx:eGFP)i114, and either uninjected, injected with morpholino against duox (left side of graph), treated with 0.5% DMSO (Dimethyl sulfoxide) or 40 µM diphenyleneiodonium (DPI) (right side of graph). n = 10; t-test; ***p<0.001; *p<0.05. Scale bars: (C) = 20 µm; (E, F) = 100 µm.
Table 1
Prevalence of otolith and epithelial phenotypes in hai1a and st14a double mutants: p<0.0001 (Chi-squared test).
| hai1a+/hi2217; st14a+/sq10 ♂ × hai1ahi2217/hi2217; st14asq10/sq10 ♀ | |||
|---|---|---|---|
| Observed (expected) | WT epidermis | hai1a epidermis | Total |
| Wild-type otoliths | 72 (65) | 60 (65) | 132 (130) |
| No otoliths | 128 (65) | 0 (65) | 128 (130) |
| Total | 200 (130) | 60 (130) | 260 |
Duox is regulated by calcium through its EF-Hand domains, and calcium flashes are known to generate H2O2 in epidermal wounds in Drosophila (Razzell et al., 2013). We injected hai1afr26 with RNA encoding the calcium reporter GCaMP6s. Timelapse imaging at 24hpf indicated that hai1a mutants had significantly more calcium flashes in both the trunk and tail (Figure 3A, B, E, Figure 3—figure supplement 1A, B, Video 3). Increased intracellular calcium dynamics was observable as early as 16hpf, concomitant with increased H2O2, but prior to onset of hai1a phenotypes (Figure 3G, H, Video 4). Release of calcium from intracellular stores is regulated by IP3 receptors located on the endoplasmic reticulum. The frequency and number of calcium flashes in the trunk and tail of hai1a mutants are reduced by treatment with the IP3R inhibitor, 2-APB compared to control (Figure 3C, D, F, Figure 3—figure supplement 1C, D, Video 5). Reducing calcium flashes in hai1a mutant embryos with 2-APB also significantly reduced H2O2 levels (Figure 3I, J, Figure 3—figure supplement 1E) and partially reduced inflammation; however, the epidermal defects were not noticeably rescued (imaged by DIC (Differential Interference Contrast) or labelled with the TP63 antibody) (Figure 3I–K). We observed similar reduction in neutrophil inflammation, but not rescue of epidermal defects, in hai1a mutants treated with thapsigargin, which inhibits the replenishment of ER calcium stores by SERCA (Figure 3K, Figure 3—figure supplement 1F, G). This suggests, in hai1a mutants, that IP3R-dependent calcium flashes activate Duox, flooding the epidermis with H2O2 and leading to inflammation.
Figure 3 with 1 supplement see all
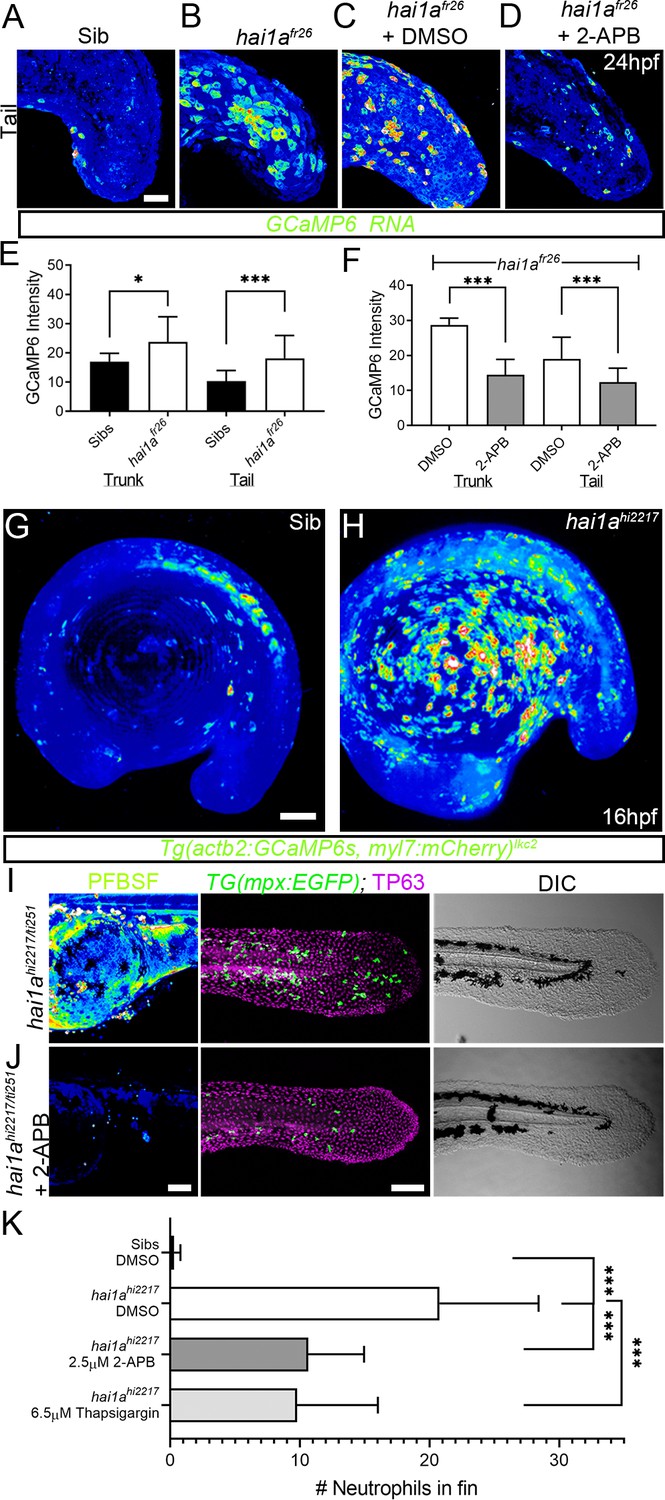
Calcium dynamics in hai1a mutants regulate H2O2 and inflammation.
(A–D) Projected confocal images of eGFP in the tail of WT (A) or hai1afr26; (B–D) injected with GCaMP6s RNA, imaged at 24hpf, indicating calcium dynamics. Embryos are either untreated (A, B), treated with DMSO (C), or with 2.5 µM 2-APB (D). Images are temporal projections of timelapse movies taken at maximum speed intervals (2 min) and projected by time. (E, F) Graphs comparing eGFP intensities from GCaMP6s RNA timelapses in trunk and tail between 24hpf WT and hai1afr26 (E) and between hai1afr26 treated with DMSO and 2.5 µM 2-APB (F). n = 10; t-test; *p<0.05, ***p<0.001. (G, H) Projected light-sheet images of Tg(actb2:GCaMP6s, myl7:mCherry)lkc2 embryos indicating calcium dynamics at 16hpf of sibling (G) or hai1ahi2217 (H). Images are temporal projections of timelapse movies taken at 45 s intervals and projected by time. (I, J) Pentafluorobenzenesulfonyl fluorescein (PFBSF) staining at 24hpf (left column), TP63 (magenta), and eGFP (green) antibody staining at 48hpf (middle column) with DIC imaging (right column) for hai1ahi2217/ti251 mutants (J), or hai1ahi2217/ti247 mutants treated with 2.5 µM 2-APB (I). Individuals for middle and right columns were hemizygous for the Tg(mpx:eGFP)i114 transgene. (K) Counts of eGFP-positive neutrophils in the fins at 48hpf of Tg(mpx:eGFP)i114, or hai1ahi2217; Tg(mpx:eGFP)i114 treated with 0.5% DMSO, 2.5 µM 2-APB, or 6.5 µM thapsigargin. n = 20; t-test; ***p<0.001. Scale bars (A–D) = 50 µm; (G, I, J) = 100 µm.
Video 3
Calcium dynamics in WT and hai1afr26 embryos at 24hpf.
Projected confocal timelapses of eGFP in the trunks (left side) and tails (right side) of a 24hpf WT (top row) and hai1afr26 (bottom row) embryos injected with GCaMP6s RNA, indicating calcium dynamics. Scale bar: 50 µm.
Video 4
Calcium dynamics in WT and hai1ahi2217 embryos at 16hpf.
Projected light-sheet timelapses of eGFP in WT (left side) and hai1ahi2217 (right side) embryos at 16hpf. Both embryos carried the Tg(actb2:GCaMP6s, myl7:mCherry)lkc2 transgene reporting calcium dynamics, which were higher in the hai1a mutant, particularly over the yolk. Images were taken every 45 s for 19 min. Scale bar: 50 µm.
Video 5
Calcium dynamics in DMSO and 2-APB-treated hai1afr26 embryos at 24hpf.
Projected confocal timelapses of eGFP signal in the trunks (left side) and tails (right side) of 24hpf hai1afr26 embryos injected with GCaMP6s RNA and treated with 0.03% DMSO (top row) and 2.5 µM 2-APB (bottom row), indicating reduced calcium dynamics following 2-APB treatment. Scale bar: 50 µm.
Hydrogen peroxide elevates NfkB signalling in hai1a mutants
Increased Matriptase, Par2 activity, or hydrogen peroxide levels are known to activate NfkB signalling (Kanke et al., 2001; Sales et al., 2015; Schreck et al., 1991). We crossed the hai1afr26 allele to the NfkB sensor transgenic line Tg(6xHsa.NFKB:EGFP)nc1. In WT embryos, NfkB signalling was mostly restricted to neuromasts at 48hpf, whilst in hai1a mutants we observed an increase in fluorescence at 24hpf and a strong increase at 48hpf. Fluorescence at both timepoints was noted in epidermal aggregates and fin folds, locations of strong inflammation (Figure 4A, B, Figure 4—figure supplement 1A, B). This increase in signalling in 48hpf hai1a mutant embryos was confirmed by qRT-PCR of the NfkB target gene, nfkbiaa (Figure 4C). Unlike calcium and H2O2, NfkB signalling is not present at early stages prior to phenotype (Figure 4—figure supplement 1C, D). To determine the extent that NfkB signalling accounts for the hai1a phenotypes, we generated a mutant in the ikbkg (=ikkg or nemo) gene, which encodes a scaffold protein required for activating the NfkB pathway (Rothwarf et al., 1998) (ikbkgsq304 Gly80ValfsTer11; Figure 4—figure supplement 1E). Crossing this mutant to hai1ahi2217 on the Tg(mpx:eGFP)i114 background realised a very strong rescue of neutrophil inflammation at 48hpf, but no improvement of hai1a epidermal defects (Figure 4D–I). To demonstrate that this increase in NfkB signalling was dependent on H2O2, we injected hai1ahi2217; Tg(6xHsa.NFKB:EGFP)nc1 embryos with duox MO. We noted a strong reduction in NfkB pathway activation compared to uninjected hai1ahi2217 mutant controls (Figure 4J, K). Conversely, genetic ablation of NfkB signalling, through use of the ikbkg mutant, did not reduce H2O2 levels in hai1a mutants (Figure 4—figure supplement 1F, G). Similarly, we tested if reduction of calcium flashes could also reduce NfkB signalling in hai1a mutants using 2-APB but noticed only a slight reduction (Figure 4—figure supplement 1H, I). We propose that upon loss of Hai1a, IP3R-mediated release of calcium activates Duox to increase H2O2. This acts upstream of NfkB pathway activation, which occurs at later stages, and is necessary for the inflammation phenotype.
Figure 4 with 1 supplement see all

NfkB signalling is elevated in hai1a mutants and is necessary for neutrophil inflammation.
(A, B) Lateral confocal projections of Tg(6xHsa.NFKB:EGFP)nc1 embryos reporting NfkB signalling levels at 48hpf for WT (A) and hai1afr26 (B). (C) qPCR of cDNA levels of NfkB target gene nfkbiaa in hai1afr26 vs. sibs at 48hpf. n = 3, 200 embryos pooled in each, t-test *p<0.05. (D–E′) Projected confocal images of the tail fins of 48hpf Tg(mpx:eGFP)i114; hai1ahi2217 embryos, immunostained for TP63 (magenta) and eGFP (green) (D, E) with corresponding DIC image (D′, E′). Embryos were either mutant for ikbkg (ikbkgsq304, E–E′) or heterozygous (ikbkg+/sq304; D–D′). (F) Counts of eGFP-positive neutrophils in the fins at 48hpf of hai1ahi2217; ikbkg+/sq304 and hai1ahi2217; ikbkgsq304. Embryos were hemizygous for Tg(mpx:eGFP)i114. n = 9; t-test; ***p<0.001. (G–I) Lateral DIC images of the trunk of hai1a+/hi2217; ikbkg+/sq304 (G), hai1ahi2217; ikbkg+/sq304 (H), and hai1ahi2217; ikbkgsq304 (I). Loss of IKBKG does not rescue epidermal defects of hai1a mutants (arrowheads). (J, K) Lateral confocal projections of Tg(6xHsa.NFKB:EGFP)nc1 embryos reporting NfkB signalling levels at 32hpf of hai1ahi2217 uninjected (J) or injected with duox MO (K). Loss of H2O2 reduces NfkB signalling levels in hai1a mutants. Scale bars: (A, K) = 200 µm; (D′, I) = 50 µm.
Both inflammation and epidermal aggregates of hai1a mutants are resolved by Gq inhibition
IP3 is generated from cleavage of PIP2 by Phospholipase C. The sensitivity of the hai1a mutants to 2-APB implies that IP3 levels are increased and therefore there may be an increase in Phospholipase C activity. Numerous attempts to inhibit PLC in hai1a mutants failed, and we were unable to find a dosage window that rescued without gross embryo deformity. Hence, we tested rescue of hai1a mutants with YM-254890, an inhibitor of the heterotrimeric G protein alpha subunit, Gq, which directly activates PLC isoforms. We found that not only did this significantly reduce neutrophil inflammation (Figure 5D, F), but surprisingly, it also significantly rescued the epidermal defects in hai1a mutants, with a significant reduction in TP63-positive epidermal aggregates in the trunk and improved tail fin fold integrity at 48hpf (Figure 5A–E).
Figure 5
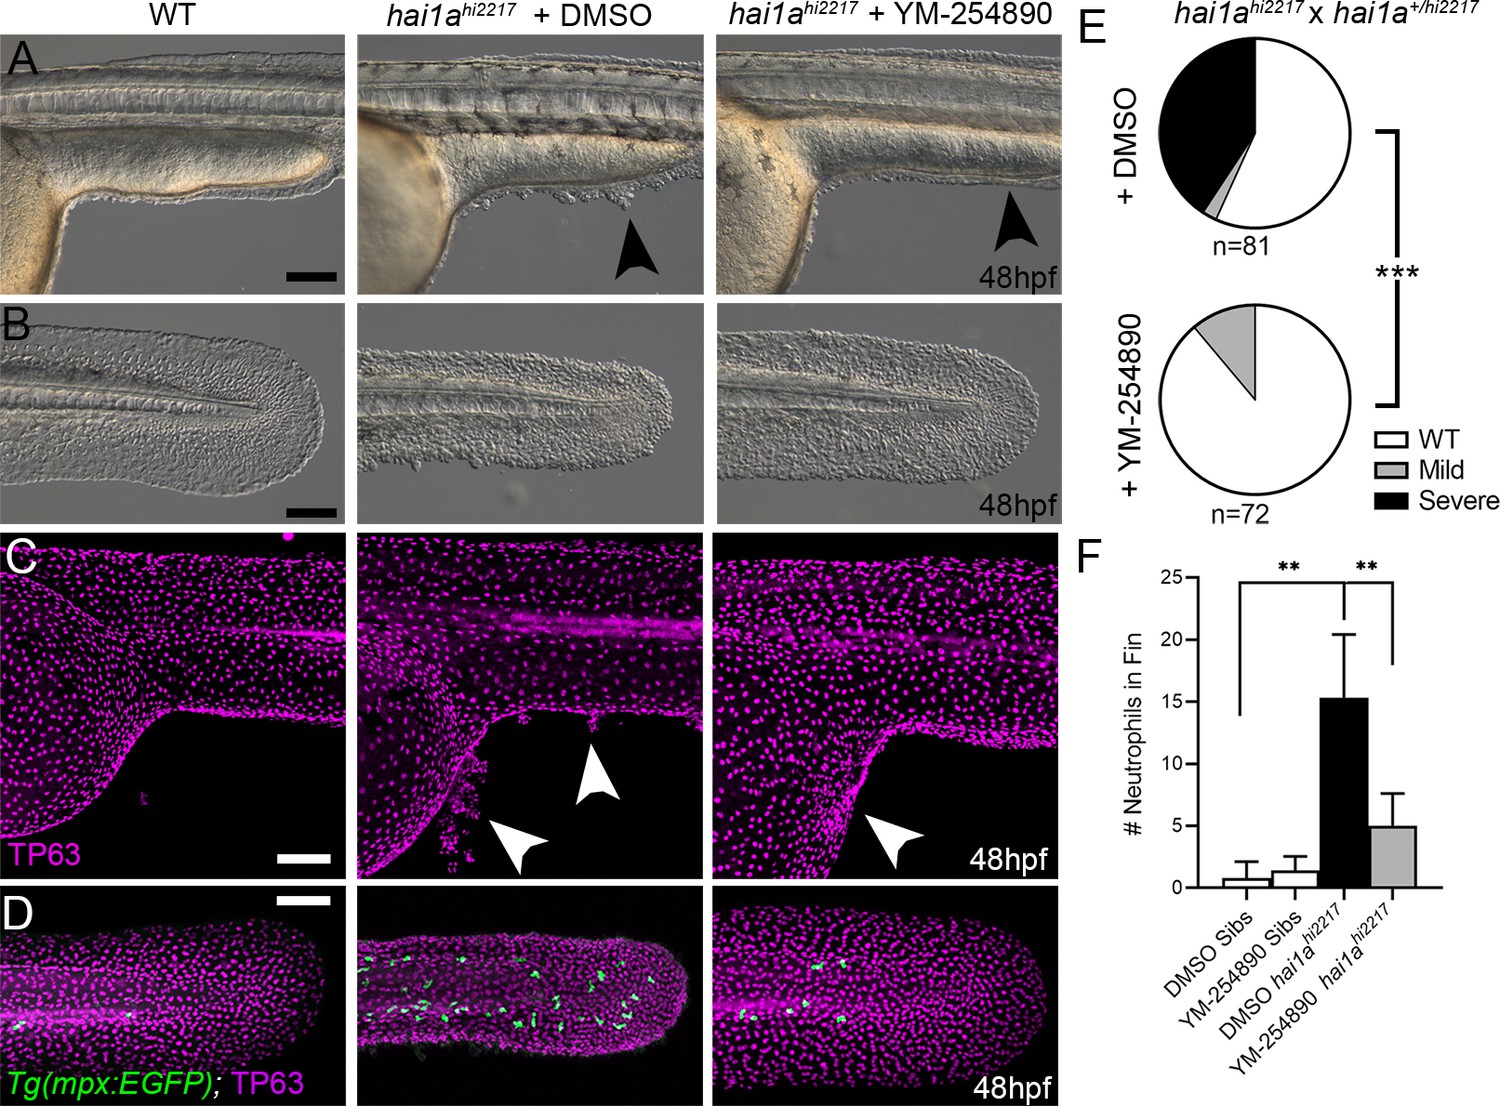
Gq inhibition rescues both epidermal and inflammation phenotypes of hai1a mutants.
(A–D) Lateral images of ventral trunk and tail at 48hpf for WT (left panels), hai1ahi2217 treated with 0.5% DMSO (middle panels), and hai1ahi2217 treated with 32 µM YM-254890 (right panels). DIC micrographs are shown in (A, B), whilst projected confocal images are shown in (C, D), where embryos are immunostained for TP63 (C, D; magenta) and eGFP (D; green). Embryos in (D) are hemizygous for Tg(mpx:eGFP)i114. Arrowheads indicate region of aggregate formation lost upon treatment with Gq inhibitor YM-254890. (E) Pie charts showing proportion of embryos with no (WT; white), mild (grey) or severe (black) hai1a mutant epidermal phenotypes. Embryos were derived from hai1ahi2217/hi2217 × hai1a+/hi2217 crosses and assayed at 48hpf. Clutches treated with 0.5% DMSO (upper pie chart) were compared to those treated with 32 µM YM-254890 (lower pie chart) by Chi-squared analysis. ***p<0.001; n = 72. (F) Graph of counts of eGFP-positive neutrophils in the fins at 48hpf of Tg(mpx:eGFP)i114, or hai1ahi2217; Tg(mpx:eGFP)i114 treated with 0.5% DMSO, or 32 µM YM-254890. n = 6; Mann–Whitney test; **p<0.01. Scale bars: (A–D) = 100 µm.
PMA treatment phenocopies the hai1a mutant
As IP3R inhibition only blocks inflammation in hai1a mutants, but an inhibitor of a PLC activator (Gq) additionally reduces the epidermal defects, we considered that diacyl glycerol (DAG) might contribute to the epidermal defects as the second product of PIP2 cleavage (along with IP3). Indeed, treating WT embryos from 15hpf to 24hpf with 125 ng/ml phorbol 12-myristate 13-acetate (PMA), a DAG analogue, resulted in embryos with striking similarities to strong hai1a mutants, including a thin or absent yolk sac extension, lack of head straightening, lack of lifting the head off the yolk, and multiple epidermal aggregates on the skin (Figure 6A–C). These aggregates were due, at least partially, to displacement of basal keratinocytes as shown by TP63 staining where the basal keratinocyte nuclei lost their uniform distribution (Figure 6D, E). Treatment from 24hpf to 48hpf with 125 ng/ml PMA led to a fin defect similar to the dysmorphic hai1a mutant fin (Figure 6F, G). It has been shown that the basal keratinocytes in hai1a lose their epithelial nature and adopt a partially migratory phenotype (Carney et al., 2007; Video 6). We treated Tg(krtt1c19e:lyn-tdtomato)sq16 larvae (Lee et al., 2014) with 37.5 ng/ml PMA for 12 hr and imaged the basal epidermis at 3dpf by light-sheet timelapse. Whilst the DMSO-treated transgenic larvae had very stable keratinocyte membranes and shape, PMA treatment led to a less stable cell membrane topology and dynamic cell shape, similar to hai1a mutants (Figure 6H, Videos 7 and 8). Kymographs taken from Video 7 highlighted both the more labile and weaker cell membrane staining following PMA treatment (Figure 6I). The potency of PMA was dependant on region and reduced with age.
Figure 6
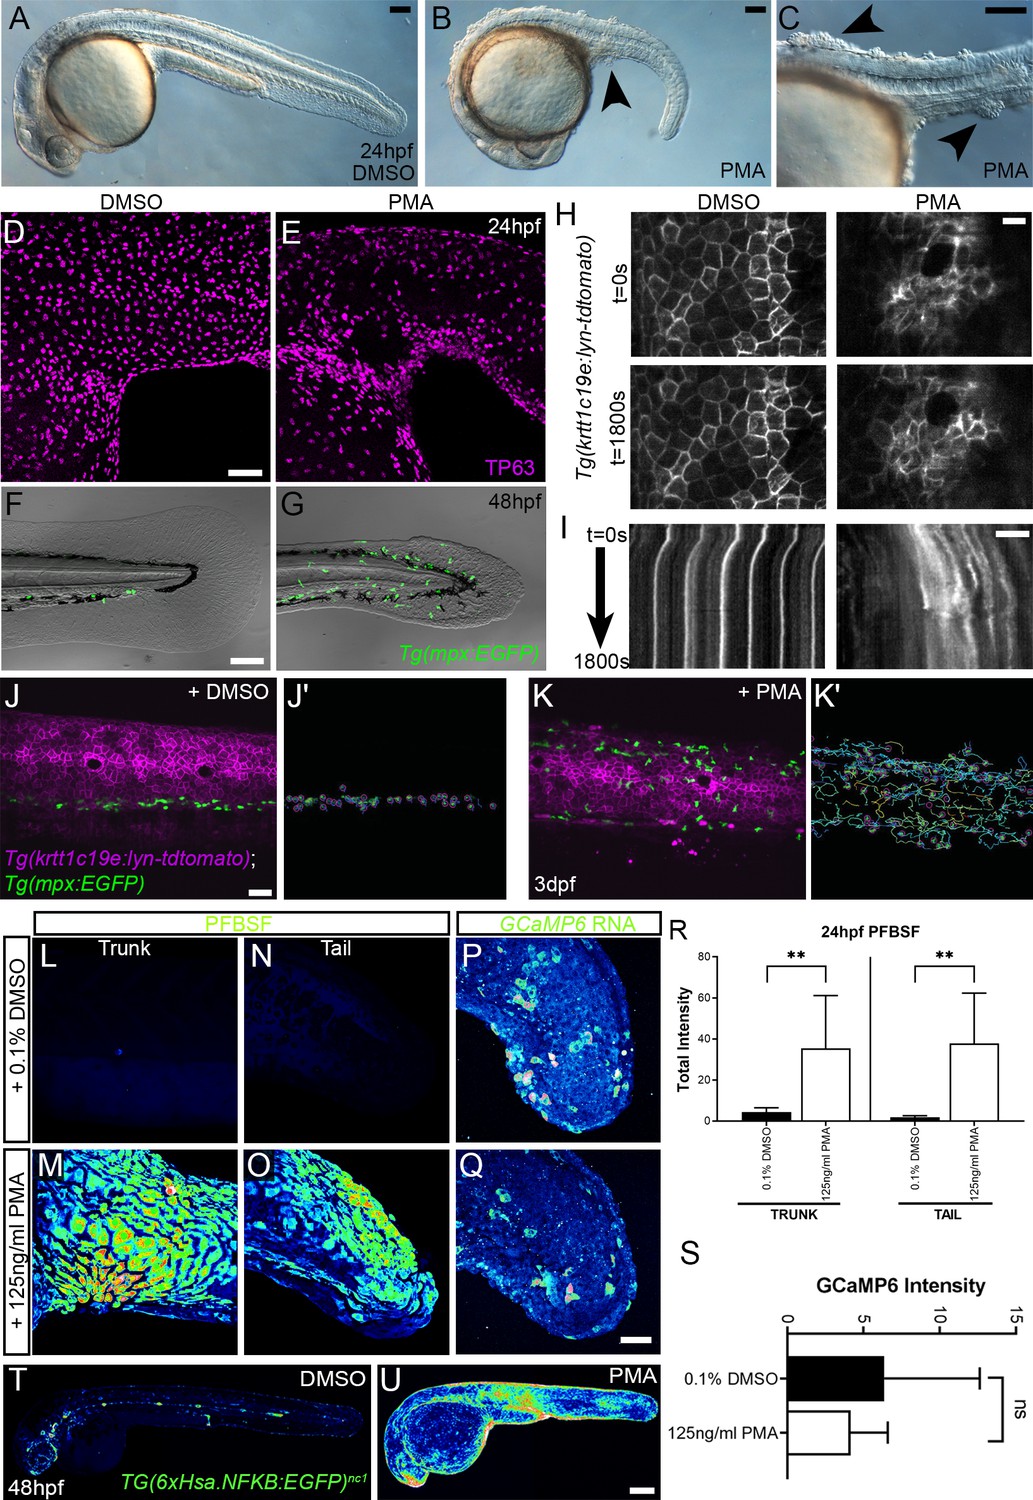
Phorbol 12-myristate 13-acetate (PMA) induces epidermal aggregates, motility, H2O2, NfkB, and inflammation.
(A, B) Lateral micrographs of embryos treated with DMSO (A) or 125 ng/ml PMA (B, C) showing generation of epidermal aggregates (arrowheads). (D, E) Projected confocal images of the trunk of 24hpf WT embryos treated with 0.1% DMSO (D) or 125 ng/ml PMA (E) and immunostained for TP63 (magenta), showing aggregation of TP63-positive cells. (F, G) Projected confocal images superimposed on DIC image of the tail of 48hpf Tg(mpx:eGFP)i114 embryos treated with 0.1% DMSO (F) or 125 ng/ml PMA (G) showing fin defect and activation of eGFP-positive neutrophils (green, G). (H, I) Single timepoint images at t = 0 (top panels, H) and t = 1800 s (lower panels, H) and kymographs (I) derived from light-sheet movies (Video 7) of the epidermis of 3dpf Tg(krtt1c19e:lyn-tdtomato)sq16 larvae treated with 0.1% DMSO (left panels) or 37.5 ng/ml PMA (right panels) showing the lack of membrane stability following PMA treatment. (J–K′) Single frames (J, K) and tracks of eGFP- positive neutrophils (J′, K′) from light-sheet (Video 8) showing neutrophils labelled by eGFP and basal keratinocyte cell membranes labelled by lyn-tdTomato in the trunk of a 3dpf Tg(krtt1c19e:lyn-tdtomato)sq16 larva treated with 0.1% DMSO (J, J′) or 37.5 ng/ml PMA (K, K′) for 18 hr, and imaged every 20 s for 30 min. Track colour in (J′, K′) denotes mean velocity (dark blue 0.0 – red 0.2). (L–O) Projected lateral confocal views of pentafluorobenzenesulfonyl fluorescein (PFBSF) staining of 24hpf WT embryos treated with 0.1% DMSO (L, N) or 125 ng/ml PMA (M, O) showing elevation of H2O2 in the trunk (L, M) and tail (N, O). (P, Q) Projected confocal images of eGFP in the tail at 24hpf of WT injected with GCaMP6s RNA, treated with DMSO (P), or with 125 ng/ml PMA (Q). Images are temporal projections of timelapse movies taken at maximum speed intervals (2 min) and projected by time. (R) Plot of PFBSF fluorescent staining intensity of WT embryos treated with 0.1% DMSO or 125 ng/ml PMA in the trunk and tail. n = 6; ANOVA with Bonferroni post-test **p<0.01. (S) Graph comparing eGFP intensities from 24hpf GCaMP6s RNA timelapses in tail following treatment with DMSO and 125 ng/ml PMA. n = 10; t-test. (T–U) Lateral confocal projections of Tg(6xHsa.NFKB:EGFP)nc1 embryos reporting NfkB signalling levels at 48hpf in WT treated with DMSO (T) and WT treated with 125 ng/ml PMA (U). Scale bars: (A, B, C, F) = 100 µm; (D, J, Q) = 50 µm; (H, I) = 20 µm; (U) = 200 µm.
Video 6
Basal keratinocyte membrane and neutrophil dynamics in 3dpf wild-type and hai1ahi2217 larvae carrying the Tg(krtt1c19e:lyn-tdtomato)sq16 and Tg(mpx:eGFP)i114 transgenes.
Projected light-sheet timelapses of the trunk of 3dpf WT (left) and hai1ahi2217 (right) larvae with neutrophils and basal keratinocyte membranes labelled by eGFP and lyn-tdTomato, respectively. Both larvae carried the Tg(krtt1c19e:lyn-tdtomato)sq16; Tg(mpx:eGFP)i114 transgenes. The hai1a mutants have highly dynamic neutrophils and keratinocyte membrane dynamics. Scale bar: 20 µm.
Video 7
Basal keratinocyte membranes in DMSO and phorbol 12-myristate 13-acetate (PMA)-treated 3dpf Tg(krtt1c19e:lyn-tdtomato)sq16 larvae.
Zoomed projected light-sheet timelapses of basal keratinocyte membranes labelled by lyn-tdTomato in the trunk of 3dpf Tg(krtt1c19e:lyn-tdtomato)sq16 larvae treated with 0.1% DMSO (left) and 37.5 ng/ml PMA (middle and right) for 18 hr. Membranes are stable in DMSO-treated larvae but were dynamic in PMA-treated larvae. Images were captured every 20 s. Scale bar: 10 µm.
Video 8
Neutrophils and basal keratinocyte membranes in DMSO and phorbol 12-myristate 13-acetate (PMA)-treated 3dpf Tg(krtt1c19e:lyn-tdtomato)sq16; Tg(mpx:eGFP)i114 larvae.
Lateral projection of light-sheet timelapse of neutrophils labelled by eGFP and basal keratinocyte cell membranes labelled by lyn-tdTomato in the trunks of 3dpf Tg(krtt1c19e:lyn-tdtomato)sq16 larva treated with 0.1% DMSO (left) and 37.5 ng/ml PMA (right) for 18 hr. PMA treatment leads to slightly dynamic cell membranes and motile neutrophils. Images were captured every 20 s for 30 min. Scale bar: 50 µm.
Most PMA-treated Tg(mpx.eGFP)i114 larvae at 48hpf also had more neutrophils in the epidermis than untreated controls, which were highly migratory (Figure 6F–G, J–K′, Video 8). We determined H2O2 levels in PMA-treated embryos using PFBSF staining and found that it was significantly increased in both trunk and tail at 24hpf (Figure 6L–O, R). In contrast, when we treated GCaMP6s RNA-injected embryos with PMA, we failed to see an increase in calcium flashes, as seen in hai1a (Figure 6P, Q, S). To see if the heightened H2O2 and inflammation was also correlated with increased NfkB signalling, we treated Tg(6xHsa.NFKB:EGFP)nc1 embryos with 125 ng/ml PMA. There was a robust increase in fluorescence, indicating that PMA activates the NfkB pathway (Figure 6T, U).
The phenocopy and the rescue of hai1a by PMA and Gq inhibition respectively imply that DAG is elevated in hai1a mutants. Elevated cellular DAG leads to relocalisation of Protein Kinase C isoforms to the plasma and nuclear lipid membranes where they bind DAG and become activated. Using a GFP-tagged PKCδ fusion protein (Sivak et al., 2005), we showed that in the WT embryo there was largely diffuse cytoplasmic PKCδ-GFP signal, however, it translocated to plasma and nuclear membranes in hai1a mutants, indicating increased levels of DAG (Figure 7A, B, Figure 7—figure supplement 1A, B). This is indeed relevant to the epidermal defects, as treatment of hai1ahi2217 embryos with the PKC inhibitor, GFX109203, reduced the epidermal aggregates and disruption of fin morphology as imaged by DIC or immunostaining for TP63 (Figure 7C–H). Neutrophil inflammation in the epidermis was somewhat reduced, but not to a significant degree (Figure 7E–I). Thus, these experiments strongly suggest that epithelial defects of hai1a are due to DAG generation and PKC activation.
Figure 7 with 1 supplement see all
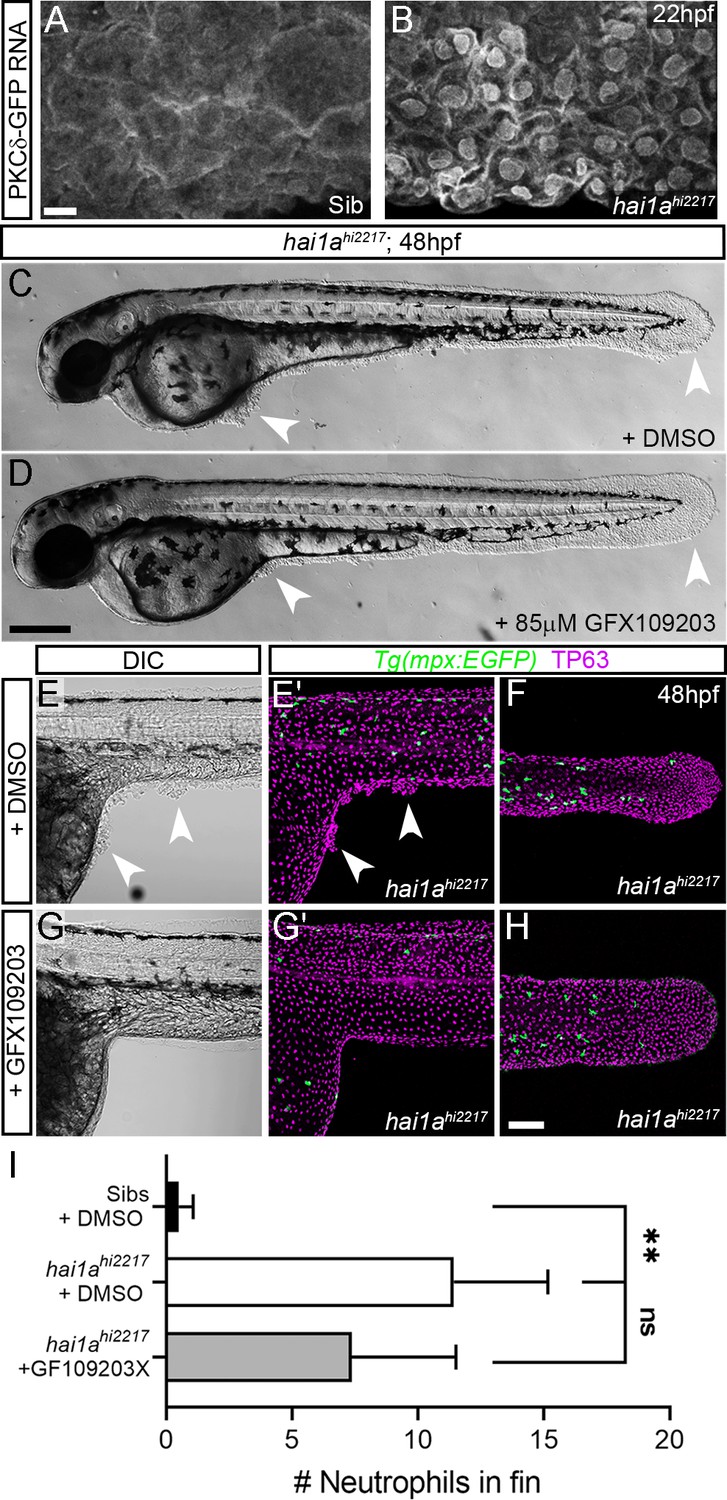
Inhibition of PKC rescues epidermal defects of hai1a.
(A, B) Confocal images of the ventral fin of 22hpf sibling (A) or hai1ahi2217 (B) embryos injected with RNA encoding PKCδ-GFP. Mostly cytoplasmic distribution in sibling was relocated to cell and nuclear membranes in hai1a mutants. (C, D) Lateral brightfield images of 48hpf hai1ahi2217 larvae treated with 0.5% DMSO (C) or 85 µM GFX109203 (D). Epidermal aggregates and fin deterioration are rescued by the PKC inhibitor (arrowheads). (E–H) DIC (E, G) and projected confocal images (E′, G′, F, H) of hai1ahi2217; Tg(mpx:eGFP)i114 trunk at 24hpf (E–E′, G–G′) and tail at 48hpf (F, H), either treated with 0.5% DMSO (E–F) or 85 µM GFX109203 (G–H). Embryos are immunostained for TP63 (magenta) and eGFP (green), highlighting rescue of epidermal phenotype and partial rescue of neutrophils by GFX109203. (I) Counts of eGFP-positive neutrophils in the fins at 48hpf of Tg(mpx:eGFP)i114, or hai1ahi2217; Tg(mpx:eGFP)i114 treated with 0.5% DMSO or 85 µM GFX109203. n = 8; ANOVA, Dunn’s multiple comparisons; **p<0.01. Scale bars: (A) = 10 µm; (D) = 200 µm; (H) = 100 µm.
Elevated MAPK signalling generates epithelial defects in hai1a
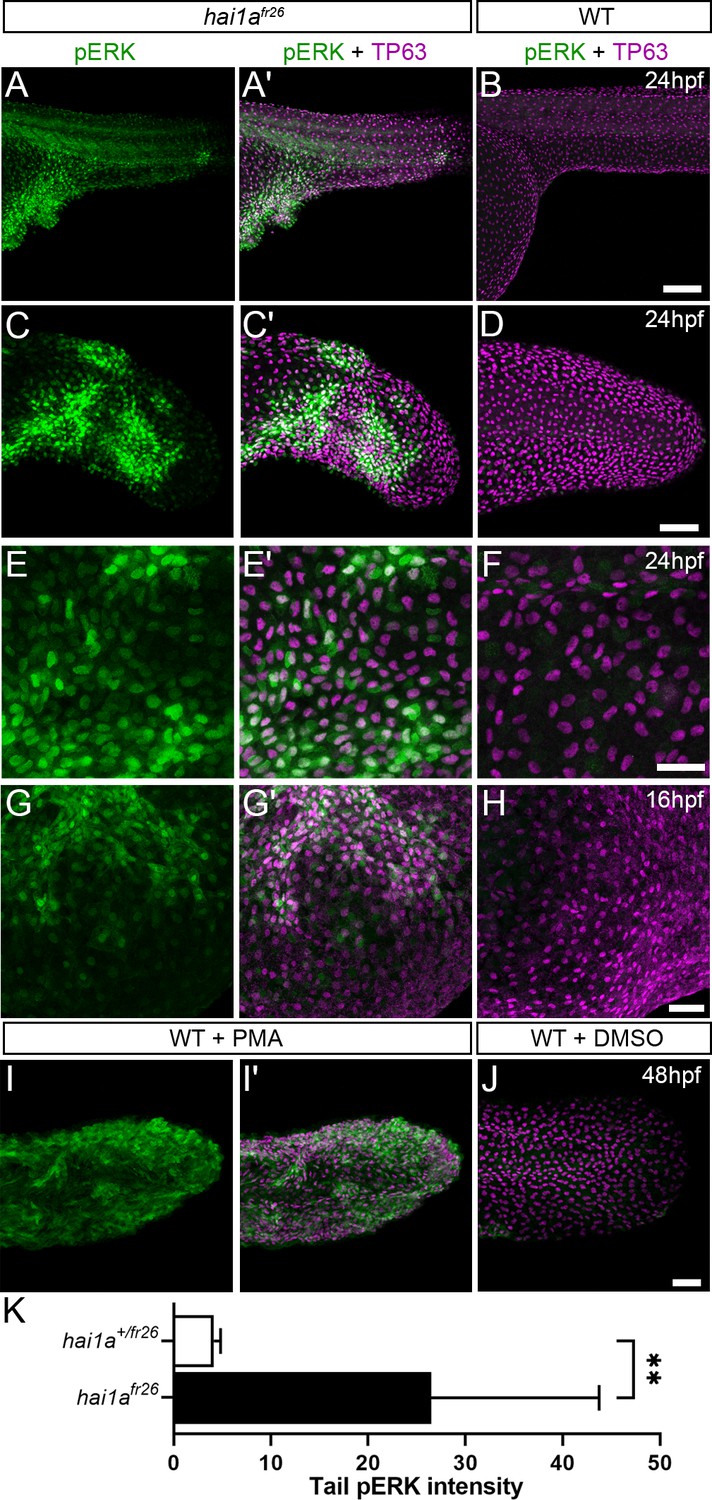
We next sought to determine which pathways downstream of PKC are responsible for the epidermal defects. The MAPK pathway is a major target pathway of multiple PKC isoforms, and activation of this pathway in zebrafish epidermis has previously been shown to induce papilloma formation which have very similar attributes to hai1a mutant aggregates (Chou et al., 2015). Although whole embryo western analysis of hai1a mutants failed to show an overall increase in pERK (Armistead et al., 2020), we performed wholemount immunofluorescent analysis in case there was only a localised effect. Indeed, we observed a significant and localised increase in cytoplasmic pERK immunoreactivity (phospho-p44/42 MAPK (Erk1/2) (Thr202/Tyr204)) in the regions of epidermal aggregate formation in hai1a mutants and in PMA-treated embryos, including under the yolk at 24hpf and in the fins at 24hpf and 48hpf (Figure 8A–K, Figure 8—figure supplement 1A–F). There was no increase in total ERK levels in the mutant (Figure 8—figure supplement 1M, N). Increased pERK was seen in both the cytoplasm and nucleus of TP63-positive cells but was only increased in the nucleus of periderm cells (Figure 8E–E′, Figure 8—figure supplement 1D). To establish that this is an early marker of aggregate formation, and not a sequela, we stained hai1a mutant embryos at earlier timepoints. We found that at 16hpf regions of the epidermis have pERK staining before overt aggregation formation (Figure 8G–H), whilst nascent aggregates also contain pERK staining which increases in number over time (Figure 8—figure supplement 1G–L).
Figure 8 with 1 supplement see all
Elevation of pERK levels in phorbol 12-myristate 13-acetate (PMA)-treated and hai1a mutant epidermis.
(A–L) Lateral projected confocal images of trunks (A, A′, B, E, E′, F), yolk surface (G, G′, H) and tails (C, C′, D, I, I′, J) of embryos immunostained for TP63 (A′, B, C′, D, E′, F, G′, H, I′, J; magenta) and pERK (A, J; green) at 24hpf (A–F), 16hpf (G–H), and 48hpf (I–J). Both hai1afr26 (A, A′, C, C′, E, E′, G, G′) and 125 ng/ml PMA-treated (I, I′) embryos show increased epidermal pERK levels compared to untreated WT (B, D, F, H, J). Elevation of epidermal pERK in hai1afr26 mutants and PMA- treated embryos is seen in the trunk (A, E) and tail (C, I) as well as in epidermis over the yolk prior to overt phenotype manifestation (G). (K) Quantification of pERK immunofluorescent intensity in the tail of 24hpf hai1afr26 larvae compared to siblings. n = 5; Mann–Whitney test; **p<0.01. Scale bars: (B) = 100 µm; (D, H, J) = 50 µm; (F) = 20 µm.
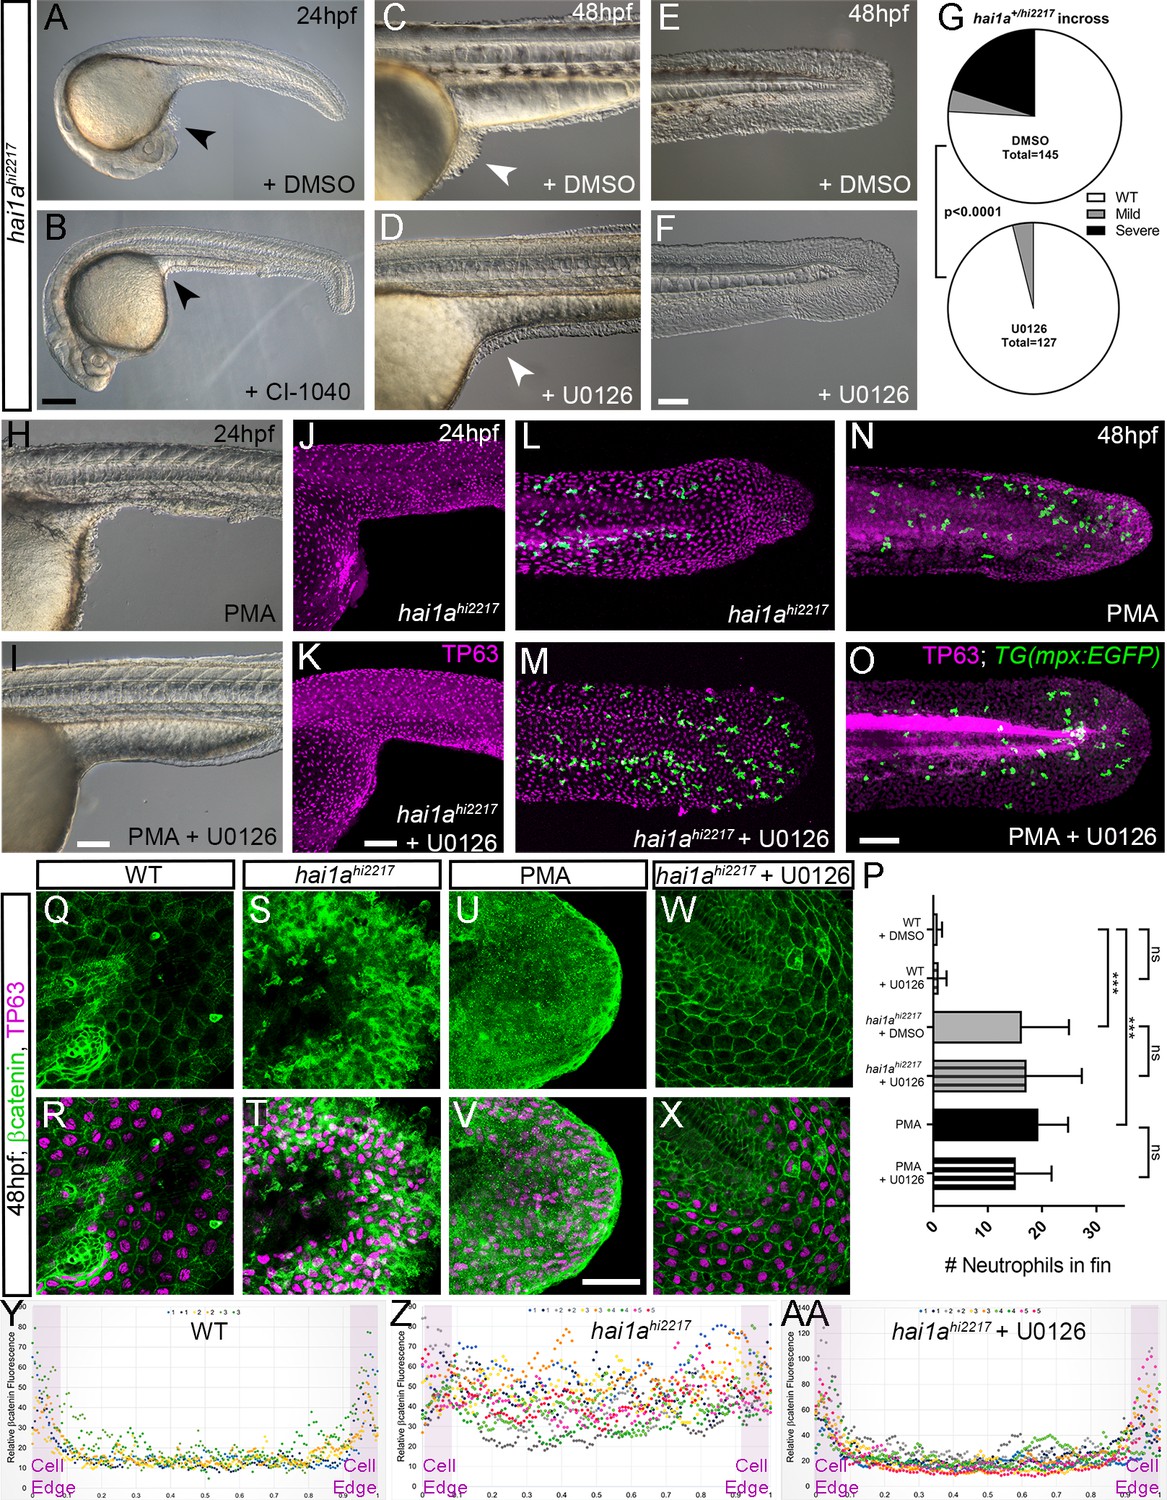
To determine if elevated pERK is causative of epidermal defects, we attempted to rescue using pERK inhibitors. Initially we used PD0325901; however, this appeared to give fin fold deformities, even in WT embryos (Anastasaki et al., 2012), precluding ability to assess rescue in hai1a, although there was a noticeable reduction in epidermal aggregates forming under the yolk-sac extension (data not shown). Instead, we tried U0126 and CI-1040, other well-known pERK inhibitors (Allen et al., 2003; Favata et al., 1998). Both inhibitors showed a significant reduction in hai1a mutant epidermal aggregates under the yolk, and restoration of the overall and tail epithelial morphology, with embryos showing a hai1a phenotype class significantly reduced (Figure 9A–G, Figure 9—figure supplement 1A–F). Similarly, the epidermal defects of the trunk, yolk, and tail following PMA treatment were also ameliorated by concomitant U0126 treatment (Figure 9H, I, Figure 9—figure supplement 1G, H). Rescue of aggregates and tail morphology following PMA treatment or in hai1a mutants could be visualised by immunolabelling TP63 in basal keratinocyte nuclei (Figure 9J–O, Figure 9—figure supplement 1I, J). Initiating U0126 treatment later at 26hpf led to only a partial rescue, indicating that the epidermal phenotypes were likely due to sustained pERK activation (Figure 9—figure supplement 1K–M′).
Figure 9 with 2 supplements see all
Rescue of the hai1a epidermal phenotype by pERK inhibitors.
(A–F) Lateral DIC images of 24hpf (A, B) or 48hpf (C–F) hai1ahi2217 embryos treated with either DMSO (A, C, E), 1.3 µM CI-1040 (B), or 100 µM U0126 (D, F) showing rescue of general morphology (B), trunk (D), and tail (F) epidermal phenotypes compared to DMSO-treated hai1ahi2217. Epidermal aggregates under the yolk are reduced in the treated mutants (A–D; arrowheads). (G) Proportion of 48hpf larvae derived from hai1a+/hi2217 incross showing mild or severe hai1a epidermal phenotype following DMSO (upper) or U0126 (lower) treatment (Chi-squared test). (H, I) Lateral DIC images of 24hpf embryo treated with 125 ng/ml phorbol 12-myristate 13-acetate (PMA) (H) or PMA and U0126 (I). Yolk-associated epidermal aggregates are reduced. (J–M) Lateral projected confocal images of hai1ahi2217; Tg(mpx:eGFP)i114 trunk at 24hpf (J, K) and tail at 48hpf (L, M), either treated with 0.5% DMSO (J, L) or U0126 (K, M). Embryos are immunostained for TP63 (magenta) and eGFP (green), highlighting rescue of epidermal phenotype but no reduction of neutrophils. (N, O) Lateral projected confocal images of Tg(mpx:eGFP)i114 treated with PMA alone (N) or PMA with U0126 (O) and immunostained for TP63 (magenta) and eGFP (green). Fin morphology is restored but neutrophils are still present. (P) Quantification of neutrophils in the fins showing U0126 does not reduce inflammation induced by loss of hai1a or PMA treatment. n = 8; ANOVA with Bonferroni post-test; ***p<0.001. (Q–X) Projected confocal images of 48hpf larval tails immunostained for β-catenin (green) and TP63 (magenta; R, T, V, X) of WT (Q, R, U, V) and hai1ahi2217 (S, T, W, X), either untreated (Q–T), treated with PMA (U, V) or U0126 (W, X). (Y–AA) Profile plots of fluorescence distribution across cells of WT (Y), hai1ahi2217 (Z), and hai1ahi2217 treated with U0126 (AA). X-axis represents width of the cell. β-catenin immunofluorescence intensity (Y-axis) shows majority at cell edge (demarcated in light purple) in WT and rescued hai11a mutants, but is distributed in cytoplasm in mutant. Two cells per 3–5 larvae were analysed. Scale bars: (B) = 200 µm, (F, I, K, O) = 100 µm, (V) = 20 µm.
Treatment with U0126 did not significantly reduce neutrophil inflammation of hai1a mutants or PMA treatment (Figure 9L–P). This suggests that the inflammation phenotype is not simply a consequence of the epidermal defects. Furthermore, dye penetration assays showed that the epithelial barrier was not globally and overtly compromised in hai1a, underscoring that inflammation is not simply a consequence of epithelial defects (Figure 9—figure supplement 2A–H). It has been shown that the epidermal defects in hai1a are associated with loss of E-cadherin from adherens junctions (Carney et al., 2007). As there was a rescue of the epithelial phenotype following pERK inhibition, we looked at the status of the adherens junction marker β-catenin. Whilst the WT basal epidermal cells of the 48hpf tail showed strong staining at the membrane, hai1a mutants and PMA-treated embryos showed a significant loss of β-catenin at the membrane and increase in the cytoplasm (Figure 9Q–V, Y, Z). Treatment of hai1a mutants with U0126 restored the membrane localisation of β-catenin (Figure 9W, X, AA).
Phosphorylation of cytoplasmic RSK by pERK leads to loss of E-cadherin at the hai1a keratinocyte membrane
As increased pERK appeared to contribute strongly to loss of adherens junctions and removal of E-cadherin/β-catenin from the membrane, we sought to determine how pERK signalling might affect adherens junctions. We predicted that this would occur through a cytoplasmic target of pERK as we have previously shown that there is no transcriptional downregulation of E-cadherin levels in hai1a, making a nuclear transcription factor target less likely to be relevant (Carney et al., 2007). The p90RSK family of kinases represents direct cytoplasmic targets of Erk1/2 phosphorylation which regulate cell motility, and thus were good candidates for mediators disrupting cell-cell adhesion (Čáslavský et al., 2013; Tanimura and Takeda, 2017). We determined that at least RSK2a (=p90RSK2a, encoded by rps6ka3a) is expressed in basal keratinocytes at 24hpf (Figure 10A, B). To gauge if there was an alteration in phosphorylation of RSK family members in the epidermis of hai1a mutants, we used an antibody which detects a phosphorylated site of mouse p90RSK (Phospho-Thr348). This site is phosphorylated in an ERK1/2-dependent manner (Romeo et al., 2012). We noticed a substantial increase in cytoplasmic signal in both hai1a mutants and PMA-treated embryos. Where p90RSK-pT348 signal was largely nuclear in both basal and periderm cells in WT, it was more broadly observed in hai1a mutant fins, with an increase in the cytoplasm leading to a more uniform staining (Figure 10C–D′). This increase in cytoplasmic levels of p90RSK-pT348 was observable at 17hpf prior to epithelial defects (Figure 10—figure supplement 1A–C). p90RSK cytoplasmic signal was lost upon U0126 and GFX109203 treatments, showing that it was pERK and PKC dependant (Figure 10E, E′, Figure 10—figure supplement 1D, E). Similarly, increased cytoplasmic p90RSK-pT348 was observed following PMA treatment which was reduced by co-treatment with U0126 (Figure 10F–H′). The increase in cytoplasmic p90RSK-pT348 signal, and its reduction by U0126, was significant in both hai1a mutants and PMA-treated embryos (Figure 10I, J).
Figure 10 with 1 supplement see all

Altered RSK status in hai1ahi2217 accounts for epidermal defects.
(A, B) In situ hybridisation of rps6ka3a at 24hpf under low- (A) and high-power (B) magnification showing expression in basal keratinocytes. Open arrowheads in (B) indicate borders of EVL cells bisecting nuclei of underlying rps6ka3a-positive cells. (C–H′) Lateral projected confocal images of the tails of embryos immunostained for p90RSK (Phospho-Thr348) (C–H′) and TP63 (C′–H′). In both the hai1ahi2217 (D, D′) and 125 ng/ml phorbol 12-myristate 13-acetate (PMA)-treated (G, G′) embryos, there is an increase in cytoplasmic levels of p90RSK (Phospho-Thr348) signal above the nuclear only signal seen in WT (C, C′) or DMSO (F, F′). Treatment with the pERK inhibitor U0126 reduced cytoplasmic levels but did not affect nuclear signal (E, E′; H, H′), (I, J) Quantification of immunofluorescent intensity of cytoplasmic levels of p90RSK (Phospho-Thr348) in basal keratinocytes of tails of 48hpf WT and hai1ahi2217, treated with DMSO or U0126 (I), and PMA or PMA plus U0126 (J). Nucleus signal was excluded by masking from the DAPI channel. n = 5; t-test; ***p<0.001, **p<0.01, *p<0.05. (K–N) Lateral DIC images of hai1ahi2217 embryos at 24hpf (K, L) and 48hpf (M, N) untreated (K, M) or treated with 1.2 µM BI-D1870 (L) or 9 µM dimethyl fumarate (DMF). Locations of epidermal aggregates and loss of tail fin morphology in hai1a mutants, and their rescue by RSK inhibitor treatment are indicated by arrowheads. (O–Q) Lateral projected confocal images of the tails of embryos immunostained with antibodies against E-cadherin and TP63in WT (O, P) and hai1ahi2217 treated with DMF (Q). (O′–Q′) Profile plots of fluorescence distribution across cells of WT (O), hai1ahi2217 (P′), and hai1ahi2217 treated with DMF (Q′). X-axis represents width of the cell. β-Catenin immunofluorescence intensity (Y-axis) shows majority at cell edge (E-cadherin domain demarcated in light purple) and centre of cell (nucleus demarcated in light green) in WT and rescued hai11a mutants, but there is no clear membrane signal in the untreated hai1a mutants. Two cells per five larvae were analysed. Scale bars: (A, K, N) = 100 µM; (B, H) p=20 µM.
If phosphorylation of an RSK protein is required for mediating the pERK epidermal defects in hai1a mutants, then inhibition of RSK should rescue the epidermal defects. As morpholino-targeted inhibition of rps6ka3a was unsuccessful, we employed established pan-RSK inhibitors BI-D1870 and dimethyl fumarate (Andersen et al., 2018; Sapkota et al., 2007). Dimethyl fumarate treatment reduced the extent of cytoplasmic p90RSK-pT348 in hai1a (Figure 10—figure supplement 1F, G). We noted that both inhibitors were able to reduce epidermal aggregates in hai1a mutants and restore fin morphology when visualised by DIC or TP63 immunofluorescence (Figure 10K–N, Figure 10—figure supplement 1H, I, K, L). Reduction of mutant phenotype classes was significant at both 24hpf and 48hpf (Figure 10—figure supplement 1J). We then assayed if RSK inhibition can reduce the aberrant cytoplasmic E-cadherin staining in hai1a mutant basal keratinocytes and observed that dimethyl fumarate treatment restored membrane localisation of E-cadherin in the mutants (Figure 10O–Q′). Thus, phosphorylation of RSK proteins is altered in hai1a mutants, and their inhibition appears to restore E-cadherin to the membrane and reduce epidermal aggregate formation.
Discussion
There are a number of similarities between loss of Hai1a in zebrafish and overexpression of Matriptase in the mouse epidermis, including inflammation, hyperproliferation, and enhanced keratinocyte motility, suggesting conservation of downstream pathways. What the conserved ancestral role of the Matriptase-Hai1 might have been is unclear. Matriptase dysregulation in the mouse is associated with cancer progression (Martin and List, 2019). Tumours have long been considered to represent non-healing wounds, and the cellular- and tissue-level phenotypes of hai1a have similarities to tumours. Epidermal cells in zebrafish transformed by MAPK activation both promote and respond to inflammation through similar mechanisms to wound responses (Feng et al., 2010; Schäfer and Werner, 2008). Further, tissue damage of the zebrafish epidermis perturbs osmolarity and releases nucleotides, leading to inflammation and epithelial cell motility, with the resulting phenotypes strikingly similar to hai1a mutants (de Oliveira et al., 2014; Enyedi and Niethammer, 2015; Gault et al., 2014; Hatzold et al., 2016). Indeed, the tissue responses initiated by loss of zebrafish Hai1a have been previously suggested to represent an early injury response (Schepis et al., 2018), whilst PAR2 synergises with P2Y purinergic and EGF receptors to promote cell migration in scratch assays (Shi et al., 2013). Thus our analysis supports the previous hypothesis of the Hai1-Matriptase system as a component of tissue injury responses (Schepis et al., 2018), which, if inappropriately activated, promotes carcinoma.
The various molecular pathways known to be activated by Matriptase have not been fully delineated or integrated. Par2 has previously been shown to be required for the hai1a phenotype in zebrafish and contributes to the phenotypes of Matriptase overexpression in the mouse. Exactly which heterotrimeric G-protein Par2 is activating in vivo and how this links to phenotypes has not been identified. Our analyses allow us to propose a pathway downstream of Par2 which accounts for both the inflammatory and the epidermal phenotypes (Figure 11). Firstly, inhibition of Gq rescued both the inflammation and epithelial defects. PAR2 activation of Gq has been documented to occur in many cell types including keratinocytes, where inhibition of Gq and PKC reduces PAR2-mediated Nfκb signalling (Böhm et al., 1996; Goon Goh et al., 2008; Macfarlane et al., 2005). Although we were unable to rescue hai1a phenotypes with a PLC inhibitor due to toxicity, genetic sensors demonstrated increased levels of Ca++ and DAG in hai1a epidermis. Our analysis demonstrated that the different products of PIP2 hydrolysis appear to invoke the two main hai1a phenotypes to different extents. IP3R-dependent calcium release in hai1a epidermis was required for Duox activity, high hydrogen peroxide levels, and, later, increased NfkB signalling. Reduction of these attenuated the inflammatory, but not epithelial, defects. Conversely, inhibiting the DAG receptor, PKC, rescued the epithelial phenotypes, and the inflammation slightly. The DAG analogue, PMA, phenocopied the epidermal defects of hai1a mutants but also increased H2O2, NfkB, and neutrophil inflammation, indicating that PKC activation may be sufficient, but not necessary, for inflammation. This is in line with known activation of Duox and IKK by PKC (Rigutto et al., 2009; Turvey et al., 2014). In addition, expression of activated Ras in zebrafish keratinocytes has been shown to lead to H2O2 release and neutrophil attraction (Feng et al., 2010). Thus, there is likely to be dual contribution to the inflammatory phenotype from IP3 and DAG. It is important to stress however that the inflammation is not simply a result of epithelial defects or an overt loss of barrier. Firstly, we see increase in Ca++ and H2O2 very early in the epidermis prior to skin defects. Secondly, barrier assays failed to conclusively show a broad increase in permeability. Finally, rescue of epithelial defects by PKC and pERK inhibition did not fully rescue the inflammation. We conclude in our model that DAG contributes to both aspects of the phenotype, but IP3 promotes only the inflammation.
Figure 11
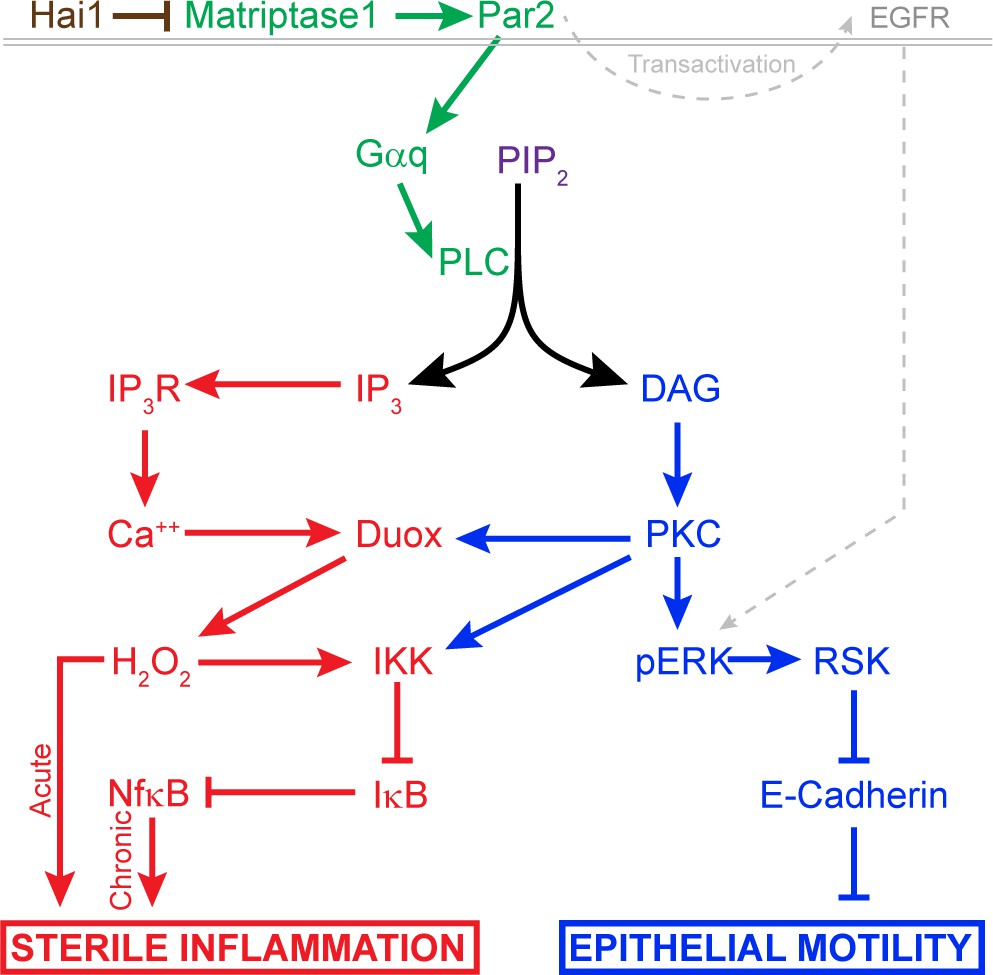
Model of pathway-activated downstream of Hai1 and Matriptase.
Proposed model of pathways downstream of Hai1 which drives chronic and acute sterile inflammation (red) and epithelial motility (blue). A previously defined transactivation of EGFR is also integrated. Other pathways known to act downstream of Matriptase, involving cMet, PI3K, AKT, and mTOR, are not shown.
Seminal experiments in transgenic mice overexpressing Matriptase in the epidermis and treated with a DMBA/PMA regime concluded that Matriptase and PMA activate functionally similar carcinoma promoting pathways (List et al., 2005). Our subsequent analysis suggests that this would include the MAPK pathway as we see increased phosphorylated-ERK in the epidermis of both hai1a mutants and also PMA-treated embryos. That we can rescue the epithelial defects using a MEK inhibitor indicated that this increase in epidermal pERK is likely critical to the phenotype. The MAPK pathway is known to regulate cell motility (Tanimura and Takeda, 2017). In the zebrafish epidermis, misexpression of activated MEK2 generated papillomas with remarkable resemblance to the epidermal aggregates in hai1a mutants (Chou et al., 2015), and which are not overtly proliferative. In astrocytes and oesophageal or breast tumour cell lines, PAR2 stimulates migration and invasiveness through MAPK/ERK, activation of which required Gq and PIP2 hydrolysis (Jiang et al., 2004; McCoy et al., 2010; Morris et al., 2006; Sheng et al., 2019).
One of the main molecular defects defined for zebrafish hai1a is the removal of adherens junction proteins from the membrane (Carney et al., 2007). MAPK signalling has been shown to reduce E-cadherin expression at adherens junctions and promote cytoplasmic accumulation through phosphorylation of the effector, RSK (Čáslavský et al., 2013). Like Matriptase, activation of RSK2 is associated with tumour progression, promoting invasiveness and metastasis of glioblastomas and head and neck squamous cell carcinomas (Kang et al., 2010; Sulzmaier et al., 2016). Promotion of invasiveness has also been noted for activated RSK1, which promotes invasion of melanoma clinically as well as in vitro and zebrafish melanoma models (Salhi et al., 2015). Intriguingly, proximity protein labelling has identified p120-catenin as a target of RSK phosphorylation. This catenin promotes cell-cell adhesion by stabilising cadherins at junctions, a function inhibited by RSK phosphorylation (Méant et al., 2020). More broadly, RSK2 activity promotes cell motility through other mechanisms, including inactivation of Integrins and activation of the RhoGEF, LARG (Gawecka et al., 2012; Shi et al., 2018). Thus, we propose that pERK signalling, through RSK members, significantly contributes to dissolution of adherens junctions and the hai1a epidermal phenotype. We observed increased pERK in the cytoplasm and also the nucleus of keratinocytes, with comparatively more nuclear levels in periderm cells. Thus, whilst RSKs are phosphorylated by pERK, it is also likely that other cytoplasmic and also nuclear targets, such as cFos and Ets transcription factors, may also be activated, and that there are underlying transcriptional changes in hai1a mutants. It is not clear why pERK shows slightly different subcellular localisation patterns between the two different epidermal layers, but the two layers do respond differently to ErbB2 inhibition (Schepis et al., 2018), whilst calcium is recently described to alter nuclear shuttling of pERK (Chuderland et al., 2020).
Our model for how Matriptase invokes cellular responses is highly likely to be incomplete. Indeed, others have indicated MMPs, HB-EGF, EGFR, and AKT and are downstream of Matriptase and PAR2 function (List et al., 2005; Schepis et al., 2018; Darmoul et al., 2004; Chung et al., 2013; Rattenholl et al., 2007). Furthermore, Matriptase promotes HGF–cMet signalling in mouse (Szabo et al., 2011). We do not think that these conflict with our model but will interface with it. A number of reports have demonstrated that PI3K/AKT and MEK/ERK function in parallel downstream of PAR2 (Sheng et al., 2019; Tanaka et al., 2008; van der Merwe et al., 2009). Furthermore, there is evidence that PKC activates both MEK/ERK and EGFR independently following PAR2 stimulation, and that PI3K is activated by PAR2 via Gq (Wang and DeFea, 2006; Al-Ani et al., 2010). Cell identity, subcellular localisation, β-arrestin scaffolding, and biased agonism/antagonism are known to generate alternative downstream outputs from PAR2 (Zhao et al., 2014). To understand fully the roles of Matriptase and PAR2 in epithelial homeostasis and carcinoma, it will be critical to map how, when, and where they activate different downstream pathways.
Materials and methods
Key resources table
| Reagent type (species) or resource | Designation | Source or reference | Identifiers | Additional information |
|---|---|---|---|---|
| Gene (Danio rerio) | hai1a | GenBank | NM_213152 | =spint1a |
| Gene (Danio rerio) | matriptase1a | GenBank | NM_001040351 | =st14 a |
| Gene (Danio rerio) | duox | GenBank | XM_017354273 | =dual oxidase |
| Gene (Danio rerio) | ikbkg | GenBank | NM_001014344 | =ikky =nemo |
| Gene (Danio rerio) | nfkbiaa | GenBank | NM_213184 | =ikbaa |
| Gene (Danio rerio) | rps6ka3a | GenBank | NM_212786 | =RSK2a =p90RSK2a |
| Gene (Danio rerio) | tp63 | GenBank | NM_152986 | =delta Np63 |
| Strain, strain background (Escherichia coli) | Top10 | Invitrogen | C404010 | Chemical competent cells |
| Strain, strain background (Danio rerio) | AB | ZIRC | Wild-type strain | |
| Strain, strain background (Danio rerio) | TL | ZIRC | Wild-type strain | |
| Genetic reagent (Danio rerio) | Tg(mpx:EGFP)i114 | Uni of Sheffield PMID:16926288 | ZFIN ID: ZDB-ALT-070118-2 | |
| Genetic reagent (Danio rerio) | Tg(fli1:EGFP)y1 | ZIRC PMID:16671106 | ZFIN ID: ZDB-ALT-011017-8 | |
| Genetic reagent (Danio rerio) | hai1afr26 | Hammerschmidt lab; Max Planck Freiburg PMID:31819976 | ZFIN ID: ZDB-ALT-200618-2 | =spint1afr26 |
| Genetic reagent (Danio rerio) | hai1ahi2217 | Nancy Hopkins lab; Massachusetts Institute of Technology PMID:17728346 | ZFIN ID: ZDB-ALT-040924-4 | =spint1ahi2217Tg |
| Genetic reagent (Danio rerio) | ddfti251 | Nuesslein-Volhard lab; Max Planck Tuebingen PMID:9007245 | ZFIN ID: ZDB-ALT-980203-1462 | =dandruff spint1ati251 ==hai1ati251 |
| Genetic reagent (Danio rerio) | ddft419 | Nuesslein-Volhard lab; Max Planck Tuebingen PMID:9007245 | =dandruff spint1at419 ==hai1at419 | |
| Genetic reagent (Danio rerio) | st14asq10 | Our lab PMID:31645615 | ZFIN ID: ZDB-ALT-200219-5 | |
| Genetic reagent (Danio rerio) | Tg(6xNFkB:EGFP)nc1 | Rawls lab PMID:21439961 | ZFIN ID: ZDB-ALT-120409-6 | |
| Genetic reagent (Danio rerio) | Tg(krtt1c19e:LY-Tomato)sq16 | Our lab. Lee et al: PMID:24400120 | ZFIN ID: ZDB-ALT-140424-2 | |
| Genetic reagent (Danio rerio) | Tg(actb2:GCaMP6s, myl7:mCherry)lkc2 | This paper | Plasmid from Solnica-Krezel Lab. Injected with Tol2 RNA to make line | |
| Antibody | Chicken anti-eGFP antibody | Abcam | ab13970, RRID:AB_300798 | 1:500 |
| Antibody | Rabbit anti-eGFP | Torrey Pines Biolabs | Tp401 RRID:AB_10013661 | 1:500 |
| Antibody | Rabbit anti-FITC | Thermo Fisher Scientific | 71-1900 RRID:AB_2533978 | 1:200 |
| Antibody | Rabbit anti-p90RSK (Phospho-Thr348) | GenScript | A00487 | 1:100 |
| Antibody | Rabbit anti-beta catenin | Abcam | ab6302 RRID:AB_305407 | 1:200 |
| Antibody | Mouse anti-E-cadherin | BD Biosciences | 610181 RRID:AB_397580 | 1:200 |
| Antibody | Mouse anti-Tp63 | Biocare Medical | CM163 RRID:AB_10582730 | 1:200 |
| Antibody | Rabbit anti-phospho-p44/42 MAPK (Erk1/2) (Thr202/Tyr204) | Cell Signaling Technology | Cat# 4370, RRID:AB_2315112 | 1:100 |
| Antibody | Rabbit anti-p44/42 MAPK (Erk1/2) | Cell Signaling Technology | Cat# 9102, RRID:AB_330744 | 1:100 |
| Antibody | Alexa Fluor-488 Donkey anti-rabbit | Life Technologies | A21206 RRID:AB_2535792 | 1:700 |
| Antibody | Alexa Fluor-647 Donkey anti-rabbit | Life Technologies | A31573 RRID:AB_253618 | 1:700 |
| Antibody | Alexa Fluor-546 Donkey anti-mouse | Life Technologies | A10036 RRID:AB_2534012 | 1:700 |
| Antibody | Alexa Fluor-488 Goat anti-chicken | Life Technologies | A11039 RRID:AB_2534096 | 1:700 |
| Recombinant DNA reagent | pCS2+-PKCδ-GFP | Amaya Lab, Uni of Manchester PMID:15866160 | For making PKCd-GFP RNA | |
| Recombinant DNA reagent | pT3Ts-Tol2 | Ekker Lab, Mayo Clinic PMID:17096595 | Addgene Plasmid #31831 RRID:Addgene_31831 | |
| Recombinant DNA reagent | pCS2+-GCaMP6s | Solnica-Krezel Lab, Washington University School of Medicine, St. Louis, MO | For making GCaMP6s RNA | |
| Recombinant DNA reagent | p(actb2:GCaMP6s, myl7:mCherry) | Solnica-Krezel Lab, Washington University School of Medicine, St. Louis, MO. PMID:28322738 | For making stable transgenic line | |
| Sequence-based reagent | duox morpholino | GeneTools | PMID:19494811 | 5′ AGTGAATTAGAGAAATGCACCTTTT 3′ (0.4 mM) |
| Sequence-based reagent | p53 morpholino | GeneTools | PMID:19494811 | 5′ GCGCCATTGCTTTGCAAGAATTG 3′ (0.2 mM) |
| Sequence-based reagent | Oligo(dT)12–18 Primer | Invitrogen | PMID:18418012 | |
| Sequence-based reagent | nfkbiaa | This paper | PCR primers | F-5′ AGACGCAAAGGAGCAGTGTAG 3′ R- 5′ TGTGTGTCTGCCGAAGGTC 3′ |
| Sequence-based reagent | eef1a1l1 | This paper | PCR primers | F′-5′ CTGGAGGCCAGCTCAAACAT 3′ R-5′ ATCAAGAAGAGTAGTACCGCTAGCATTAC 3′ |
| Sequence-based reagent | rps6ka3a in situ probe | This paper | PCR primers for cloning probe | F′-5′ ATACTCCAGTCCCACCGGA 3′ R- 5′TGGTGATGATGGTAGACTCGC 3′ |
| Peptide, recombinant protein | Proteinase K | Thermo Scientific | EO0491 | 0.5 μg/μl |
| Commercial assay or kit | SuperScript III Reverse Transcriptase | Invitrogen | 18080093 | |
| Commercial assay or kit | TRIzol Reagent | Invitrogen | 15596026 | |
| Commercial assay or kit | GoTaq G2 Green Master Mix | Promega | M7823 | Functions used: TrackMate Reslice Average Intensity |
| Commercial assay or kit | iTaq Universal SYBR Green Supermix | Bio-Rad | 1725121 | Functions used: Spot |
| Commercial assay or kit | mMESSAGE mMACHINE SP6 Transcription Kit | Invitrogen | AM1340 | Tests: Student’s t-test, Chi-squared test, Mann–Whitney test, ANOVA with Bonferroni or Dunn’s post-tests |
| Commercial assay or kit | mMESSAGE mMACHINE T3 Transcription Kit | Invitrogen | AM1348 | |
| Commercial assay or kit | MEGAshortscript T7 Transcription Kit | Invitrogen | AM1350 | |
| Commercial assay or kit | pGEM-T Easy | Promega | A137A | |
| Commercial assay or kit | pCR 2.1-TOPO TA vector | Invitrogen | K450040 | |
| Commercial assay or kit | QIAquick PCR Purification Kit | Qiagen | 28104 | |
| Commercial assay or kit | DIG RNA Labeling Kit | Roche | 11175025910 | |
| Commercial assay or kit | SP6 RNA Polymerase | Roche | 10 810 274 001 | |
| Commercial assay or kit | NBT/BCIP Stock Solution | Roche | 11681451001 | |
| Chemical compound, drug | Diphenyleneiodonium chloride | Sigma-Aldrich | D2926 | 40 μM |
| Chemical compound, drug | Thapsigargin | Sigma-Aldrich | T9033 | 6.25 μM |
| Chemical compound, drug | Bisindolylmaleimide I (GF109203X) | Selleckchem | S7208 | 85 μM |
| Chemical compound, drug | YM-254890 | FocusBiomolecules | 10-1590-0100 | 32 μM |
| Chemical compound, drug | 2-Aminoethyl diphenylborinate | Sigma-Aldrich | D9754 | 2.5 μM |
| Chemical compound, drug | BI-D1870 | Axon Medchem | Axon-1528 | 1.2 μM |
| Chemical compound, drug | Dimethyl fumarate | Sigma-Aldrich | 242926 | 9 μM |
| Chemical compound, drug | Phorbol 12-myristate 13-acetate | Sigma-Aldrich | P8139 | 37.5 or 125 ng/ml |
| Chemical compound, drug | U0126 | Cell Signaling Technology | 9903 | 100 μM |
| Chemical compound, drug | PD184352 (CI-1040) | Selleckchem | S1020 | 1.3 μM |
| Chemical compound, drug | DAPI (4′,6-diamidino-2-phenylindole, dihydrochloride) | Invitrogen | D1306 | 5 µg/ml |
| Chemical compound, drug | Penta-fluorobenzenesulfonyl fluorescein | Cayman Chemicals | 10005983 | 12.5 μM |
| Chemical compound, drug | Fluorescein isothiocyanate–dextran | Sigma-Aldrich | FD4 | 2.5 mg/ml |
| Software, algorithm | Fiji (ImageJ 1.52p) | NIH | https://imagej.nih.gov/ | Functions used: TrackMate Reslice Average Intensity |
| Software, algorithm | Imaris 9.6.0 | Oxford Instruments | Functions used: Spot | |
| Software, algorithm | Prism 9.1.1 | GraphPad | Tests: Student’s t-test, Chi-squared test, Mann–Whitney test, ANOVA with Bonferroni or Dunn’s post-tests | |
| Software, algorithm | Photoshop 22.1.1 release | Adobe |
Zebrafish husbandry and lines
Request a detailed protocolFish were housed at the IMCB and the NTU zebrafish facilities under IACUC numbers #140924 and #A18002, respectively, and according to the guidelines of the National Advisory Committee for Laboratory Animal Research. Embryos were derived by natural crosses and staged as per Kimmel et al., 1995 and raised in 0.5× E2 medium (7.5 mM NaCl, 0.25 mM KCl, 0.5 mM MgSO4, 75 μM KH2PO4, 25 μM Na2HPO4, 0.5 M CaCl2, 0.35 mM NaHCO3). Anaesthesia was administered in E2 medium (embryos) or fish tank water (adults) using 0.02% pH 7.0 buffered Tricaine MS-222 (Sigma). The hai1a/ddf alleles used were hai1ahi2217, hai1afr26, ddfti251, and ddft419. The st14asq10 allele was generated previously (Lin et al., 2019). For imaging neutrophils and keratinocytes, the transgenic lines Tg(mpx:EGFP)i114 (Renshaw et al., 2006) and Tg(krtt1c19e:lyn-tdtomato)sq16 (Lee et al., 2014) were used, whilst early leukocytes were imaged with Tg(fli1:EGFP)y1 (Redd et al., 2006). To image NfkB pathway activity, the Tg(6xHsa.NFKB:EGFP)nc1 sensor line was used (Kanther et al., 2011). Calcium imaging was performed by injection of GCaMP6s RNA (see below) or using a Tg(actb2:GCaMP6s, myl7:mCherry)lkc2 stable transgenic line, generated via plasmid (Chen et al., 2017) and Tol2 RNA co-injection.
Genomic DNA and RNA extraction, reverse transcription, and PCR
Request a detailed protocolAdult fin clips or embryos were isolated following anaesthesia, and genomic DNA extracted by incubation at 55°C for 4 hr in Lysis buffer (10 mM Tris pH 8.3, 50 mM KCl, 0.3% Tween20, 0.3% Nonidet P-40, 0.5 µg/µl Proteinase K). PCRs were performed using GoTaq (Promega) on a Veriti thermal cycler (Applied Biosystems) and purified with a PCR purification kit (Qiagen). TRIzol (Invitrogen) was used for RNA extraction following provided protocol, and cDNA generated from 1 µg total RNA using SuperScript III Reverse Transcriptase (Invitrogen) with Oligo(dT)12-18 primer. For qPCR, iTaq SYBR green (Bio-Rad) was used to amplify, with reaction dynamics measured on a Bio-Rad CFX96 Real-Time PCR Detection System. For measuring nfkbiaa mRNA by qPCR, the following primers (5′ to 3′) were used to amplify a region encoded on exons 4 and 5: F-AGACGCAAAGGAGCAGTGTAG, R-TGTGTGTCTGCCGAAGGTC. Reference gene was eef1a1l1 and the primers used amplified between exon 3 to 4: F-CTGGAGGCCAGCTCAAACAT, R- ATCAAGAAGAGTAGTACCGCTAGCATTAC.
RNA synthesis
Request a detailed protocolRNAs for GCaMP6s and PKCδ-GFP were synthesised from pCS2-based plasmids containing the respective coding sequences (Sivak et al., 2005; Chen et al., 2017). These were linearised with NotI (NEB), and RNA in vitro transcribed with mMESSAGE mMACHINE SP6 Transcription Kit (Ambion). RNA for Tol2 was generated from the pT3Ts-Tol2 plasmid, linearised with SmaI (NEB), and transcribed with the mMESSAGE mMACHINE T3 Transcription Kit (Ambion). RNA for injection was purified by lithium chloride precipitation.
Embryo injection and morpholino
Request a detailed protocolEmbryos were aligned on an agarose plate and injected at the one-cell stage with RNA or morpholino diluted in Phenol Red and Danieau’s buffer using a PLI-100 microinjector (Harvard Apparatus). Injection needles were pulled from borosilicate glass capillaries (0.5 mm inner diameter, Sutter) on a Sutter P-97 micropipette puller. The Duox morpholino (AGTGAATTAGAGAAATGCACCTTTT) was purchased from GeneTools and injected at 0.4 mM with 0.2 mM of the tp53 morpholino (GCGCCATTGCTTTGCAAGAATTG).
TALEN mutagenesis
Request a detailed protocolTo generate the ikbkg mutant, TALEN vectors targeting the sequence ATGGAGGGCTGG in second exon were designed and constructed by ToolGen (http://toolgen.com). TALEN vectors were linearised with PvuII (NEB) and purified using a PCR purification kit (Qiagen), and then used for in vitro transcription with the MEGAshortscript T7 kit (Ambion). About 170–300 pg of supplied ZFN RNAs or purified TALEN RNAs were then injected into one-cell stage WT zebrafish embryos, which were raised to 24 hr, then genomic DNA extracted.
For detection of fish with edited loci, PCR was performed on genomic DNA of injected fish with primers flanking the target site, cloned by TA cloning into pGEMT-Easy (Promega) or pCR2.1-TOPO-TA (Invitrogen) and individual clones sequenced to establish efficiency. Other embryos were raised to adulthood and their offspring were similarly genotyped to identify founder mutants.
Small-molecule treatment
Request a detailed protocolAll compounds for treating embryos were dissolved in DMSO, diluted in 0.5× E2 Embryo Medium and embryos treated by immersion. The compounds, and concentrations used, with catalogue numbers were diphenyleneiodonium chloride (DPI), 40 µM (D2926, Sigma); thapsigargin, 6.25 µM (T9033, Sigma); bisindolylmaleimide I (GF109203X), 85 µM (S7208, Selleckchem); YM-254890, 32 µM (10-1590-0100, Focus Biomolecules); 2-aminoethyl diphenylborinate (2-APB), 2.5 µM (D9754, Sigma), BI-D1870, 1.2 µM (Axon-1528, Axon Medchem); dimethyl fumarate, 9 µM (242926, Sigma); phorbol 12-myristate 13-acetate (PMA), 37.5 or 125 ng/ml (P8139, Sigma); U0126, 100 µM (9903, Cell Signaling Technology); PD184352 (CI-1040), 1.3 µM (S1020, Selleckchem). Unless otherwise stated, controls for all experiments were exposed to 0.5% DMSO carrier in 0.5× E2 Embryo Medium.
Proteomic analysis
Request a detailed protocolBatches of 100 WT, ddft419, and ddfti251 embryos were collected at 24 hr and 48 hr, dechorionated, deyolked, and protein extracted as per Alli Shaik et al., 2014. Protein was precipitated in 100% methanol at 4°C, then resuspended in 2-D cell lysis buffer (30 mM Tris-HCl, pH 8.8, containing 7 M urea, 2 M thiourea, and 4% CHAPS). 2-D DIGE and mass spectrometry protein identification was performed by Applied Biomics (Hayward, CA). Protein samples were labelled with either Cy2, Cy3, or Cy5, mixed, and then subjected to 2-D DIGE to separate individual proteins. Gels were scanned using Typhoon TRIO (Amersham BioSciences) and analysed by Image QuantTL and DeCyder (ver. 6.5) software (GE-Healthcare). Spots with more than 1.5-fold change were picked, in-gel trypsin digested, and protein identification performed by MALDI-TOF mass spectrometry and MASCOT search engine in the GPS Explorer software (Matrix Science).
In situ hybridisation
Request a detailed protocolA probe corresponding to the final 1078 bp of rps6ka3a (RSK2a; NM_212786.1) was generated by cloning a PCR-derived cDNA fragment into in pGEMT-Easy (Promega), linearising with ApaI (NEB) and transcribing a DIG probe with SP6 RNA polymerase (Roche). Whole-mount in situ hybridisation developed with NBT/BCIP (Roche) was performed as described (Thisse and Thisse, 2008).
Immunofluorescent, dye staining, and TUNEL
Request a detailed protocolFor antibody staining, embryos were fixed in 4% paraformaldehyde overnight at 4°C and then washed in PBT (0.1% Triton in PBS), permeabilised in −20°C acetone for 7 min, washed in PBT, blocked for 3 hr in Block solution (PBT supplemented with 4% BSA and 1% DMSO), then incubated overnight at 4°C with primary antibody diluted in Block solution, washed extensively in PBT, re-blocked in Block solution, then incubated overnight at 4°C with fluorescent secondary antibody diluted in Block solution. Following extensive PBT washing, embryos were cleared in 80% glycerol/PBS before imaging. Primary antibodies used and their dilutions are as follows: Chicken anti-eGFP antibody, 1:500 (ab13970, Abcam), Rabbit anti-eGFP, 1:500 (Tp401, Torrey Pines Biolabs), Rabbit anti-FITC, 1:200 (#71-1900, Thermo Fisher), Rabbit anti-beta catenin, 1:200 (ab6302, Abcam), Mouse anti-E-cadherin, 1:200 (#610181, BD Biosciences), Mouse anti-Tp63, 1:200 (CM163, Biocare Medical), Rabbit anti-phospho-p44/42 MAPK (Erk1/2) (Thr202/Tyr204), 1:100 (#4370, Cell Signaling Technology), Rabbit anti-p44/42 MAPK (Erk1/2), 1:100 (#9102, Cell Signaling Technology), and Rabbit anti-p90RSK (Phospho-Thr348), 1:100 (A00487, GenScript). All secondary antibodies were purchased from Invitrogen and used at 1:700 and were Alexa Fluor-488 Donkey anti-rabbit (A21206), Alexa Fluor-647 Donkey anti-rabbit (A31573), Alexa Fluor-546 Donkey anti-mouse (A10036), and Alexa Fluor-488 Goat anti-chicken (A-11039). Nuclei were counterstained using 5 µg/ml of DAPI (4',6-diamidino-2-phenylindole, dihydrochloride; D1306, Invitrogen) added during secondary antibody incubation.
To stain hydrogen peroxide, embryos were incubated for 60 min at room temperature with 12.5 µM PFBSF (#10005983, Cayman Chemicals), then rinsed in Embryo Medium, anaesthetised, and imaged.
Fluorescent TUNEL staining was performed using the Fluorescein In Situ Cell Death Detection Kit (11684795910, Roche), with the fluorescein detected by antibody staining using rabbit anti-FITC, and co-immunostained for TP63 and eGFP. Epidermal permeability assays were conducted by immersing 36hpf embryos in 2.5 mg/ml fluorescein isothiocyanate-dextran 3–5 kDa (Sigma) or 0.075% methylene blue for 30 min and then destained in E2 medium.
Microscopy and statistical analysis
Request a detailed protocolStill and timelapse imaging was performed on upright Zeiss AxioImager M2, Zeiss Light-sheet Z.1, upright Zeiss LSM800 Confocal Microscope or Zeiss AxioZoom V16 microscopes. Embryos were mounted in 1.2% Low Melting Point Agarose (Mo Bio Laboratories) in 0.5× E2 medium in 35 mm glass-bottom imaging dishes (MatTek) or in a 1 mm inner diameter capillary for light-sheet timelapse. When imaging was performed on live embryos, the embryo media were supplemented with buffered 0.02% Tricaine and imaging conducted at 25°C. Image processing was done using Zen 3.1 software (Zeiss), Fiji (ImageJ, ver. 1.52p), or Imaris (Bitplane) and compiled using Photoshop 2020 (Adobe). Neutrophils were tracked with TrackMate in Fiji or using the Spot function in Imaris. Kymographs were generated using the Reslice function in Fiji following generation of a line of interest across image. Fluorescence intensities were calculated using the Average Intensity function in Fiji following generation of a Region of Interest and masking of the DAPI channel to exclude the nucleus when required. In statistical analyses, n = number of embryos or cells measured, and as defined in the figure legend. GraphPad Prism was used for statistical analyses and graph generation. In all statistical tests, *p<0.05, **p<0.01, ***p<0.001. Tests used are indicated in the associated figure legend and were Student’s t-test, Chi-squared test, Mann–Whitney test, or ANOVA with Bonferroni or Dunn’s post-tests.
Data availability
All data generated or analysed during this study are included in the manuscript and supporting files.
References
-
CI-1040 (PD184352), a targeted signal transduction inhibitor of MEK (MAPKK)Seminars in Oncology 30:105–116.https://doi.org/10.1053/j.seminoncol.2003.08.012
-
Functional mapping of the zebrafish early embryo proteome and transcriptomeJournal of Proteome Research 13:5536–5550.https://doi.org/10.1021/pr5005136
-
Continual low-level MEK inhibition ameliorates cardio-facio-cutaneous phenotypes in zebrafishDisease Models & Mechanisms 5:546–552.https://doi.org/10.1242/dmm.008672
-
Entosis and apical cell extrusion constitute a tumor-suppressive mechanism downstream of matriptaseJournal of Cell Biology 219:e201905190.https://doi.org/10.1083/jcb.201905190
-
Mechanisms of desensitization and resensitization of proteinase-activated receptor-2Journal of Biological Chemistry 271:22003–22016.https://doi.org/10.1074/jbc.271.36.22003
-
Imaging early embryonic calcium activity with GCaMP6s transgenic zebrafishDevelopmental Biology 430:385–396.https://doi.org/10.1016/j.ydbio.2017.03.010
-
Activation of MEK2 is sufficient to induce skin papilloma formation in transgenic zebrafishJournal of Biomedical Science 22:102.https://doi.org/10.1186/s12929-015-0207-2
-
Calcium-Mediated interactions regulate the subcellular localization of extracellular Signal-Regulated kinases (ERKs)Cellular Physiology and Biochemistry : International Journal of Experimental Cellular Physiology, Biochemistry, and Pharmacology 54:474–492.https://doi.org/10.33594/000000231
-
Mechanisms of epithelial wound detectionTrends in Cell Biology 25:398–407.https://doi.org/10.1016/j.tcb.2015.02.007
-
Identification of a novel inhibitor of mitogen-activated protein kinase kinaseJournal of Biological Chemistry 273:18623–18632.https://doi.org/10.1074/jbc.273.29.18623
-
Osmotic surveillance mediates rapid wound closure through nucleotide releaseJournal of Cell Biology 207:767–782.https://doi.org/10.1083/jcb.201408049
-
RSK2 protein suppresses integrin activation and fibronectin matrix assembly and promotes cell migrationJournal of Biological Chemistry 287:43424–43437.https://doi.org/10.1074/jbc.M112.423046
-
Formation of tissue factor-factor VIIa-factor xa complex promotes cellular signaling and migration of human breast Cancer cellsJournal of Thrombosis and Haemostasis 2:93–101.https://doi.org/10.1111/j.1538-7836.2004.00545.x
-
p90 ribosomal S6 kinase 2 promotes invasion and metastasis of human head and neck squamous cell carcinoma cellsJournal of Clinical Investigation 120:1165–1177.https://doi.org/10.1172/JCI40582
-
Proteinase-activated receptor-2-mediated activation of stress-activated protein kinases and inhibitory kappa B kinases in NCTC 2544 keratinocytesJournal of Biological Chemistry 276:31657–31666.https://doi.org/10.1074/jbc.M100377200
-
Membrane-bound serine protease inhibitor HAI-1 is required for maintenance of intestinal epithelial integrityThe American Journal of Pathology 179:1815–1826.https://doi.org/10.1016/j.ajpath.2011.06.038
-
Stages of embryonic development of the zebrafishDevelopmental Dynamics 203:253–310.https://doi.org/10.1002/aja.1002030302
-
Fluorescent probes for hydrogen peroxide based on a non-oxidative mechanismAngewandte Chemie International Edition 43:2389–2391.https://doi.org/10.1002/anie.200452381
-
Cell surface-anchored serine proteases in Cancer progression and metastasisCancer and Metastasis Reviews 38:357–387.https://doi.org/10.1007/s10555-019-09811-7
-
Live imaging of chronic inflammation caused by mutation of zebrafish Hai1Journal of Cell Science 120:3372–3383.https://doi.org/10.1242/jcs.009159
-
Proteomic analysis reveals a role for RSK in p120-catenin phosphorylation and melanoma Cell-Cell adhesionMolecular & Cellular Proteomics 19:50–64.https://doi.org/10.1074/mcp.RA119.001811
-
Proteinase-activated receptor-2 (PAR2): a tumor suppressor in skin carcinogenesisJournal of Investigative Dermatology 127:2245–2252.https://doi.org/10.1038/sj.jid.5700847
-
Imaging macrophage chemotaxis in vivo: studies of microtubule function in zebrafish wound inflammationCell Motility and the Cytoskeleton 63:415–422.https://doi.org/10.1002/cm.20133
-
Activation of dual oxidases Duox1 and Duox2: differential regulation mediated by camp-dependent protein kinase and protein kinase C-dependent phosphorylationThe Journal of Biological Chemistry 284:6725–6734.https://doi.org/10.1074/jbc.M806893200
-
Regulation and function of the RSK family of protein kinasesBiochemical Journal 441:553–569.https://doi.org/10.1042/BJ20110289
-
RSK1 activation promotes invasion in nodular melanomaThe American Journal of Pathology 185:704–716.https://doi.org/10.1016/j.ajpath.2014.11.021
-
Cancer as an overhealing wound: an old hypothesis revisitedNature Reviews Molecular Cell Biology 9:628–638.https://doi.org/10.1038/nrm2455
-
Protease signaling regulates apical cell extrusion, cell contacts, and proliferation in epitheliaJournal of Cell Biology 217:1097–1112.https://doi.org/10.1083/jcb.201709118
-
PAR-2 promotes invasion and migration of esophageal Cancer cells by activating MEK/ERK and PI3K/Akt signaling pathwayInternational Journal of Clinical and Experimental Pathology 12:787–797.
-
Protease-activated receptor-2 induces migration of pancreatic Cancer cells in an extracellular ATP-dependent mannerJournal of Thrombosis and Haemostasis 11:1892–1902.https://doi.org/10.1111/jth.12361
-
PAR2 triggers IL-8 release via MEK/ERK and PI3-kinase/Akt pathways in GI epithelial cellsBiochemical and Biophysical Research Communications 377:622–626.https://doi.org/10.1016/j.bbrc.2008.10.018
-
ERK signalling as a regulator of cell motilityThe Journal of Biochemistry 162:145–154.https://doi.org/10.1093/jb/mvx048
-
The CARD11-BCL10-MALT1 (CBM) signalosome complex: stepping into the limelight of human primary immunodeficiencyJournal of Allergy and Clinical Immunology 134:276–284.https://doi.org/10.1016/j.jaci.2014.06.015
-
Protease-activated receptor-2 stimulates intestinal epithelial chloride transport through activation of PLC and selective PKC isoformsAmerican Journal of Physiology-Gastrointestinal and Liver Physiology 296:G1258–G1266.https://doi.org/10.1152/ajpgi.90425.2008
-
Biased signaling of Protease-Activated receptorsFrontiers in Endocrinology 5:67.https://doi.org/10.3389/fendo.2014.00067
Article and author information
Author details
Funding
Ministry of Education - Singapore (2015-T1-001-035)
- Jiajia Ma
- Tom J Carney
Ministry of Education - Singapore (MOE2016-T3-1-005)
- Harsha Mahabaleshwar
The funders had no role in study design, data collection and interpretation, or the decision to submit the work for publication.
Ethics
Animal experimentation: Fish were housed at the IMCB and the NTU zebrafish facilities under IACUC numbers #140924 and #A18002 respectively, and according to the guidelines of the National Advisory Committee for Laboratory Animal Research. Approval was provided by the Institutional Animal Care and Use Committees of the Biological Resource Centre (IMCB) and NTU according to Agri-Food and Veterinary Authority (AVA) Rules and the National Advisory Committee for Laboratory Animal Research (NACLAR) requirements.
Copyright
© 2021, Ma et al.
This article is distributed under the terms of the Creative Commons Attribution License, which permits unrestricted use and redistribution provided that the original author and source are credited.
Metrics
-
- 2,219
- views
-
- 244
- downloads
-
- 8
- citations
Views, downloads and citations are aggregated across all versions of this paper published by eLife.
Citations by DOI
-
- 8
- citations for umbrella DOI https://doi.org/10.7554/eLife.66596
Download links
A two-part list of links to download the article, or parts of the article, in various formats.
Downloads (link to download the article as PDF)
Open citations (links to open the citations from this article in various online reference manager services)
Cite this article (links to download the citations from this article in formats compatible with various reference manager tools)
Matriptase activation of Gq drives epithelial disruption and inflammation via RSK and DUOX
eLife 10:e66596.
https://doi.org/10.7554/eLife.66596


