KSR1- and ERK-dependent translational regulation of the epithelial-to-mesenchymal transition
- Eppley Institute, University of Nebraska Medical Center, United States
- Department of Genetics, Cell Biology and Anatomy, University of Nebraska Medical Center, United States
- Department of Pathology and Microbiology, University of Nebraska Medical Center, United States
- Hubrecht Institute, Royal Netherlands Academy of Arts and Sciences (KNAW) and UMC Utrecht, Netherlands
- Department of Oral Biology, University of Nebraska Medical Center, United States
Figures
Figure 1 with 2 supplements
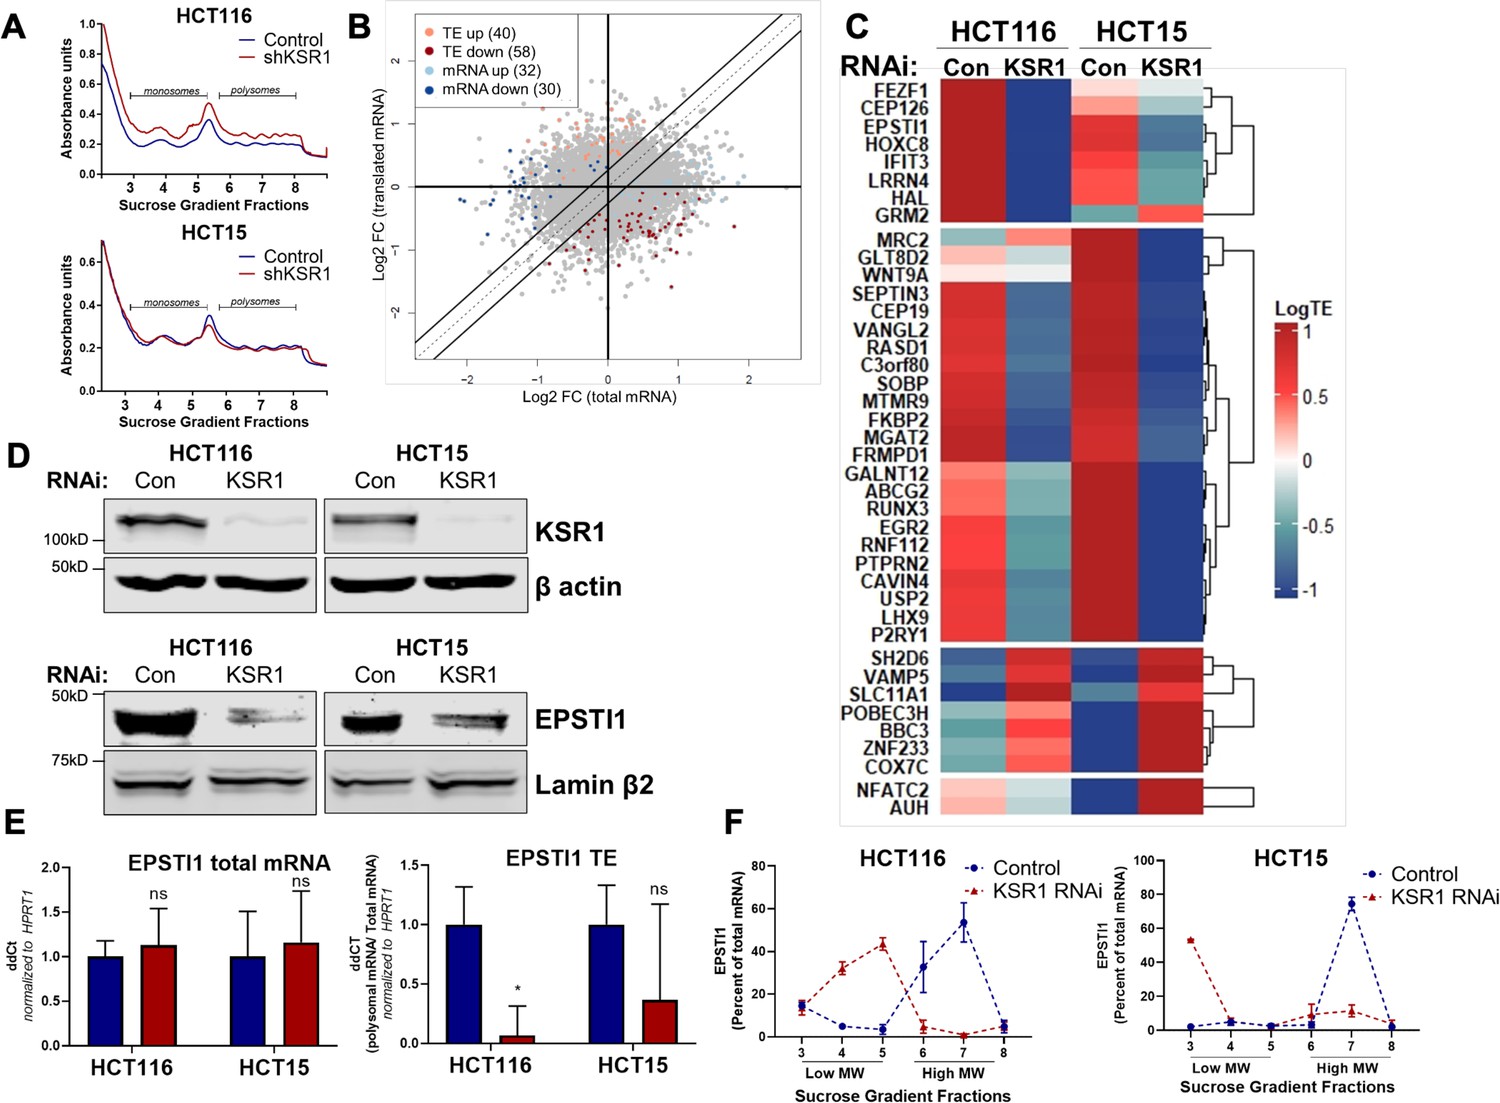
EPSTI1 translation is regulated by KSR1.
(A) Representative polysome profiles from control and KSR1 knockdown (KSR1 RNAi) HCT116 and HCT15 cells. Sucrose gradient fractions 3–5 denote the low-molecular-weight complexes (monosomes) and the fractions 6–8 are the high-molecular-weight complexes (polysomes). (B) Scatter plot of polysome-associated mRNA to total mRNA log2 fold-changes upon KSR1 knockdown in HCT116 and HCT15 with RNA-seq. The statistically significant genes in the absence of KSR1 are classified into four groups with a fold change (|log2FC|) > 1.2 and p-value < 0.05. The number of mRNAs with a change in TE (orange and red) are indicated (n = 3 for each condition). TE, translational efficiency. (C) Heatmap of TE changes for the top 40 RNAs control and KSR1 knockdown (KSR1 RNAi) HCT116 and HCT15 cells (n = 3 for each condition). (D) Western blot analysis of KSR1 and EPSTI1 following KSR1 knockdown in HCT116 and HCT15 cells. (E) RT-qPCR analysis of EPSTI1 mRNA from total RNA and polysomal RNA (fractions number 6–8) in control and KSR1 knockdown HCT116 and HCT15 cells, the TE was calculated as the ratio of polysomal mRNA to the total mRNA (n = 3; *, p < 0.05). (F) RT-qPCR analysis of EPSTI1 mRNA levels isolated from sucrose gradient fractions of the control and KSR1 knockdown HCT116 and HCT15 cells. Fractions 3–5 (low MW) and 6–8 (high MW) are plotted for the control and KSR1 knockdown state with values corresponding to the percentage of total mRNA across these fractions n = 3. Experiments shown in (A–F) are representative of three independent experiments.
Figure 1—figure supplement 1
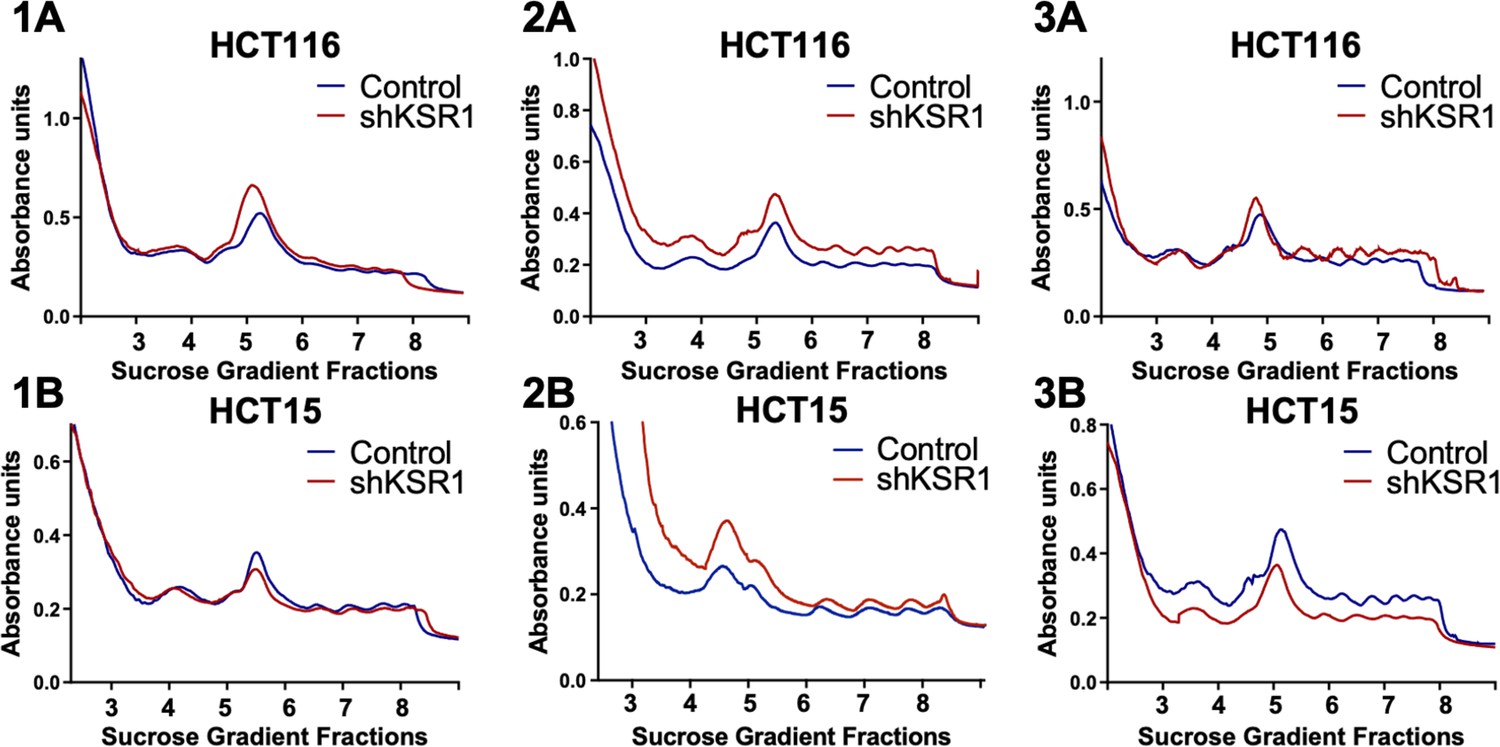
Three independent replicates of the polysome profiles from control and KSR1 knockdown (shKSR1) HCT116 and HCT15 cells.
Figure 1—figure supplement 2A and 1B were used as representative images for Figure 1A.
Figure 1—figure supplement 2
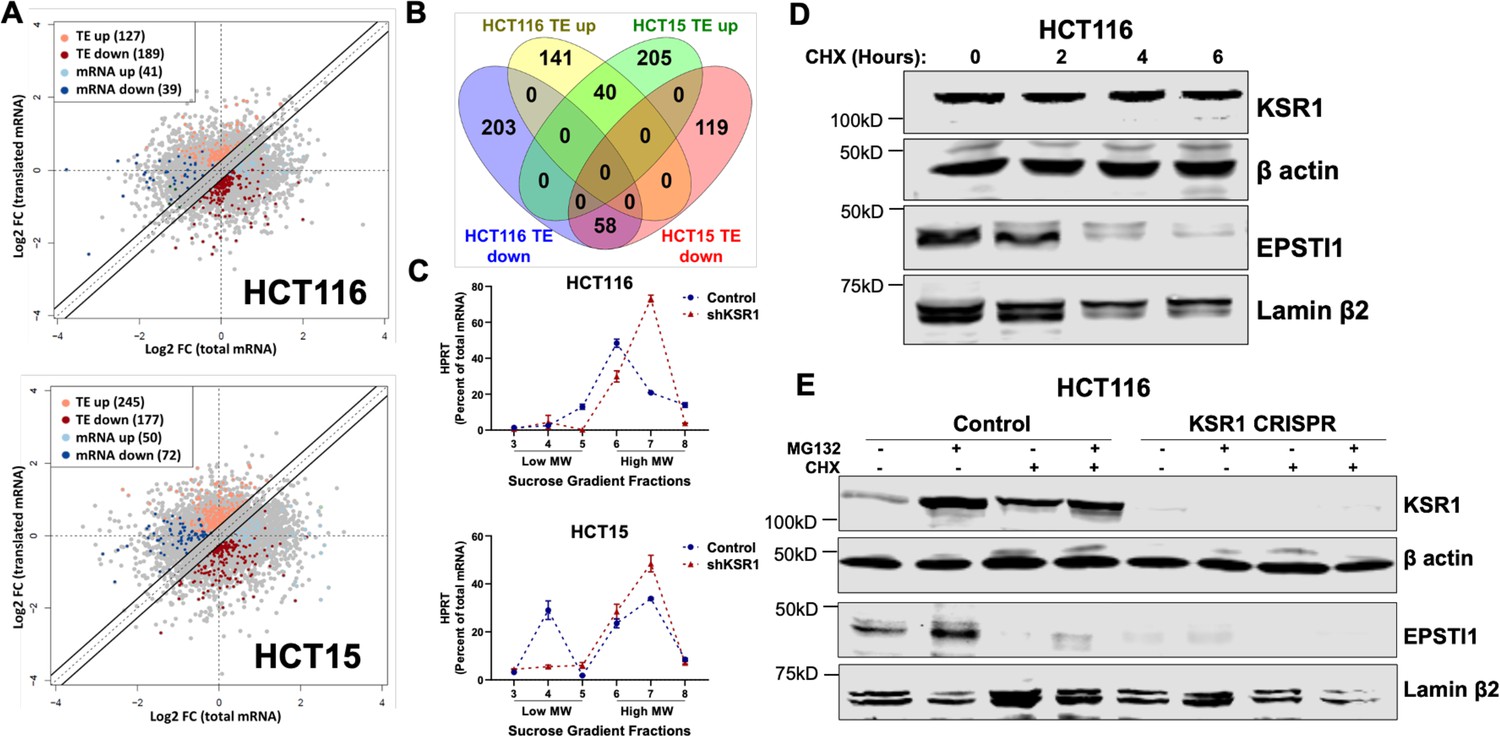
EPSTI1 is translationally regulated by KSR1.
(A) Scatter plot of polysome-associated mRNA to total mRNA log2 fold-changes upon KSR1 knockdown in HCT116 (top) and HCT15 (bottom) with RNA-seq. The statistically significant genes in the absence of KSR1 are classified into four groups with a fold change (|log2FC| > 1.2) and p-value < 0.05. The number of mRNAs with a change in TE (orange and red) are indicated (n = 3 for each cell line). TE, translational efficiency (B) Differential gene expression analysis comparing genes whose TE is changed upon KSR1- knockdown in HCT116 and HCT15 (C) RT-qPCR analysis of HPRT mRNA levels isolated from sucrose gradient fractions of the control and KSR1 knockdown HCT116 and HCT15 cells. Fractions 3–5 (low MW) and 6–8 (high MW) are plotted for the control and KSR1 knockdown state with values corresponding to the percentage of total mRNA across these fractions. Experiments shown in (A–C) are representative of three independent experiments. (D) EPSTI1 and KSR1 levels were assessed by western blot following treatment with cycloheximide (CHX) for 0, 2, 4, and 6 hr in HCT116 cells. (E) Representative western blot images showing HCT116 control and KSR1 CRISPR cells treated with DMSO or 10 µM of MG132 for 6 hours in the presence or absence of 10 µM of CHX for 6 hr and levels of KSR1 or EPSTI1 protein were revealed by western blot. Experiments shown in (D–E) are representative of at least two independent experiments.
Figure 2
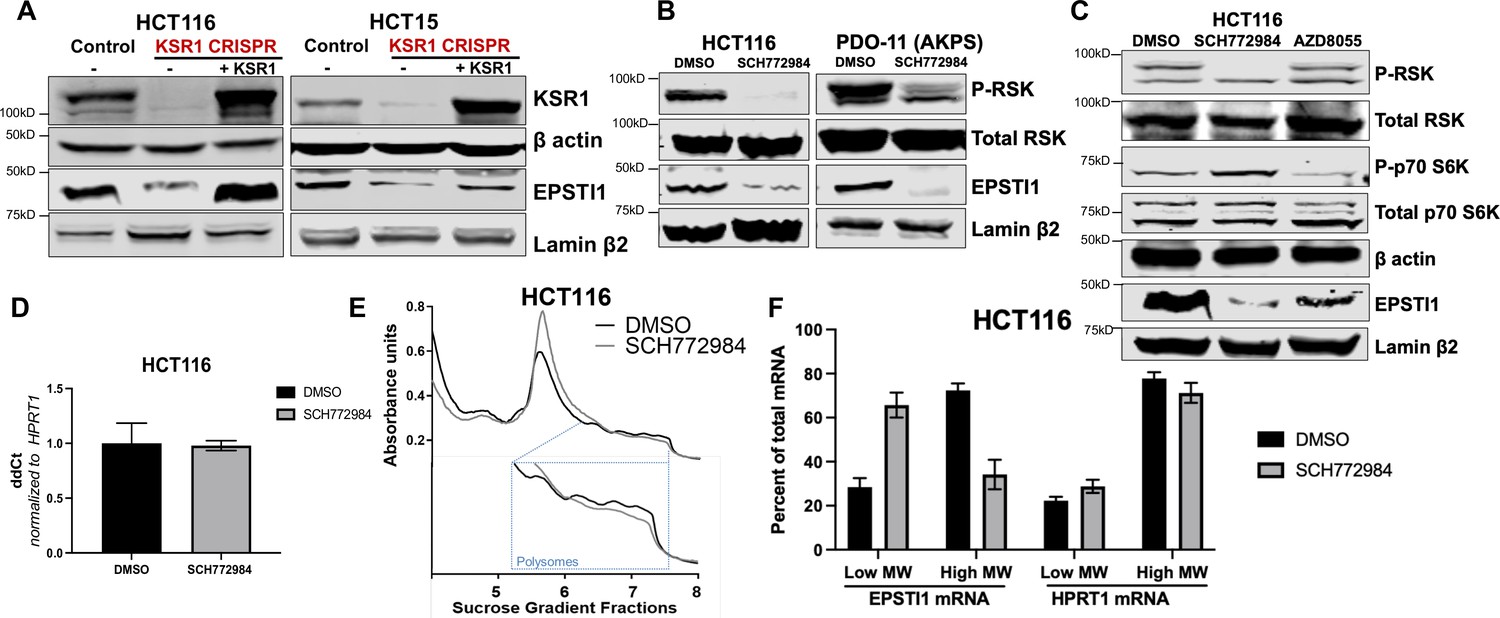
KSR1 or ERK inhibition suppresses EPSTI1 protein expression in cell lines and organoids.
(A) Cell lysates prepared from control, KSR1 CRISPR-targeted (KSR1 CRISPR) and CRISPR-targeted HCT116 and HCT15 cells expressing KSR1 (KSR1 CRISPR+ KSR1) analyzed for EPSTI1 protein expression by western blotting. (B) Western blot of the indicated proteins in HCT116 (left) and AKPS quadruple mutant organoids (right) treated with DMSO or 1 µM of SCH772984 for 48 hr. (C) EPSTI1 protein expression was analyzed by western blot in HCT116 cells treated with DMSO, 1 µM of SCH772984, or 1 µM of AZD8055 for 48 hr. (D) RT-qPCR analysis of EPSTI1 mRNA from total RNA in HCT116 cells treated with either DMSO or ERK1/2 selective inhibitor, SCH772984 (n = 3; ns, non-significant). (E) Representative polysome profiles from HCT116 cells treated DMSO or 1 µM of ERK1/2 selective inhibitor, SCH772984. (F) RT-qPCR analysis of EPSTI1 and HPRT1 mRNA levels from LMW (fractions 3–5) and HMW (fractions 6–8) of the DMSO control or SCH772984-treated HCT116 cells (n = 3; *, p < 0.05; ***, p < 0.001). All values displayed as mean ± S.D. Experiments shown in (A–F) are representative of three independent experiments.
Figure 3
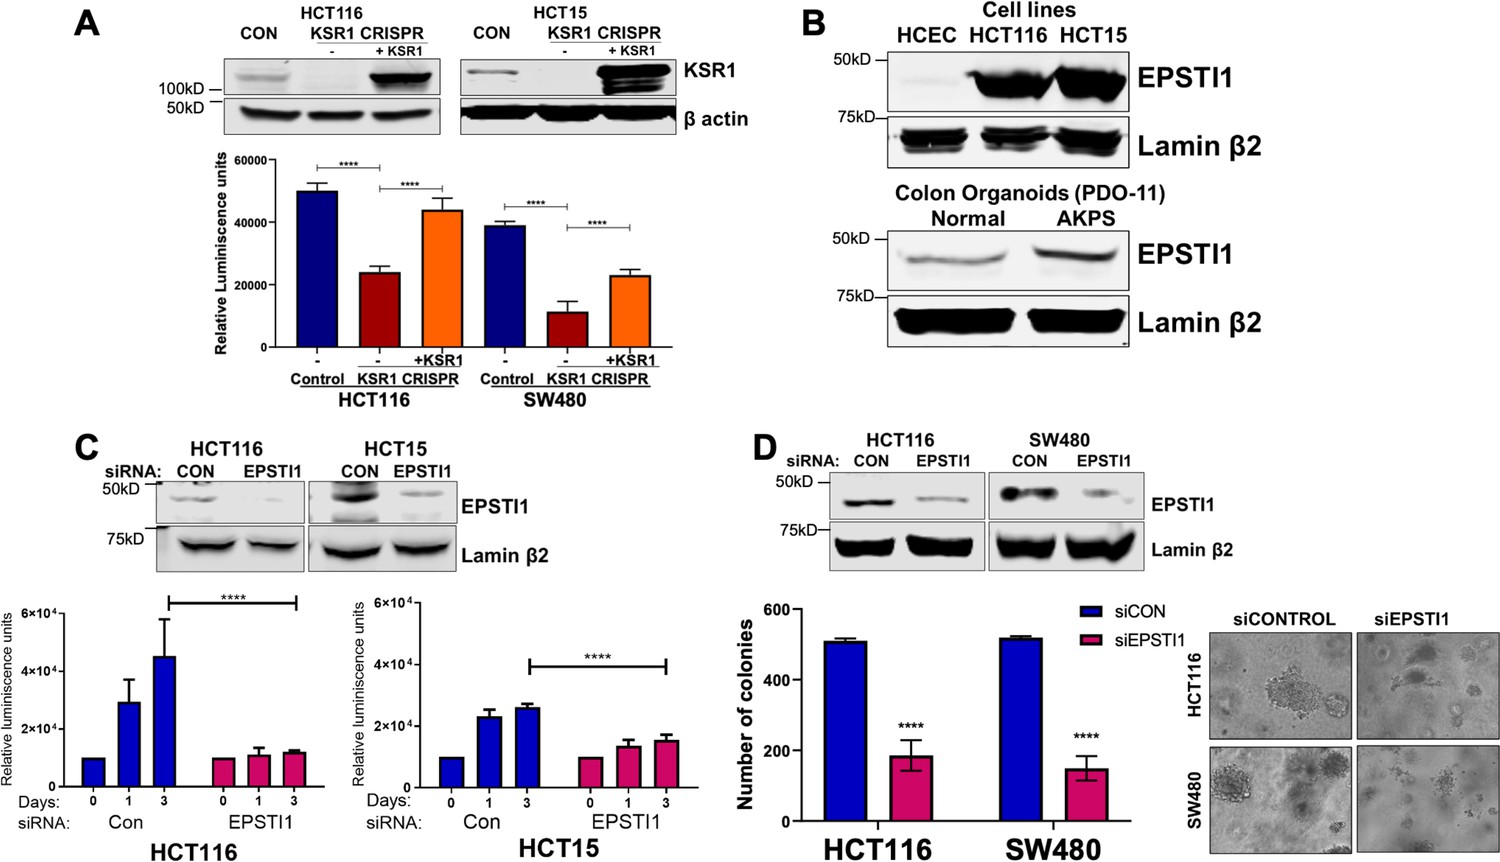
EPSTI1 is overexpressed in cancer cell lines and organoids and promotes anchorage-independent growth.
(A) Anchorage-independent cell viability was analyzed in HCT116 and HCT15 cells plated on poly-(HEMA)-coated plates was measured using CellTiter-Glo following CRISPR-targeting (KSR1 CRISPR) and re-expressing KSR1 (KSR1 CRISPR+ KSR1) in the CRISPR-targeted cells. The data are shown as relative luminescence units mean ± SD, n = 6. Matched results were analyzed for statistical significance one-way ANOVA followed by t-test. (Upper panels) Western blot showing the expression of KSR1 in control, KSR1 knockout and KSR1-knockout cells expressing a KSR1 transgene (+ KSR1). (B) Western blot analysis of EPSTI1 protein expression was assessed in HCECs, HCT116, HCT15, normal human colon organoids, and transformed AKPS colon organoids. (C) Viability of HCT116 and HCT15 cells measured using CellTiter-Glo following siRNA knockdown of EPSTI1 that were plated on poly-(HEMA)-coated plates to simulate anchorage-independent conditions. Cell viability was measured immediately after plating and 0, 1, and 3 days after plating (n = 6). The data are shown as mean luminescence units ± SD. Matched results were analyzed for statistical significance by t-test. (Top) Western blot confirming the knockdown of EPSTI1 in HCT116 and SW480 at Day 3. (D) (Left) Quantification of the colonies formed in HCT116 and SW480 cells following RNAi knockdown using non-targeting control (siCON) or EPSTI1 (siEPSTI1) after plating on soft agar. (Right) Representative photomicrographs of colonies for each sample. The data are illustrated as the number of colonies present after 2 weeks, mean ± SD, n = 6. Paired results were analyzed for statistical significance using Student’s t test. (Top) Western blot confirming the knockdown of EPSTI1 in HCT116 and SW480 cells. ****, p < 0.0001.
Figure 4
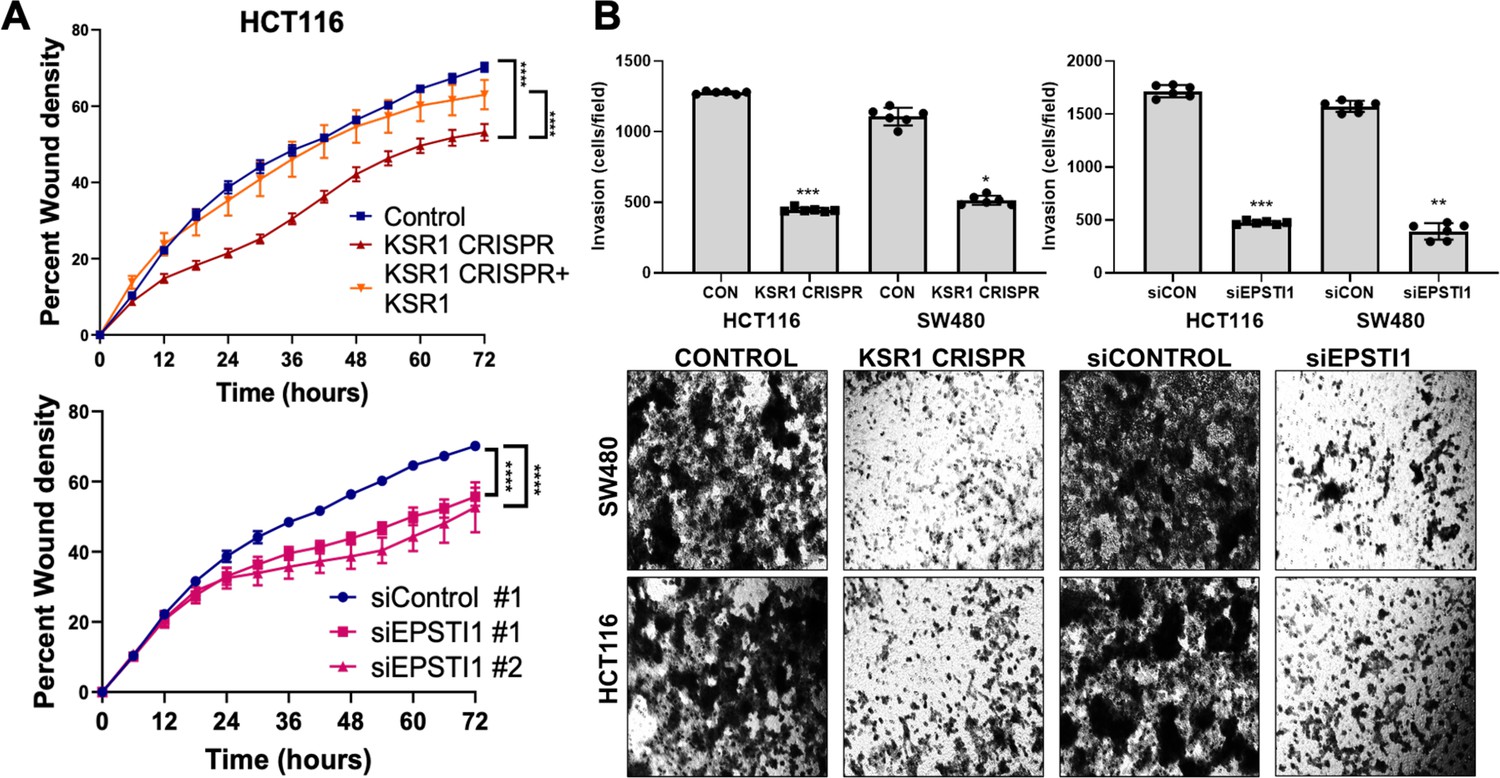
KSR1 or EPSTI1 promote migration and invasion in CRC cells.
(A) Control, CRISPR-targeted (KSR1 CRISPR) and CRISPR-targeted HCT116 cells expressing KSR1 (KSR1 CRISPR+ KSR1) (upper) and control or EPSTI1 knockdown HCT116 cells (lower) were evaluated in a 96-well IncuCyte scratch wound assay. The graph represents the time kinetics of percent wound density, calculated by IncuCyte ZOOM software, shown as mean ± SD, n = 12 ****, p < 0.0001. Matched results were analyzed for statistical significance using one-way ANOVA with Dunnett’s posttest for multiple comparisons. (B) (Upper panels) Control, KSR1 knockout (KSR1 CRISPR), and EPSTI1 knockdown (siEPSTI1) were subjected to Transwell migration assay through Matrigel for 24 hr using 10 % FBS as chemoattractant. The number of invaded cells per field were counted. Data are the mean ± SD (n = 6); *, p < 0.1; **, p < 0.01; ***, p < 0.001. (Lower panels) Representative images of Giemsa-stained cells 24 hr after invasion through Matrigel.
Figure 5 with 1 supplement
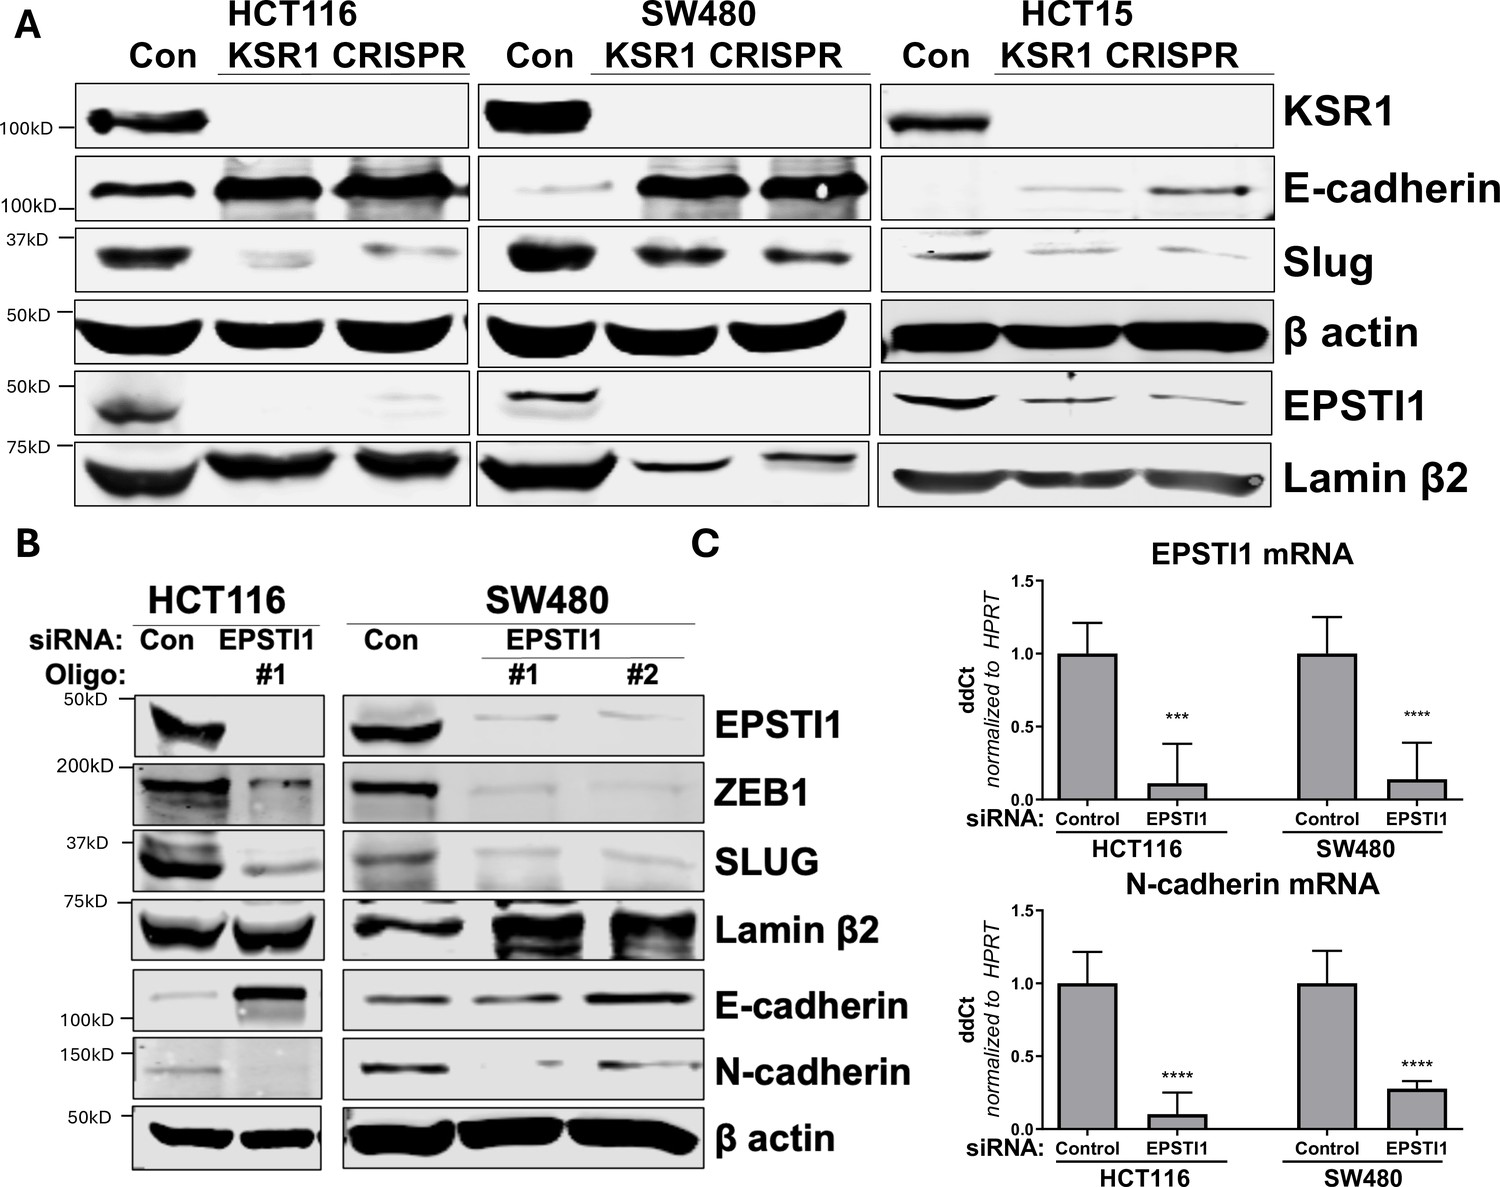
KSR1 and EPSTI1 promote cadherin switching.
(A) Western blot analysis of the cell lysates prepared from control, and two clones of CRISPR-targeted HCT116, SW480, and HCT15 cells (KSR1 CRISPR) for the E-cadherin, Slug, and EPSTI1. (B) Western blot of ZEB1, Slug, E-cadherin, and N-cadherin in HCT116 and SW480 cells 72 hr following EPSTI1 knockdown. (C) RT-qPCR analysis of EPSTI1 mRNA (upper) and N-cadherin (lower) following knockdown of EPSTI1 for 72 hr in HCT116 and SW480 cells. n = 6; ***, p < 0.001; ****, p < 0.0001. Western blots shown in (A) and (B) and qPCR shown in (C) are representative of at least three independent experiments.
Figure 5—figure supplement 1
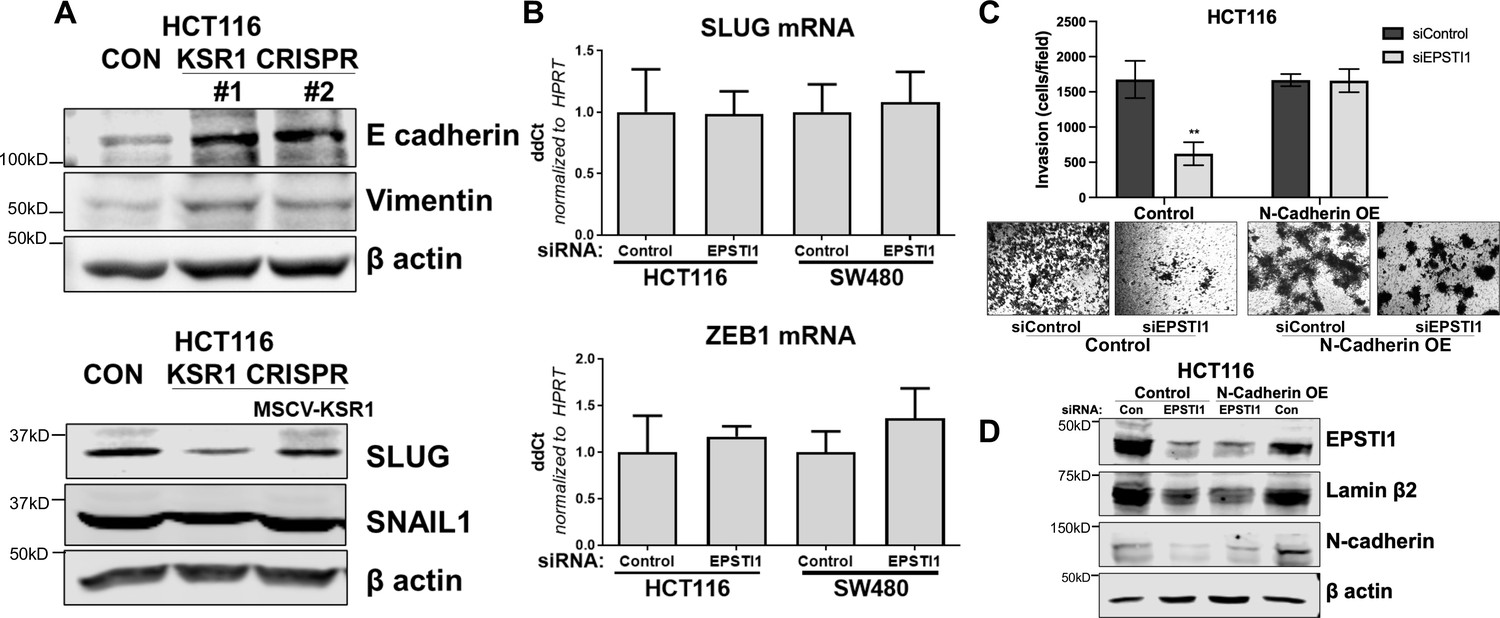
KSR1 and EPSTI1 promote the cadherin switch.
(A) Western blot analysis of the cell lysates prepared from control, and two clones of CRISPR-targeted HCT116 (KSR1 CRISPR) for (Top- upper) E-cadherin and Vimentin, and (bottom-lower) Cell lysates prepared from control, CRISPR-targeted (KSR1 CRISPR) and CRISPR-targeted HCT116 cells expressing KSR1 (MSCV-KSR1) analyzed for Slug and Snail. (B) RT-qPCR analysis of Slug mRNA (top-upper) and ZEB1 (bottom-lower) following knockdown of EPSTI1 for 72 hr in HCT116 and SW480 cells. (C) (Upper panels) Control, EPSTI1 knockdown (siEPSTI1) with and without N-cadherin over-expression (N-cadherin OE) were subjected to Transwell migration assay through Matrigel for 24 hr using 10 % FBS as chemoattractant. The number of invaded cells per field were counted. Data are the mean ± SD (n = 4); ***, p < 0.001. (Lower panels) Representative images of Giemsa-stained cells 24 hr after invasion through Matrigel. (D) Western blot analysis of EPSTI1 and N-cadherin from control and EPSTI1 knockdown cell lysates with and without N-cadherin OE. Experiments are representative of at least two independent experiments.
Figure 6 with 1 supplement
EPSTI1 rescues cadherin switching and invasive behavior to KSR1 knockout cells.
(A) EPSTI1 protein expression was assessed by western blotting in control, KSR1-targeted (KSR1 CRISPR) HCT116, SW480, and HCT15 cells with and without EPSTI1 (FLAG-EPSTI1) expression. Cells were lysed and probed for Slug, E-cadherin, N-cadherin, Lamin β2, and β actin. (B) Immunofluorescence staining for E-cadherin (Red) and DAPI (blue) in control or KSR1-targeted (KSR1 CRISPR) HCT116, SW480, and HCT15 cells with and without EPSTI1 (FLAG-EPSTI1) expression. (C) Control, CRIPSR- targeted (KSR1-CRISPR), and CRISPR-targeted HCT116 and SW480 cells expressing EPSTI1 (KSR1 CRISPR+ FLAG-EPSTI1) were subjected to the 96-well IncuCyte scratch wound assay. The graph represents the time kinetics of percent wound density, calculated by IncuCyte ZOOM software, shown as mean ± SD, n = 12; **, p < 0.005; ***, p < 0.001; ****, p < 0.0001. Matched results were analyzed for statistical significance using one-way ANOVA with Dunnett’s posttest for multiple comparisons. (D) Control, CRISPR-targeted (KSR1 CRISPR), and CRISPR-targeted HCT116 and SW480 cells expressing EPSTI1 (KSR1 CRISPR+ FLAG-EPSTI1) were subjected to Transwell migration assay through Matrigel . The number of invaded cells per field were counted, (n = 4); ****, p < 0.0001. Representative microscopic images of the respective cells following invasion through Matrigel are shown.
Figure 6—figure supplement 1
EPSTI1 rescues cadherin switching and invasive behavior to KSR1 knockout cells.
Cell proliferation growth curves in control (blue), KSR1 CRISPR (red) HCT116 (A) and SW480 (B) with and without EPSTI1 (green) or KSR1 expression (orange) (n = 4; ns, non-significant, statistical analysis using t test with individual variances computed comparing KSR1 knockout versus control (a), KSR1 re-expression (b), and EPSTI1 re-expression (c, d); a, b, c = p < 0.0001; d = p < 0.005). (C) Western blot analysis of KSR1 and EPSTI1 in control, KSR1-targeted (KSR1 CRISPR) HCT116 and SW480 cells with and without EPSTI1 or KSR1 expression. HCT116 (D) and SW480 (E) were transfected with EPSTI1 siRNA (siEPSTI1) or non-targeting control (siControl). After plating cells evenly, cells were counted on day 1, 3, 5, and 7. (n = 4; ns, non-significant **, p < 0.005; ****, p < 0.0001). (F) Validation of EPSTI1 knockdown after 7 days was done using western blot.
Figure 7
EPSTI1 expression in KSR1 KO CRC cells and HCEC cells induces N-cadherin expression and restores anchorage-independent growth in CRC cells.
(A) RT-qPCR analysis of EPSTI1 mRNA (left) and N- cadherin (right) in HCT116 and SW480 cells following KSR1 disruption with and without expression of EPSTI1 (FLAG-EPSTI1) in KSR1 KO cells. (n = 3), **, p < 0.01***, p < 0.001 (B) (Top panels) Wild-type (WT) HCEC, HCECs transfected with MSCV-IRES-GFP (IRES-GFP) or MSCV-FLAG-EPSTI1-IRES-GFP (EPSTI1-GFP) were subjected to Transwell migration assay through Matrigel . The number of invaded cells per field were counted, (n = 4); ***, p < 0.001. Representative microscopic images of the respective cells following invasion through Matrigel are shown. (Bottom panels) Western blot analysis of EPSTI1 and N-cadherin from the cell lysates prepared from Wild-type (WT) HCEC, HCECs transfected with MSCV-IRES-GFP (IRES-GFP) or MSCV-FLAG-EPSTI1-IRES-GFP (EPSTI1-GFP). (C) KSR1 KO HCT116 and HCT15 cell viability (CellTiter-Glo) on poly-(HEMA)-coated plates at the indicated days with or without EPSTI1 (KSR1 CRISPR + EPSTI1) expression. The data are shown as relative luminescence units mean ± SD, (n = 6); ****, p < 0.0001. The data were analyzed for statistical significance by one-way ANOVA followed by t-test. (D) Quantification of anchorage-independent colonies formed by KSR1 knockout HCT116 and SW480 cells with and without EPSTI1 expression (KSR1 CRISPR+ FLAG-EPSTI1) after plating in soft agar. Representative photomicrographs of colonies from each cell line are shown. The data are illustrated as the number of colonies present after 2 weeks, (n = 6) mean ± SD. ****, p < 0.0001. Data were analyzed for statistical significance one-way ANOVA followed by t-test.
Author response image 1

RT-qPCR analysis of EPSTI1 and HPRT1 mRNA levels from LMW (fractions 3-5) and HMW (fractions 6-8) of the control and KSR1 knockdown HCT116 and HCT15 cells (n=3; **, P<0.05; ***, P<0.001; ns, non-significant).
Tables
Key resources table
| Reagent type (species) or resource | Designation | Source or reference | Identifiers | Additional information |
|---|---|---|---|---|
| Cell line (Homo sapiens) | Colorectal carcinoma, epithelial | ATCC | HCT116 (ATCC, Cat# CCL-247, RRID:CVCL_0291) | |
| Cell line (Homo sapiens) | Colorectal carcinoma, epithelial | ATCC | HCT15 (ATCC, Cat# CCL-225, RRID:CVCL_0292) | |
| Cell line (Homo sapiens) | Colorectal adenocarcinoma, epithelial | ATCC | SW480 (ATCC, Cat# CCL-228, RRID:CVCL_0546) | |
| Cell line (Homo sapiens) | Immortalized colon epithelial | Obtained from Dr. Jerry Shay | HCEC | |
| Cell line (Homo sapiens) | Kidney; epithelial fibroblast (fetus) | ATCC | HEK-293T (ATCC Cat# CRL-3216, RRID:CVCL_0063) | |
| Cell line (Homo sapiens) | Kidney; epithelial fibroblast (fetus) | Obtained from Rob Kortum | Phoenix-GP | Available at ATCC (Cat# CRL-321) |
| Transfected construct (Homo sapiens) | siRNA to non-targeting control | Dharmacon | Cat# D-001810-01-20 | UGGUUUACAUGUCGACUAA |
| Transfected construct (Homo sapiens) | siRNA to EPSTI1 | Dharmacon | Cat# 015094-09-0020 | GAACAGAGCUAAACCGGUU |
| Transfected construct (Homo sapiens) | siRNA to EPSTI1 | Dharmacon | Cat# 015094-12-0020 | UCUGGAGGCUGUUGGAAUA |
| Transfected construct (Homo sapiens) | Con shRNA#1 | Fisher et al., 2015 | pLKO.1 MC1 puro | CAACAAGATGAAGAGCACCAA |
| Transfected construct (Homo sapiens) | KSR1 shRNA#1 | Fisher et al., 2015 | pLKO.1 KSR.1 puro | GTGCCAGAAGAGCATGATTTT |
| Transfected construct (Homo sapiens) | KSR1 shRNA#2 | Fisher et al., 2015 | pLKO.1 KSR.2 puro | GCTGTTCAAGAAAGAGGTGAT |
| Transfected construct (Homo sapiens) | CON sgRNA#1 | This paper | pCAG-SpCas9-GFP-U6-gNC1 | GTATTACTGATATTGGTGGG |
| Transfected construct (Homo sapiens) | KSR1 sgRNA#1 | This paper | pCAG-SpCas9-GFP-U6-gCR1.1 | TTGGATGCGCGGCGGGAAAG |
| Transfected construct (Homo sapiens) | KSR1 sgRNA#2 | This paper | pCAG-SpCas9-GFP-U6-gCR1.2 | CTGACACGGAGATGGAGCGT |
| Recombinant DNA reagent | FLAG-KSR1 (plasmid) | Fisher et al., 2015 | MSCV-KSR1-IRES-GFP | |
| Recombinant DNA reagent | FLAG-EPSTI1 (plasmid) | This paper | MSCV-FLAG-EPSTI1-IRES-GFP | MGC Human EPSTI1 Sequence-Verified cDNA (Cat# MHS6278-202832484) cloned into MSCV-IRES-GFP construct |
| Recombinant DNA reagent | N-cad OE (plasmid) | Gift from Dr. Keith Johnson | N-cadherin-mGFP | |
| Sequence-based reagent | EPSTI1 (PCR primer) | IDT | Cat# Hs.PT.58.50471678 | Forward primer 5’-GTGAATTACTGGAACTGAAACGG-3’ Reverse primer 5’ TCCAACAGCCTCCAGATTG 3’ Tm 55 °C, Exon Location 10–11 |
| Sequence-based reagent | N-cadherin (PCR primer) | IDT | Cat# Hs.PT.58.26024443 | Forward primer 5’-GTTTGCCAGTGTGACTCCA-3’ Reverse primer 5’-CATACCACAAACATCAGCACAAG-3’ Tm 55 °C, Exon Location 13–14 |
| Sequence-based reagent | HPRT1 (PCR primer) | IDT | Cat# Hs.PT.58v.45621572 | Forward Primer: 5’ GTATTCATTATAGTCAAGGGCATATCC 3’ Reverse Primer: 5’AGATGGTCAAGGTCGCAAG 3’ Tm 60 °C, Exon Location 8–9 |
| Sequence-based reagent | ZEB1 (PCR primer) | IDT | Cat# Hs.PT.58.39178574 | Forward primer 5’-GAGGAGCAGTGAAAGAGAAGG-3’ Reverse primer 5’-TACTGTACATCCTGCTTCATCTG-3’ Tm 60 °C, Exon Location 3–5 |
| Sequence-based reagent | SLUG (PCR primer) | IDT | Cat# Hs.PT.58.50471678 | Forward primer 5’-AGGACACATTAGAACTCACACG-3’ Reverse primer 5’-CAGATGAGCCCTCAGATTTGAC-3’ Tm 55 °C, Exon Location 2–3 |
| Antibody | Anti-KSR1, Rabbit polyclonal | Abcam | Cat# ab68483 | WB (1:1000) |
| Antibody | Anti-EPSTI1, Rabbit polyclonal | Proteintech | Cat# 11627–1-AP, RRID:AB_2877786 | WB (1:1000) |
| Antibody | Anti-N-cadherin | Gift from Dr. Keith Johnson | Cat# 13A9 | WB (1:20) |
| Cell Signaling | Cat# 13116, RRID:AB_2687616 | WB (1:1000) | ||
| Antibody | Anti-E-cadherin | Gift from Dr. Keith Johnson | Cat# 4A2 | WB (1:10) IF (1:1) |
| Cell Signaling | Cat# 3195, RRID:AB_2291471 | WB (1:1000) | ||
| Antibody | Anti-Slug, Rabbit monoclonal | Cell Signaling Technology | Cat# 9585, RRID:AB_2239535 | WB (1:1000) |
| Antibody | Anti-Lamin β2, Rabbit monoclonal | Abclonal | Cat# A6483, RRID:AB_2767083 | WB (1:2000) |
| Antibody | Anti-β actin, Mouse monoclonal | Santa Cruz | Cat# 47778, RRID:AB_2714189 | WB (1:2000) |
| Antibody | Anti-phospho RSK S380, Rabbit polyclonal | Cell Signaling Technology | Cat# 9341, RRID:AB_330753 | WB (1:500) |
| Antibody | Anti-Total RSK, Rabbit monoclonal | Cell Signaling Technology | Cat# 9355, RRID:AB_659900 | WB (1:1000) |
| Antibody | Anti-phospho p70S6K T389, Rabbit polyclonal | Cell Signaling Technology | Cat# 9206, RRID:AB_2285392 | WB (1:500) |
| Antibody | Anti-total p70S6K, Rabbit polyclonal | Cell Signaling Technology | Cat# 9202, RRID:AB_331676 | WB (1:1000) |
| Antibody | Anti-SNAIL, Rabbit monoclonal | Cell Signaling Technology | Cat# 3879, RRID:AB_2255011 | WB (1:1000) |
| Antibody | Anti-Vimentin, Rabbit monoclonal | Cell Signaling Technology | Cat# 5741, RRID:AB_10695459 | WB (1:1000) |
Additional files
-
Supplementary file 1
Genes translationally altered by KSR1.
Translational efficiency of mRNAs (58 decreased; 40 increased) upon KSR1 knockdown in HCT116 and HCT15 cells, related to Figure 1B.
- https://cdn.elifesciences.org/articles/66608/elife-66608-supp1-v3.xlsx
-
Supplementary file 2
KSR1-dependent genes predicted in mesenchymal-up signature identified by GSEA.
GSEA for the subset of translationally controlled genes involved in ‘Hallmark EMT signature’, ‘Jechlinger EMT Up’, and ‘Gotzmann EMT up’ in a KSR1-dependent manner.
- https://cdn.elifesciences.org/articles/66608/elife-66608-supp2-v3.xlsx
-
Transparent reporting form
- https://cdn.elifesciences.org/articles/66608/elife-66608-transrepform1-v3.docx
-
Source data 1
Translational efficiency of mRNAs significantly altered by KSR1 analyzed using Anota2seq.
- https://cdn.elifesciences.org/articles/66608/elife-66608-data1-v3.xlsx
Download links
A two-part list of links to download the article, or parts of the article, in various formats.
Downloads (link to download the article as PDF)
Open citations (links to open the citations from this article in various online reference manager services)
Cite this article (links to download the citations from this article in formats compatible with various reference manager tools)
KSR1- and ERK-dependent translational regulation of the epithelial-to-mesenchymal transition
eLife 10:e66608.
https://doi.org/10.7554/eLife.66608


