Fluidics system for resolving concentration-dependent effects of dissolved gases on tissue metabolism
- University of Washington Medicine Diabetes Institute, University of Washington, United States
- Department of Biochemistry, University of Washington, United States
- VICI Metronics, United States
- Department of Mathematics, University of Washington, United States
Figures
Figure 1
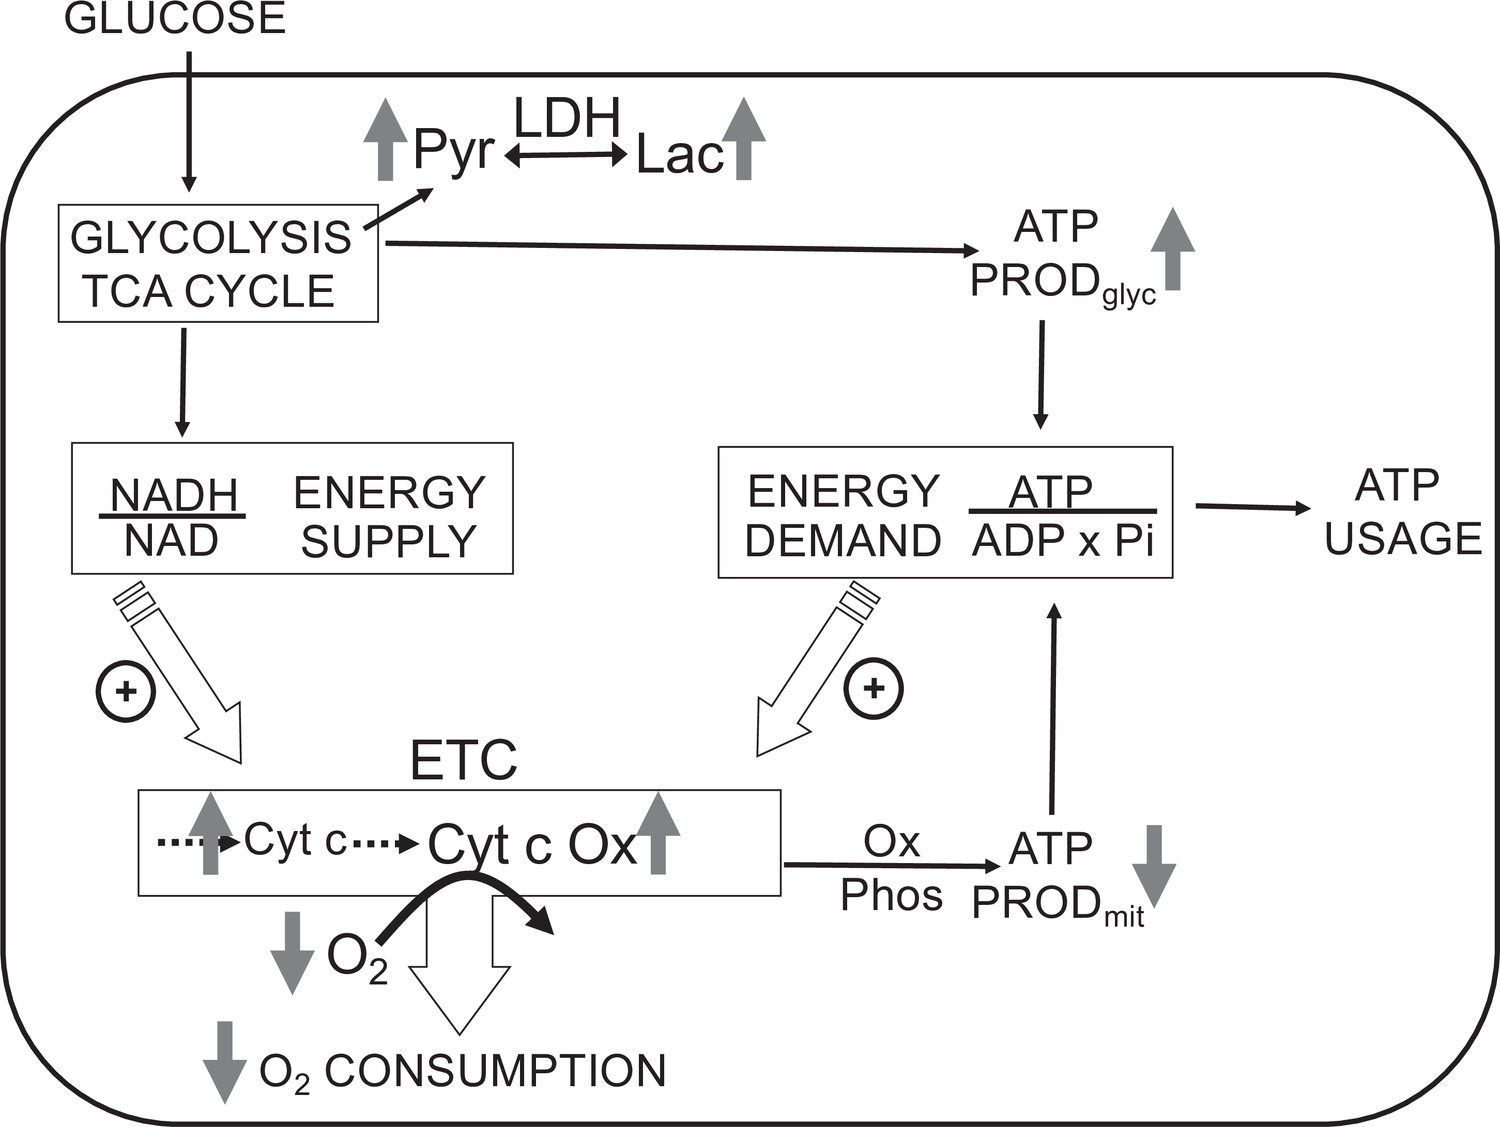
Direct control of O2 consumption rate (OCR): energy supply vs. energy demand vs. O2.
Schematic depicting three mechanisms mediating OCR. (1) The supply of reduced electrons generated by metabolism of fuel. (2) The usage of ATP by energy-utilizing cellular function yielding ADP (a major regulator of OCR). (3) The concentration of dissolved O2. The concomitant measurement of reduced cytochromes and O2 allows for the distinction between the three mechanisms mediating observed changes in OCR. The vertical arrows depict the changes that are acutely affected by changes in O2. Low O2 leads to increased reductive state of cytochrome c and cytochrome c oxidase, decreased OCR. In some tissue types, the decrease in ATP production by oxidative phosphorylation is compensated by increased ATP generation from glycolysis (the Pasteur effect).
Figure 2
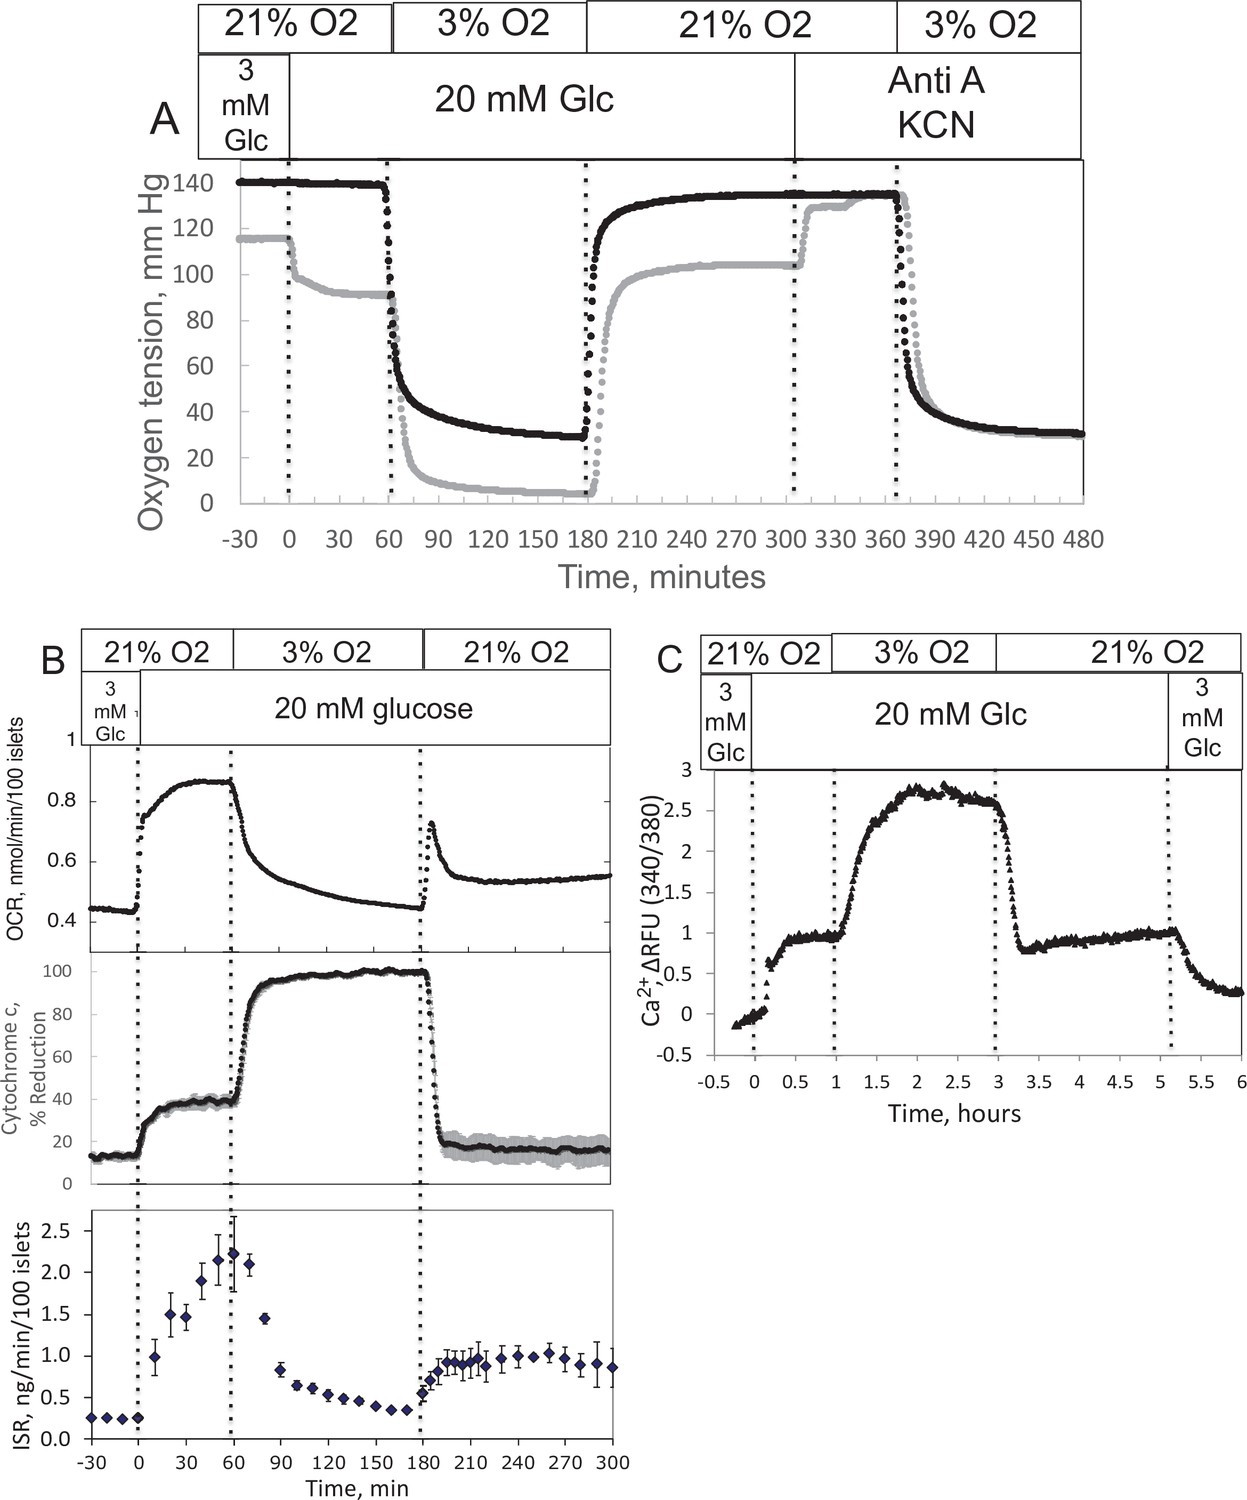
Effect of glucose and low O2 on transient and steady-state electron transport chain (ETC), and insulin secretion rate (ISR) and intracellular Ca2+ in pancreatic islets.
Islets (900/channel) were handpicked with a P200 pipet and after mixing with Cytodex beads (1 μl/10 islets) loaded into the perifusion chamber, and the flow rate was set to 150 μl/min with Krebs–Ringer bicarbonate buffer containing 3 mM glucose for 90 min. At time = 0, glucose concentration was raised to 20 mM for 45 min; subsequently, O2 was decreased to 3% for 2 hr, and then returned to 21%. (A) The protocol generated inflow and outflow O2 profiles such as shown. Following the completion of the protocol, 12 μg/ml antimycin A (aA) was added for 25 min, and then 3 mM potassium cyanide (KCN), and the hypoxia protocol was repeated while islet respiration was suppressed in order to characterize delay and dispersion due to the separation in space of inflow and outflow sensors. (B) Calculated values of O2 consumption rate (OCR) representative data from an n of 3 (average recovery = 0.55 ± 0.07), reduced cytochrome c (n = 2), and ISR (n = 2) were plotted as described in the Methods section. (C) In a separate illustrative experiment, intracellular Ca2+ in islets was imaged and quantified using the same protocol except glucose was also decreased back to 3 mM glucose at the end of the experiment. Raw data can be found in a Source Data file named ’Figure 2—source data 1’.
-
Figure 2—source data 1
Effect of glucose and oxygen on islet function, metabolism and signaling.
- https://cdn.elifesciences.org/articles/66716/elife-66716-fig2-data1-v4.xlsx
Figure 3
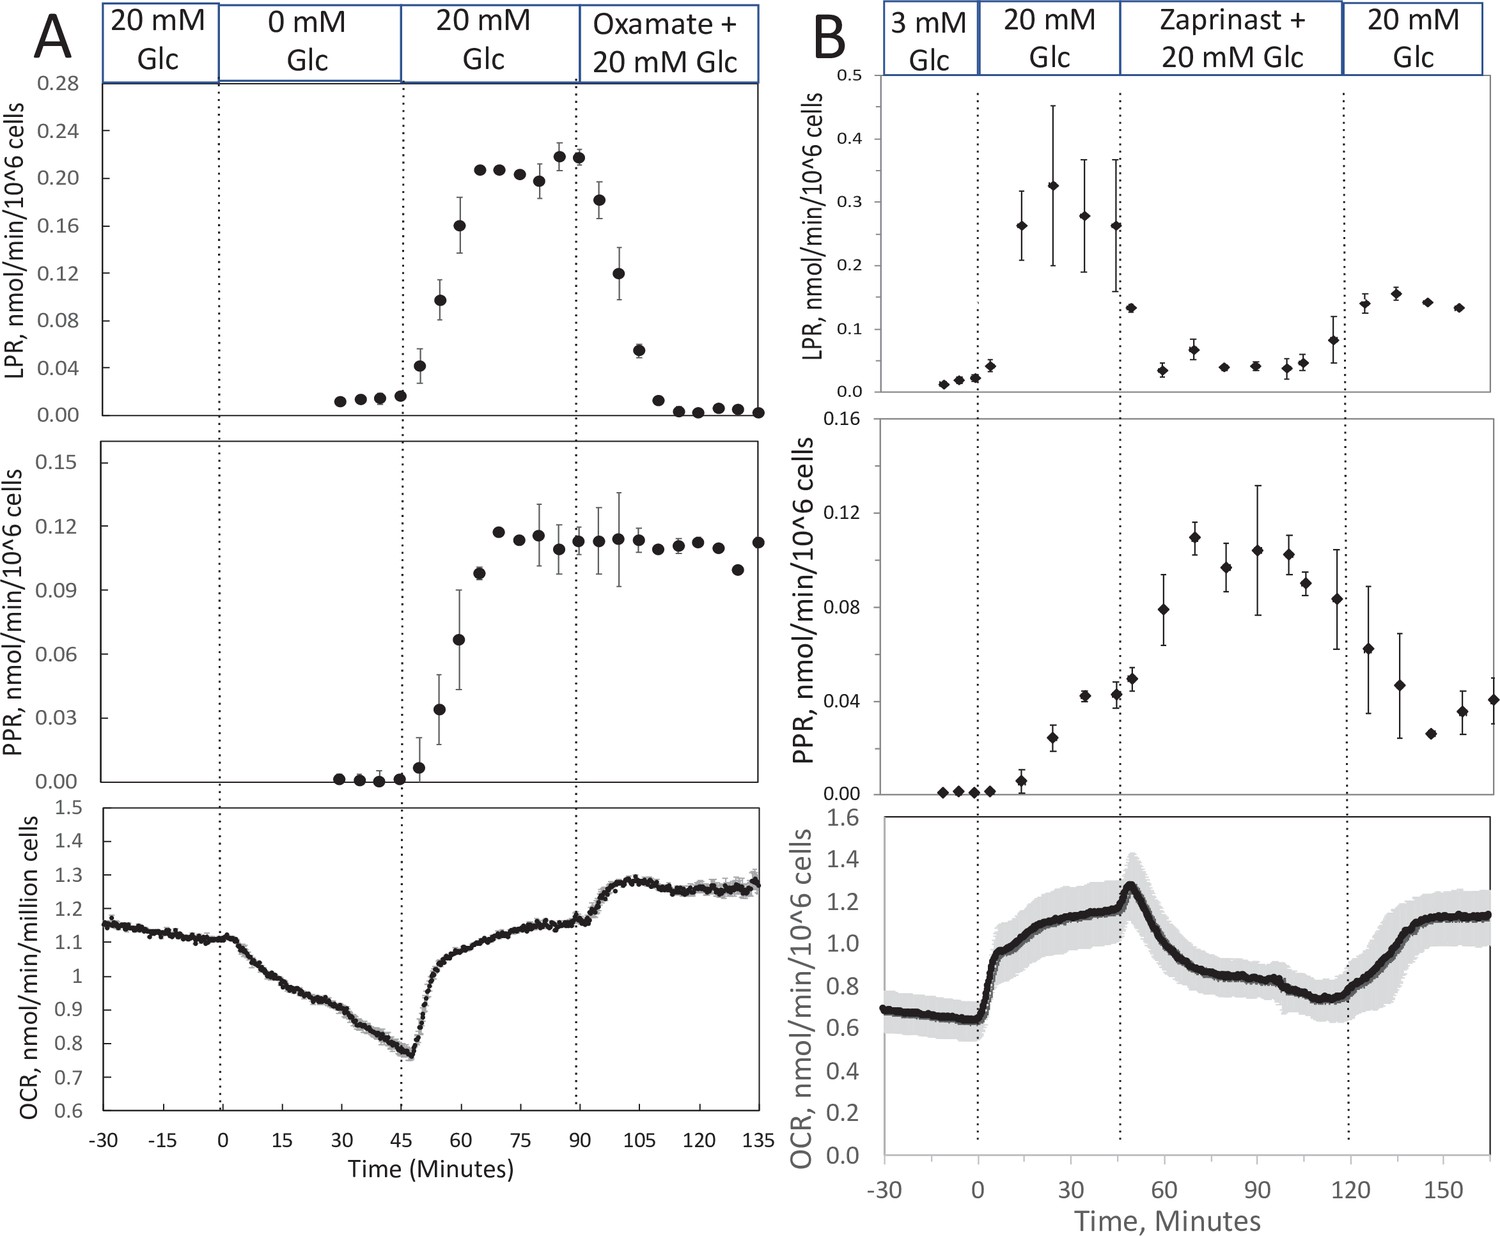
Effect of glucose and inhibitors of lactate dehydrogenase (LDH) and mitochondrial pyruvate carrier (MPC) on O2 consumption rate (OCR), lactate, and pyruvate production rate by INS-1 832/13 cells.
(A) The effects of glucose and then oxamate (50 mM, an inhibitor of LDH) on OCR, lactate production rate, and pyruvate production rate at the times indicated in the figure were measured. (B) The effects of glucose and then zaprinast (200 μM, an inhibitor of MPC) on OCR, lactate production rate, and pyruvate production rate. Data for both plots are the average ± standard error (SE), n = 2. Raw data can be found in a Source Data file named ‘Figure 3—source data 1’.
-
Figure 3—source data 1
Effect of low oxygen on metabolism in isolated retina.
- https://cdn.elifesciences.org/articles/66716/elife-66716-fig3-data1-v4.xlsx
Figure 4
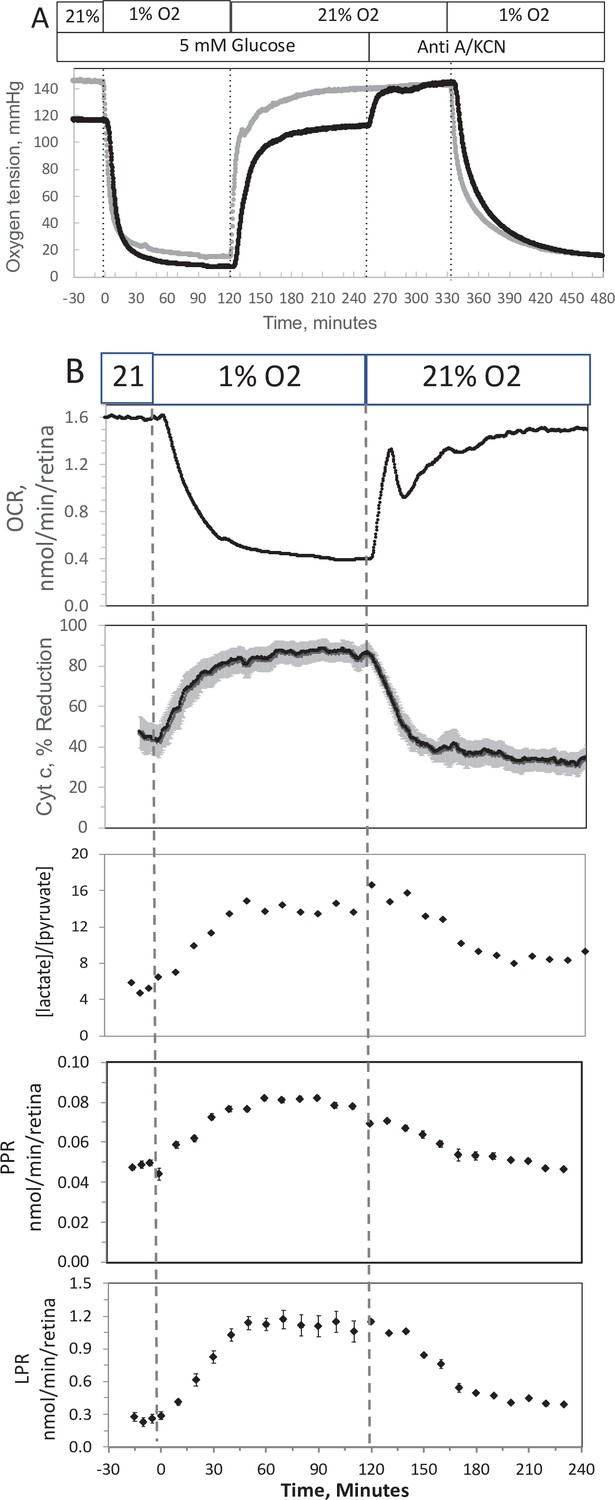
Effect of low O2 on transient electron transport chain (ETC), and lactate/pyruvate in isolated retina.
(A) Four retinas (16 pieces) per chamber were loaded into the flow chamber, where each group of 4 retinal pieces were separated by a 3 μl layer of Cytodex beads. The tissue was sandwiched on the top and bottom by 50 μl of Cytopore beads and both layers were held in place with a porous frit (Interstate Specialty Products, Suton, MA, Cat no. POR 4894, cut to 4.2 mm diameter and 0.25 in long). Ninety minutes after loading the retina into the system (flow rate = 130 μl/min), the O2 tank was switched one containing 1% O2 for 2 hr, and subsequently returned to 21%. (A) The protocol generated inflow and outflow O2 profiles such as shown. Following the completion of the protocol, 12 μg/ml antimycin A (Anti A) was added for 20 min, and then 3 mM potassium cyanide (KCN), and the hypoxia protocol was repeated while retinal respiration was suppressed in order to characterize delay and dispersion due to the separation in space of inflow and outflow sensors. (B) Measurements of OCR representative data from an n of 6 (average recovery = 0.83 ± 0.03), reduced cytochrome c (n = 6), lactate and pyruvate production rates (n = 2), and [lactate]/[pyruvate] are shown. Raw data can be found in a Source Data file named ‘Figure 4—source data 1’.
-
Figure 4—source data 1
Effect of low oxygen on metabolism in isolated retina.
- https://cdn.elifesciences.org/articles/66716/elife-66716-fig4-data1-v4.xlsx
Figure 5
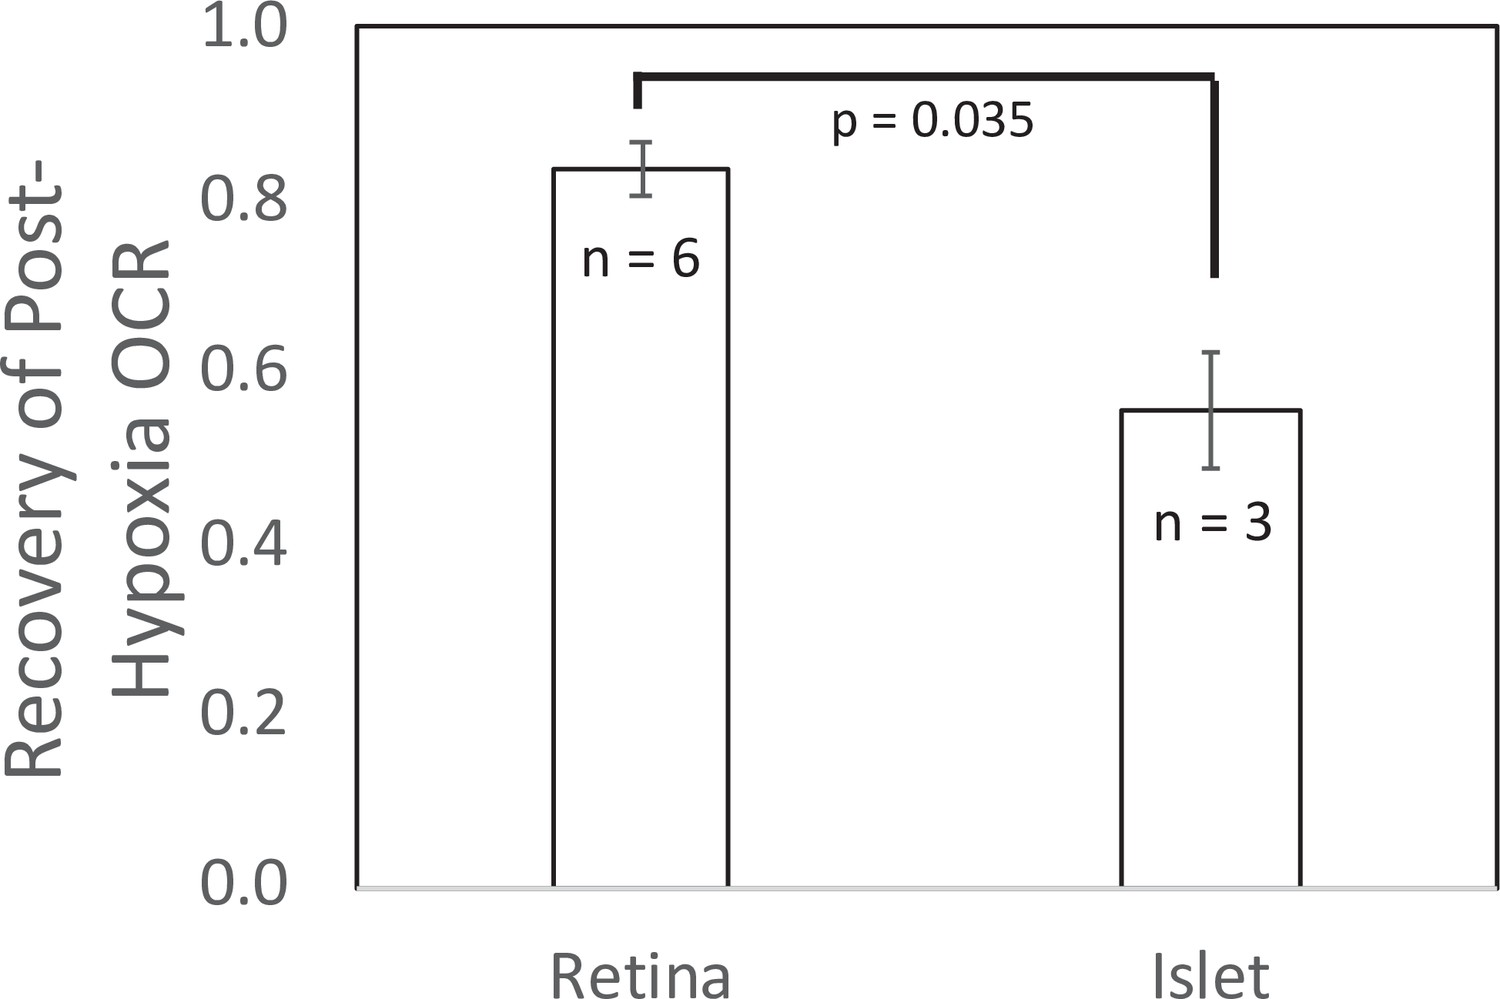
Recovery of O2 consumption rate (OCR) after hypoxia relative to OCR prehypoxia values in retina and islets.
Recovery data from experiments shown in Figures 2 and 4. t-Test result: p = 0.035, for retina, n = 6, and for islets, n = 3. Raw data can be found in a Source Data file named ‘Figure 5—source data 1’.
-
Figure 5—source data 1
Recovery of oxygen consumption after hypoxia.
- https://cdn.elifesciences.org/articles/66716/elife-66716-fig5-data1-v4.xlsx
Figure 6
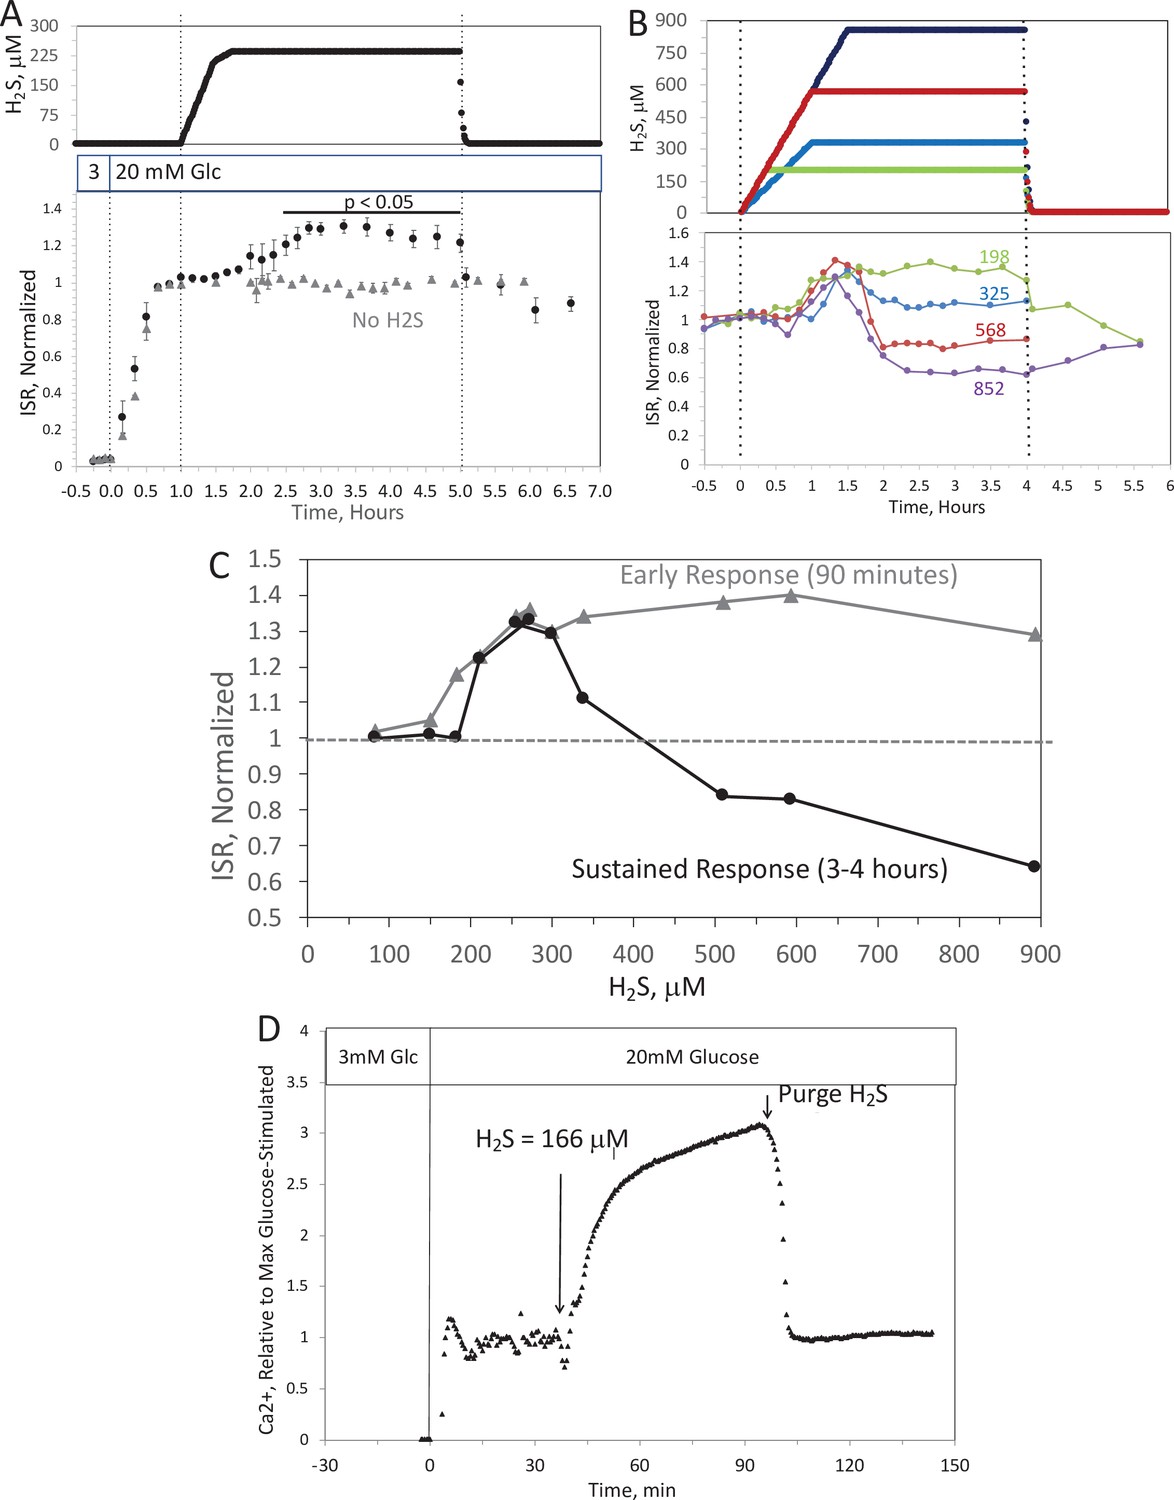
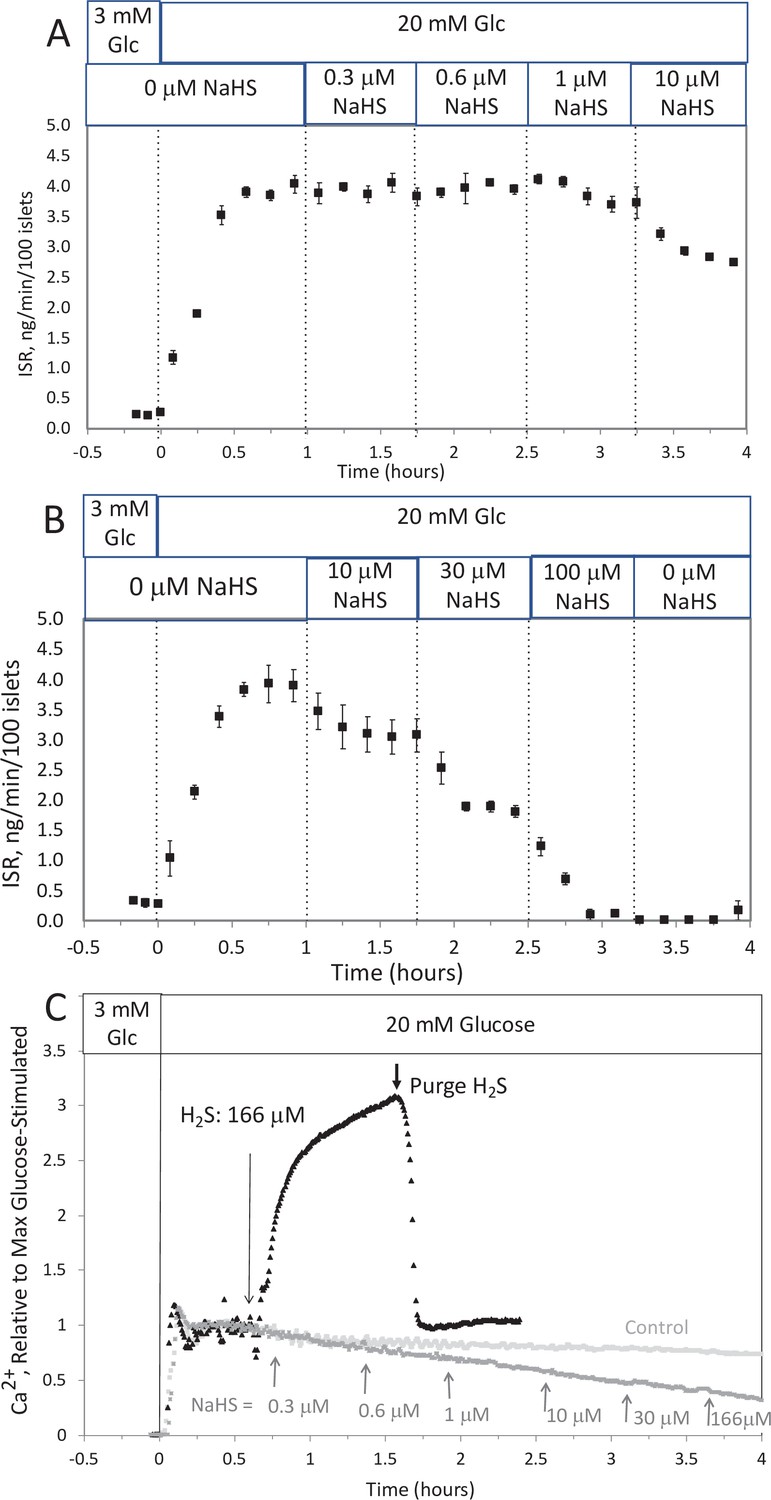
Effect of H2S on insulin secretion rate (ISR) by islets.
(A) Rat islets (50/channel) were perifused (flow rate = 200 μl/min), and ISR was measured in response to glucose and exposure to dissolved H2S in the concentrations shown (data are average ± standard error [SE], n = 3 [H2S], n = 2 [no H2S], p < 0.05 as indicated). (B) ISR was measured at the indicated concentrations of dissolved H2S. Each curve is a single experiment. (C) Data from perifusions as shown in B were plotted as a function of the ISR at the peak between 1 and 1.5 hr, and the average ISR between 3 and 4 hr. (D) Response of cytosolic Ca2+ to changes in glucose concentration and exposure to 166 μM H2S and its washout. Raw data can be found in a Source Data file named ‘Figure 6—source data 1’.
-
Figure 6—source data 1
Effect of hydrogen sulfide on insulin secretion rate.
- https://cdn.elifesciences.org/articles/66716/elife-66716-fig6-data1-v4.xlsx
Figure 7
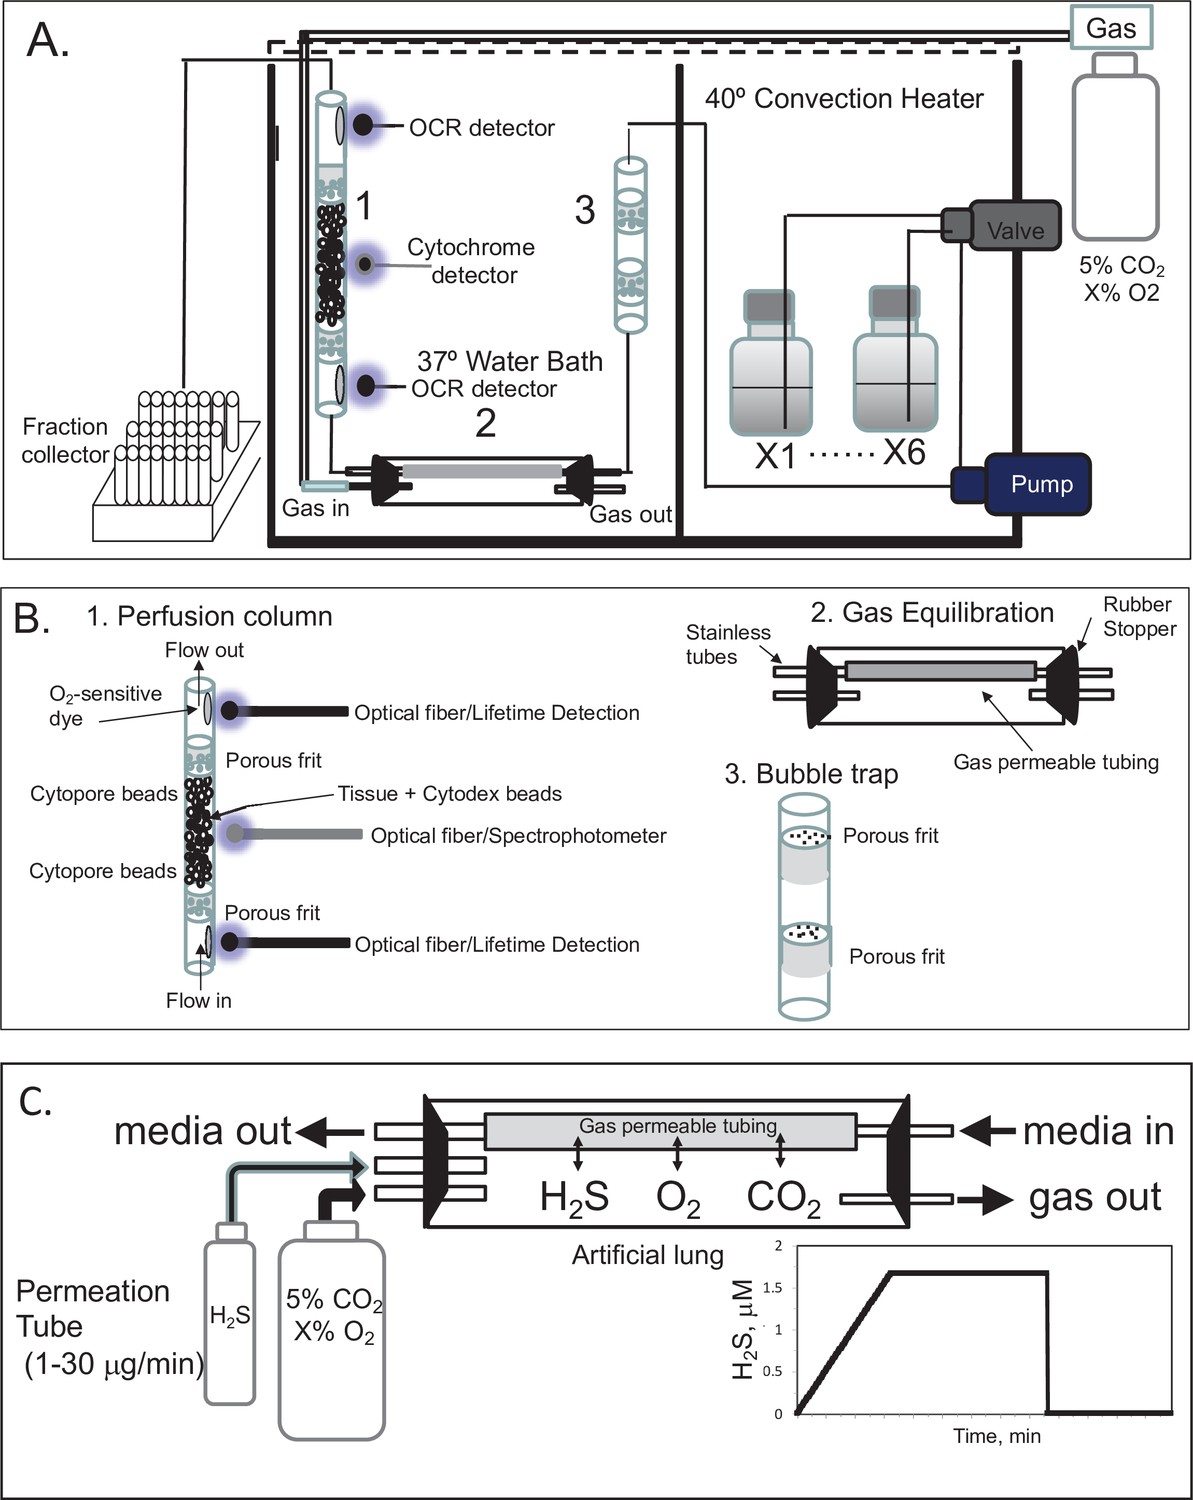
Flow culture system/assessment system for studying effects of dissolved gases on tissue or cells.
One channel/perifusion chamber is shown, but the actual system can accommodate up to 8. (A) The perifusion system consisted of an eight-channel peristaltic pump (MiniPuls 2, Gilson, Middleton, WI) connected to a six-port valve (Part # V-451, IDEX Health and Science, Oak Harbor, WA) to produce up to six separate solutions; a media/dissolved gas equilibrium system in which media flowed through thin-walled silastic tubing (0.062 in ID × 0.095 in OD; Dow Corning Corp, Midland, MI) for a residence time of 5 min (typically 0.2–0.5 m depending on the flow rate) loosely coiled in a glass jar that contained various O2, 5% CO2/balance N2; bubble trap comprised of a Simax Borosilicate glass tube (Mountain Glass, Asheville, NC, 2″ long and 4.2 mm ID) filled with glass wool; a Simax Borosilicate glass perifusion chamber (3″ long and 4.2 mm ID) immersed in a 37°C water bath; Lifetime detection spectrometers (Tau Theta, Boulder CO), a tungsten-halogen light source/USB2000 spectrophotometer (Ocean Optics OH); and a Foxy 200 fraction collector (Isco, Inc, Lincoln, NE). (B) A blow up of individual parts shown in A. (1) The glass perifusion chamber containing culture beads, porous frits (Interstate Specialty Products, Suton, MA, Cat no. POR 4894, cut to 4.2 mm diameter and 0.25 in long) to support the tissue and disperse the flow, and coated with O2-sensitive dye on the interior above and below where the tissue resides; (2) gas equilibration chamber, where media flows through gas-permeable silastic tubing and equilibrates with the gases filling the headspace; (3) bubble traps. (C) Incorporation of a permeation tube (VICI Metronics, Poulsbo, WA) that releases H2S at specified rates into the media/dissolved gas equilibration system during which time the ports for the inflow and outflow of carrier gas (O2, CO2, and N2) are closed. The resulting accumulation of H2S in the artificial lung yields linearly increasing concentrations of dissolved H2S in the form of a ramp function as shown.
Figure 8
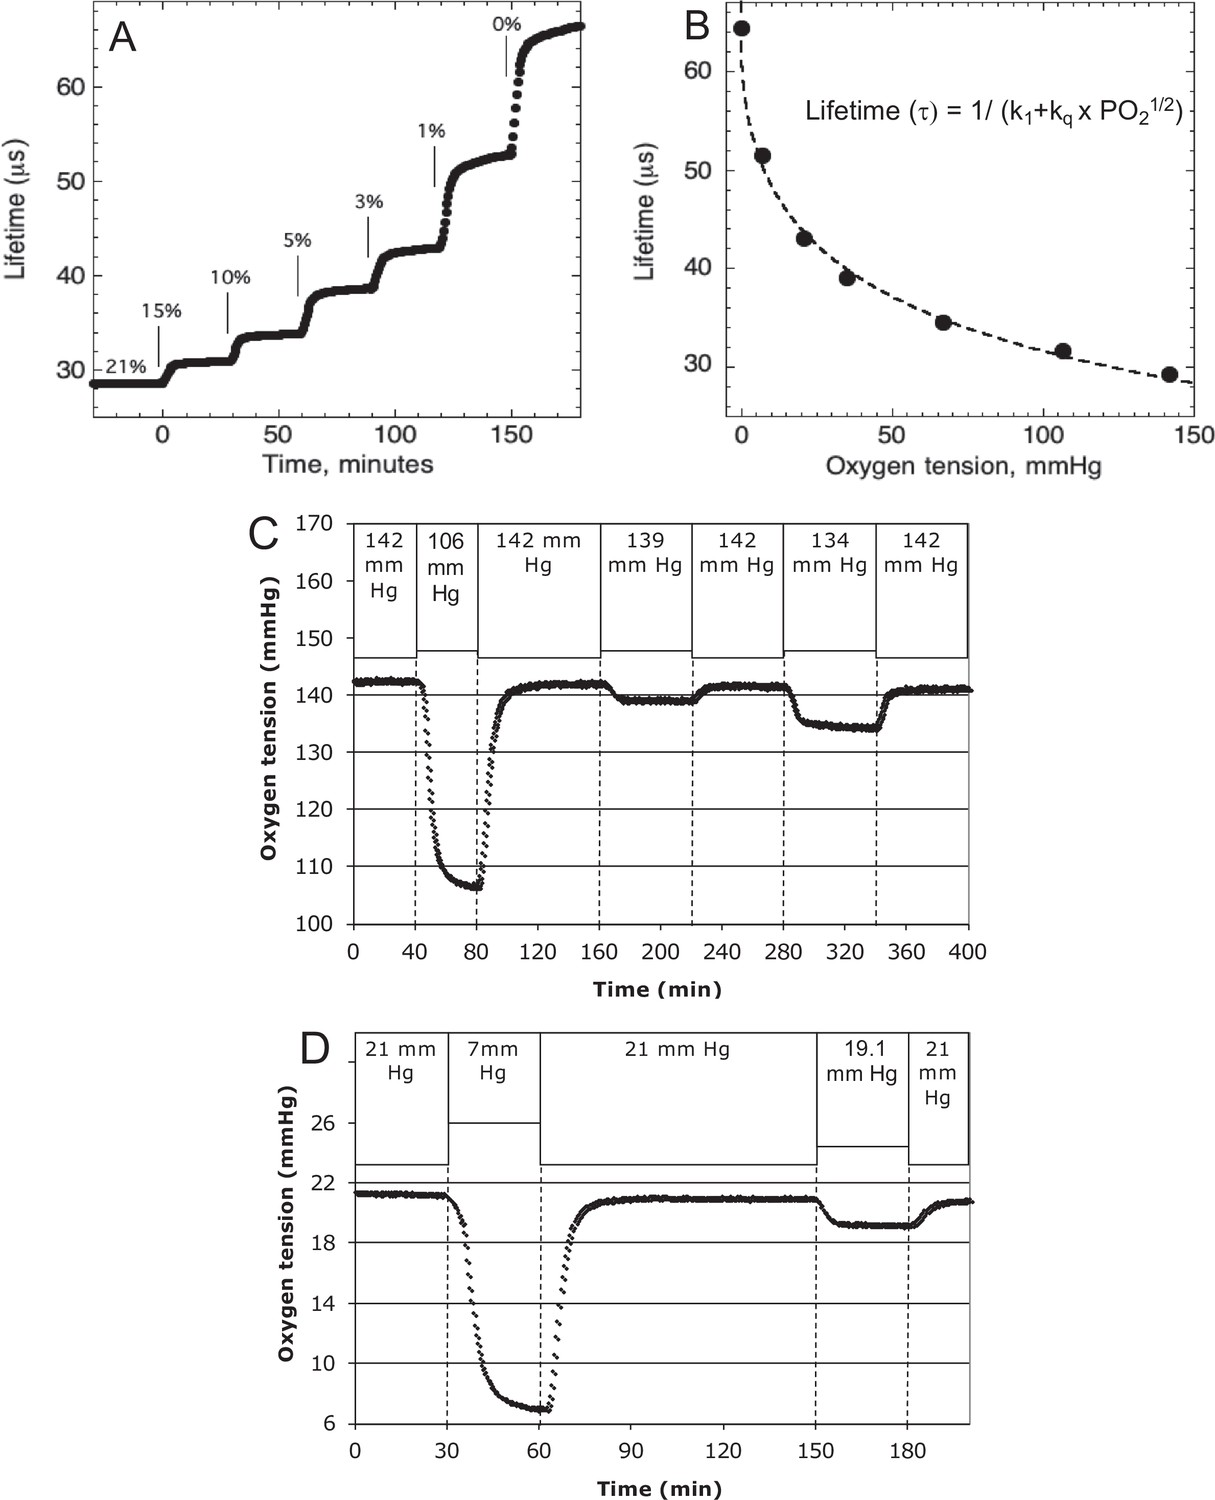
Control and measurement of dissolved O2.
(A) At 20- to 30-min intervals, the lung was sequentially filled with 21%, 15%, 10%, 5%, 3%, 1%, and 0 % O2. (B) The steady-state lifetime measurements were nonlinear and conformed to a Stern–Volmer equation. Where the pO2 is partial pressure of oxygen molecules (oxygen tension), τ0 is lifetime of the dye without quencher such as oxygen molecule, k1 is 1/τ0 and kq is a bimolecular quenching constant of the dye by oxygen molecules. The k1 and kq were 15,519 s−1 and 1612.2 mm Hg−1 s−1, respectively. (C) Test of precision at normal O2. O2 (142 mm Hg) in the lung was changed first to 106.5 mm Hg and back to 142 (levels of change that were typical what was observed in our studies). By mixing 21% and 15% tanks at known flow rates, O2 was then decreased by 3 mm Hg and then subsequently by 8 mm Hg. (D) Test of precision and S/N of low O2. O2 (21 mm Hg) in the lung was changed first to 7 mm Hg (1% O2) and back to 21. By mixing 3% and 1% tanks at known flow rates, O2 was decreased by 1.9 mm Hg. S/N was for the 14 and 1.9 mm Hg changes was >80 and >10, respectively. Raw data can be found in a Source Data file named ‘Figure 8—source data 1’.
-
Figure 8—source data 1
Control and measurement of dissolved O2.
- https://cdn.elifesciences.org/articles/66716/elife-66716-fig8-data1-v4.xlsx
Figure 9
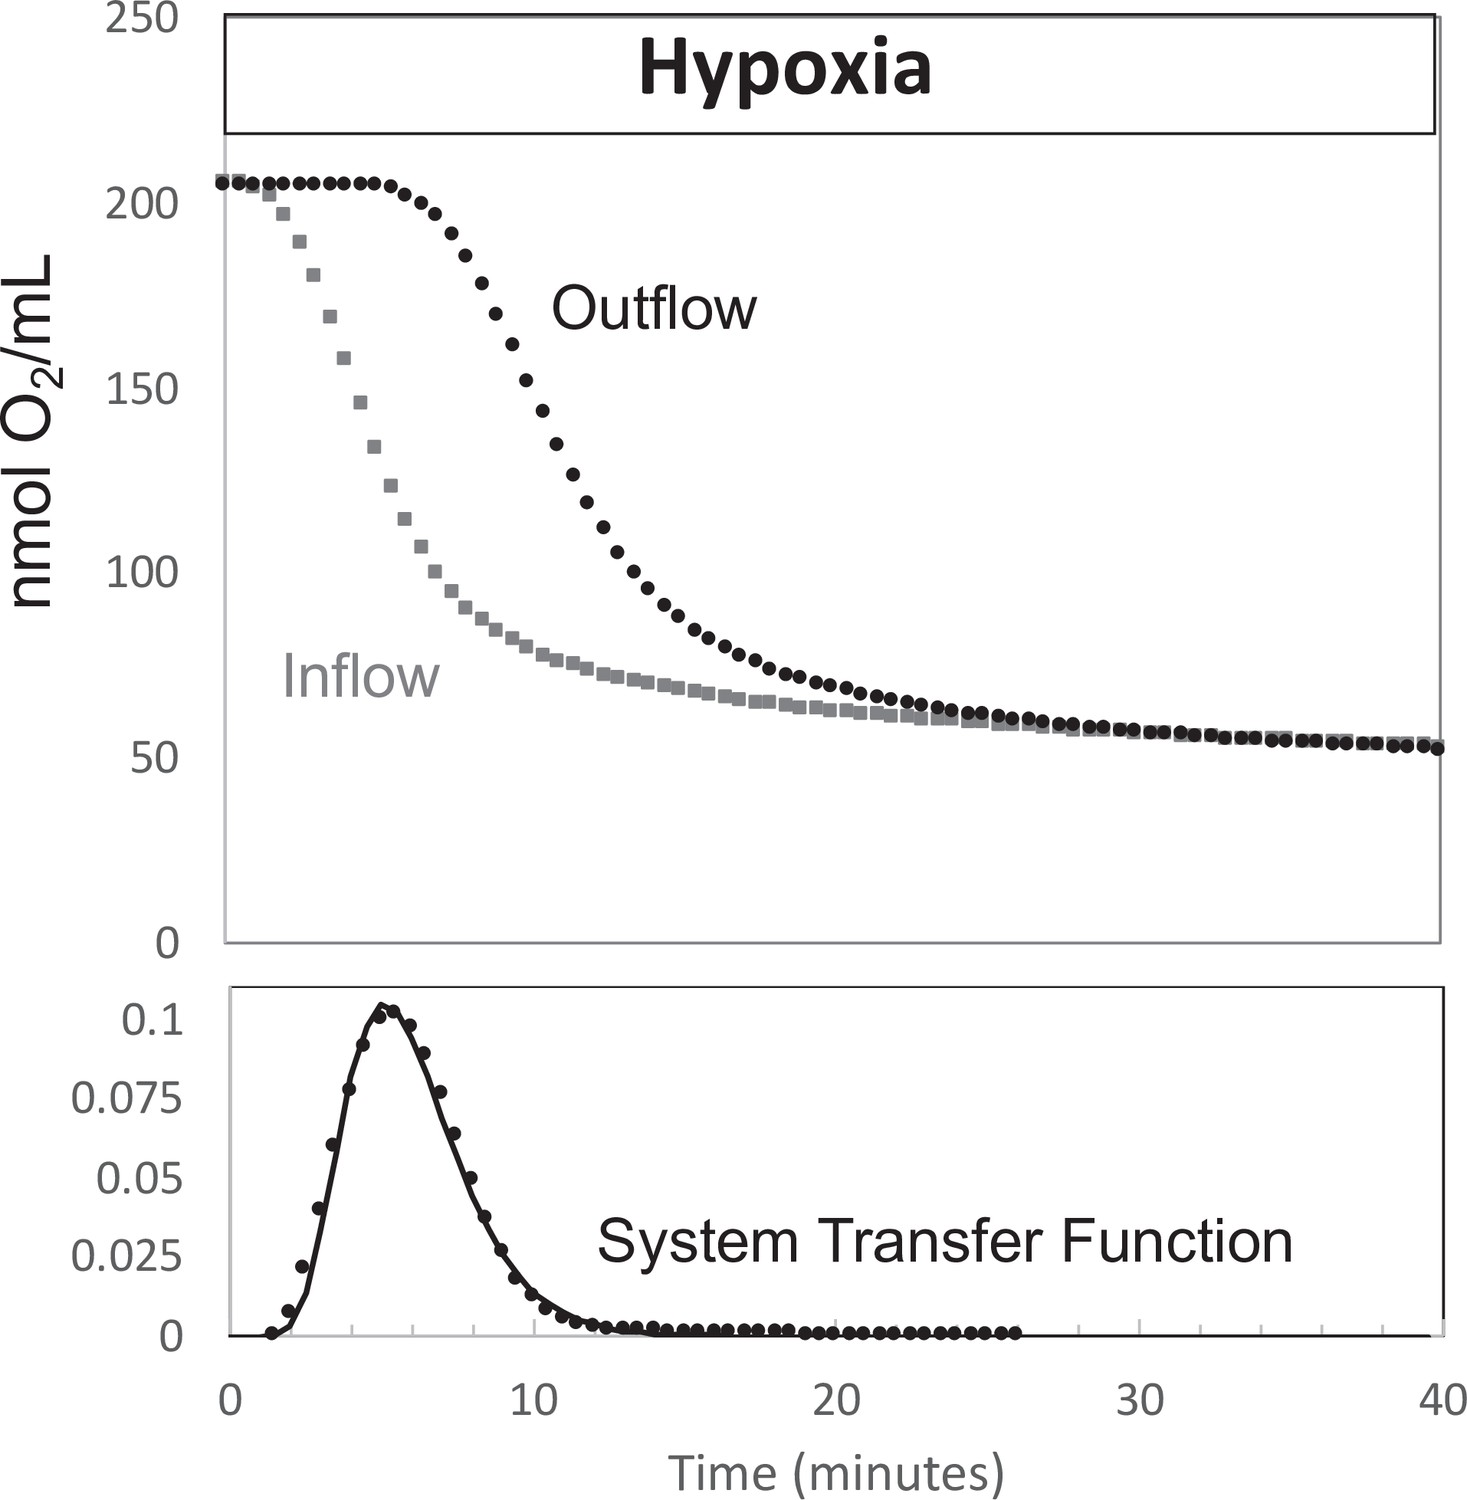
Determination of transfer function from inflow and outflow for convolution analysis.
Measurement of inflow and outflow O2 tensions in response to a change from 21% to 3% with no live tissue in the system. Deconvolution was carried out to generate the transfer function of the system shown on the bottom graph. Raw data can be found in a Source Data file named ‘Figure 9—source data 1’.
-
Figure 9—source data 1
Determination of transfer function from inflow and outflow data.
- https://cdn.elifesciences.org/articles/66716/elife-66716-fig9-data1-v4.xlsx
Appendix 1—figure 1
Effect of NaHS on insulin secretion rate (ISR) and cytosolic Ca2+ (A, B).
Rat islets (50/channel) were perifused (flow rate = 200 μl/min), and ISR was measured in response to glucose and exposure to incrementally increasing concentrations of aqueous NaHS as indicated. Data are average ± standard error (SE), n = 2. (C) Cytosolic Ca2+ in single isolated islets were measured in response to glucose and NaHS. Representative response from four different experiments measuring responses (which were not averaged due to the use of slightly different timings of the protocols). Raw data can be found in a Source Data file named ‘Appendix 1—figure 1—source data 1’.
-
Appendix 1—figure 1—source data 1
Effect of NaHS on insulin secretion rate and cytosolic calcium.
- https://cdn.elifesciences.org/articles/66716/elife-66716-app1-fig1-data1-v4.xlsx
Appendix 1—figure 2
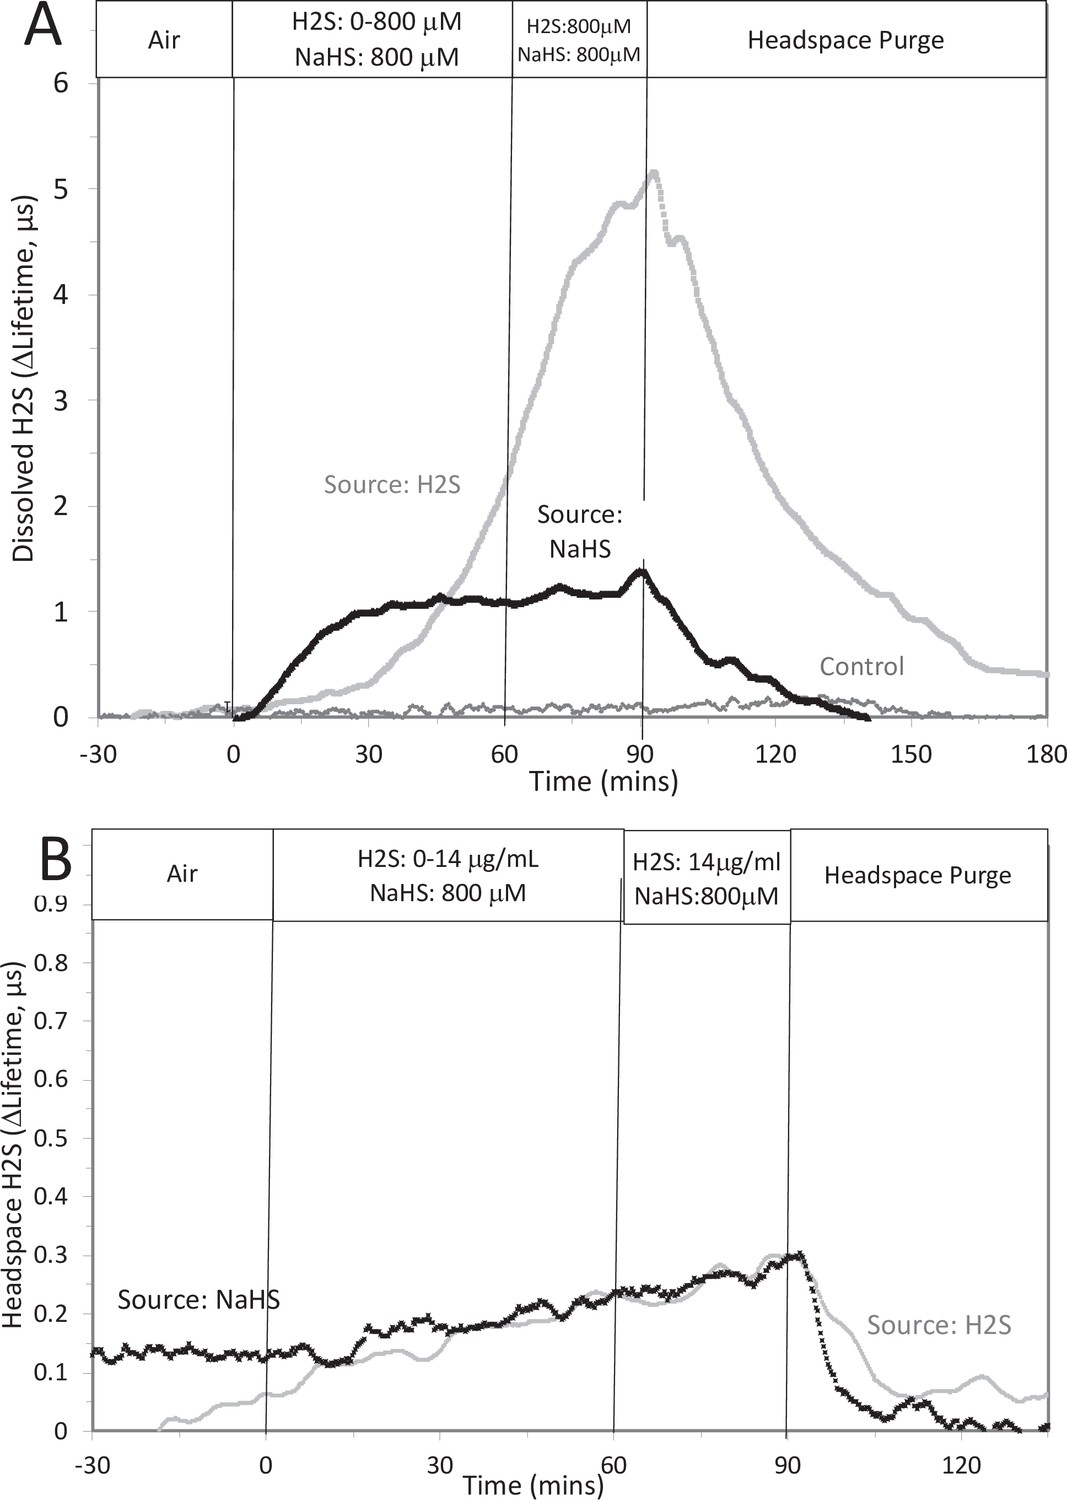
Measurement or depletion of dissolved H2S generated from NaHS.
H2S was measured with sensors placed in KRB (10 ml) and the headspace of a 125 ml sealed bottle in response to either injection of 8 μM NaHS into the solution or attachment of an H2S-emitting permeation tube to the inlet port of the top of the bottle (rate of H2S permeation = 30 μg/min). Graphs represent lifetime emission reflecting H2S in the solution (A) or the headspace (B) from either H2S, NaHS, or no H2S (control). Legends indicate the source of the H2S. The concentration in solution of H2S from 800 μM NaHS, if equilibrium between H2S and HS was reached in the solution at pH 7.2 is 300 μM (calculated from [H2S] /([H2S] +[HS]) = 0.37). The concentration in solution in equilibrium with the headspace after permeation with H2S gas = 788 µM (calculated from Equation 1 in the main text ([H2Saq] = 14,000 ng/ml × 55.5/1000)). The maximal amount of H2S that could be in the headspace from NaHS in solution was calculated to be 2.5 μg/ml assuming all of the 800 μM NaHS diffused into the headspace. Raw data can be found in a Source Data file named ‘ Appendix 1—figure 2—source data 1’.
-
Appendix 1—figure 2—source data 1
Measurement of depletion of dissolved hydrogen sulfide generated from NaHS.
- https://cdn.elifesciences.org/articles/66716/elife-66716-app1-fig2-data1-v4.xlsx
Appendix 1—figure 3
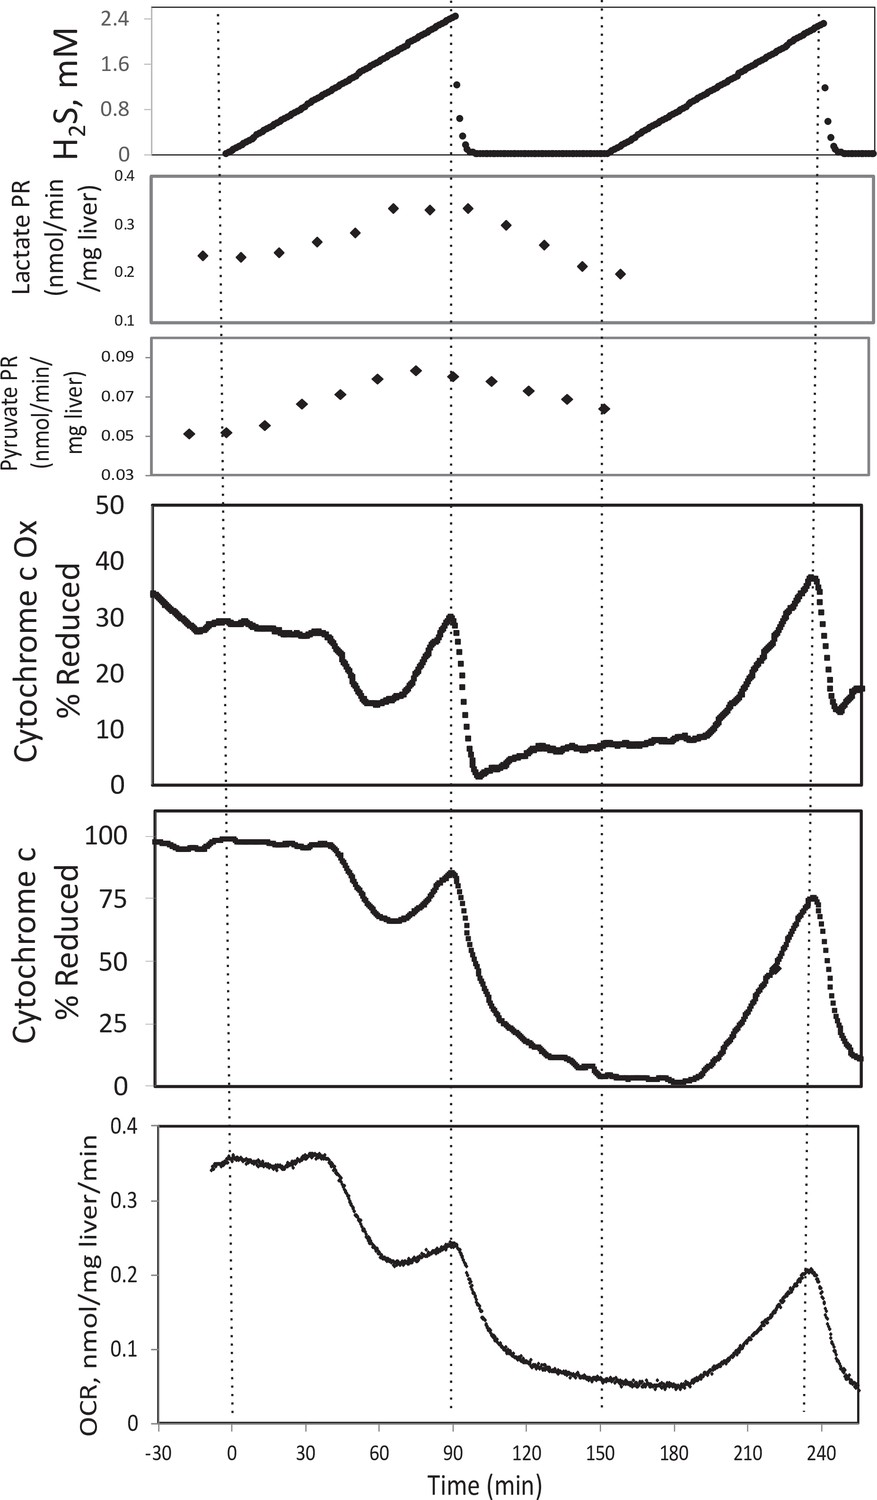
Effect of H2S on electron transport chain (ETC) and lactate/pyruvate in rat liver.
Liver slices were exposed to increasing levels of H2S until the gas was purged as indicated and an additional ramp of H2S was implemented. O2 consumption rate (OCR), reduced cytochrome c, and cytochrome c oxidase were measured in real time. Fractions were collected for subsequent measurement of lactate and pyruvate. Raw data can be found in a Source Data file named ‘Appendix 1—figure 3—source data 1’.
-
Appendix 1—figure 3—source data 1
Effect of hydrogen sulfide on metabolism in liver.
- https://cdn.elifesciences.org/articles/66716/elife-66716-app1-fig3-data1-v4.xlsx
Appendix 1—figure 4
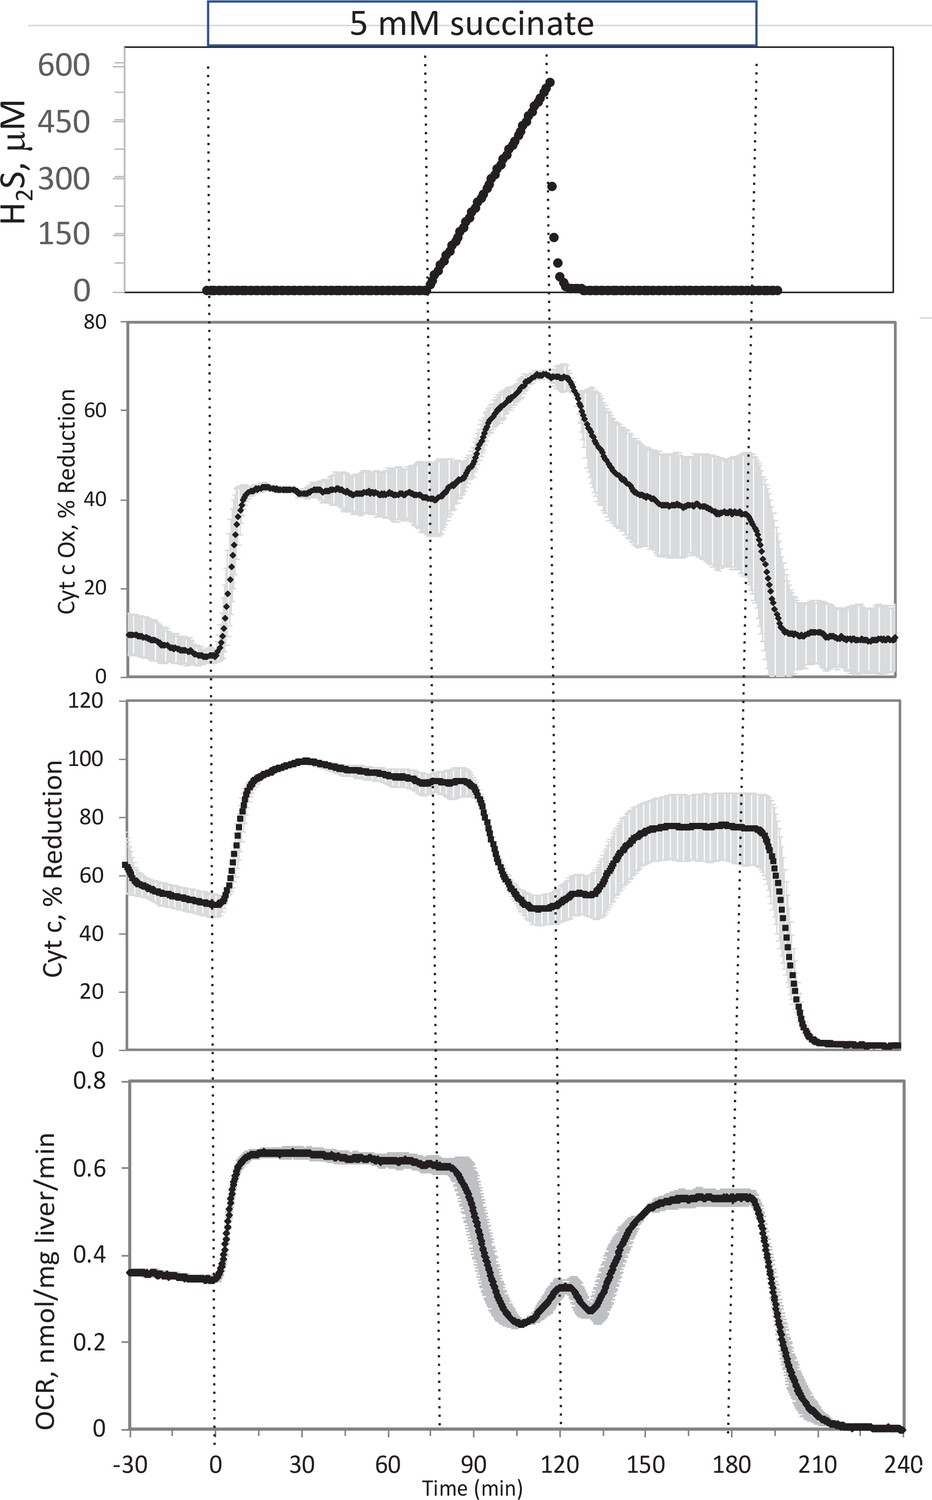
Effect of H2S on electron transport chain (ETC) in rat liver.
In the presence of 5 mM succinate (n = 2), liver slices were exposed to increasing levels of H2S until the gas was purged as indicated. O2 consumption rate (OCR), reduced cytochrome c, and cytochrome c oxidase were measured in real time. Raw data can be found in a Source Data file named ‘Appendix 1—figure 4—source data 1’.
-
Appendix 1—figure 4—source data 1
Effect of hydrogen sulfide on electron transport in liver.
- https://cdn.elifesciences.org/articles/66716/elife-66716-app1-fig4-data1-v4.xlsx
Additional files
-
Transparent reporting form
- https://cdn.elifesciences.org/articles/66716/elife-66716-transrepform1-v4.docx
-
Appendix 1—figure 1—source data 1
Effect of NaHS on insulin secretion rate and cytosolic calcium.
- https://cdn.elifesciences.org/articles/66716/elife-66716-app1-fig1-data1-v4.xlsx
-
Appendix 1—figure 2—source data 1
Measurement of depletion of dissolved hydrogen sulfide generated from NaHS.
- https://cdn.elifesciences.org/articles/66716/elife-66716-app1-fig2-data1-v4.xlsx
-
Appendix 1—figure 3—source data 1
Effect of hydrogen sulfide on metabolism in liver.
- https://cdn.elifesciences.org/articles/66716/elife-66716-app1-fig3-data1-v4.xlsx
-
Appendix 1—figure 4—source data 1
Effect of hydrogen sulfide on electron transport in liver.
- https://cdn.elifesciences.org/articles/66716/elife-66716-app1-fig4-data1-v4.xlsx
Download links
A two-part list of links to download the article, or parts of the article, in various formats.
Downloads (link to download the article as PDF)
Open citations (links to open the citations from this article in various online reference manager services)
Cite this article (links to download the citations from this article in formats compatible with various reference manager tools)
Fluidics system for resolving concentration-dependent effects of dissolved gases on tissue metabolism
eLife 10:e66716.
https://doi.org/10.7554/eLife.66716


