Glial insulin regulates cooperative or antagonistic Golden goal/Flamingo interactions during photoreceptor axon guidance
- Graduate School of Life Science and Technology, Tokyo Institute of Technology, Japan
- Center for Transdisciplinary Research, Niigata University, Japan
- Brain Research Institute, Niigata University, Japan
- Mathematical Neuroscience Unit, Institute for Frontier Science Initiative, Kanazawa University, Japan
- Laboratory of Developmental Neurobiology, Graduate School of Medical Sciences, Kanazawa University, Japan
Figures
Figure 1 with 1 supplement
R8-specific labeling of Gogo and Fmi.
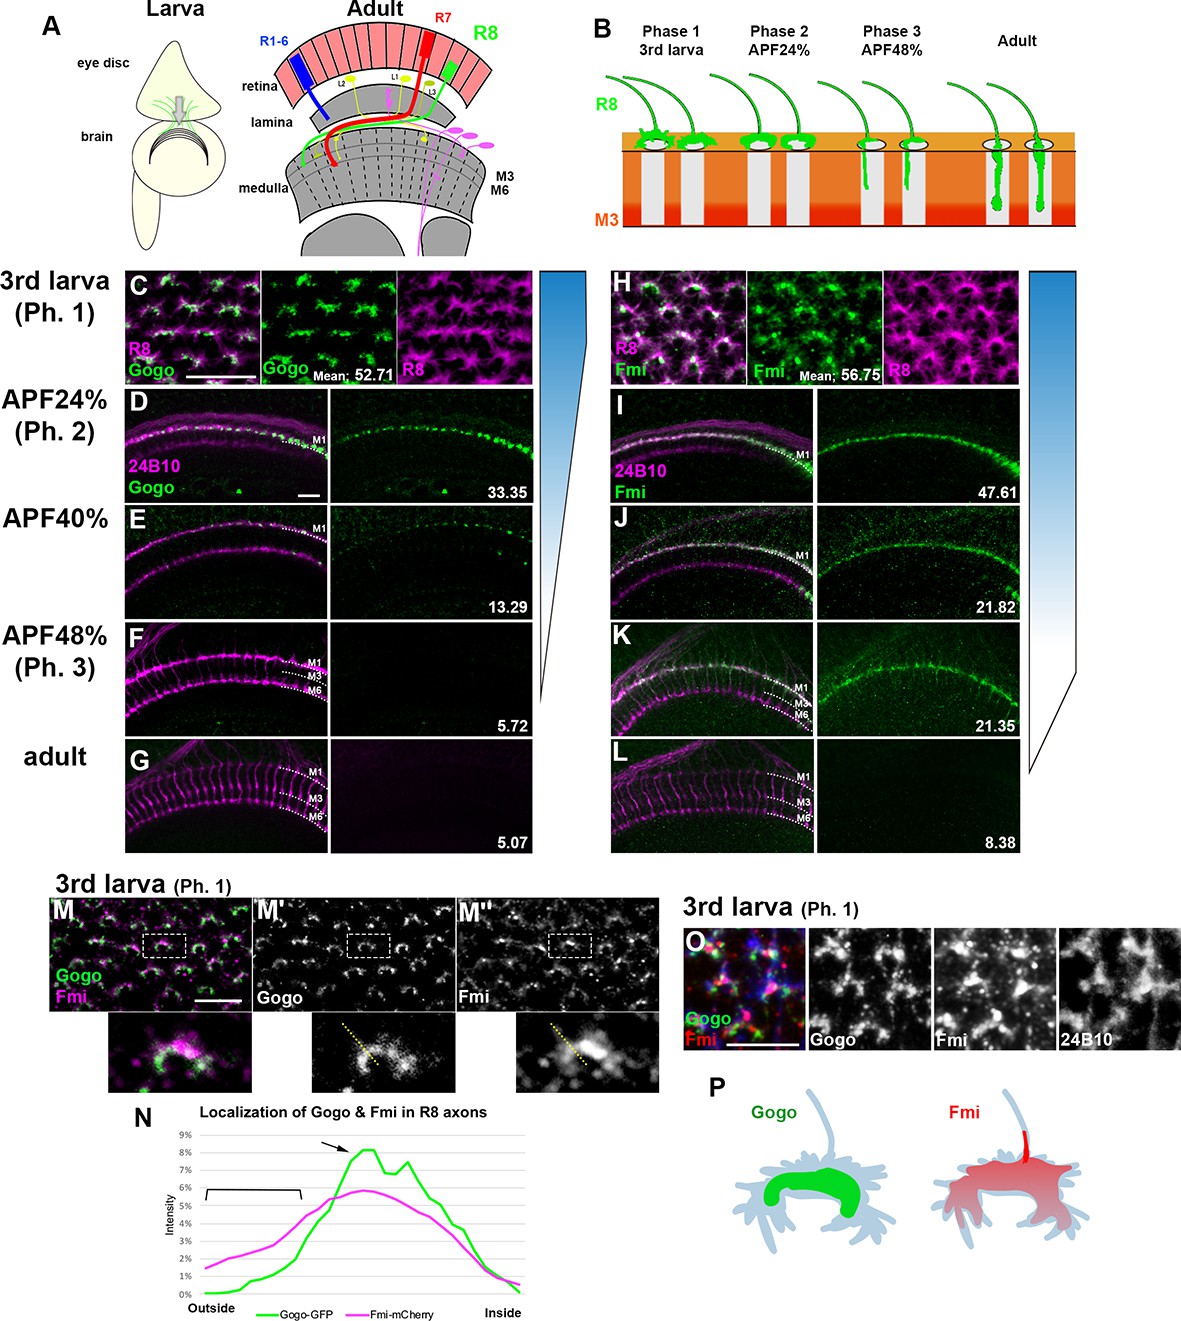
(A) Schematics of the Drosophila visual system in the third instar larva and the adult. (B) Schematics of the phase-specific R8 targeting during development. (C–G) Gogo localization at the terminals of R8 axons (green) during developmental phases was visualized by combining Gogo-FsF-GFP and R8-specific FLPase (sensFLP) co-labeled with R8-specific myr-RFP (C) or mAb24B10 for all R axons (D–G) (magenta). The numbers indicate the average intensity of GFP (max. 85, n = 3, 24 axons each). (H–L) Fmi protein localization at the terminals of R8 axons (green) during developmental phases was visualized by Fmi-FsF-mCherry and R8-specific FLPase (sensFLP) co-labeled with R8-specific mCD8GFP (H) or mAb24B10 for all R axons (I–L) (magenta). The numbers indicate the average intensity of mCherry (max. 85, n = 3, 24 axons each). (M–P) Localization of Gogo (green) and Fmi (magenta) protein at the tip of the R8 axon in third instar larva (phase 1) (M). (N) The fluorescent intensity of Gogo-GFP (green) and Fmi-mCherry (magenta) was measured from outside to inside of the columns across the horseshoes as shown in M (yellow dotted lines). The average of eight axons (n = 3 animals) was calculated. Gogo was strongly enriched at the rim of the horseshoe-shaped R8 axon terminal (M’, arrow in N). Fmi was distributed broadly including filopodia (M’’, bracket in N). 3D images of Gogo (green) and Fmi (red) localization at the tip of R8 axon (blue) in third instar larva (phase 1) (O). Schematic of Gogo (green) and Fmi (red) expression in R8 cells (blue) (P). Scale bars 10 μm.
-
Figure 1—source data 1
Source data for the quantification in Figure 1C-H.
- https://cdn.elifesciences.org/articles/66718/elife-66718-fig1-data1-v2.xls
-
Figure 1—source data 2
Source data for the quantification in Figure 1N.
- https://cdn.elifesciences.org/articles/66718/elife-66718-fig1-data2-v2.xlsx
Figure 1—figure supplement 1
gogo expression gradually declines during midpupal stages.
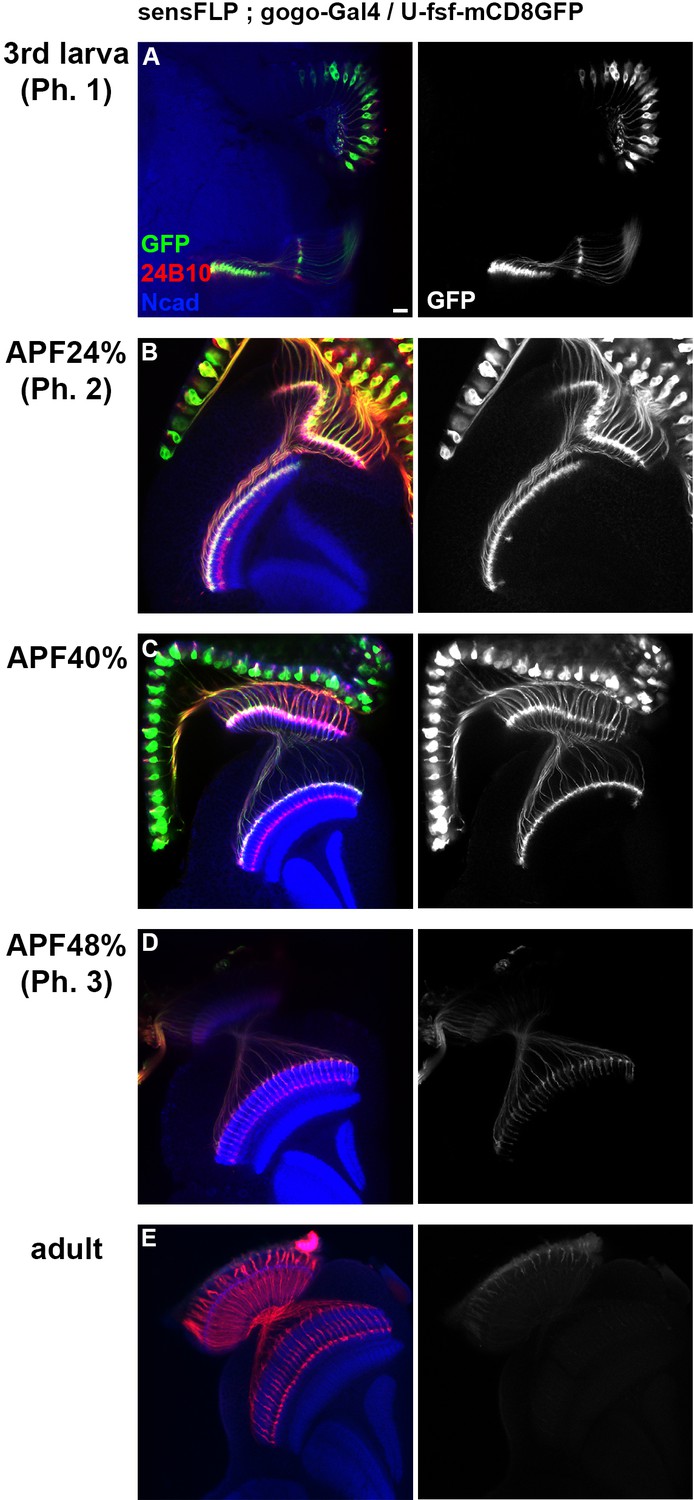
(A–E) gogo expression level in R8 cells were monitored by gogo-Gal4 sensFLP UAS-FsF-mCD8GFP. gogo-Gal4 was created by inserting Gal4 into the gogo intron locus using MiMIC system. Photoreceptor axons were labeled with 24B10 (red) and medulla layers with anti-N-cadherin (blue). The GFP protein was strongly observed at third larval stage (phase 1, A) and APF 24% (phase 2, B), then gradually declined during midpupal stages (APF 40%, C) and 48% (phase 3, D)). Scale bar 10 μm.
Figure 2 with 3 supplements
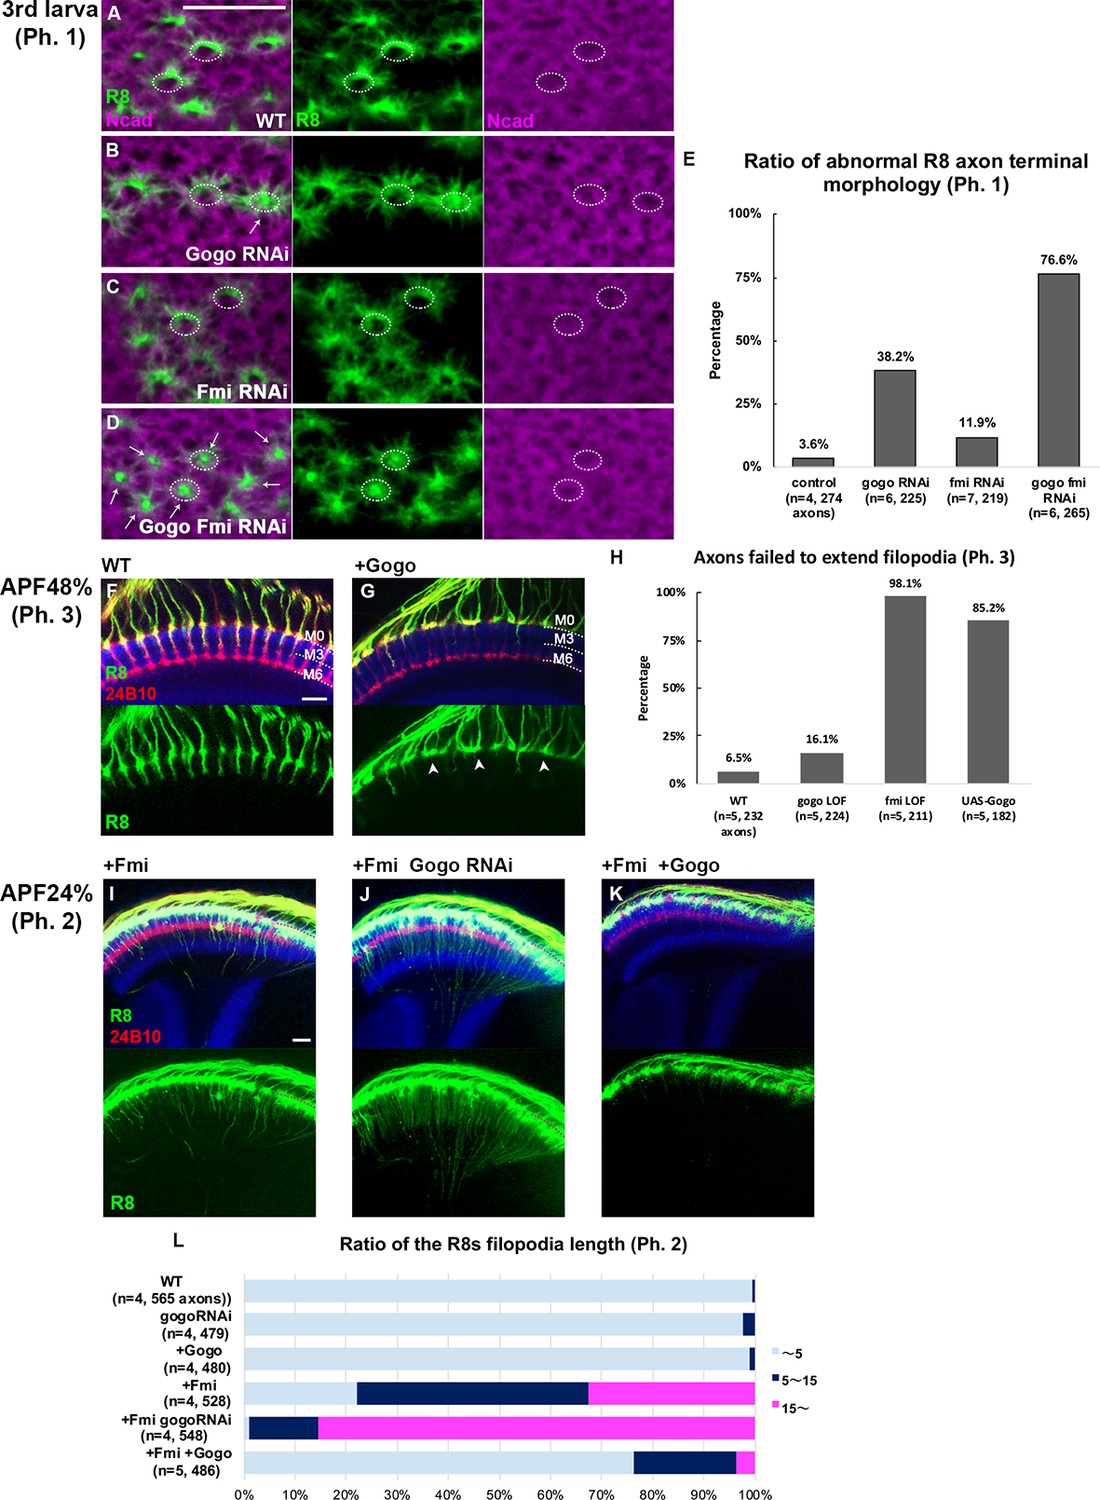
Gogo and Fmi regulates the growth cone dynamic.
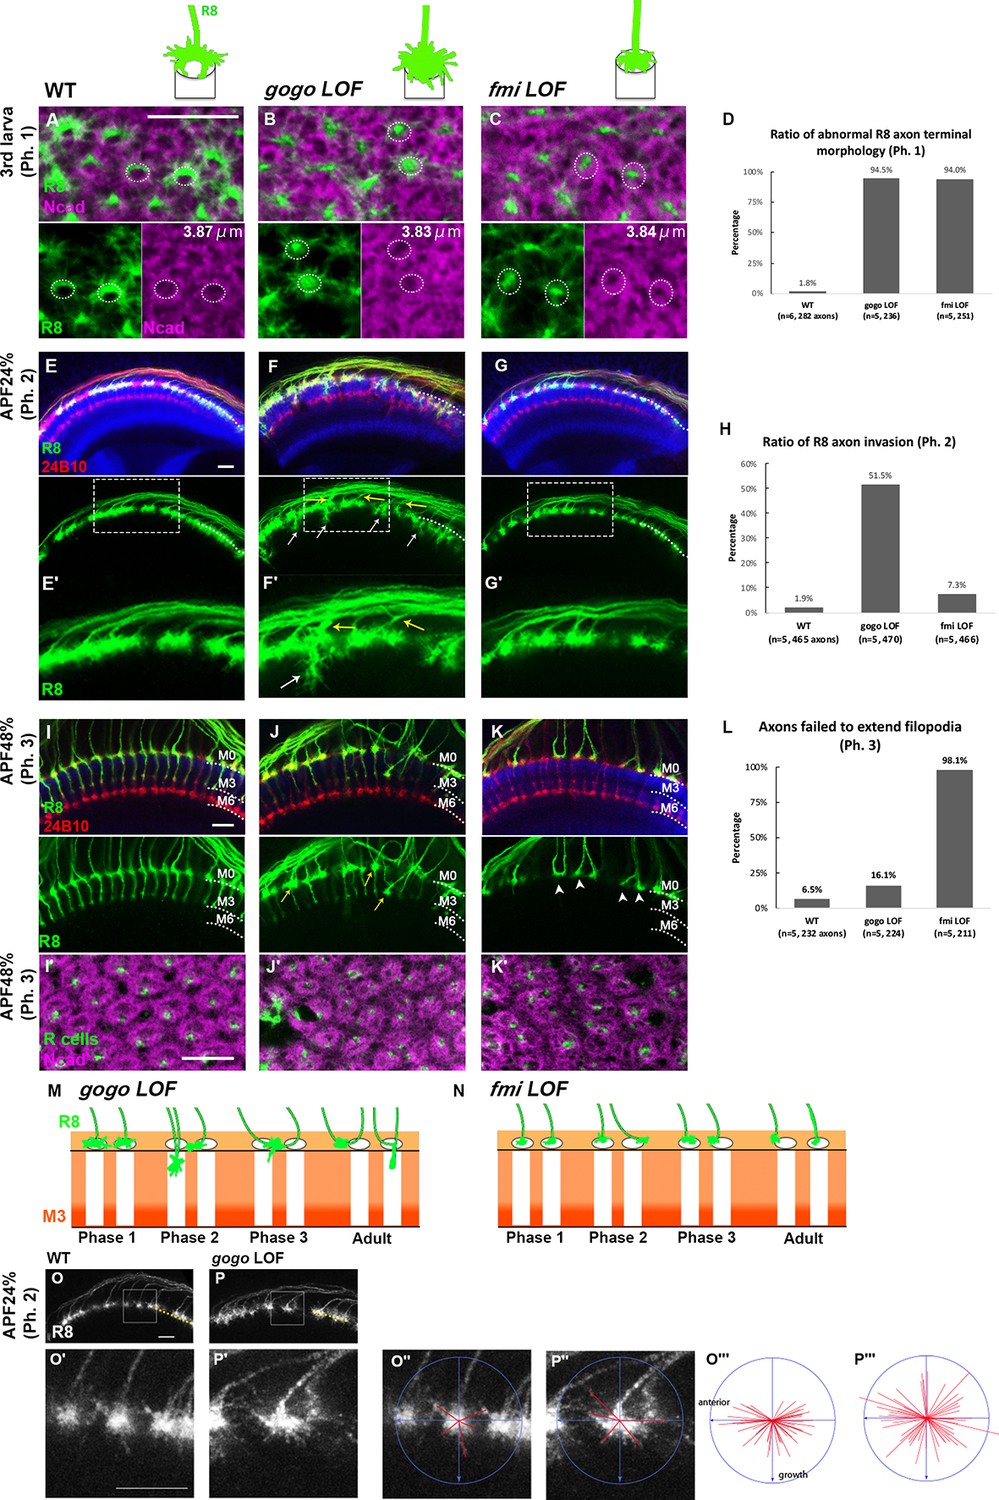
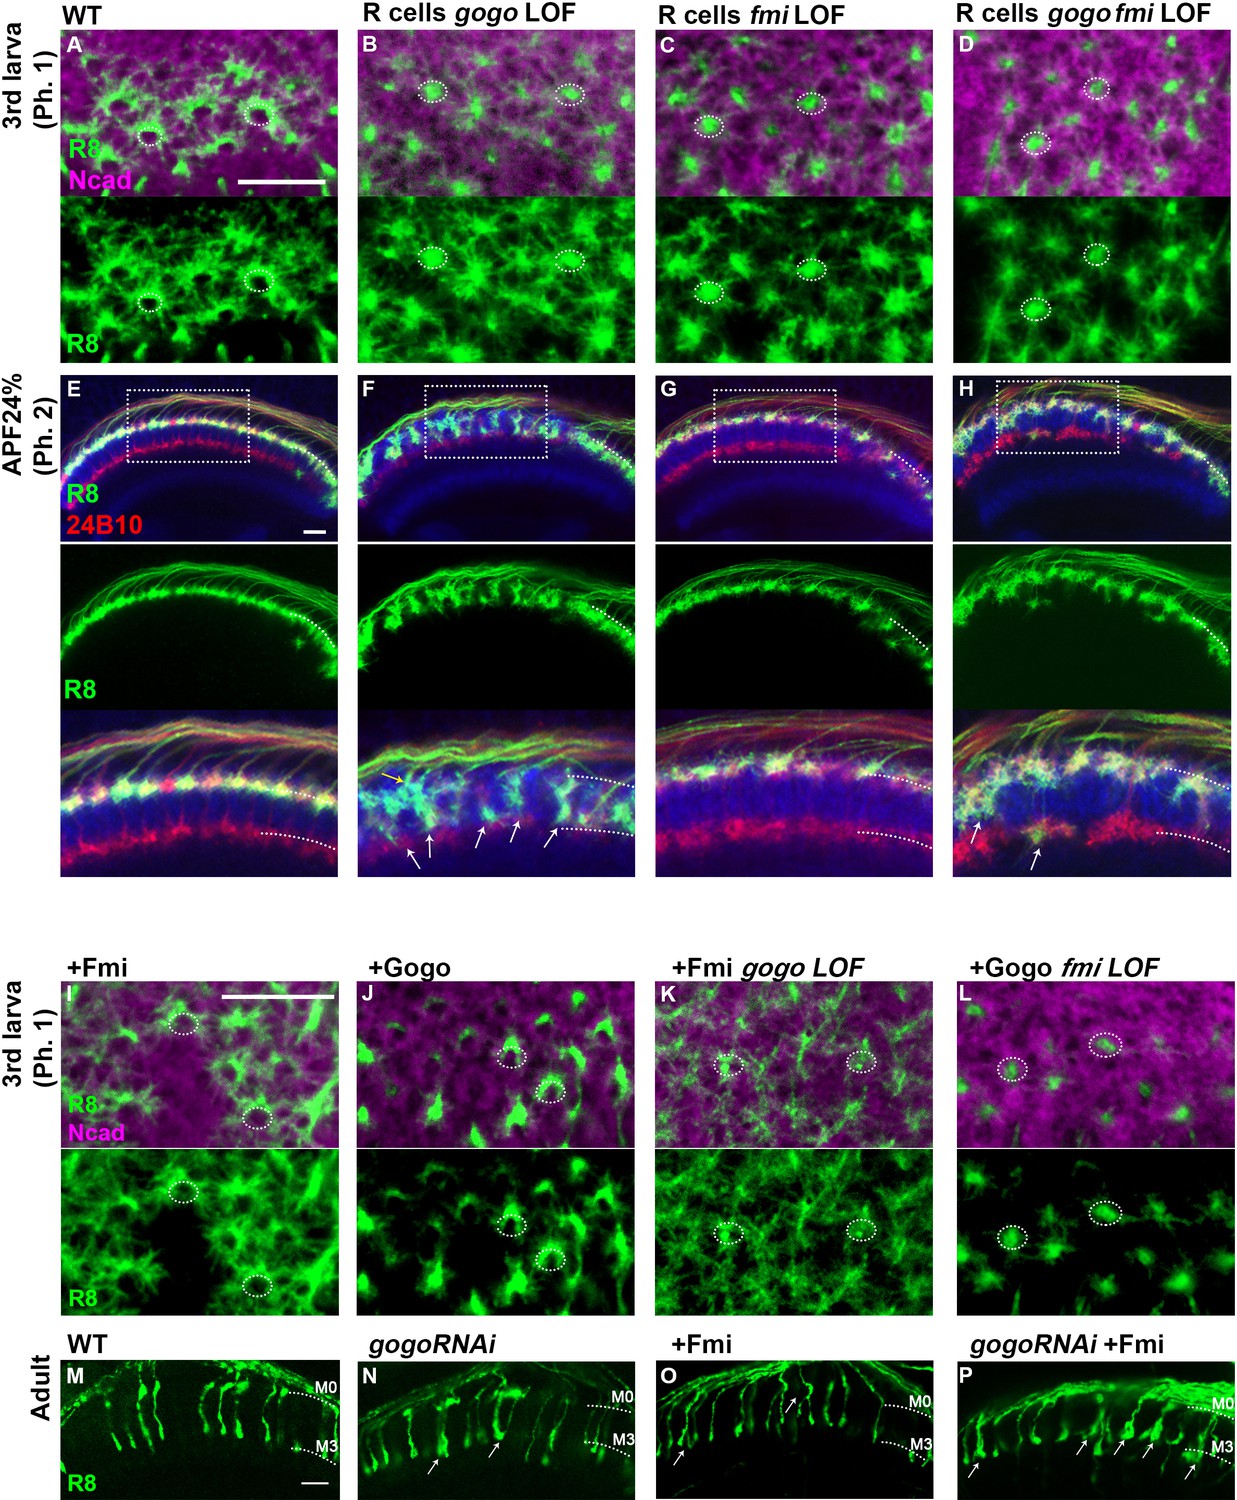
(A–L) The medulla of control, R8-specific gogo loss-of-function mutations, and R8-specific fmi loss-of-function was analyzed. (A–C) The medulla of the third instar larvae (phase 1) was labeled with UAS-mCD8GFP for R8 (green) and anti-N-cadherin (magenta) to visualize columns. The dashed circles demarcate columns. The numbers indicate the average diameter of the medulla columns visualized with anti-N-cadherin (n = 3, 18 columns). (D) Quantification of the R8 axon terminals that intruded into the medulla columnar center and failed to form a proper horseshoe shape during phase 1. (E–G) The medulla at APF24% (phase 2) was labeled with UAS-mCD8GFP for R8 (green), mAb24B10 for all R axons (red) and anti-N-cadherin (blue). gogo loss-of-functions showed R8 axon bundling and overextension beyond the R8 temporary layer (arrows). (H) Quantification of the invasion R8 axons at phase 2. (I–K) The medulla at APF48% (phase 3) was labeled with UAS-mCD8GFP for R8 (green), mAb24B10 for all R axons (red), and anti-N-cadherin (blue). gogo loss-of-function showed R8 axon bundling (arrows), whereas in fmi loss-of-functions, R8 axons failed to extend filopodia vertically toward the M3 layer (arrowheads). (I’–K’) Medulla were labeled with N-cadherin (magenta) and R axons with mAb24B10 (green) to highlight the columnar pattern. (L) Quantification of R8 axons that failed to vertically extend their filopodia toward the M3 layer during phase 3. (M, N) Schematics of R8-targeting phenotype in gogo loss-of-function and fmi loss-of-function in each phase. (O, P). To elucidate the function of Gogo in phase 2, gogo RNAi was expressed in R8 axons in gogo heterozygous mutant only after puparium formation (APF0%) using Gal80ts to eliminate the effect of gogo LOF in phase 1. Since the axons were sparsely labeled using Flp-out system, some axon terminals were isolated and each filopodia can be identifiable (white square in O and P. Enlarged images in O’ and P’). The centers of the growth cones were plotted, and the orientation of axon growth perpendicular to boundary line of medulla was determined. Tips of the five longest filopodia were connected to the center by red lines (O’’, P’’). Fifty lines from ten axons were collected and merged into one image (O’’’, P’’’). In the phase 2-specific gogo LOF, anterior R8 axon growth cones extended longer filopodia in more radial directions than wild type. Scale bars 10 μm.
-
Figure 2—source data 1
Source data for the quantification in Figure 2A-C.
- https://cdn.elifesciences.org/articles/66718/elife-66718-fig2-data1-v2.xlsx
-
Figure 2—source data 2
Source data for the quantification in Figure 2D.
- https://cdn.elifesciences.org/articles/66718/elife-66718-fig2-data2-v2.xlsx
-
Figure 2—source data 3
Source data for the quantification in Figure 2H.
- https://cdn.elifesciences.org/articles/66718/elife-66718-fig2-data3-v2.xlsx
-
Figure 2—source data 4
Source data for the quantification in Figure 2L.
- https://cdn.elifesciences.org/articles/66718/elife-66718-fig2-data4-v2.xlsx
Figure 2—figure supplement 1
R cell-specific loss-of-funtion of Gogo and Fmi.
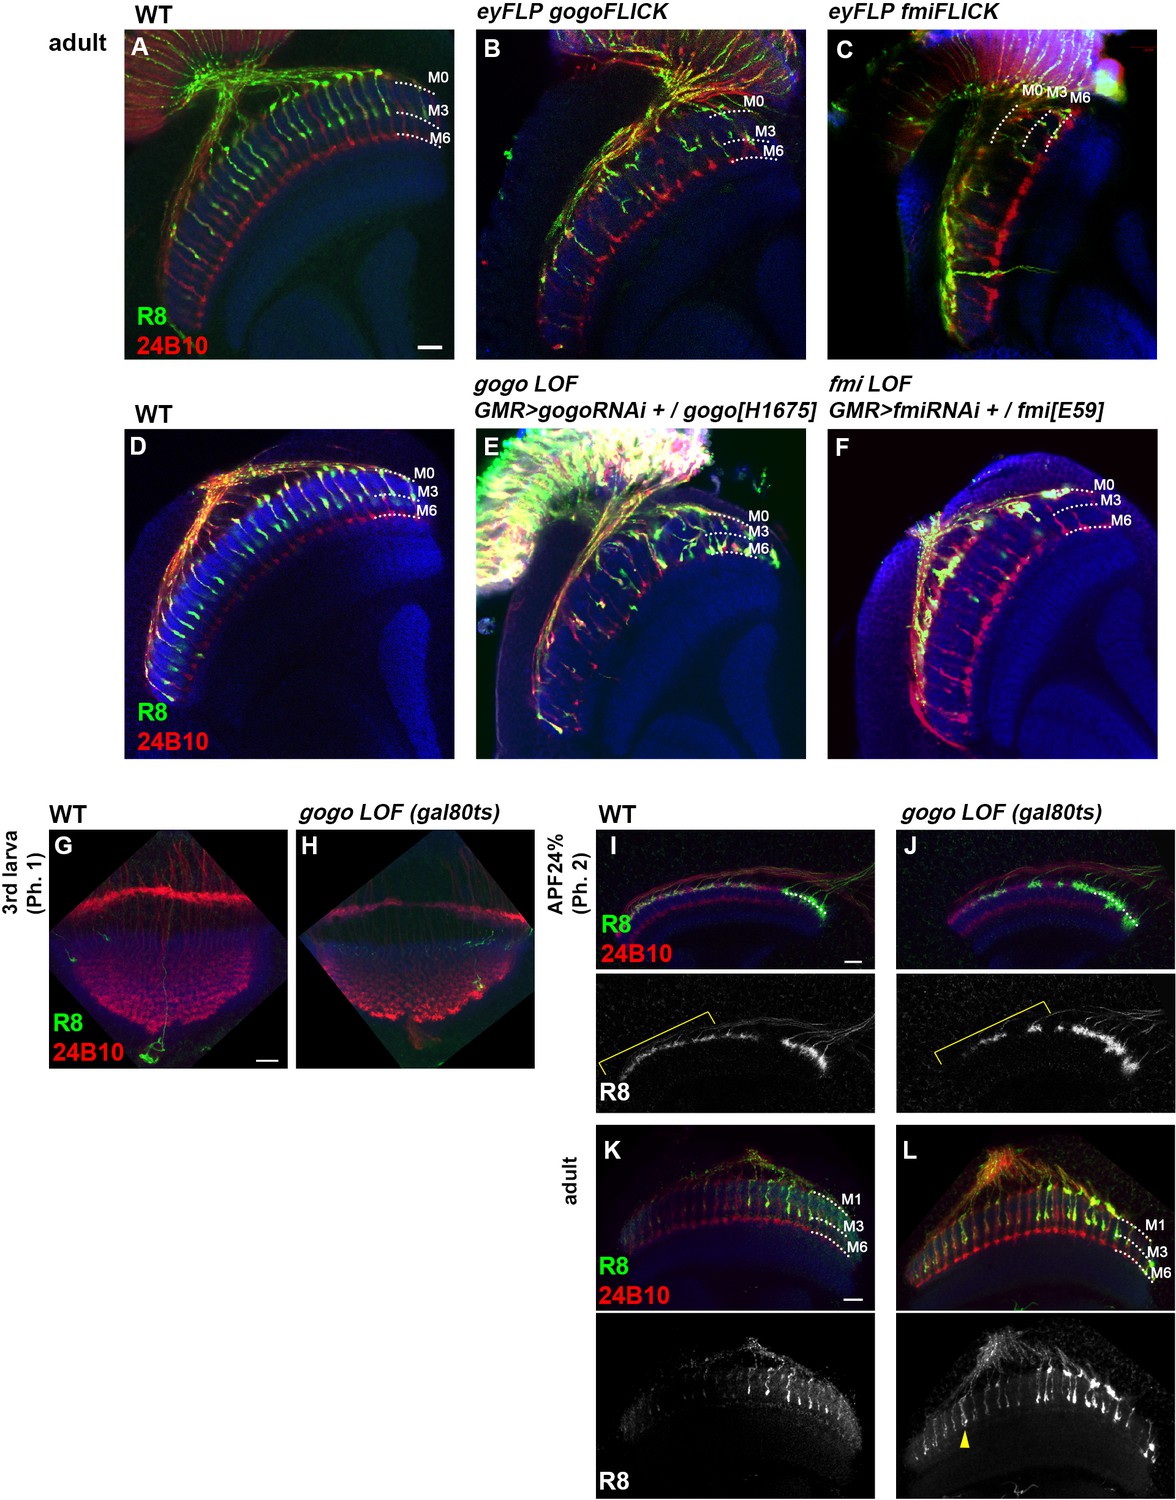
(A–F) R axons in adult medulla visualized with GFP (green) counterstained with 24B10 (red) and anti-N-cadherin (blue) in control (A and D) and gogo (B and E), fmi (C and F) mutants. gogo and fmi heterozygote mutant with R cell-specific RNAi (GMR-Gal4, UAS-RNAi, at 29℃ [loss-of-function]) (E and F respectively) showed strong phenotype equivalent to gogo, fmi eyFLICK flies (gogo[H1675]/<gogo<, fmi[E59]/<fmi< [Aznar and Lacal, 2001]) (B and C respectively). (G–L) To elucidate the Gogo function in phase 2, gogo RNAi was expressed in R8 axons of gogo heterozygous mutant only after puparium formation (APF0%) using Gal80ts to eliminate the effect of gogo mutation in phase 1. R8 axons which express RNAi were marked with GFP (green). Photoreceptor axons were labeled with 24B10 (red) and medulla layers with anti-N-cadherin (blue). Only few clones were observed in late third instar larvae, and horseshoe shape of axon terminals at phase 1 was created properly (G, H). At phase 2 (24APF%), the clone number increased (I, J). The yellow brackets indicate the anterior region where the R8 axons innervated the optic lobe and had already developed a horseshoe shape during third instar larvae. In the adult, some axon bundling phenotype was observed (an arrowhead in L) in this region. Scale bar 10 μm.
Figure 2—video 1
Filopodial dynamics of the control animal.
Live imaging of R8 photoreceptor growth cone filopodial dynamics from early to midpupal stage in the control animal. Yellow arrows indicate R8 filopodia extension at step 3.
Figure 2—video 2
Filopodial dynamics of gogo mutant.
Live imaging of R8 photoreceptor growth cone filopodial dynamics from early to midpupal stage in gogo mutant. Yellow arrows indicate R8 filopodia extension at step 3, while the white arrow indicates R8 axons bundling and precociously invading the deeper medulla layer.
Figure 3 with 2 supplements
Gogo has dual functions, 'cooperative’ and ‘antagonistic’ toward Fmi.
(A–E) R8 axons in wild type (A), R8-specific knockdowns of gogo (B), fmi (C), and gogo, fmi double knockdowns (D) in phase 1 were visualized using R8-specific UAS-mCD8GFP (green) counterstained with anti-N-cadherin (magenta). (E) Quantification of the R8 axon terminals that intruded into the medulla columnar center and failed to form a proper horseshoe shape at phase 1 (third instar larva). (F–L) Genetic interaction between fmi and gogo. R8 axons are labeled with mCD8GFP (green), and counterstained with mAb24B10 (red) and anti-N-cadherin (blue). R8 axons overexpressing gogo failed to extend their filopodia vertically toward the M3 layer (arrowheads in G compared with F). (H) Quantification of R8 axons failed to vertically extend their filopodia toward the M3 layer during phase 3 (APF48%). (I) Upon fmi overexpression, R8 cells extended their vertical filopodia toward the deeper layer of the medulla during phase 2 (APF24%). The vertical filopodia extension was further promoted by gogo RNAi (J) and strongly suppressed by gogo overexpression (K). (L) Quantification of R8 filopodia length. The length of the longest filopodia was measured in 3D images and divided into three classes: <5 μm (light blue), 5–15 μm (dark blue), and >15 μm (magenta). Scale bars 10 μm.
-
Figure 3—source data 1
Source data for the quantification in Figure 3E.
- https://cdn.elifesciences.org/articles/66718/elife-66718-fig3-data1-v2.xlsx
-
Figure 3—source data 2
Source data for the quantification in Figure 3H.
- https://cdn.elifesciences.org/articles/66718/elife-66718-fig3-data2-v2.xlsx
-
Figure 3—source data 3
Source data for the quantification in Figure 3L.
- https://cdn.elifesciences.org/articles/66718/elife-66718-fig3-data3-v2.xlsx
Figure 3—figure supplement 1
Gogo and Fmi functions are not redundant.
(A–H) R8 axons in medulla at phase 1 (A–D) and phase 2 (E–H) were visualized with GFP (green) counterstained by anti-N-cadherin (magenta in A-D, blue in E-H) and 24B10 (red in E-H) in control (A, E) and R cell-specific loss- of-function of gogo (B, F), fmi (C, G), and gogo, fmi double (D, H). Compared to the gogo single LOF mutant, gogo/fmi double LOF mutants showed much milder bundling and invasion defects in phase 2 (arrows). (I–L) Mutual rescue between gogo and fmi was tested during phase 1 (third larva). R8-specific gogo or fmi loss-of-function clones were generated by heterozygote mutation with R8-specific RNAi. R8-specific expression of Gogo or Fmi was driven by the sensFLP, GMR-FsF-Gal4. R8 axons were visualized with mCD8GFP (green), and counterstained with anti-N-cadherin (magenta). Expression of Gogo or Fmi in the loss-of-function of the other gene did not show any functional rescue (K–L). (M–P) The expression of Gogo was downregulated using RNAi in the Fmi overexpression background. The gogo RNAi and fmi transgeneswere expressed by sensFLP; GMR-FsF-Gal4 driver. R8 axons were labeled with UAS-mCD8GFP (green). In wild type (M), R8 axons do not bundle each other and target M3 layer. In gogo knockdown (N) or Fmi overexpression (O), few bundling of the R8 axons (arrows in N-O) was found in the adult stage, and the phenotype was enhanced by combining them (arrows in P). Scale bars 10 μm.
Figure 3—figure supplement 2
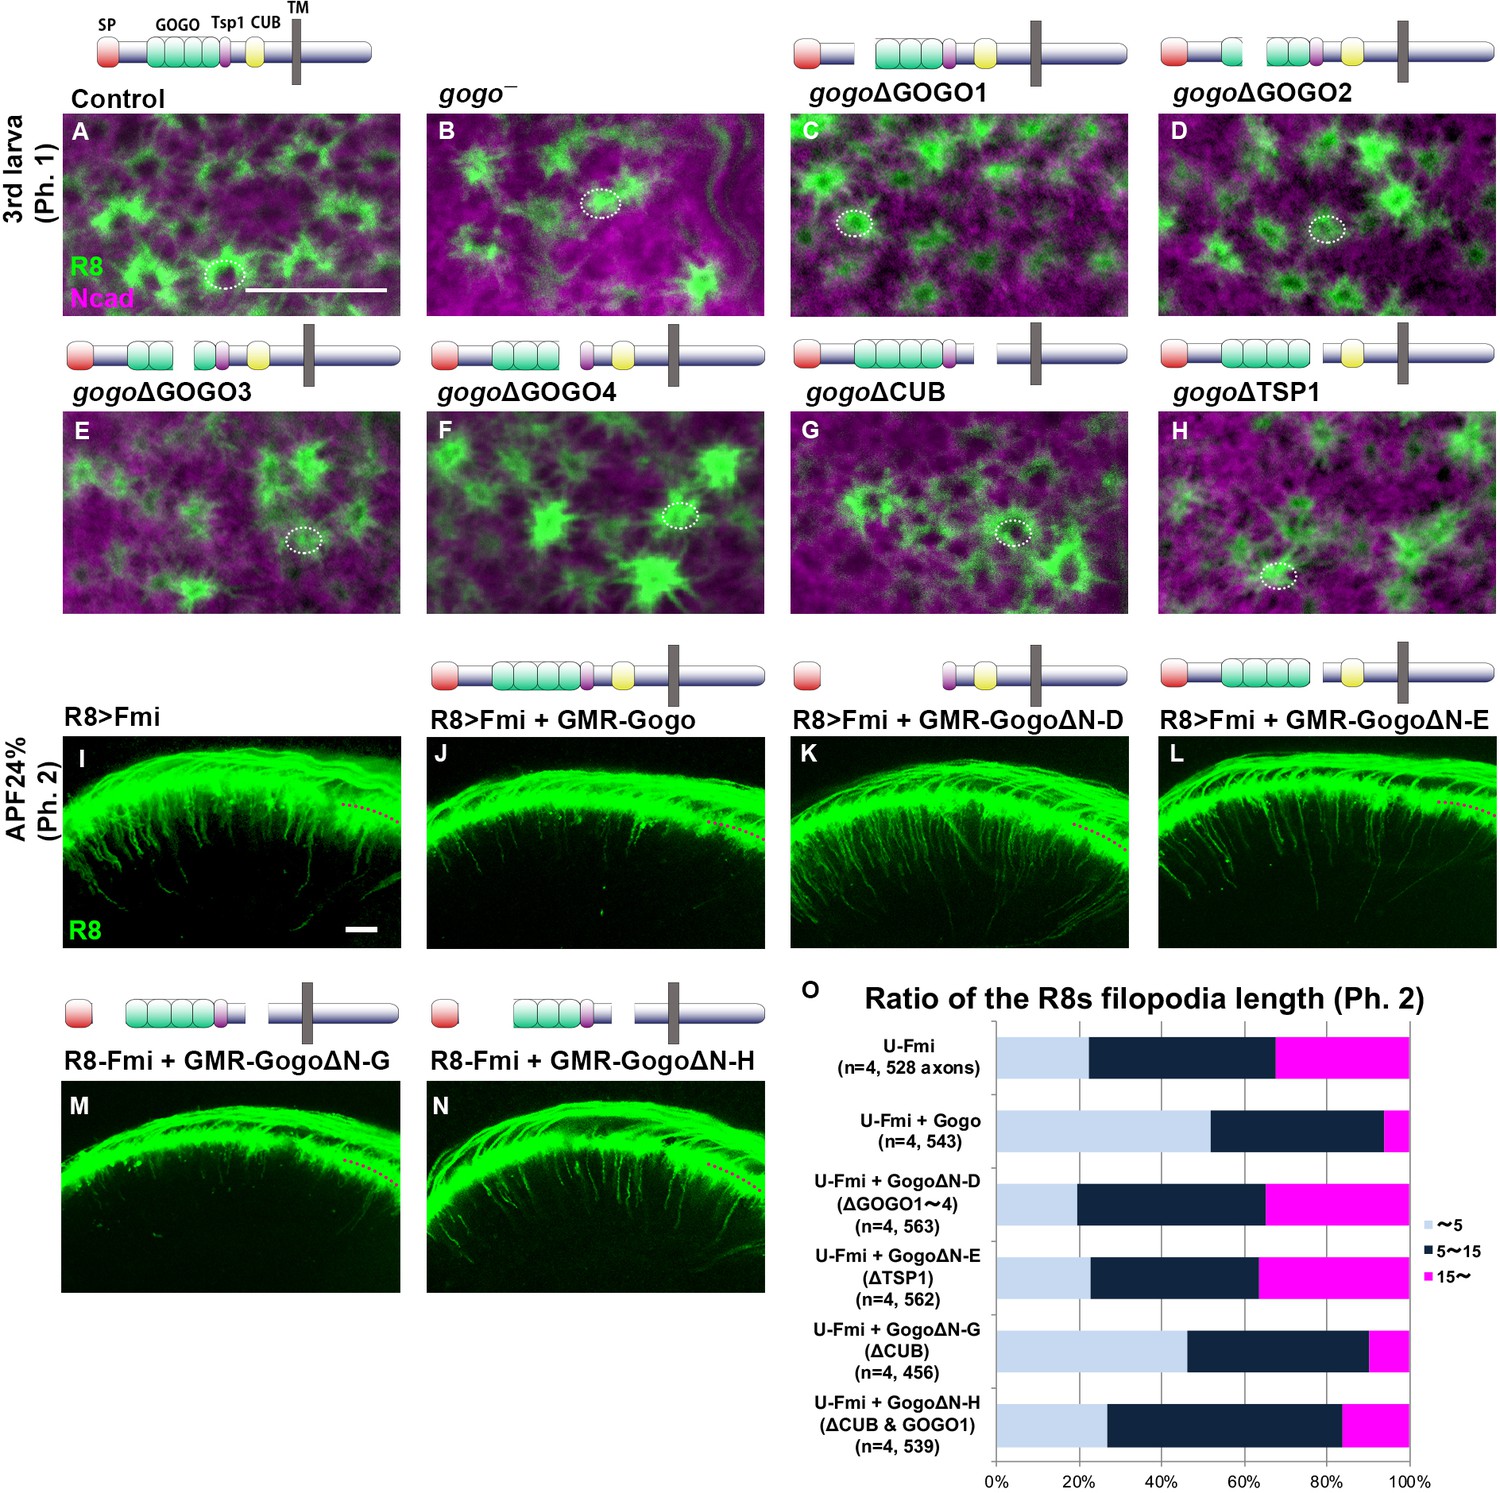
Functional domain analysis of Gogo.
(A–H) Small deletions as illustrated above each image heterozygous with gogo null mutation were analyzed at phase 1. R8 axons were labeled with myr-Tomato (green) counterstained with anti-N-cadherin (magenta). Small deletions of GOGO (C–F) or Tsp1 (H) domains resulted in the R8 axons targeting defects equivalent to gogo null mutant (B). (I–O) The transgenes as illustrated above each image were expressed in all photoreceptor neurons by GMR promoter in the background of R8-specific Fmi overexpression. R8 axons were labeled with mCD8GFP (green) in Fmi overexpression at phase 2 (APF24%). Gogo which lacks GOGO domain (K and N) or Tsp1 domain (L) showed weaker suppression of filopodia extension phenotype in Fmi overexpression than wild type Gogo (J). (O) Quantification of R8 axon filopodia length. The length of filopodia was divided into three classes: ~5 μm (light blue), 5–15 μm (dark blue), 15 μm ~ (magenta). Scale bars 10 μm.
-
Figure 3—figure supplement 2—source data 1
Source data for the quantification in Figure 3—figure supplement 2O.
- https://cdn.elifesciences.org/articles/66718/elife-66718-fig3-figsupp2-data1-v2.xlsx
Figure 4
Gogo localization in R8 changes depending on the expression level of Fmi.
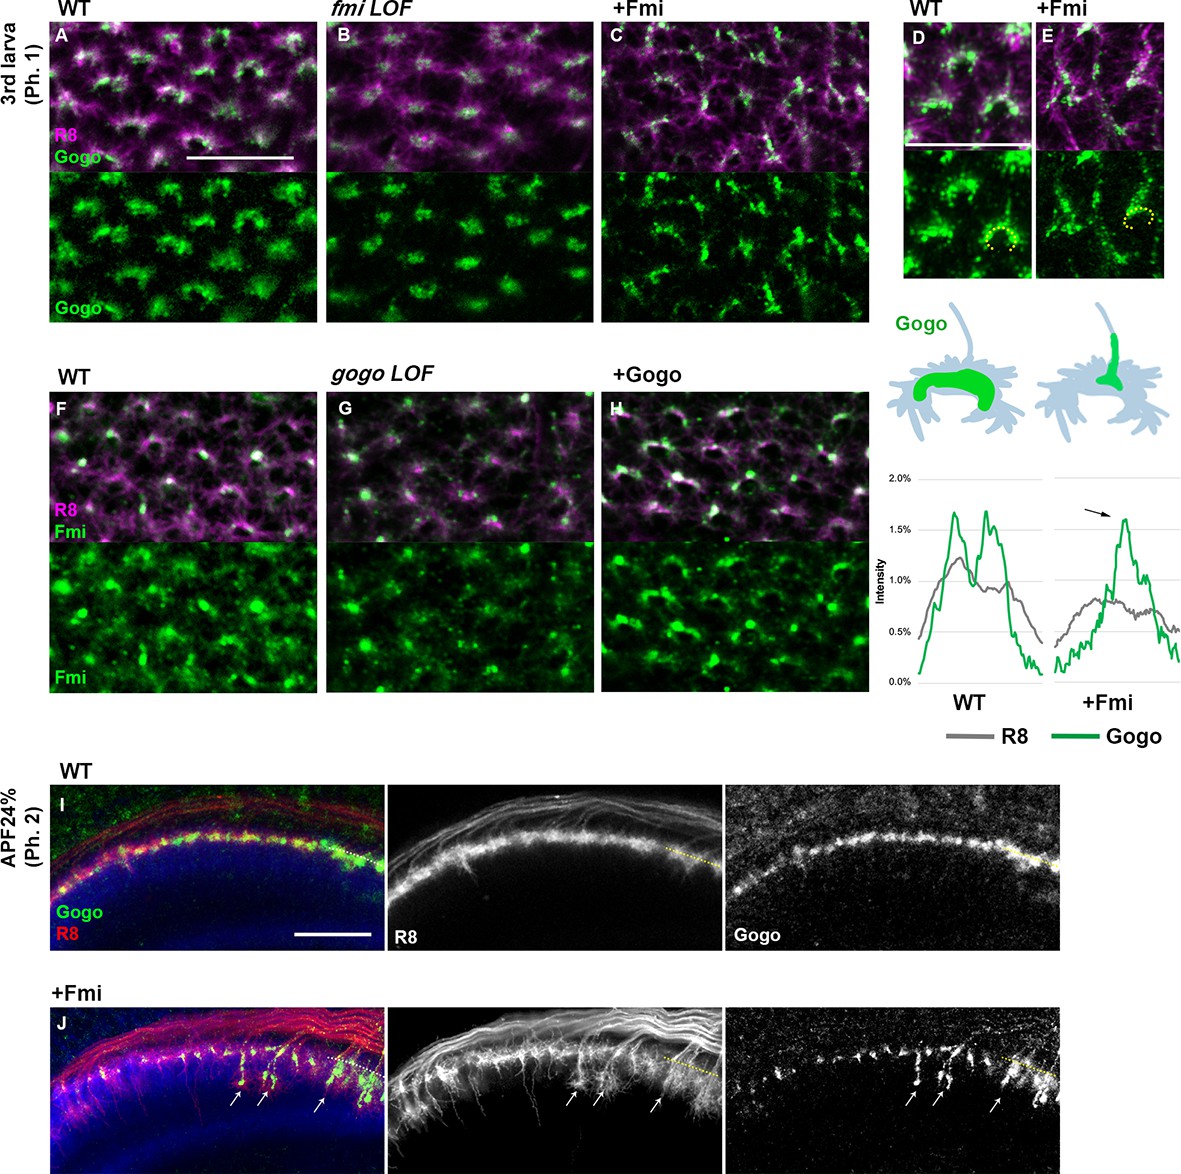
(A–H) Localization of R8-specific Gogo-GFP (A–E) and Fmi-mCherry (D–H) in loss-of-function (heterozygous mutation with R8-specific RNAi) or overexpression backgrounds. R8 axons were labeled with myr-RFP or mCD8GFP. (D–E) 3D images of Gogo localization in R8 cells of wild type (D) or Fmi overexpression (E). The fluorescent intensity of Gogo-GFP (green) and R8 myr-RFP (gray) was measured along the horseshoe structures (the dotted lines in D, E) and the average of four axons (n = 2 animals) is shown in the graph below each image. Upon Fmi overexpression, strong Gogo expression was observed at the stalk of the axon terminal (C and E compared with A and D, arrow in the histogram of +Fmi). (F–H) Fmi localization did not show remarkable change in gogo loss-of-function (G) nor in gogo overexpression (H) mutants compared with the wild type (F). (I, J) R8-specific Gogo-GFP (green) during phase 2 in wild type (I) and Fmi overexpression mutants (J). R8 axons are labeled with myr-RFP (red) and counterstained with anti-N-cadherin (blue). Gogo protein was localized along the vertical filopodia that prematurely extended during phase 2 (arrows in J compared with I). Scale bars 10 μm.
-
Figure 4—source data 1
Source data for the quantification in Figure 4D-E.
- https://cdn.elifesciences.org/articles/66718/elife-66718-fig4-data1-v2.xlsx
Figure 5 with 1 supplement
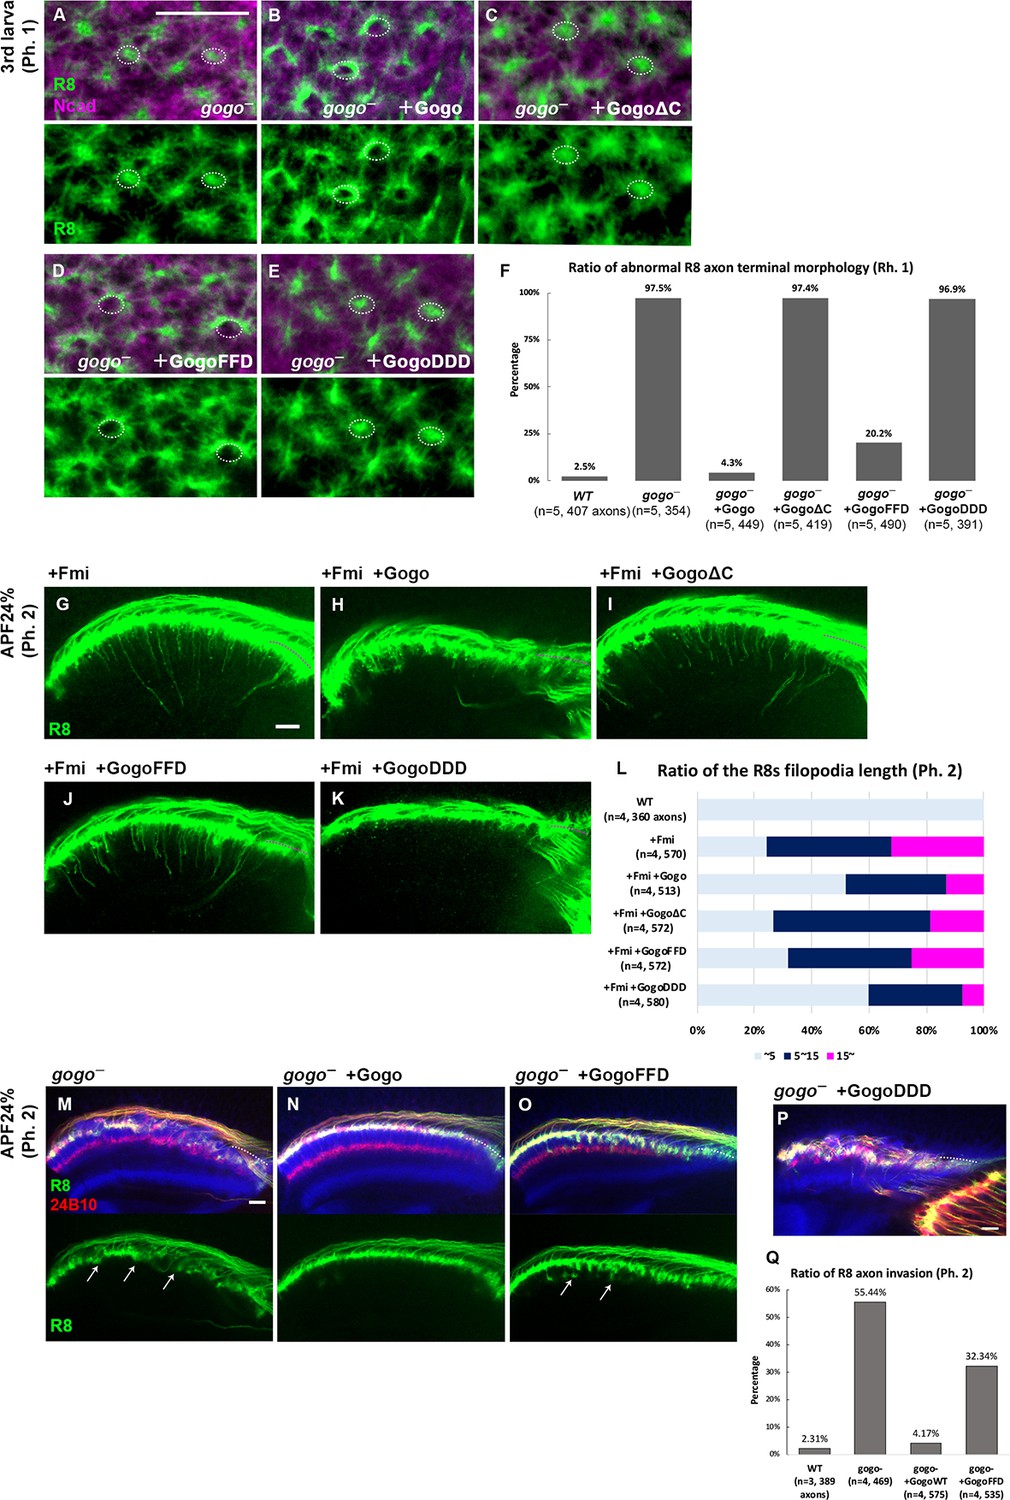
Dual function of Gogo controlled by the phosphorylation of YYD motif.
(A–F) gogo rescue experiments in a background of gogo[H1675]/gogo[D1600] during phase 1 (third instar larva). R8 axons were visualized with mCD8GFP (green), and columns were labeled with N-cadherin (magenta). The targeting defects of gogo mutants (A) were almost completely rescued by wild-type Gogo (B) and GogoFFD (D, non-phosphomimetic), but not rescued by GogoΔC (C) or GogoDDD (E, phosphomimetic). (F) Quantification of R8 axon terminals that intruded into the medulla columnar center and failed to form a proper horseshoe shape at phase 1 (third instar larva). (G–L) Horizontal images of R8 axons expressing GogoFFD or GogoDDD in an Fmi overexpression background at phase 2 (APF24%). R8 filopodia elongation was significantly repressed by wild-type Gogo (H) or GogoDDD (K), but not by GogoΔC (I) nor GogoFFD expression (J). Quantification of R8 axon filopodia length (L). The length of the longest filopodia in a 3D image was measured and divided into three classes: <5 μm (light blue), 5–15 μm (dark blue), >15 μm (magenta). (M–Q) Ectopic filopodia extension and axon bundling (arrows in M) in gogo mutants (gogo[H1675]/gogo[D1600]) were rescued by wild-type Gogo (N), but not by GogoFFD expression (arrows in O) during phase 2 (APF24%). (P) The R8 axons in GogoDDD-rescued animals were too disrupted to be quantified. (Q) Quantification of the R8 axon invasion during phase 2. Scale bars 10 μm.
-
Figure 5—source data 1
Source data for the quantification in Figure 5F.
- https://cdn.elifesciences.org/articles/66718/elife-66718-fig5-data1-v2.xlsx
-
Figure 5—source data 2
Source data for the quantification in Figure 5L.
- https://cdn.elifesciences.org/articles/66718/elife-66718-fig5-data2-v2.xlsx
-
Figure 5—source data 3
Source data for the quantification in Figure 5Q.
- https://cdn.elifesciences.org/articles/66718/elife-66718-fig5-data3-v2.xlsx
Figure 5—figure supplement 1
Gogo and Fmi cytoplasmic domain change its functional properties.
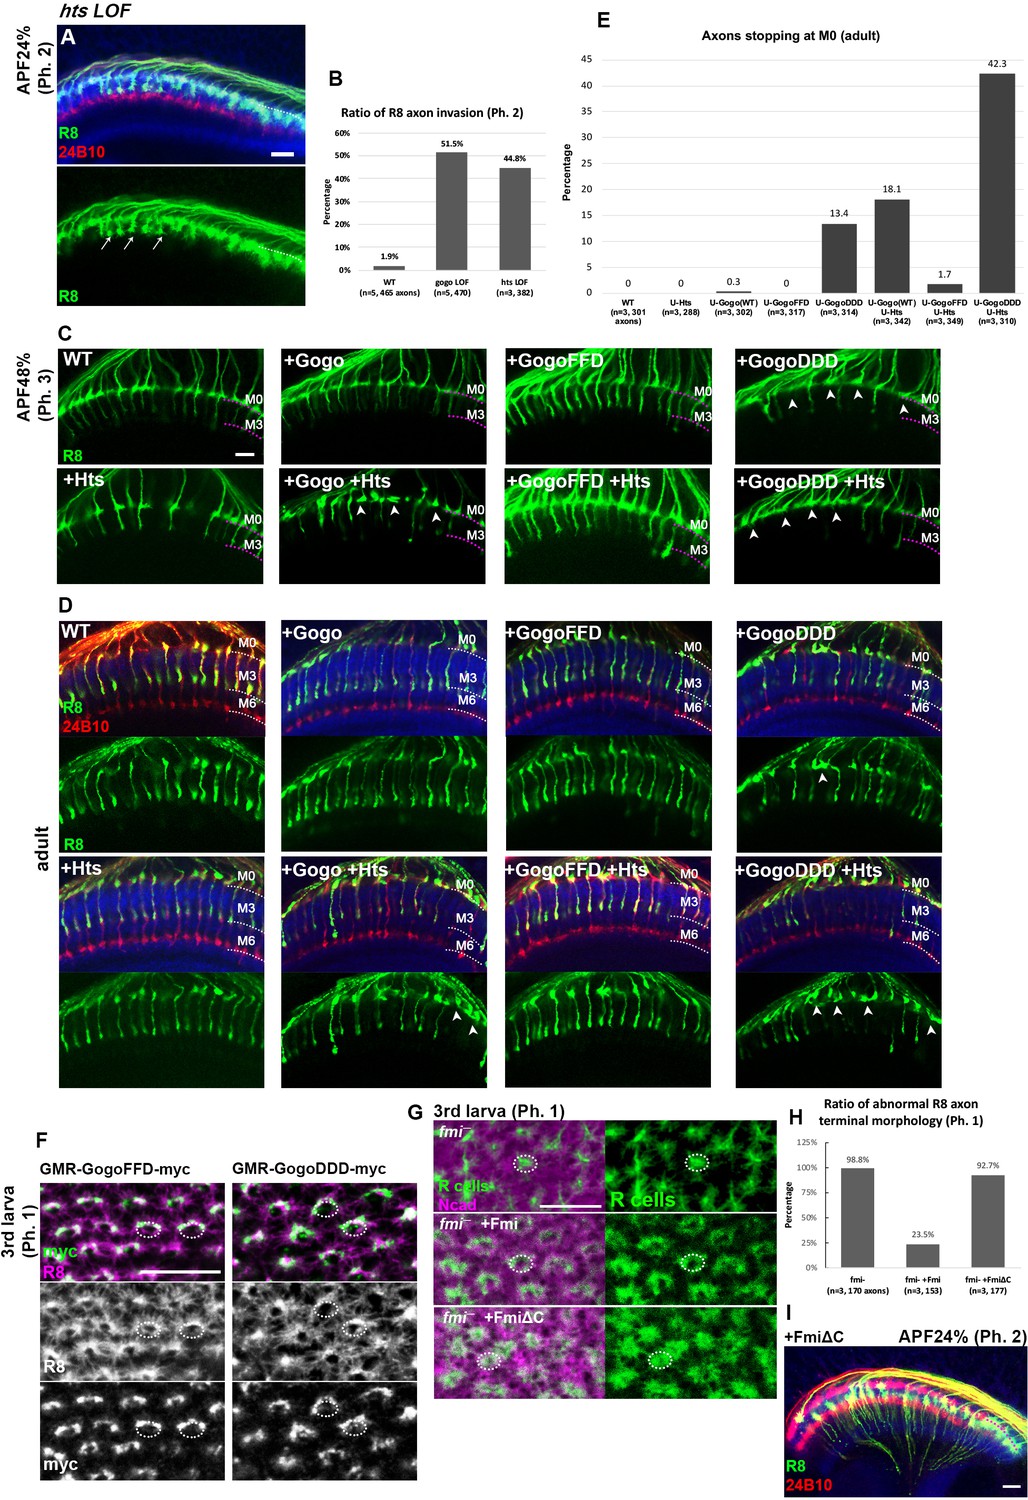
(A) R8-specific hts loss-of-function animals were generated by hts heterozygote with R8-specific RNAi. In phase 2 (APF24%), hts loss-of-function shows R8 axons bundling phenotype (arrows) due to the excessive extension of filopodia in random direction. (B) Quantification of the R8 axon invasion at the phase 2. (C–E) Phenotypes of R8 axons overexpressing Gogo (wild type, non-phosphomimetic(FFD), phospho-mimetic(DDD)) and Hts. Transgenes were expressed under the GMR-Gal4 driver (25℃). R8 axons were labeled with sensFLP UAS-FsF-mCD8GFP (green), counterstained with mAb24B10 (red) and anti-N-cadherin (blue). When Gogo, GogoFFD, or Hts was overexpressed alone, R8 axons target normally. In GogoDDD overexpression, the filopodia extension was partially suppressed at the phase 3 (APF48%) (B, arrowheads) and R8 axons stopped at the medulla neuropil surface in adult. Overexpression of Hts in combination with Gogo or GogoDDD, but not with GogoFFD, enhanced the suppression of the filopodia extension and R8 axons stopped at the M1 layer (C–D arrowheads). (E) Quantification of R8 axons stopping at M1 layer in adult. (F) The myc tagged GMR gogo transgenes were expressed in all photoreceptor neurons and detected by anti-myc (green). R8 cells labeled with sens-Gal4, UAS-mCD8GFP (magenta). GogoFFD and GogoDDD localized at R8 axon termini normally at the phase 1 (third larva). (G–H) The requirement of the fmi cytoplasmic part was confirmed by the rescue experiments. fmi mutant clones were generated by ey3.5FLP; <fmi< (Aznar and Lacal, 2001) / fmi[E59]. Expression of Fmi was driven by the GMR-Gal4. R axons were visualized with ey3.5FLP, UAS-FsF-mCD8GFP (green), and counterstained with N-cadherin (magenta). Wild-type Fmi but not FmiΔC rescued the fmi mutant phenotype in the phase 1 (third larva). (H) Quantification of the R8 axons with abnormal terminal morphology. (I) FmiΔC was expressed under the sensFLP GMR-FsF-Gal4. R8 axons were labeled with UAS-mCD8GFP (green), counterstained with mAb24B10 (red) and anti-N-cadherin (blue). In FmiΔC overexpression, R8 cells extend their vertical filopodia precociously toward the deeper layer of the medulla at the phase 2 (APF24%), similar to wild-type Fmi overexpression (Figure 5G). Scale bars 10 μm.
-
Figure 5—figure supplement 1—source data 1
Source data for the quantification in Figure 5—figure supplement 1B.
- https://cdn.elifesciences.org/articles/66718/elife-66718-fig5-figsupp1-data1-v2.xlsx
-
Figure 5—figure supplement 1—source data 2
Source data for the quantification in Figure 5—figure supplement 1E.
- https://cdn.elifesciences.org/articles/66718/elife-66718-fig5-figsupp1-data2-v2.xlsx
-
Figure 5—figure supplement 1—source data 3
Source data for the quantification in Figure 5—figure supplement 1H.
- https://cdn.elifesciences.org/articles/66718/elife-66718-fig5-figsupp1-data3-v2.xlsx
Figure 6 with 1 supplement
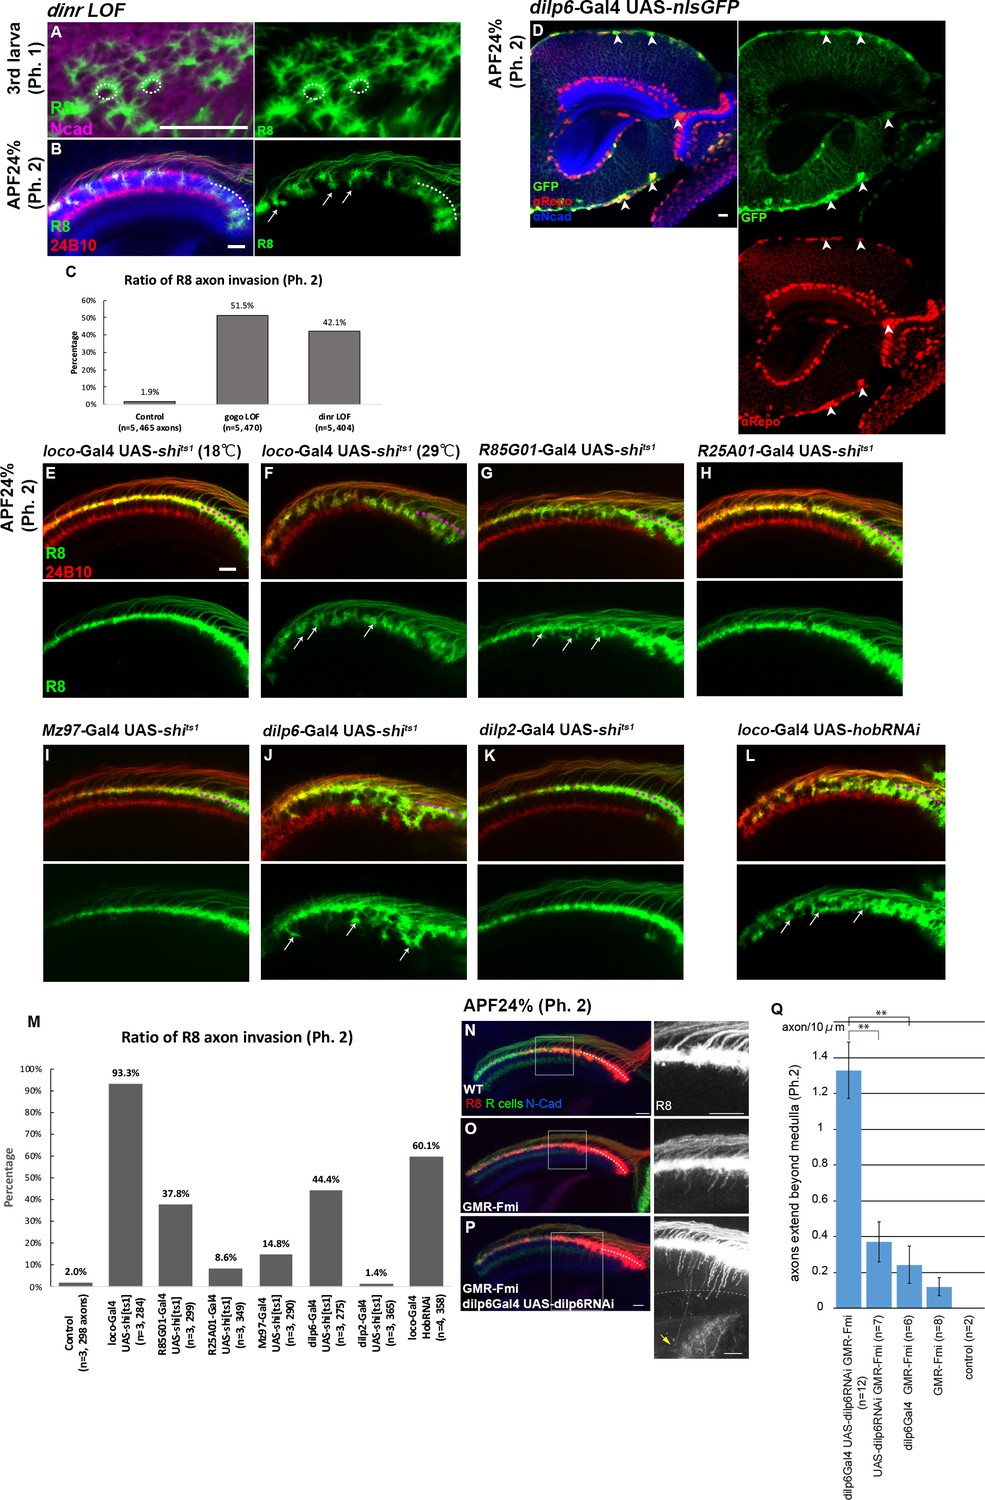
Glial insulin switches the Gogo-Fmi function from ‘cooperative’ to ‘antagonistic'.
(A–C) The phenotype of R8-specific dinr loss-of-function (dinr heterozygotes with R8 cell-specific RNAi) at the third instar larvae and APF24% (phase 1 and 2) was analyzed using R8-specific mCD8GFP (green) counterstained with mAb24B10 (red in B) and anti-N-cadherin (magenta in A, blue in B). R8 axons bundled together, resulting in invasion into deeper medullar layers in phase 2 (arrows in B). (C) Quantification of the R8 axon invasion during phase 2. (D) Dilp6-Gal4 expression monitored by nuclear GFP reporter (green) was mainly observed in cortex and surface glial cells in the optic lobe during phase 2 (arrowheads). Glial cells were labeled with anti-repo (red), and optic neuropils with anti-N-cadherin (blue). (E–K) The secretion of the Dilp was blocked in cells expressing UAS-shits1 using loco-Gal4 (E and F) in all glial cells, GMR85G01-Gal4 (G) in surface and cortex glia, GMR25A01-Gal4 (H), Mz97-Gal4 (I) in wrapping and neuropil glia, dilp6-Gal4 (J) and dilp2-Gal4 (K). During phase 2, R8 axons labeled by myr-tdTomato (green) showed the bundling phenotype in surface and cortex glia-specific shits1 expression (arrows in F, G, and J). Although these Gal4 drivers were expressed from the larval stages, the effect of blocking by shi[ts] began from APF0% when the temperature was shifted to 29°C. (L) Glia-specific inhibition of Dilp secretion by hobbit RNAi expressed under a loco-Gal4 driver. R8 axons bundled with each other, resulting in invasion into the deeper medullar layers (arrows). (M) Quantification of R8 axon invasion in E–L. (N–Q) To investigate the genetic interaction between glial dilp6 and filopodia extension during phase 2, dilp6 RNAi was expressed in glial cells using dilp6-Gal4, and Fmi was overexpressed in photoreceptors using GMR-Fmi. R8 axons were visualized using myr-tdTomato (red, white in the right side of each panel) together with all photoreceptor axons (green) and N-cadherin (blue). GMR-Fmi flies showed enhanced filopodia extension (O). Knockdown of dilp6 using dilp6-Gal4 and UAS-dilp6RNAi significantly enhanced the phenotype (P), and several filopodia extended over the medulla (arrow). The dotted line indicates the lower edge of the medulla. (Q) Quantification of the number of axons that extend over the medulla. Medulla region was determined according to the Ncad staining. Total number of the filopodia extensions beyond the medulla were counted from several images, and the average number per 10 μm section was calculated. **p<0.001, Welch’s t-test. Scale bars 10 μm.
-
Figure 6—source data 1
Source data for the quantification in Figure 6C.
- https://cdn.elifesciences.org/articles/66718/elife-66718-fig6-data1-v2.xlsx
-
Figure 6—source data 2
Source data for the quantification in Figure 6M.
- https://cdn.elifesciences.org/articles/66718/elife-66718-fig6-data2-v2.xlsx
-
Figure 6—source data 3
Source data for the quantification in Figure 6Q.
- https://cdn.elifesciences.org/articles/66718/elife-66718-fig6-data3-v2.xlsx
Figure 6—figure supplement 1
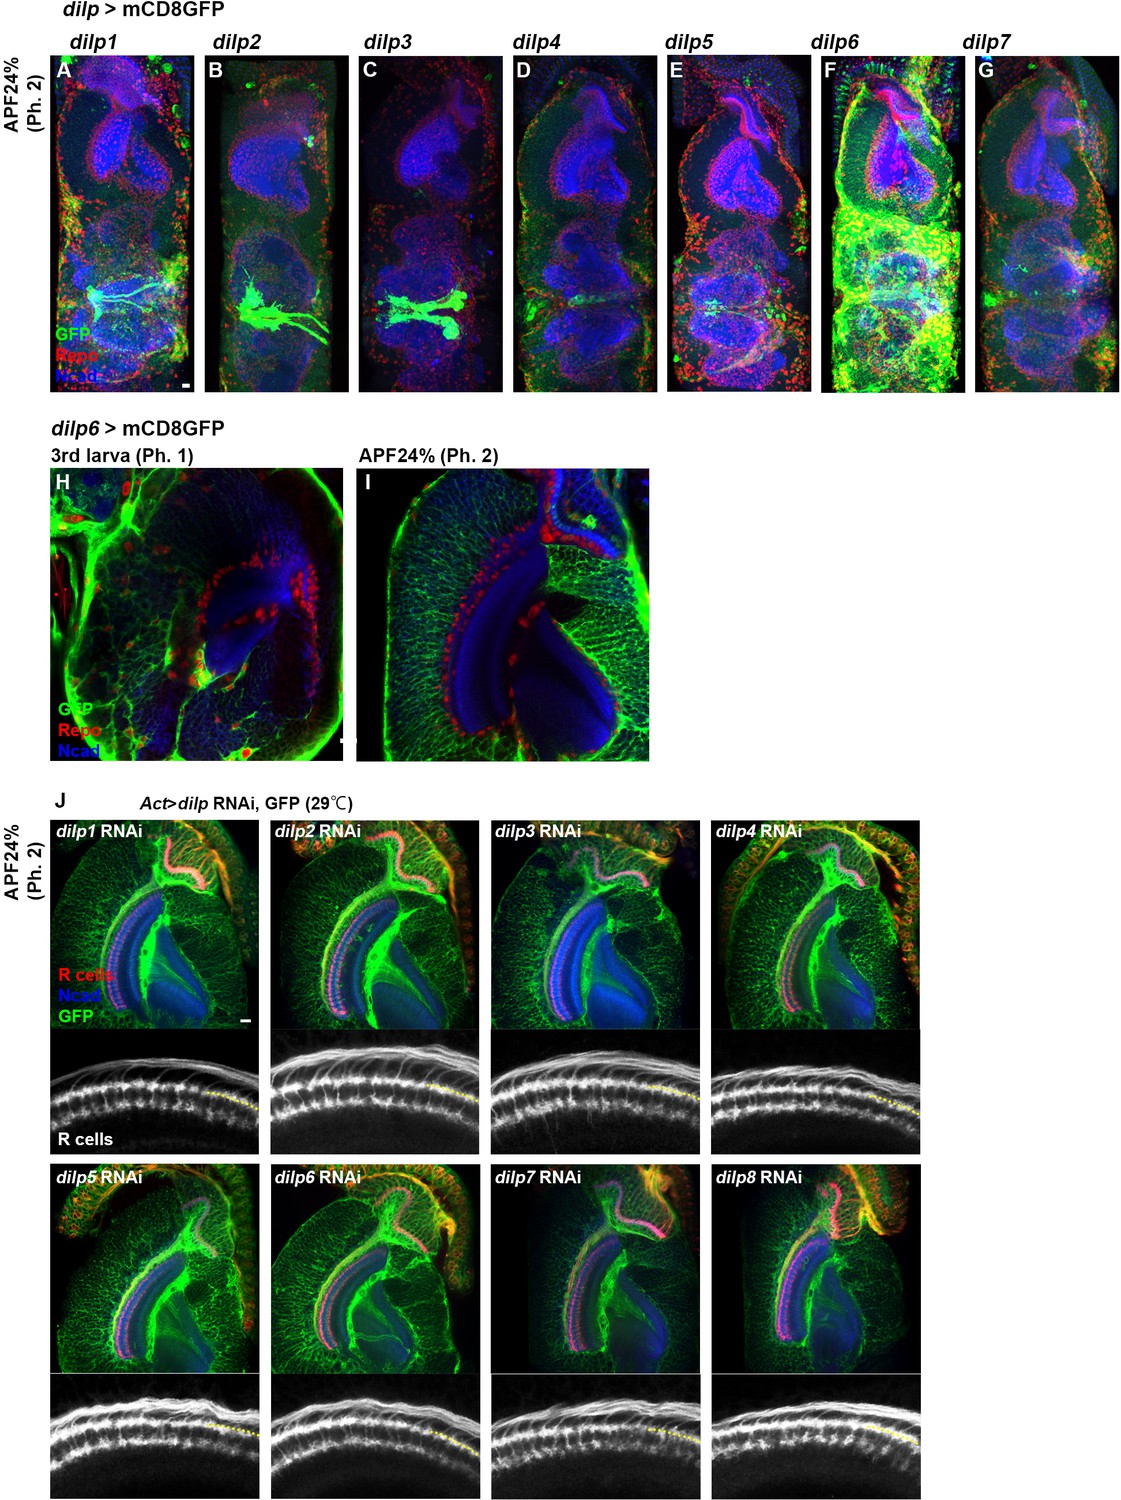
Related to Figure 6 dilp genes expression pattern in optic lobe.
(A–I) dilp gene expression was monitored by dilp-Gal4, UAS-mCD8GFP (green) and counterstained with anti-Repo (red) and anti-N-cadherin (blue). dilp1, 2, 3, five are strongly expressed in insulin-producing cells (IPCs) (A–C and E). dilp6, dilp4 and dilp7 were broadly expressed in glial cells (D, F and G), especially dilp6 is strongly expressed in cortex and surface glia in the optic lobe (F, H and I). As entire structure of the brain changes from third instar larvae (phase 1) to APF 24% (phase 2), the position of the glial cells also changes. Cortex glia does not cover medulla neuropil in the phase 1 (H), but does in the phase 2 (I). (J) dilp genes were knocked down in the whole animal using Act-Gal4, UAS-dilp RNAi. tub-Gal80ts was used to eliminate the effect of dilp mutation of phase 1, because dilp knockdown animals in third larval stage were lethal. RNAi positive cells were labeled with UAS-mCD8GFP (green), and counterstained with mAb24B10 (red) and anti-N-cadherin (blue). None of the knockdowns of dilp1-8 showed R8 axon phenotype. Scale bars 10 μm.
Figure 7 with 2 supplements
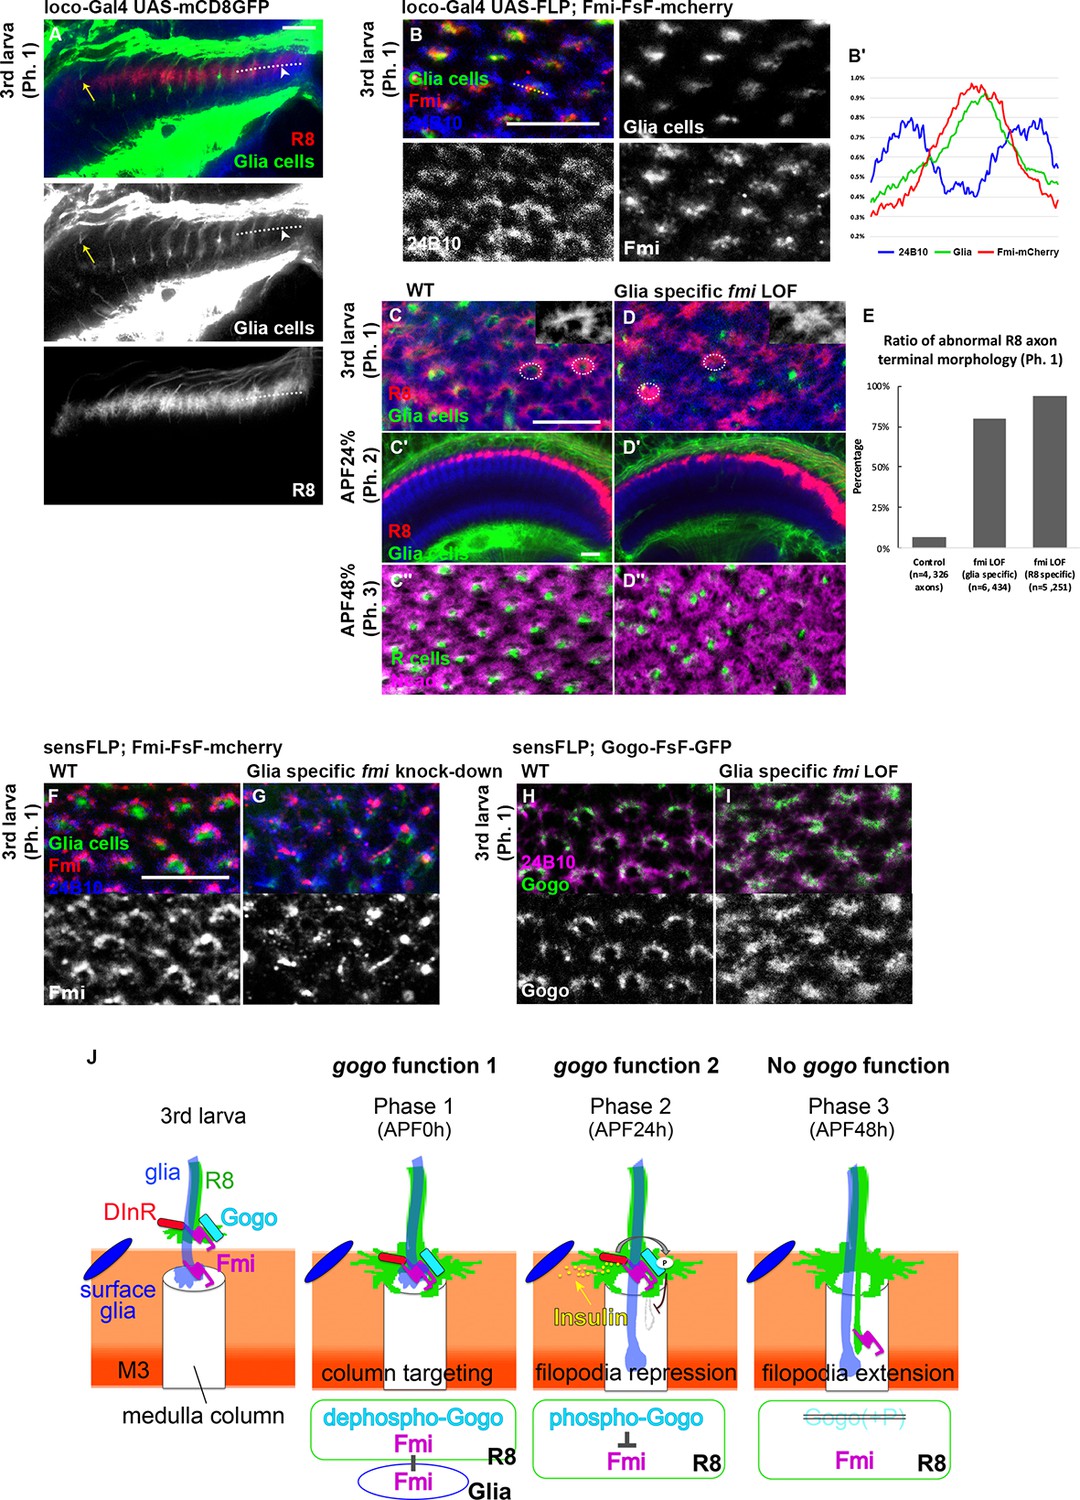
Glial Fmi and R8 Gogo/Fmi instruct R8 to recognize the columnar center.
(A) R8 axon terminals visualized with myr-tdTomato (red, white) and glial cells visualized with mCD8GFP (green) and counterstained with anti-N-cadherin (blue) in phase 1 (third instar larva). The glial protrusion extended into the medulla layers as early as the R8 growth cone enters (arrowhead). In the oldest column, the glial protrusions have begun to retract (yellow arrow). (B) Fmi protein localization at the terminals of glial cells (red) was visualized by Fmi-FsF-mCherry and glial-specific FLPase (loco-Gal4 UAS-FLP) co-labeled with glial-specific mCD8GFP (green) and mAb24B10 for all R axons (blue) in phase 1 (third instar larva). The fluorescence intensity of Fmi-mCherry (red), glial-specific mCD8GFP (green), and stained R axons (blue) was measured across the column (dotted lines) and the average of eight axons (n = 3 animals) was shown in the graph (B’). (C–E) Medulla of the wild type (C) and glial-specific fmi loss-of-function (fmi heterozygote with glial cell-specific RNAi [loco-Gal4, UAS-RNAi, at 29℃]) (D) at each phase (third instar larvae, APF24%, 48%). Labeling is the same as in (A). The medulla columnar pattern is labeled with N-cadherin (magenta) and R axons with mAb24B10 (green). In glial-specific fmi loss-of-function, R8 axon terminals intruded into the medulla columnar center and failed to form a proper horseshoe shape during phase 1 (D), but no bundling was observed during phase 2 (D’). The columnar array was disrupted at APF48% (phase 3) (D’’). (E) Quantification of the R8 axon terminals that intruded into the medulla columnar center and failed to form a proper horseshoe shape at phase 1 (third instar larva). (F, G) The protrusions of glial cells (green) in medulla neuropils and Fmi-mCherry (red) in R8 cells were visualized in phase 1 (third instar larva). R axons were labeled with mAb24B10 (blue). (H, I) Localization of R8 specific Gogo-GFP (green) in glia-specific fmi loss-of-function. R axons are labeled with mAb24B10 (magenta) in phase 1 (third instar larva). (J) Model for the interaction between dual-function Gogo and Fmi to navigate R8 axons. In phase 1, non-phosphorylated Gogo/Fmi at R8 termini interact in trans with Fmi localized on the glial surface to correctly recognize the medulla columnar center (gogo function 1). In phase 2, Gogo is phosphorylated dependent on insulin signaling derived from surface and cortex glia. Phospho-Gogo antagonizes Fmi, thereby suppressing filopodia extension (gogo function 2). In phase 3, Fmi alone brings the R8 axon to the M3 layer, since Gogo protein is no longer expressed in R8 axons by this phase (no gogo function). Scale bars 10 μm.
-
Figure 7—source data 1
Source data for the quantification in Figure 7E.
- https://cdn.elifesciences.org/articles/66718/elife-66718-fig7-data1-v2.xlsx
Figure 7—figure supplement 1
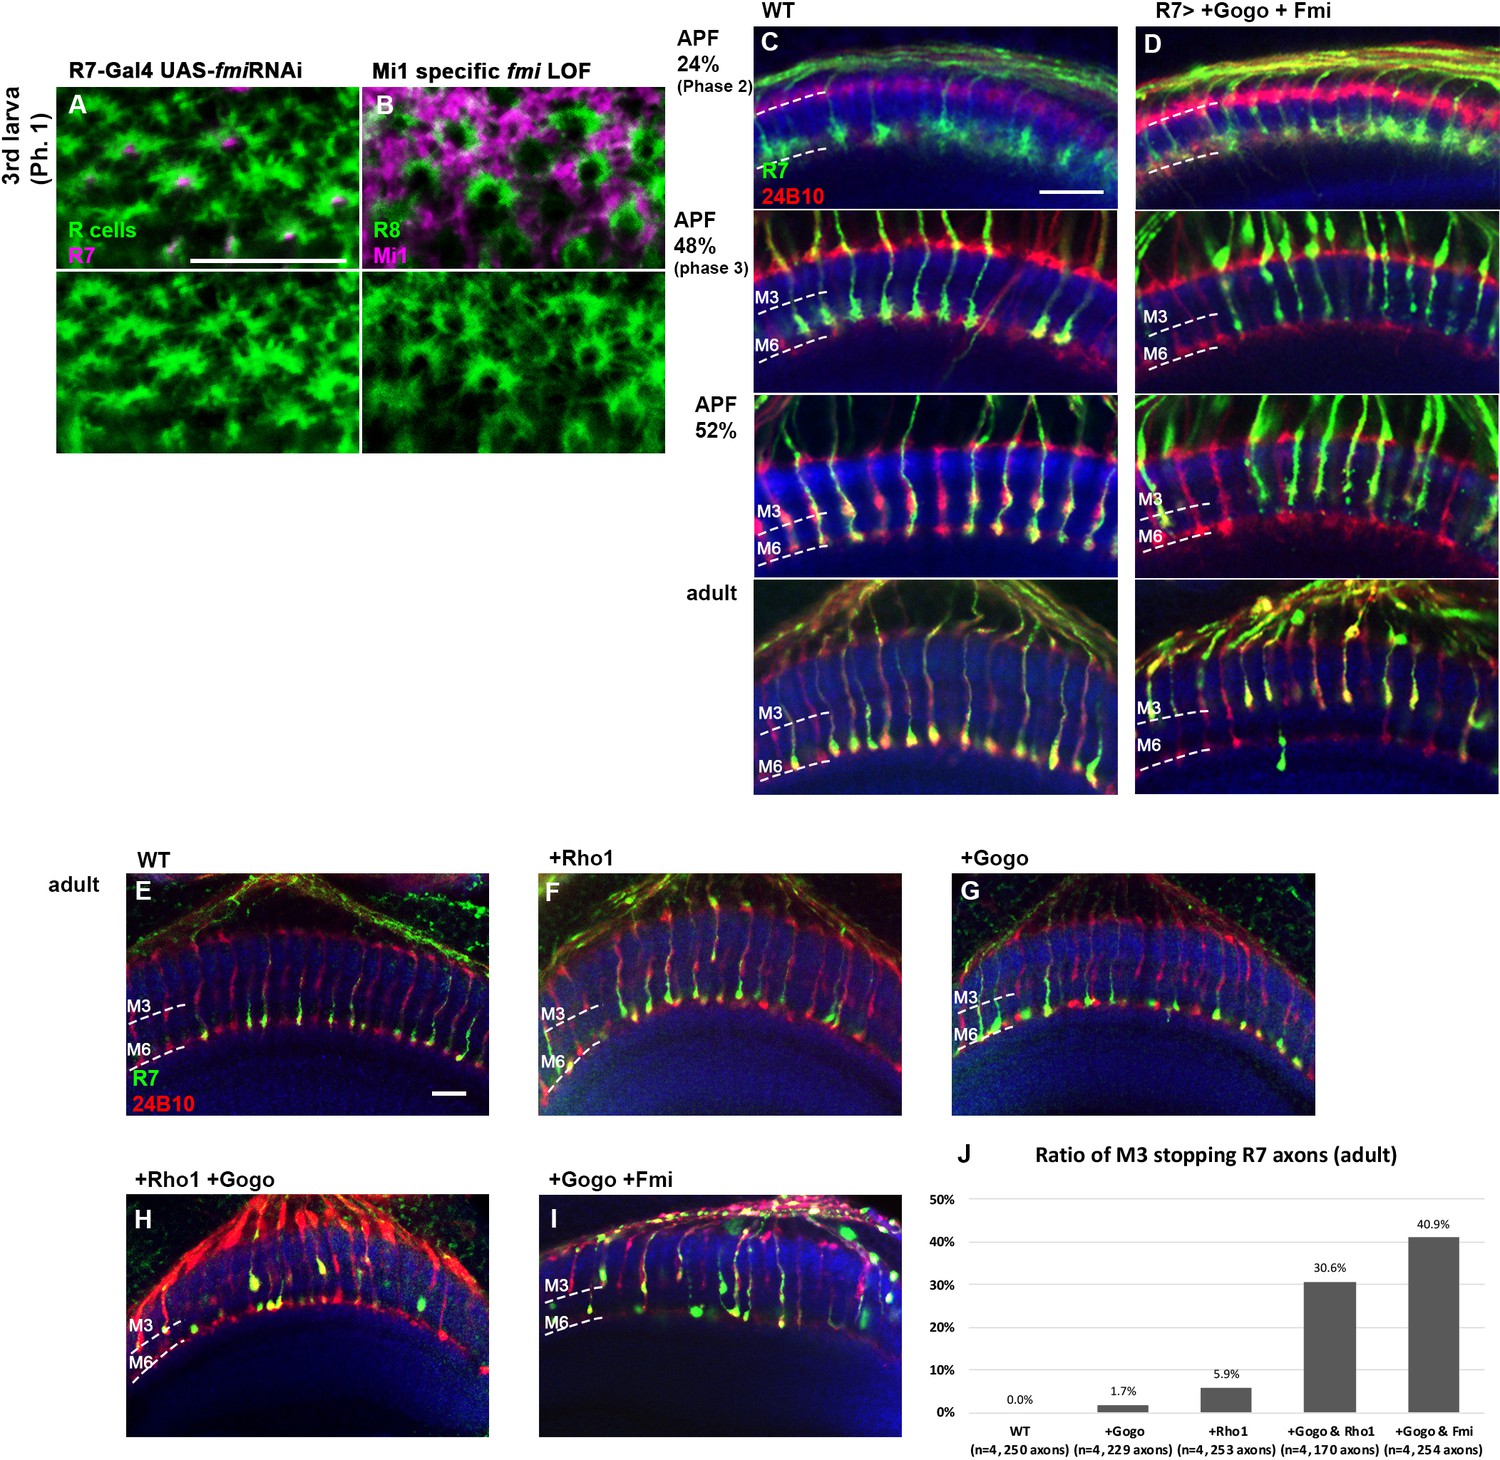
Gogo and Fmi interact with Fmi to regulate cytoskeletal reorganization.
(A) In the phase 1, R7 neurons that are known to be the first core members of the medulla column formation were labeled with 20C11FLP, GMR-FsF-Gal4, UAS-mCD8GFP (magenta), and R axons with 24B10 (green). R7-specific fmi knockdown did not show any notable defect in overall R8 axon targeting or morphology of the R8 axon termini. (B) Mi1 neurons labeled with bshM-Gal4, UAS-mCD8GFP (magenta) and R8 axons with myrTomato (green). In Mi1-specific fmi loss-of-function (fmi heterozygote with Mi1 cells specific RNAi), no differences were seen in R8 axons from that of WT. (C–D) Gogo and Fmi were co-overexpressed in R axons using GMR-Gal4 during pupal stage. R7 axons were visualized with mCD8GFP (green) and counterstained with mAb24B10 (red) and anti-N-cadherin (blue). In APF 24% (phase 2), R7 axons of co-overexpression reached the R7 temporary layer correctly. From APF 48% (phase 3) to 52%, collapsing growth cone and retracting R7 axons were observed. Almost all the R7 axons retracted and stopped at M3 layer in adult. (E–J) The R7 axons of control (E) and overexpression using GMR-Gal4, UAS-gogo, and/or GMR-Rho1 were visualized with Rh4-GFP (green) and counterstained with mAb24B10 (red) and anti-N-cadherin (blue). R7 axons targeted normally when Rho1 (F) or Gogo (G) were overexpressed alone. Co-overexpression of Gogo and Rho1 caused R7 photoreceptor mistargeting to the M3 layer (H), similar to co-overexpression of Gogo and Fmi (I). (J) Quantification of the R7 photoreceptor axon mistargeting to M3 layer. Scale bars 10 μm.
-
Figure 7—figure supplement 1—source data 1
Source data for the quantification in Figure 7—figure supplement 1J.
- https://cdn.elifesciences.org/articles/66718/elife-66718-fig7-figsupp1-data1-v2.xlsx
Figure 7—figure supplement 2
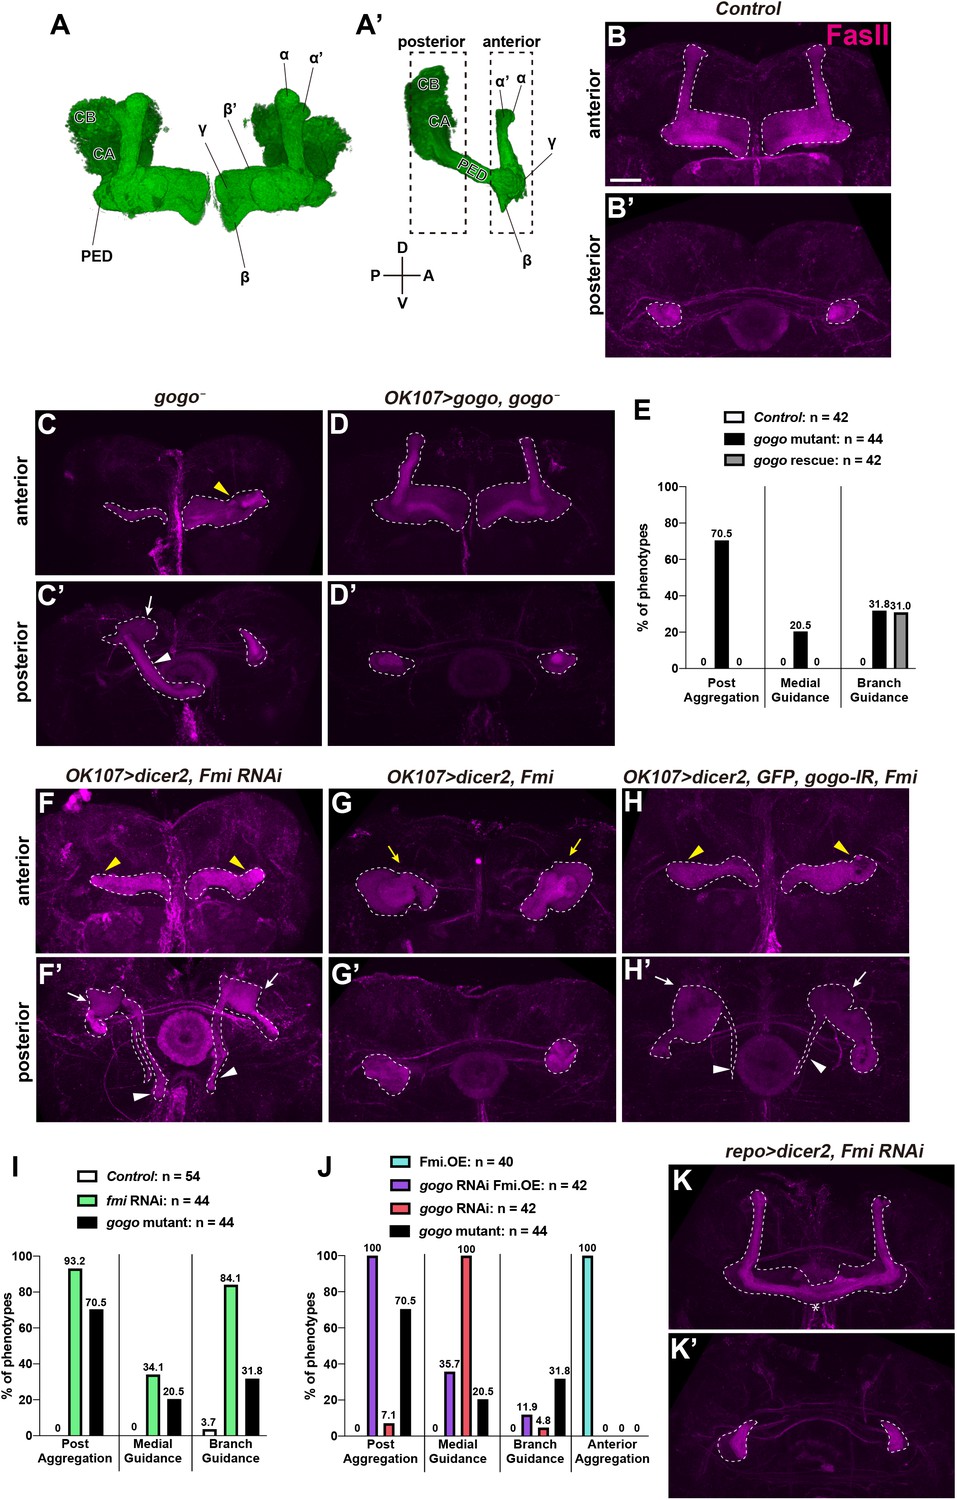
Genetic interaction between gogo and fmi in mushroom body.
(A–A’) Structure of mushroom bodies (MBs) in adult. PED, CA, and CB denote peduncle, calyx, and cell bodies, respectively. Dashed line rectangles in (A’) indicate the anterior region and posterior region in following figures. (B–E) Representative images showing the MBs of the control (B), gogo mutant (C), and gogo mutant expressing the MB-specific full-length gogo (D). γ and α/β lobes were visualized by anti-FasII (magenta). The dashed line in (B–D) demarcates MBs. gogo mutant flies displayed axonal branch guidance defects of α/β lobes (yellow arrowhead in C), lobe aggregation in posterior side (white arrow in C’), and misguidance toward the medial side directly from calyx (white arrowhead in C’). MB lobe phenotypes were quantified in E. MB-specific full-length gogo rescued axonal phenotypes except for branch guidance defects. (F–J) Representative images of MBs of OK107-Gal4xUAS-FmiRNAi (F), OK107-Gal4xUAS-Fmi (G), and repo-Gal4xUAS-FmiRNAi (H). γ and α/β lobes were visualized by anti-FasII (magenta). The dashed line demarcates MBs. MB-specific knockdown of Fmi displayed branch guidance defects (yellow arrowhead in F), posterior aggregation (white arrow in F’), and misguidance toward the medial side (white arrowhead in F’). While MB-specific overexpression of Fmi caused the lobe aggregation in anterior side (yellow arrow in G), gogo knockdown in Fmi overexpression background showed three phenotypes (branch guidance defects: yellow arrowhead in H; posterior aggregation: white arrow in H’; misguidance toward the medial side: white arrowhead in H’) as well as gogo mutant. MB lobe phenotypes were quantified in I and J. (K) Glial-specific knockdown of Fmi displayed only the extension of β lobes (asterisk in K; n = 30). Scale bars 30 μm.
Additional files
-
Supplementary file 1
List of genotypes used.
- https://cdn.elifesciences.org/articles/66718/elife-66718-supp1-v2.docx
-
Supplementary file 2
oligo DNAs used for generating and analyzing transgenic flies.
- https://cdn.elifesciences.org/articles/66718/elife-66718-supp2-v2.docx
Download links
A two-part list of links to download the article, or parts of the article, in various formats.
Downloads (link to download the article as PDF)
Open citations (links to open the citations from this article in various online reference manager services)
Cite this article (links to download the citations from this article in formats compatible with various reference manager tools)
Glial insulin regulates cooperative or antagonistic Golden goal/Flamingo interactions during photoreceptor axon guidance
eLife 10:e66718.
https://doi.org/10.7554/eLife.66718


