Repression by the Arabidopsis TOPLESS corepressor requires association with the core mediator complex
- Department of Biology, University of Washington, United States
- Department of Pharmacology, United States
- Howard Hughes Medical Institute, University of Washington, United States
Figures
Figure 1 with 1 supplement

The N-terminal domain of TPL contains two independent repression domains.
(A) Schematic of the ARCSc. The auxin-responsive promoter driving the fluorescent protein Venus carries binding sites for the auxin-responsive transcription factor (ARF). In the absence of auxin, the IAA-TPL-N fusion protein is bound to the ARF and maintains the circuit in a repressed state. Upon addition of auxin, the IAA-TPL protein is targeted for ubiquitination and subsequent protein degradation, activating transcription of the fluorescent reporter. (B) TPL domains are LisH (LIS1 homology motif, blue), CTLH (C-terminal LisH motif, orange), CRA (CT11-RanBPM; red, dimerization; green, foldback), and two WD40, beta-propeller motifs (purple). N-terminal domains are indicated on the solved structure of the first 202 amino acids (Martin-Arevalillo et al., 2017, 5NQS). The termini of the TPLN100 truncation used in the original ARCSc studies is indicated. (C) Diagram indicating the structure of constructs analyzed in experiments shown in subsequent panels. For constructs with identical behavior (H1-H3, H1-H5, H1-H6, H1-H7), we included only a representative member (H1-H7) for simplicity. Repression Index (Rep.) is a scaled measure of repression strength with 0 set to the level of repression observed with IAA3 and 10 set to the level of repression by TPLN188. Auxin induction level (Aux. ind.) indicates the fold change difference between reporter expression before auxin addition (time zero) and at the end of an experiment (~500 min). (D-F) Helix 1 and the CRA domain (Helix 3–Helix 8) can act independently to repress transcription. Each panel represents two independent time-course flow cytometry experiments of the TPL helices indicated, all fused to IAA3. Every point represents the average fluorescence of 5–10,000 individually measured yeast cells (a.u.: arbitrary units). Auxin (IAA-10 µM) was added at the indicated time (gray bar, +Aux).
Figure 1—figure supplement 1
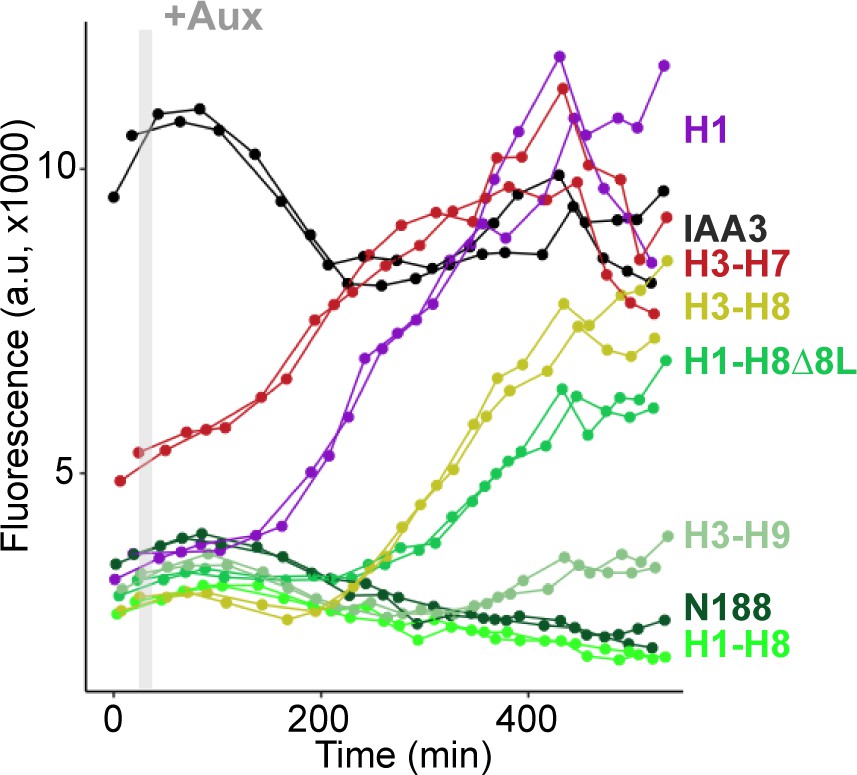
Helix 1 and the CRA domain (Helix 3-Helix 8) can act independently to repress transcription.
Each color represents two independent time-course flow cytometry experiments of the TPL helices indicated, all fused to IAA3 or IAA3 alone (black line). Every point represents the average fluorescence of 5–10,000 individually measured yeast cells (a.u.: arbitrary units). Auxin (IAA-10 µM) was added at the indicated time (gray bar, +Aux).
Figure 2 with 2 supplements
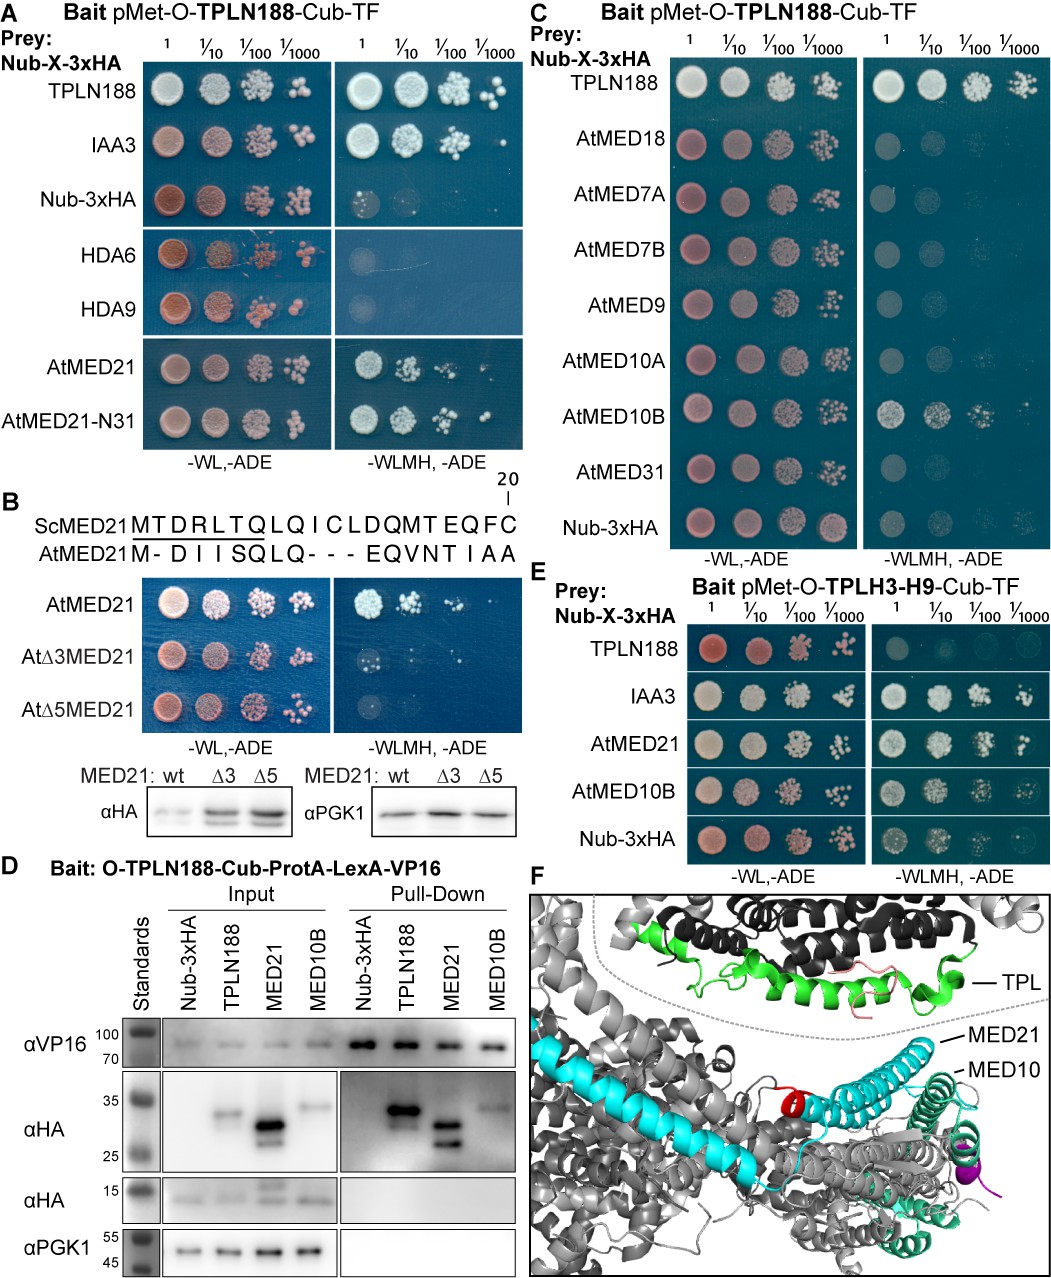
The Helix 8 repression domain of TPL directly interacts with AtMED21 and AtMED10B.
(A–C, E) Cytoplasmic split-ubiquitin system (CytoSUS) assays with candidate interacting proteins. Nub-3xHA is the N-terminal fragment of ubiquitin expressed with no fusion protein and is used as a negative control. Each prey protein is from Arabidopsis. -WL, -ADE: dropout lacking Trp, Leu, and Ade (growth control); -WLMH, -ADE: dropout lacking Trp, Leu, His, Met, and Ade (selective media). The plating for each panel was performed at the same day, white lines are provided when plates were cropped for clarity. (B) Alignments of the Arabidopsis (At) and Saccharomyces (Sc) MED21 proteins are shown above cytoSUS assays with the same bait shown in (A). Western blots below the colonies indicated that AtMED21 N-terminal Δ3 and Δ5 are well expressed in assay conditions. (C) CytoSUS assays with selected Mediator proteins in the middle module. (D) The TPL-ProteinA-TF fusion protein can pull down TPL, AtMED21, and AtMED10B from yeast extracts using IgG-beads. Detection of the VP16 transcriptional activator demonstrates enrichment of the fusion protein (αVP16). Each prey protein is detected via the 3xHA tag (αHA), and efficacy of purification was judged by PGK1 depletion (αPGK1). (E) A TPL-N truncation lacking the LisH domain (TPLH2-H9) could still interact with the AtMED21-N31 truncation. This bait construct interacted with IAA3, but only minimally with the negative control (free Nub-3xHA). (F) Yeast Mediator (bottom, 5N9J) and AtTPL (top, 5NQV) manually juxtaposed to compare relative domain sizes and feasibility of a TPL-MED21-MED10B interaction. TPL Helix 8–9 is colored green. MED21 is colored aqua, with the N-terminus colored red, and the IAA27 EAR peptide in orange. MED10 is colored teal, with the C-terminus colored purple. The dotted line indicates the border between TPL and Mediator structures.
Figure 2—figure supplement 1
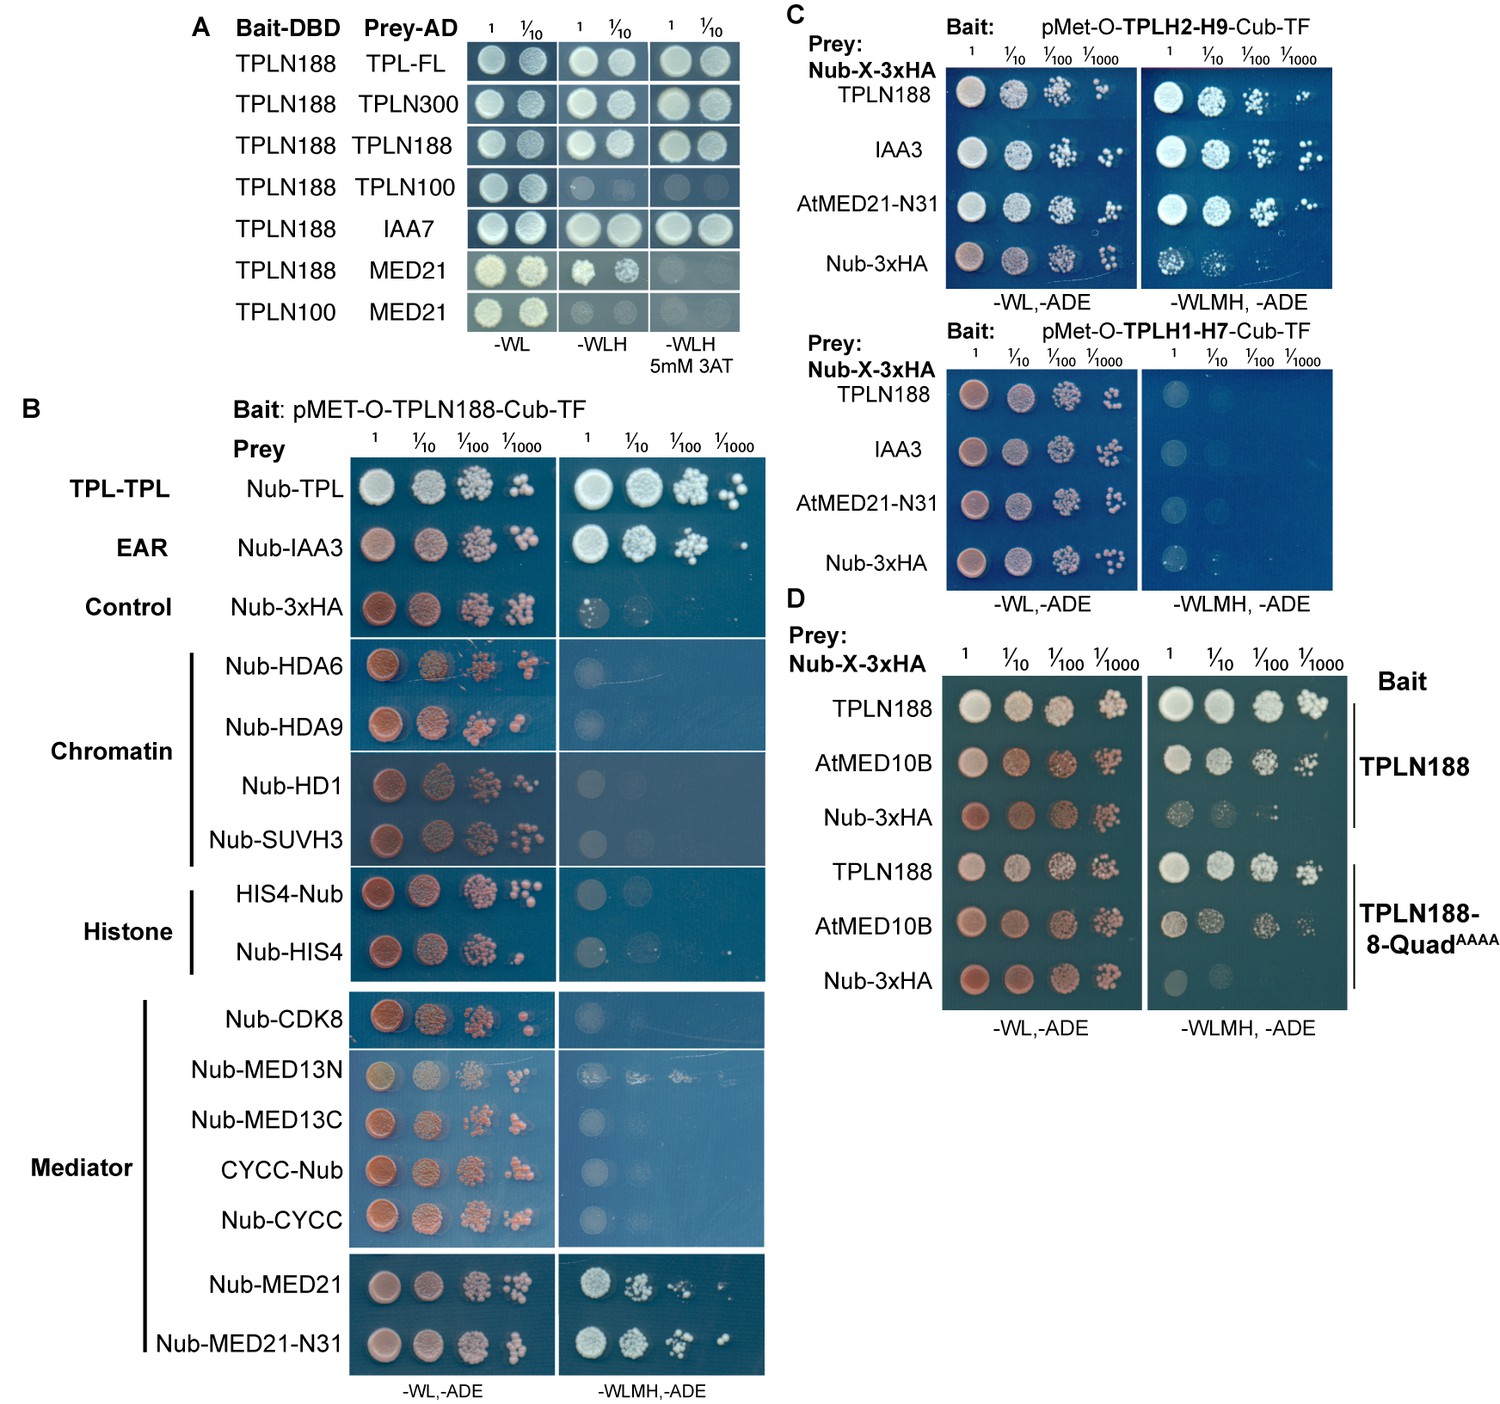
The TPL-N terminal domain (TPLN188) interacts with the N-terminus of AtMED21.
(A) Identifying TPL-N terminal domain interactor proteins through yeast two hybrid screening identifies TPL as a problematic bait protein as it may silence the activation despite successful binding of a prey protein (see second row from bottom where N188 and MED21 show very weak reporter activity on 3AT). 3AT: 3-amino-1,2,4-triazole. Plates were measured after 3 days to allow TPL-MED21 interactions to grow. (B) Identifying TPL-N terminal domain interactor proteins through cytoplasmic split ubiquitin protein interaction assay. We tested the N-terminal and C-terminal portions of MED13 separately and divided the coding sequence at amino acid 967 (MED13N = aa1-967, MED13C = aa968-1908). Each bait tested is the Arabidopsis homolog cloned from cDNA from the Col-0 accession, with the exception of AtMED13, which was synthesized de novo via Twist (https://www.twistbioscience.com/). Plates were scanned at 3 days after plating to allow weaker interactions to develop if they were present. (C) TPL interacts with MED21 through an interaction within Helices 8–9. Plates were scanned at 2 days after plating. (D) The Helix 8 Quadruple mutation (V145A, E146A, K148A, K149A) does not affect AtMED10B binding to TPL. Plates were scanned at 3 days after plating. (B–D) The relative position of the N-terminal portion of ubiquitin (Nub) is indicated for each bait protein.
Figure 2—figure supplement 2
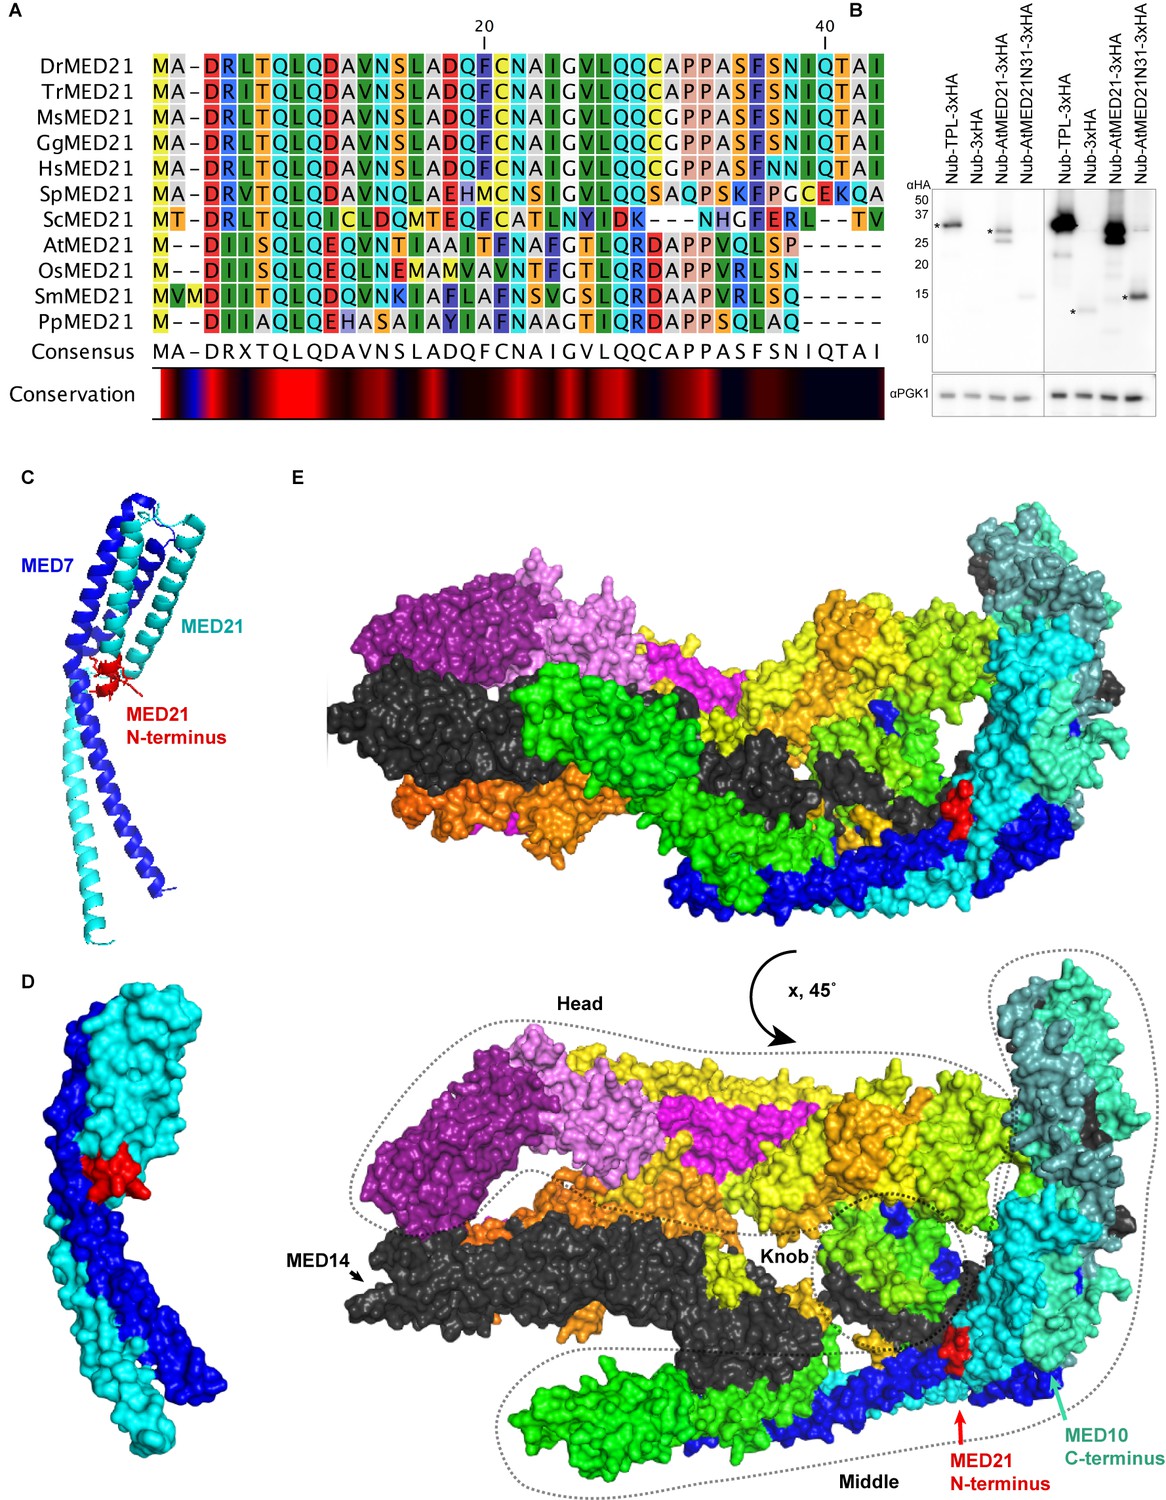
Homology and structure of the MED21 subunit of the Mediator complex.
(A) Protein alignment of selected MED21 homologs from various species. Dr: Drosophila melanogaster; Tr: Takifugu rubripes; Ms: Mus musculus; Gg: Gallus gallus; Hs: Homo sapiens; Sp: Strongylocentrotus purpuratus; Sc: Saccharomyces cerevisiae; At: Arabidopsis thaliana; Os: Oryza sativa; Sm: Selaginella moellendorffii; Pp: Physcomitrella patens. Alignment was performed in CLC sequence viewer 7 using a neighbor joining method. (B) Protein levels of AtMED21 cytoplasmic split-ubiquitin system (cytoSUS) constructs in yeast. Two different exposure times are shown to demonstrate the lower abundance of the truncation with only the first 31 amino acids of the AtMED21 (N31). Asterisks indicate the size predicted for the indicated protein. (C, D) Structure of the MED21 (cyan) and MED7 (blue) hetero dimer, adapted from 1YKH (Baumli et al., 2005). The amino acids in the N-terminus that were solved are highlighted in red up to the 7th amino acid of the yeast MED21. (C) The cartoon visualization (D) Surface visualization. (E) Core mediator (5N9J, Nozawa et al., 2017) with the location of MED21 and MED7 indicated with the same colors from (C, D). In this structure, the location of the MED21 N-terminus is again indicated in red, demonstrating its close proximity to the Knob region (dotted circle).
Figure 3
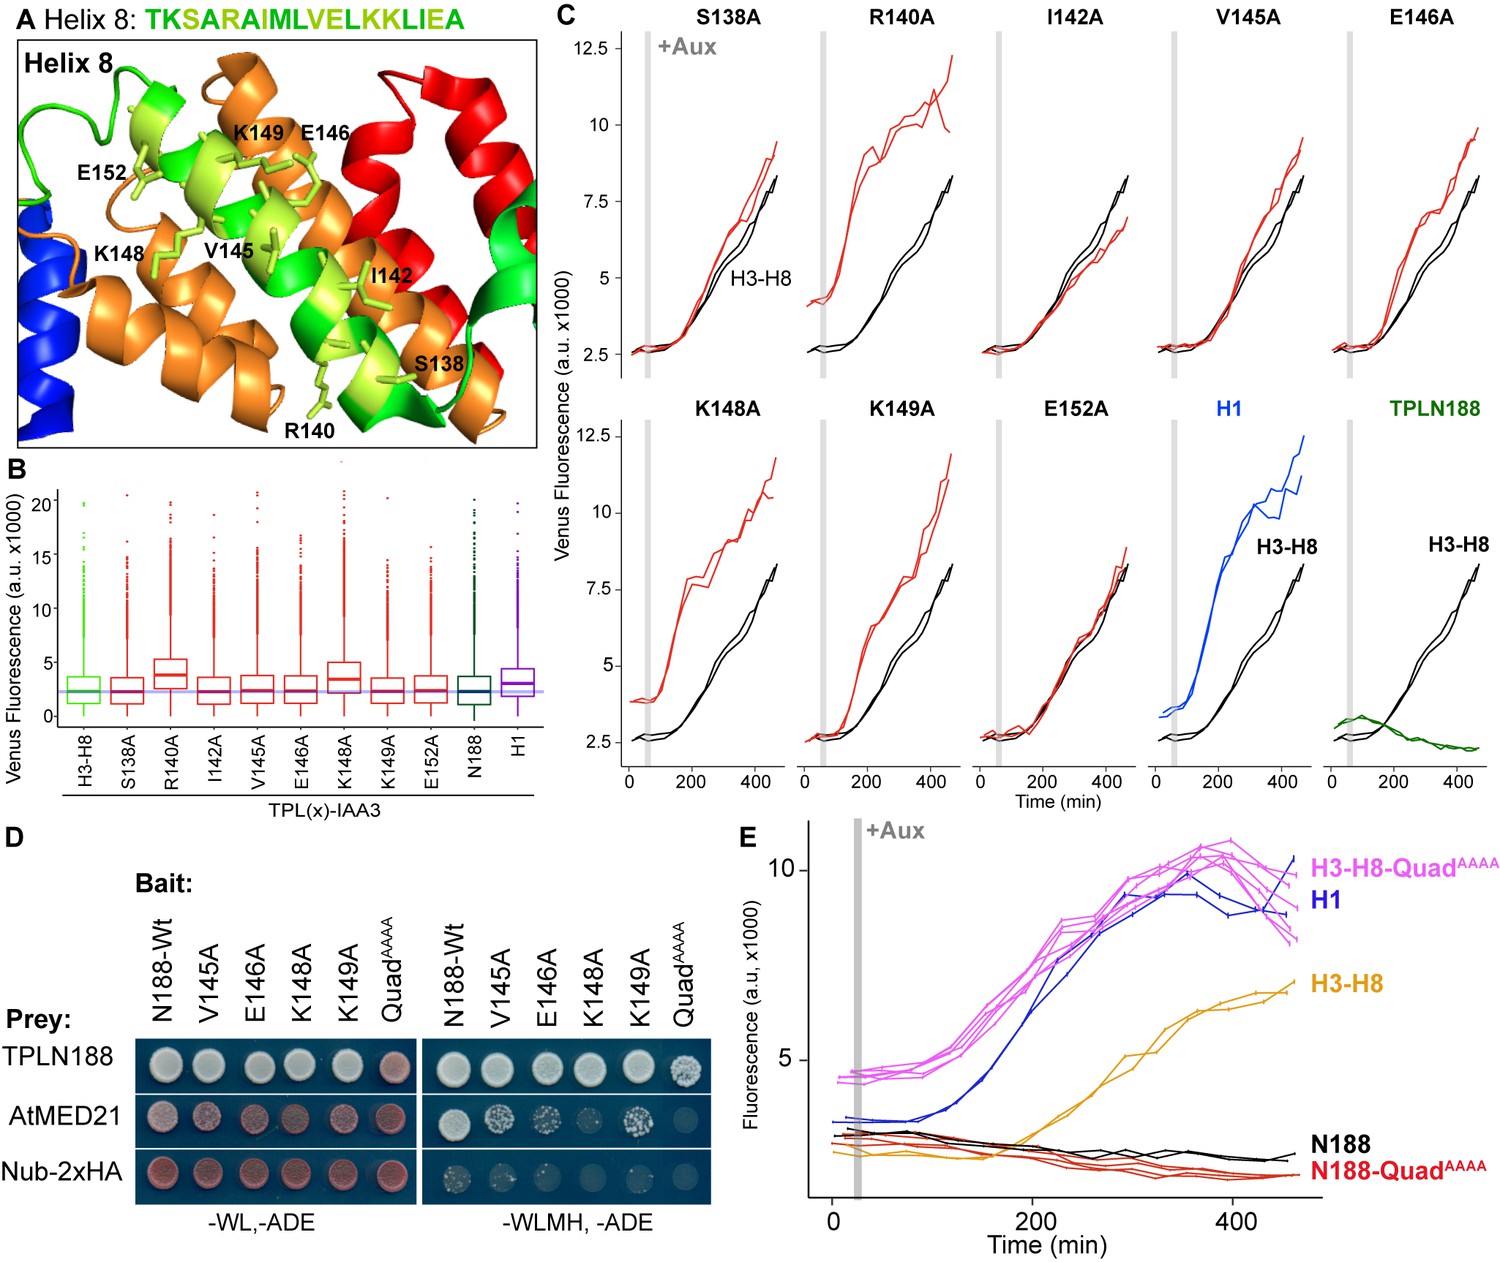
Identification of critical residues within Helix 8 repression domain.
(A) Sequence and structure of Helix 8 (5NQS). Helix 8 is colored green, and amino acids chosen for mutation are highlighted in light green in both the sequence and the structure. (B) Repression activity of indicated single- and double-alanine mutations. (C) Time-course flow cytometry of selected mutations of Helix 8 following auxin addition. TPLH3-8-IAA3 fusion proteins (black) were compared to indicated single mutations to alanine (red). Controls: Helix 1 (H1 – blue) and TPLN188 (dark green). (D) A series of alanine mutations (V145A, E146A, K148A, K149A, and the quadruple mutant QuadAAAA chosen from A–C) were introduced into the TPLN188 bait construct and tested for interaction with wild-type TPLN188, AtMED21, and controls. Each single-alanine mutation reduces TPL interaction with AtMED21, while the quad mutation abrogated interaction. (E) The Helix 8 QuadAAAA mutation was introduced into the TPLN188-IAA3 and TPLH3-8-IAA3 fusion proteins and compared to wild-type N188 in time-course flow cytometry. For all cytometry experiments, the indicated TPL construct is fused to IAA3. Every point represents the average fluorescence of 5–10,000 individually measured yeast cells (a.u.: arbitrary units). Auxin (IAA-10 µM) was added at the indicated time (gray bar, +Aux). At least two independent experiments are shown for each construct.
Figure 4 with 4 supplements
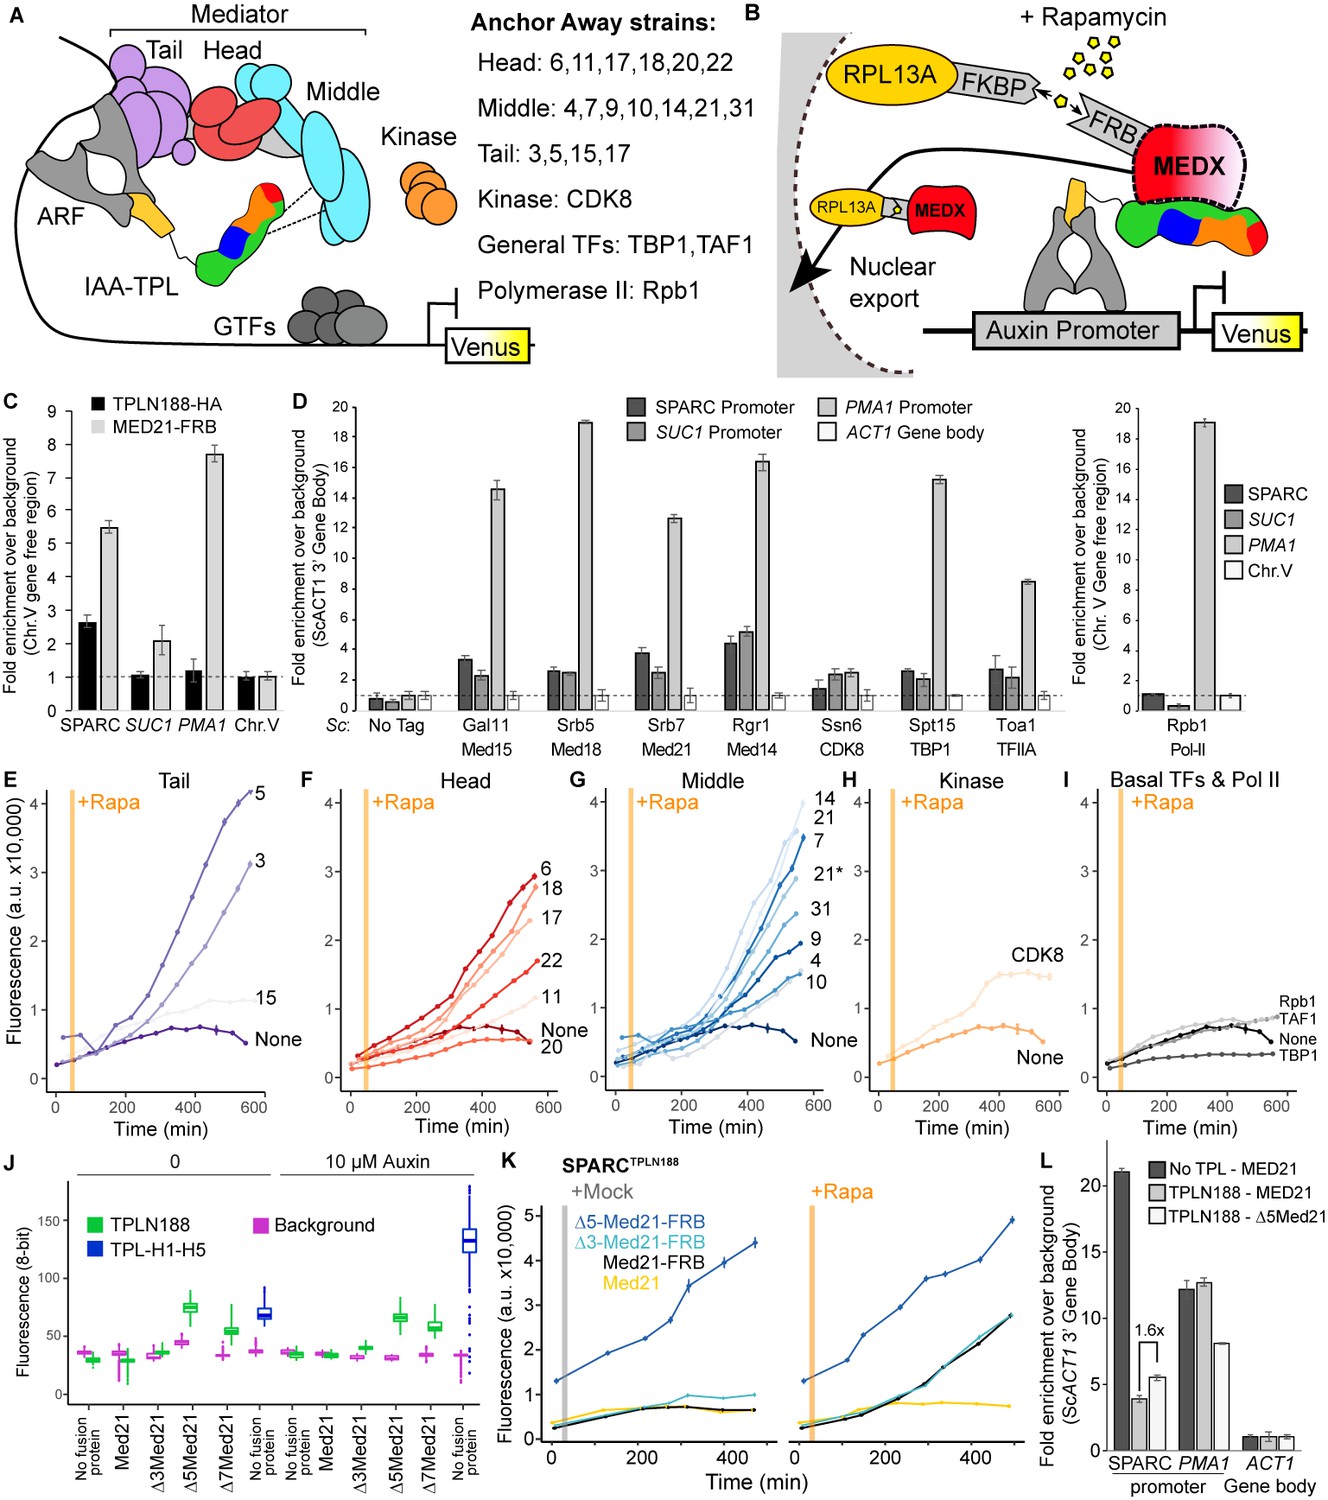
Repression by TPL requires interaction with the N-terminus of MED21 at promoters.
(A) Model of the proposed interaction between the TPL N-terminus with Mediator, where TPL interaction with Mediator 21 and 10 inhibits the recruitment of Pol II. Proteins in this complex that were tested by Anchor Away are listed on the right. (B) Schematic of AtARCSc combined with methods for inducible expression and nuclear depletion of MED21. In Anchor Away, the yeast ribosomal protein 13A (RPL13A) is fused to the rapamycin-binding protein FKBP. Addition of rapamycin induces dimerization between FKBP and any target protein fused to 2xFRB, resulting in removal of the target protein from the nucleus. For these experiments, AtARCSc was assembled into a single plasmid (SPARC) rather than being integrated into separate genomic loci (Figure 4—figure supplement 1). (C) 2xHA-TPLN188-IAA3 and MED21-FRB association with the ARC and the ScSUC2 and ScPMA1 promoters. ChIP was performed with αHA and αFRB before qPCR was used to quantify enrichment at specified loci. (D) Association of FRB-tagged components of Mediator and the transcriptional machinery with the SPARC plasmid and the ScSUC2 promoters. ChIP was performed with αFRB, and qPCR was used to quantify enrichment at specified loci. (E–I) Time-course flow cytometry analysis of SPARCN188 in Mediator Anchor Away yeast strains with rapamycin (orange bar, +Rapa). Two Med21 strains were compared in the Middle domain (E), 21 (generated in this study) and 21* (generated in Petrenko et al., 2017). Both 21 and 21* demonstrated similar increases in reporter expression. (J) Quantification of Venus fluorescence from SPARCN188 in wild-type and N-terminal ScMed21 deletions with and without auxin. The x-axis indicates strain and which FRB fusion protein is being tested. Yeast was grown for 48 hr on synthetic drop out (SDO) media with or without auxin, and colony fluorescence was quantified and plotted with the auxin-responsive SPARCH1-H5 in wild type as a reference. Background: red autofluorescence was used as a reference for total cell density. (K) Time-course flow cytometry analysis of SPARCN188 in wild-type and N-terminal ScMed21 deletions with and without rapamycin. Genotypes are indicated in the colored key inset into the graph. For (E–I, K) a.u.: arbitrary units. Rapamycin was added at the indicated time (orange bar, +Rapa). Every point represents the average fluorescence of 5–10,000 individually measured yeast cells. (L) Association of MED21-FRB or Δ5-MED21-FRB with SPARC plasmids. ChIP was performed with αFRB, and qPCR was used to quantify enrichment at specified loci. (C, D, L) A region of the ACT1 gene body or a gene-free region of chromosome V (Chr.V) was arbitrarily defined as background, and data is presented as fold enrichment over the control gene. Averages and standard errors of four replicates are shown.
Figure 4—figure supplement 1
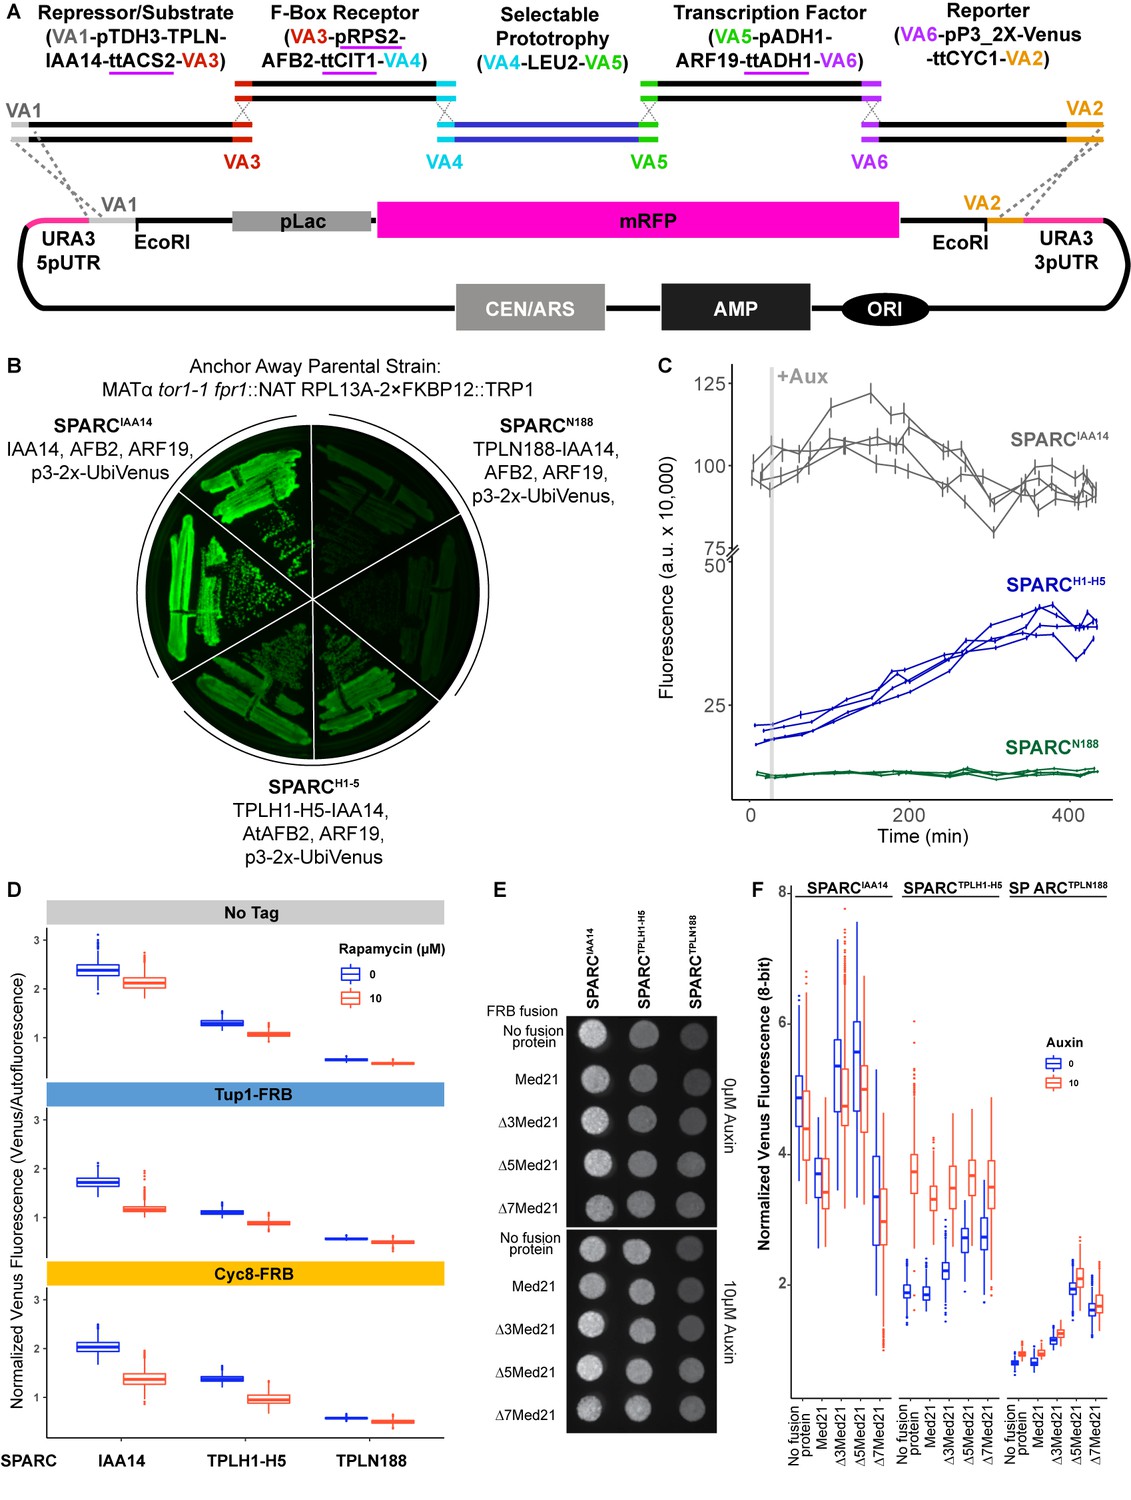
Construction and characterization of the single locus auxin response circuit (SPARC).
(A) Design schematic of the approach utilized to create the SPARC through a Versatile Genetic Assembly System (VEGAS) assembly approach. Each individual transcriptional unit (TU) was checked to replace promoters or terminators that utilized identical sequences and replaced with an alternative sequence indicated by a purple underline. These TUs were assembled into level 1 plasmids by Golden Gate reaction. Subsequently, they were amplified by PCR using primers specific for the VEGAS Adaptor (VA) sequences specific for their TU cassette. For example, for the first repressor/substrate TU the TU was amplified using primers for VA1 and VA3 and purified by a PCR cleanup column (NEB). The acceptor plasmid was cut with EcoRI, and both TU and acceptor plasmid were transformed into yeast and recombinant plasmids were selected on synthetic drop out (SDO) plates lacking leucine. (B) Primary SPARC transformants were struck out onto fresh SDO -Leu and imaged for Venus expression, demonstrating varying levels of reporter expression that correlate with TPL repressor domains. Plasmid DNA was purified from these strains and sequenced to confirm the proper recombination of TU cassettes. (C) Time-course flow cytometry of SPARC strains following auxin addition. For all cytometry experiments, the indicated TPL construct is fused to IAA14 because this IAA works better in haploid yeast strains that IAA3. Every point represents the average fluorescence of 5–10,000 individually measured yeast cells (a.u.: arbitrary units). Auxin (IAA-10 µM) was added at the indicated time (gray bar, +Aux). Four independent experiments are shown for each construct. (D) The yeast TPL homolog Tup1 and its partner protein Cyc8 do not repress the SPARC. Quantified fluorescence from the SPARC introduced into Tup1 and Cyc8 Anchor Away lines demonstrates no increased fluorescence from the reporter upon depletion of Tup1 or Cyc8 from the nucleus. Anchor Away depletion of Tup1 or Cyc8 results in slower yeast growth. To normalize for this disparity in growth, Venus fluorescence was normalized to red autofluorescence, where each pixel was normalized to the corresponding red autofluorescence collected for that position and plotted as a boxplot. Two individual biological replicates (two separate experiments) were evaluated, and the data was pooled. (E, F) Med21 N terminal deletions are viable in Saccharomyces and demonstrate altered SPARC transcriptional states. (E) A representative grayscale image of fellow fluorescence of spot plates of yeast strains carrying SPARC plasmids in Med21 N-terminal deletions. Each is plated at an OD600 of 0.1 on SDO with or without auxin (10 µM IAA). (F) Venus fluorescence from (E) was normalized to red background (autofluorescence), where each pixel was normalized to the corresponding red autofluorescence collected for that position and plotted as a boxplot. Two individual biological replicates (two separate experiments) were evaluated, and the data was pooled and is presented as boxplots.
Figure 4—figure supplement 2
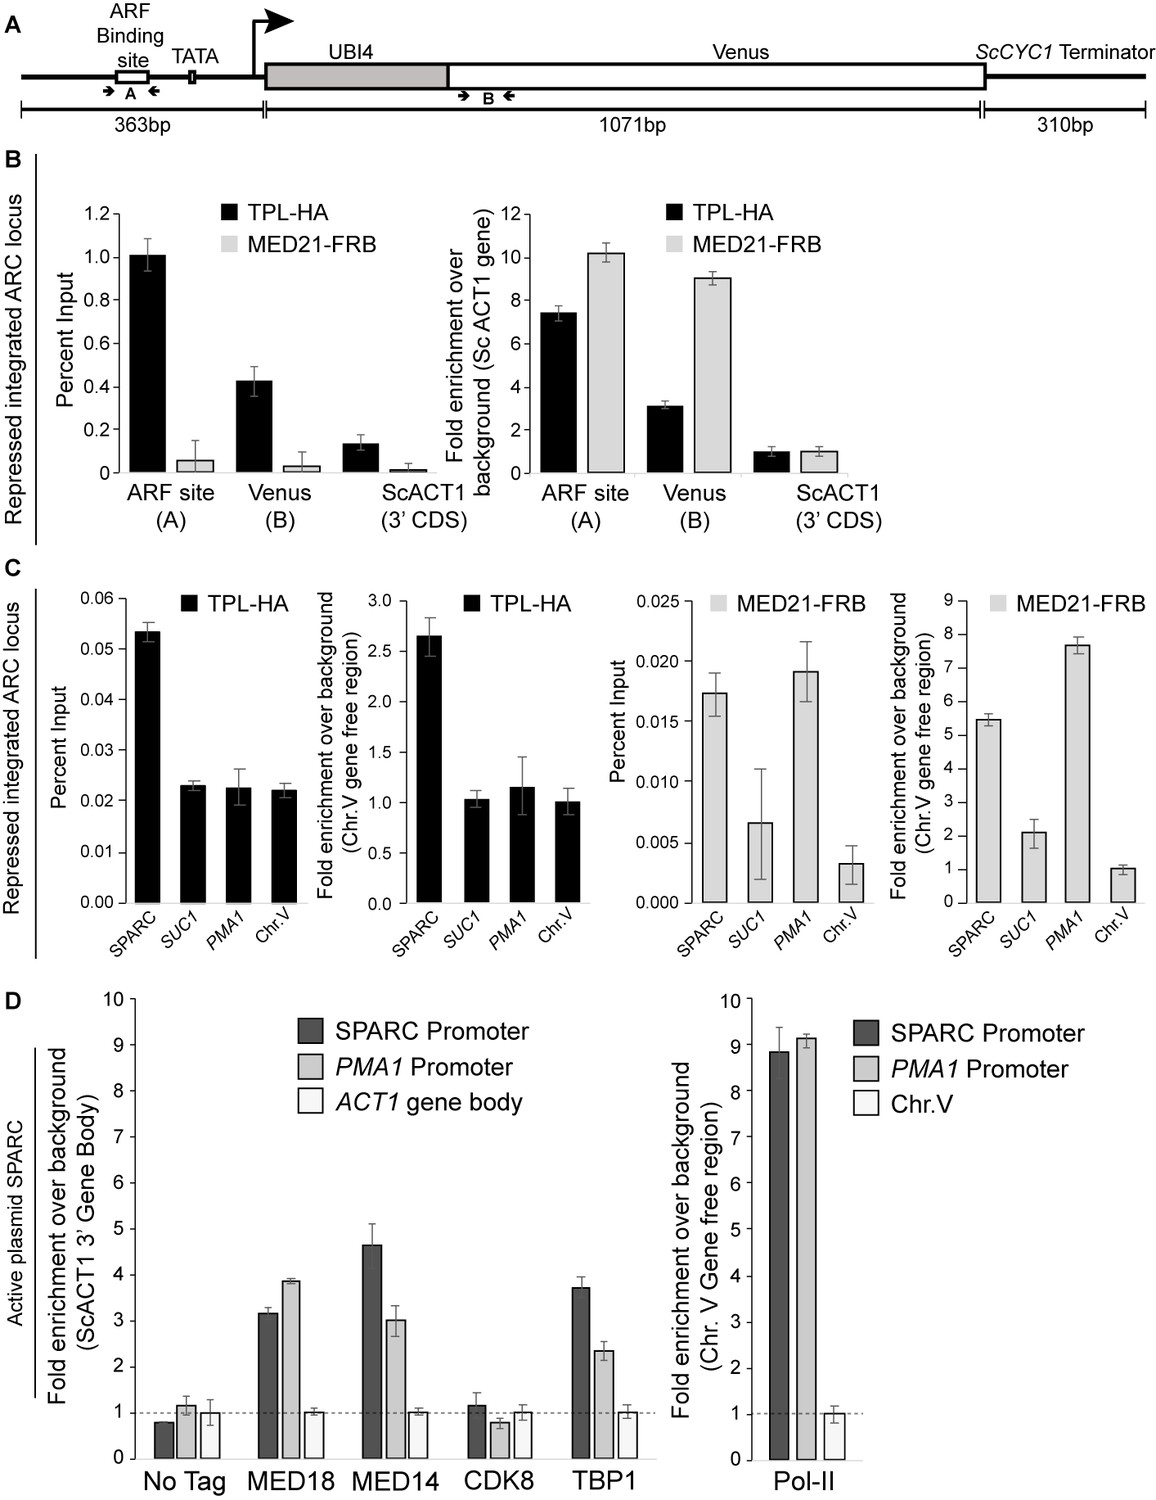
Mediator is detectable at the ARC promoter.
(A) Cartoon schematic of the ARC reporter. The primers flanking the ARF binding site (A) and Venus gene body (B) are highlighted. The B primer set is ~500 bp downstream of the A primer set. The position of the TATA box element is also shown. (B) The percent input and fold enrichment calculated from the percent input are shown from the integrated ARC locus that is repressed by TPLN188. These ChIPs highlight the wide fragment size (~500 bp) generated in our chromatin preparation protocol. (C) The optimization of two ChIP analyses for a positive control (PMA1, Mediator enriched) gene and a gene-free region on chromosome V (Chr.V), shown as both percent IP and as fold enrichment over background. ChIP was performed with αFRB or αHA, and qPCR was used to quantify enrichment at specified loci. (D) ChIP analysis of active (non-repressed) SPARC plasmids shows strong enrichment of mediator subunits MED18, MED14, and the TATA box binding protein TBP1, as well as a striking increase in RNA Pol II binding. ChIP was performed with αFRB, and qPCR was used to quantify enrichment at specified loci. A region of the ACT1 gene body or a gene-free region of chromosome V (Chr.V) was arbitrarily defined as background, and data is presented as fold enrichment over the control gene. (B–D) Averages and standard errors of four replicates are shown.
Figure 4—figure supplement 3
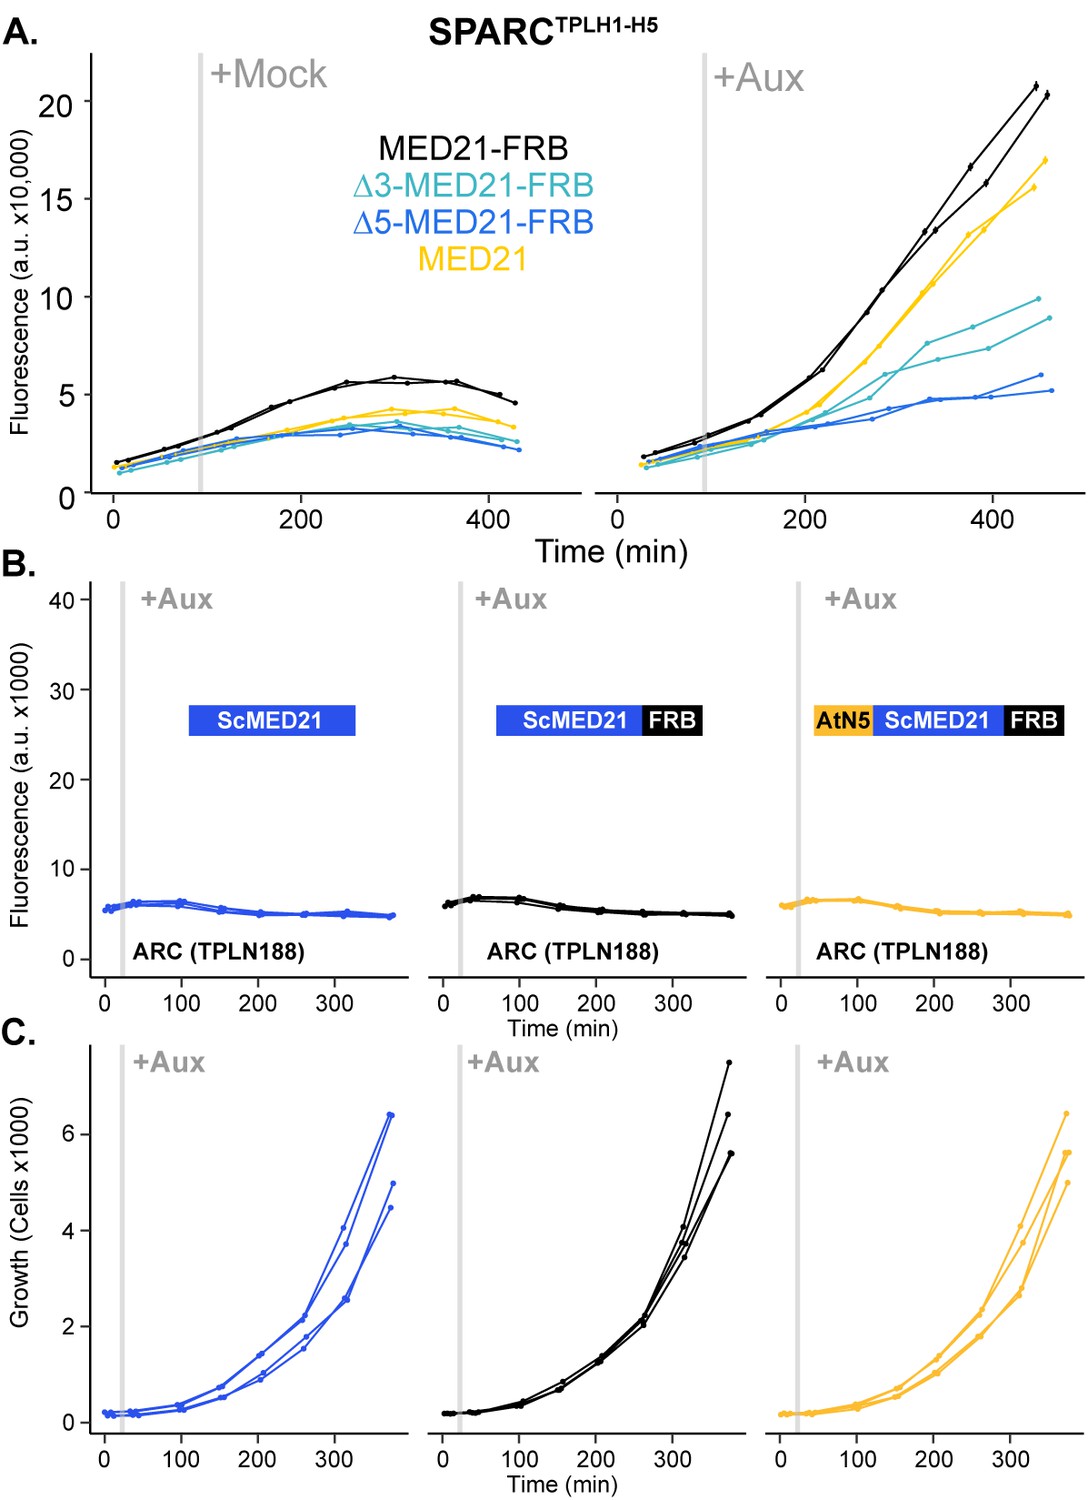
N-terminal ScMed21 deletions impair auxin-responsive transcriptional activation.
(A) Time-course flow cytometry analysis of SPARCH1-H5 in wild-type and n-terminal ScMed21 deletions with and without auxin. Genotypes are indicated in the colored key inset into the graph. Auxin (IAA-10 µM) was added at the indicated time (gray bar, +Aux). (B) Conversion of the first five amino acids of ScMed21 to the corresponding sequence from AtMED21 results in an identical repression profile. Time-course flow cytometry of single locus auxin-response circuit (SPARC) strains following auxin addition. For all cytometry experiments, the indicated TPL construct is fused to IAA14 because this IAA performs better in haploid yeast strains than IAA3. Every point represents the average fluorescence of 5–10,000 individually measured yeast cells (a.u.: arbitrary units). Auxin (IAA-10 µM) was added at the indicated time (gray bar, +Aux). Two independent experiments are shown for each construct. (C) Cell growth of the strains in (B) indicates the swap of the N-terminal region had no effect on yeast growth or viability. Data presented is events per microliter over the time course of the cytometry experiments.
Figure 4—figure supplement 4
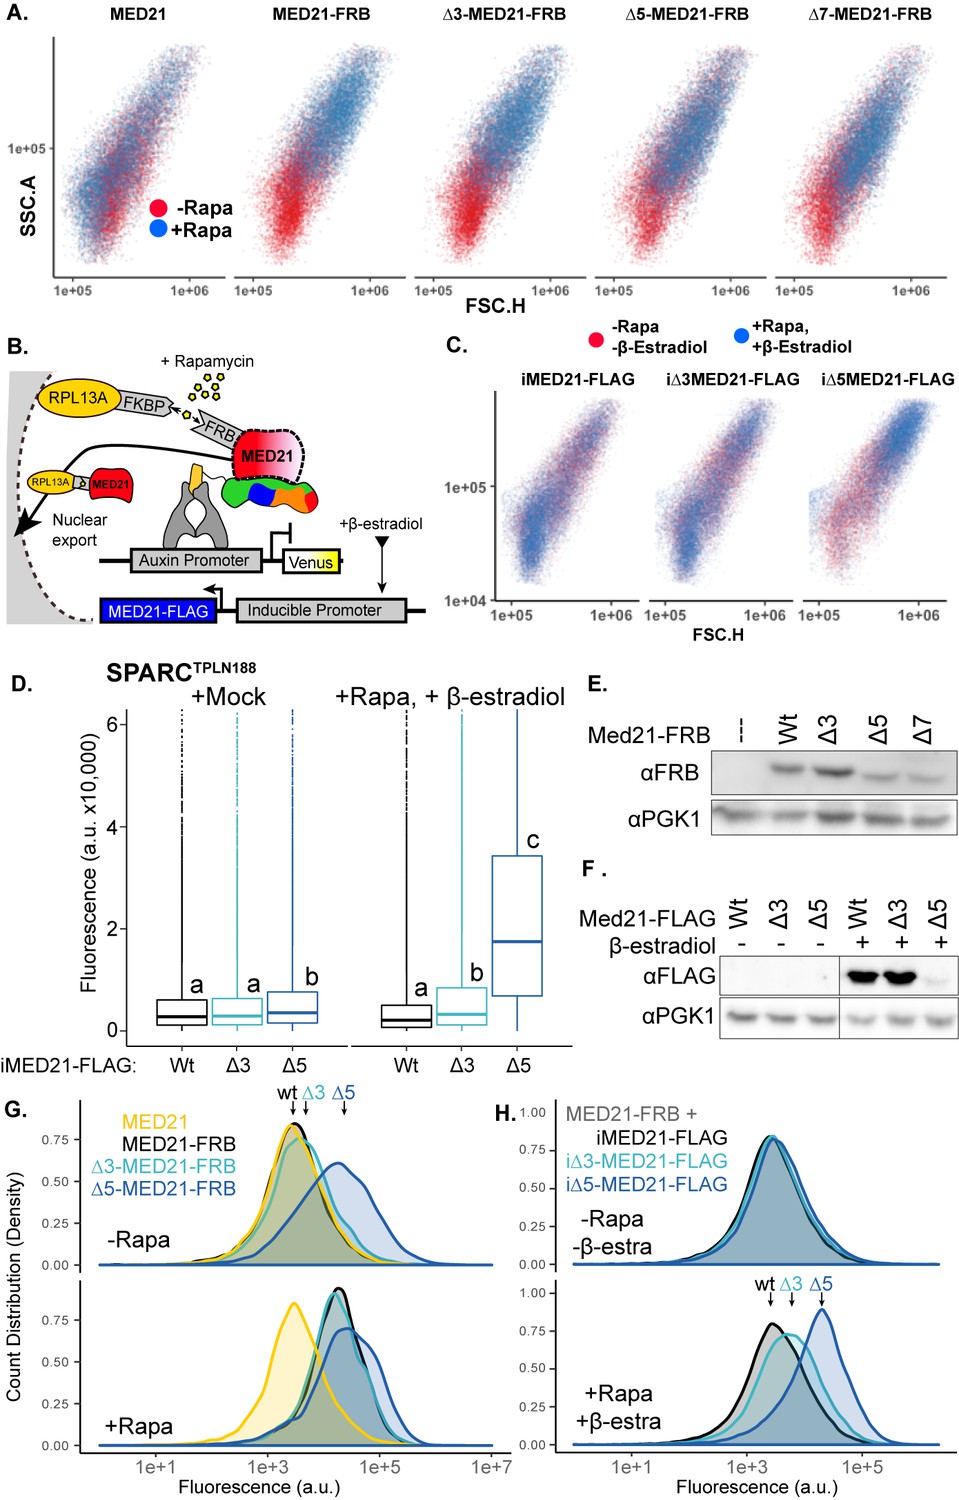
Inducible MED21 rescues rapamycin-induced yeast growth defects.
(A) Depletion of nuclear ScMed21 by rapamycin increased cell size even in short time courses, consistent with its essential role in many core pathways. Scatterplots of side scatter area by forward scatter height (SSC.A × FSC.H) indicate large-scale increases in cell size in populations of yeast with (blue) or without (red) rapamycin treatment. (B) Schematic of AtARCSc combined with methods for inducible expression and nuclear depletion of MED21. In Anchor Away, the yeast ribosomal protein 13A (RPL13A) is fused to the rapamycin-binding protein FKBP. Addition of rapamycin induces dimerization between FKBP and any target protein fused to FRB, resulting in removal of the target protein from the nucleus. For these experiments, AtARCSc was assembled into a single plasmid (single locus auxin-response circuit [SPARC]) rather than being integrated into separate genomic loci (Figure 4—figure supplement 1). Estradiol-inducible ScMed21 (iMed21) made it possible to replace wild-type MED21 with targeted deletions or mutations. (C) Inducible Med21 (iMed21) wild-type and variants cell size were examined before (red) and after (blue) treatment with rapamycin and β-estradiol to simultaneously deplete the wild-type Med21-FRB fusion and induce the transcription of the Med21 variant. Scatterplots of side scatter area by forward scatter height (SSC.A × FSC.H) demonstrate a less disrupted cell size compared to Anchor Away strains in (A). (D) Rapid replacement of Med21-FRB with inducible Med21-FLAG demonstrated the requirement for the ScMed21 N-terminus in TPL repression. iMed21 isoforms were induced by addition of β-estradiol (20 µM) for 4 hr followed by rapamycin addition. Fluorescence was quantified by cytometry after 300 min. Lowercase letters indicate significant difference (ANOVA and Tukey HSD multiple comparison test; p<0.001). (E, F) Protein abundance of ScMed21 variants was tested by SDS-PAGE and western blot (E) Stably integrated Med21-FRB variants. (F) Induced iMed21-FLAG variants. (G, H) Histograms of Venus fluorescence in inducible Med21 (iMed21) strains demonstrate that populations were evenly distributed around a single mean, suggesting that we were observing the immediate effects of the Med21 deletions. The histograms were built using ggplots density function to create a visualization of count distribution. These samples were tested at 300 min (as in Figure 4D) and plotted to visualize cells at the equivalent stage of growth, Med21 depletion, and induction.
Figure 5 with 1 supplement
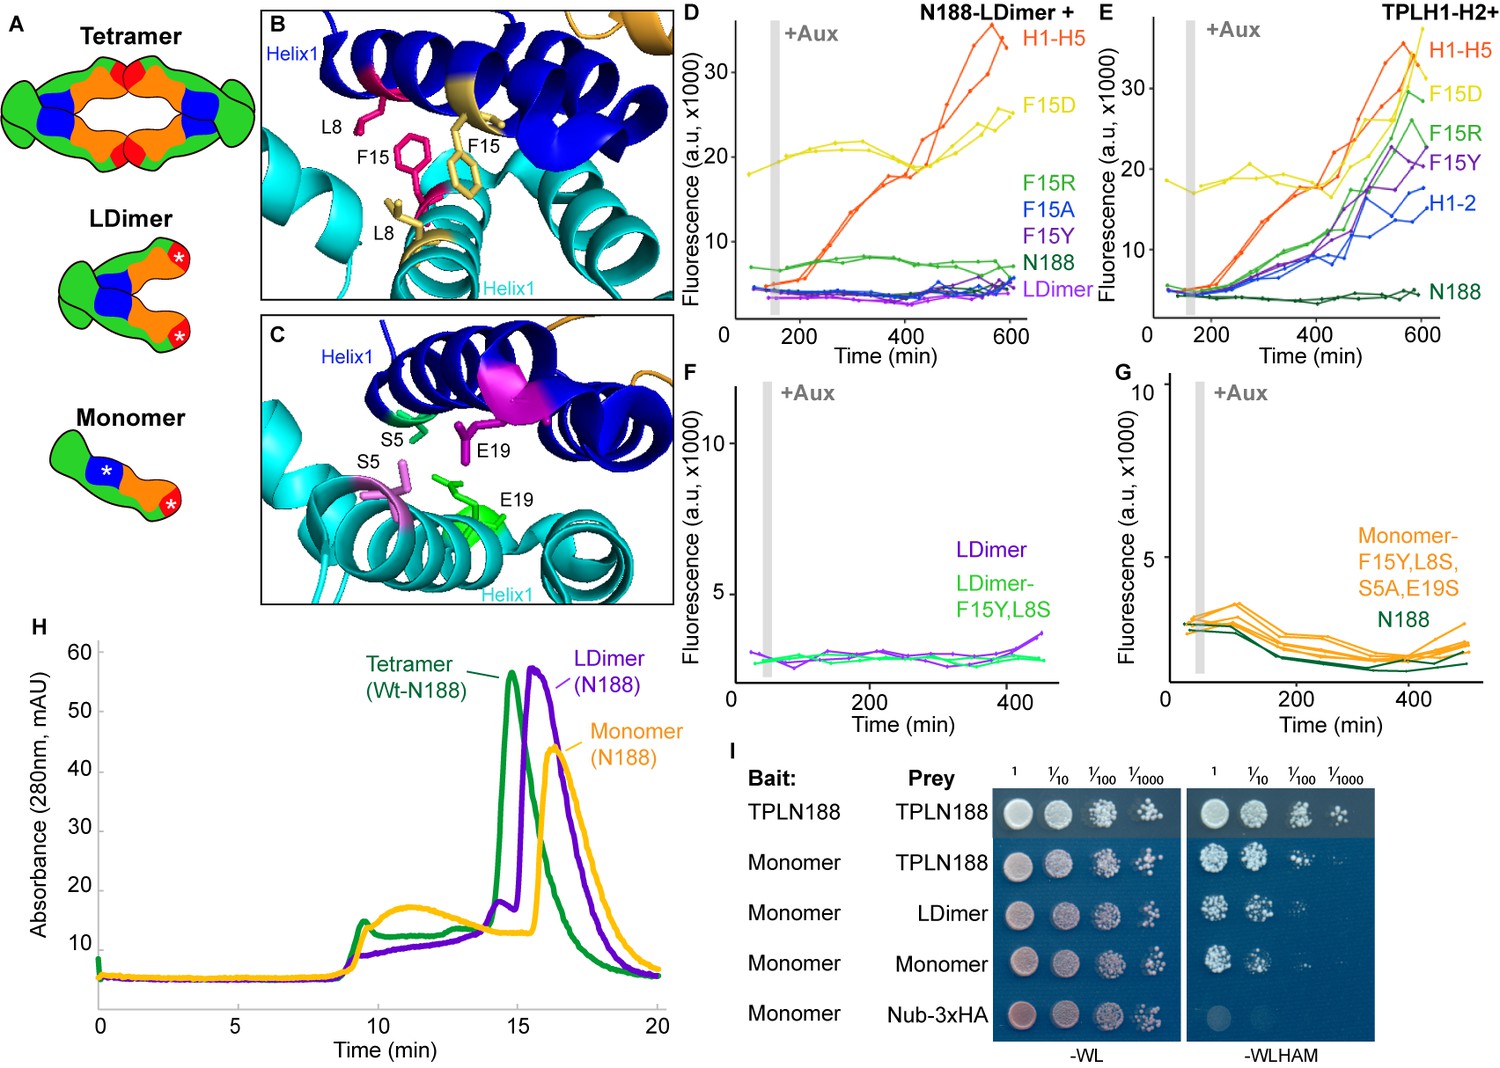
Multimerization is not required for repression in yeast.
(A) TPL can form a homotetramer via the CRA (red) and LisH (blue) domains. Asterisks indicate mutations that block or diminish these interactions. (B, C) Locations of critical positions in Helix 1 are highlighted for two interacting TPL monomers (shown in light and dark blue). Interacting amino acids share the same color (adapted from 5NQV). (D–G) Time-course flow cytometry analysis of TPLN-IAA3 fusion proteins carrying selected single point mutations in N188-LDimer-IAA3 (D) and the TPLH1-2 truncation (E). The F15Y mutation had little effect on repression activity for either TPL construct. Double mutations (F15Y, L8S in LDimer) (F) or the quadruple Monomer mutations (S5A, L8S, F15Y, E19S in LDimer) (G) showed repression activity that was indistinguishable from LDimer or wild-type N188 fused to IAA3. For all cytometry experiments, the indicated TPL construct is fused to IAA3. Every point represents the average fluorescence of 5–10,000 individually measured yeast cells (a.u.: arbitrary units). Auxin (IAA-10 µM) was added at the indicated time (gray bar, +Aux). At least two independent experiments are shown for each construct. (H) Size exclusion chromatography on TPLN188 wild-type (green), LDimer (purple), and Monomer (orange) tetramerization mutants. (I) Cytoplasmic split-ubiquitin system (CytoSUS) on TPL tetramerization mutants.
Figure 5—figure supplement 1
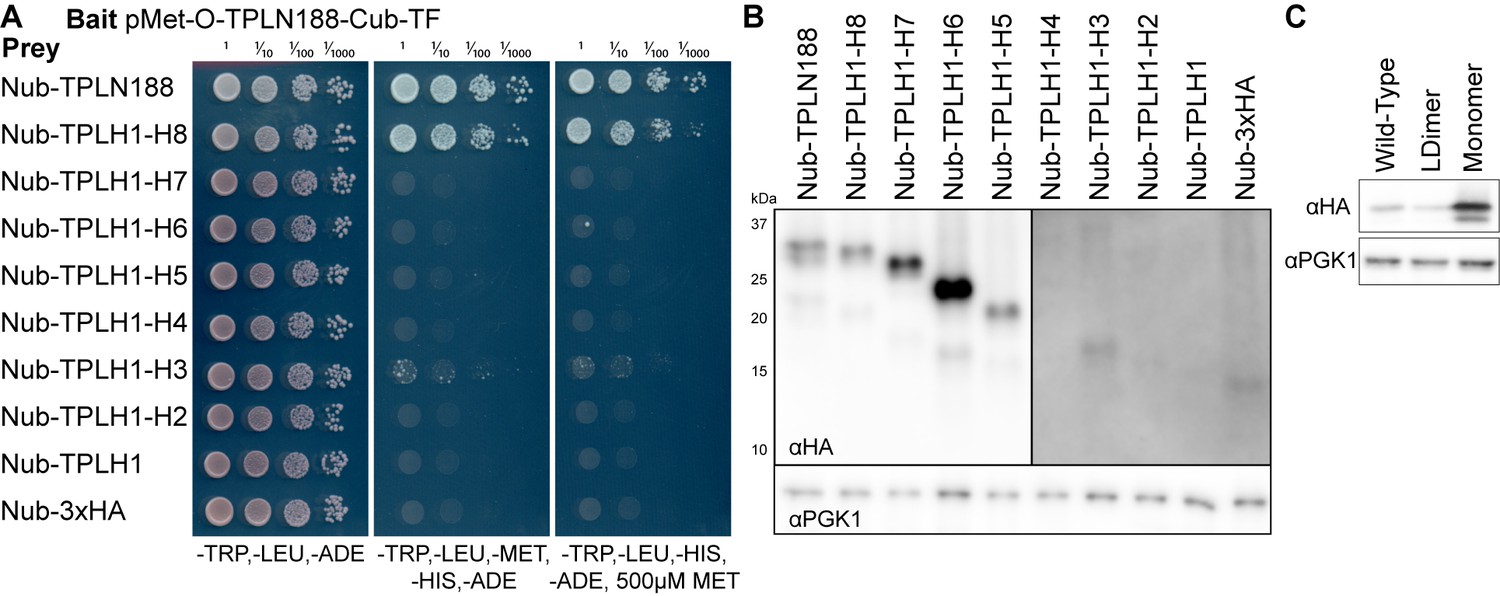
TPL multimerization requires Helix 8.
(A) Cytoplasmic split-ubiquitin interaction (cytoSUS) assay on serial deletions of TPL. Interaction of bait and prey proteins reconstitutes split ubiquitin, releasing a synthetic transcription factor that allows growth on media lacking histidine and adenine. The expression level of the bait protein can be repressed through increased methionine in the media. (B) Protein levels of Nub-TPL fusions were tested by PAGE and western blotting for the c-terminal 3xHA epitope tag included in all constructs. Deletions longer than H1-4 are detectable at higher levels (left panel), whereas shorter isoforms required longer exposure times to detect (right panel). Total protein loading levels were tested by the housekeeping gene PGK1 (bottom panel). (C) Protein expression analysis by western blotting of tetramerization mutants expressed in yeast for cytoSUS interaction assay in Figure 5I. Prey constructs are C-terminally fused to 2xHA. Total protein loading levels were tested by blotting against the housekeeping gene PGK1 (bottom panel).
Figure 6 with 2 supplements
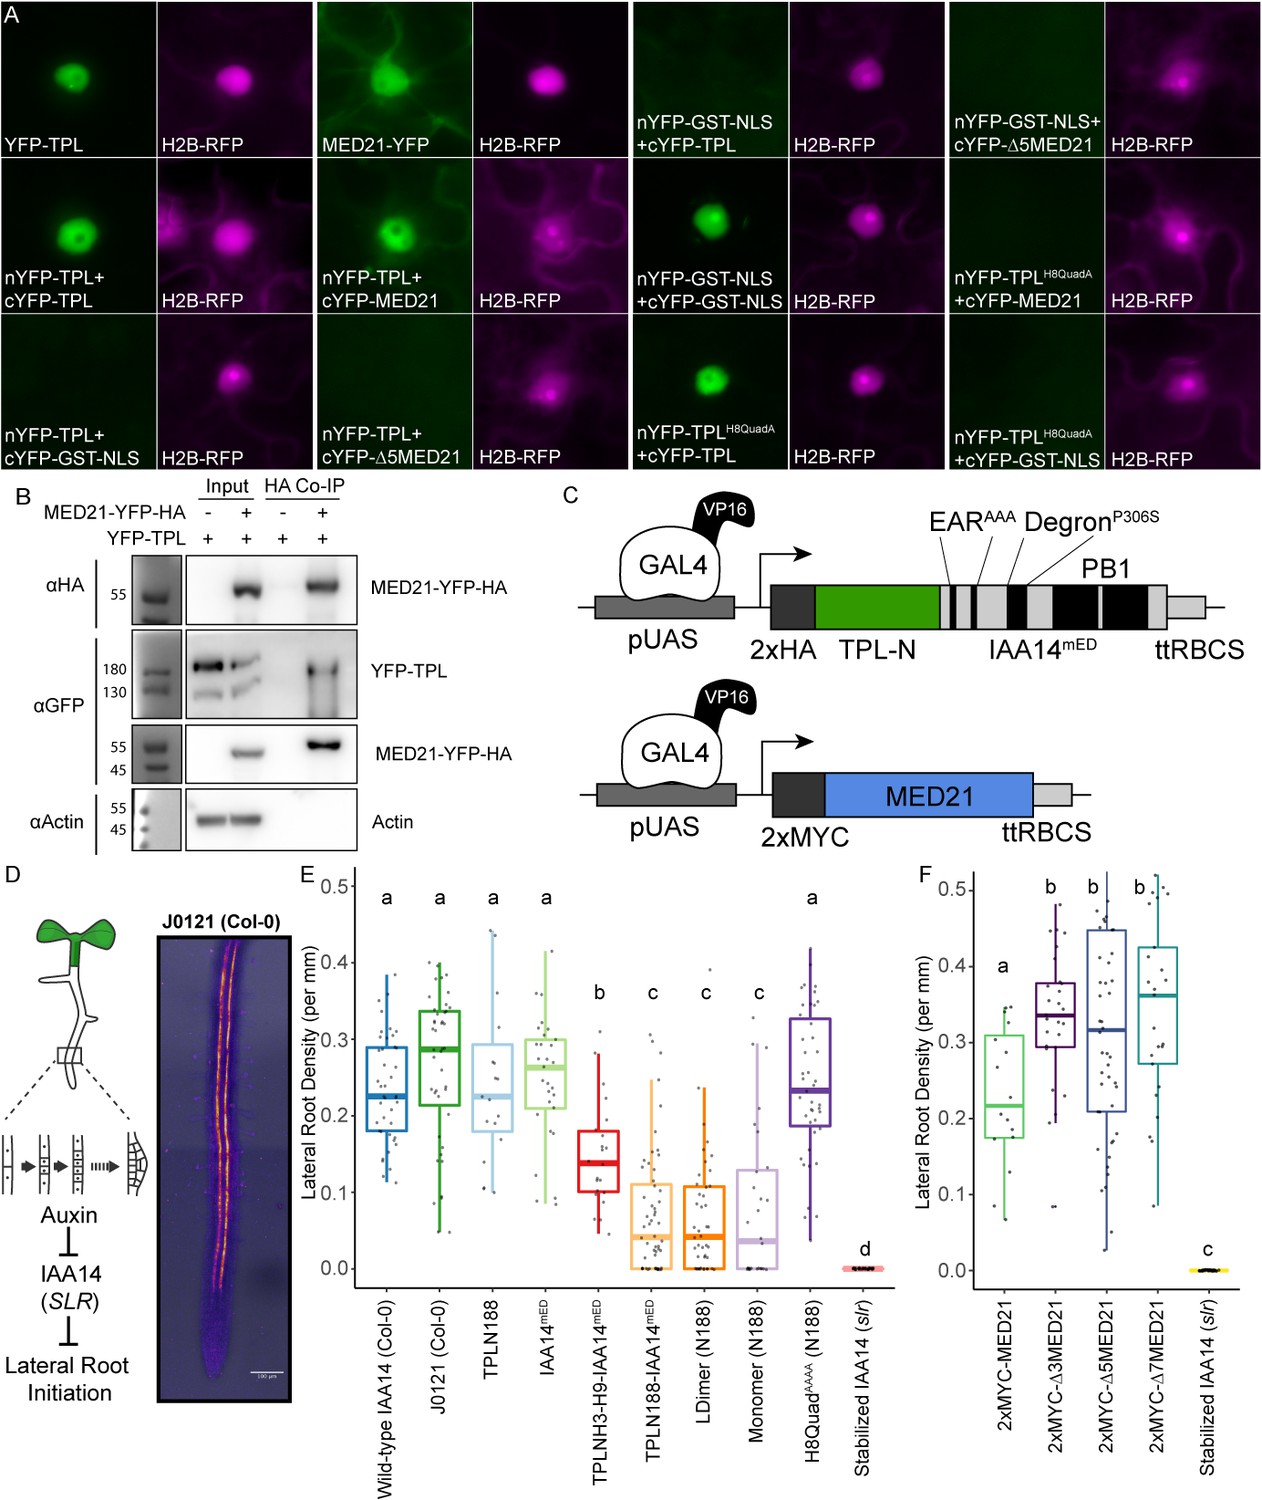
The TPL CRA repression domain behaves similarly in yeast and plants.
(A) Bimolecular fluorescence complementation assay performed in tobacco. Each image is an epi-fluorescent micrograph taken at identical magnification from tobacco epidermal cells at 2 days post injection. The YFP image is colored green (left panel). p35S:H2B-RFP was used as a control and is false-colored magenta (right panel). (B) Co-immunoprecipitation of MED21 and TPL from tobacco leaves. MED21-YFP-HA was immunoprecipitated using anti-HA, and YFP-TPL was detected using the YFP fusion. Actin was used to demonstrate that the purification had removed non-specific proteins. Numbers on the left of blots indicate sizes of protein standards in kilodaltons. (C) Design of UAS-TPL-IAA14mED and UAS-MED21 constructs. Mutation of the conserved lysine residues in the EAR domain disrupted potential interactions with endogenous TPL/TPR proteins. The IAA14 degron has been mutated (P306S) to render it auxin insensitive. UAS: upstream activating sequence; ttRBCS: Rubisco terminator sequence. (D) Auxin-induced degradation of IAA14 is absolutely required for initiation of lateral root development (cartoon, left). An enhancer trap line (J0121) expresses GAL4-VP16 and UAS-GFP in in xylem pole pericycle cells. (E) N-terminal domains of TPL were sufficient to repress the development of lateral roots in Arabidopsis seedlings. The density of emerged lateral roots was measured in T1 seedlings at 14 days after germination. (F) N-terminal deletions in AtMED21 were sufficient to dominantly increase the development of lateral roots in Arabidopsis seedlings. The density of emerged lateral roots was measured in T1 seedlings at 14 days after germination. (E, F) Lowercase letters indicate significant difference (ANOVA and Tukey HSD multiple comparison test; p<0.001).
Figure 6—figure supplement 1
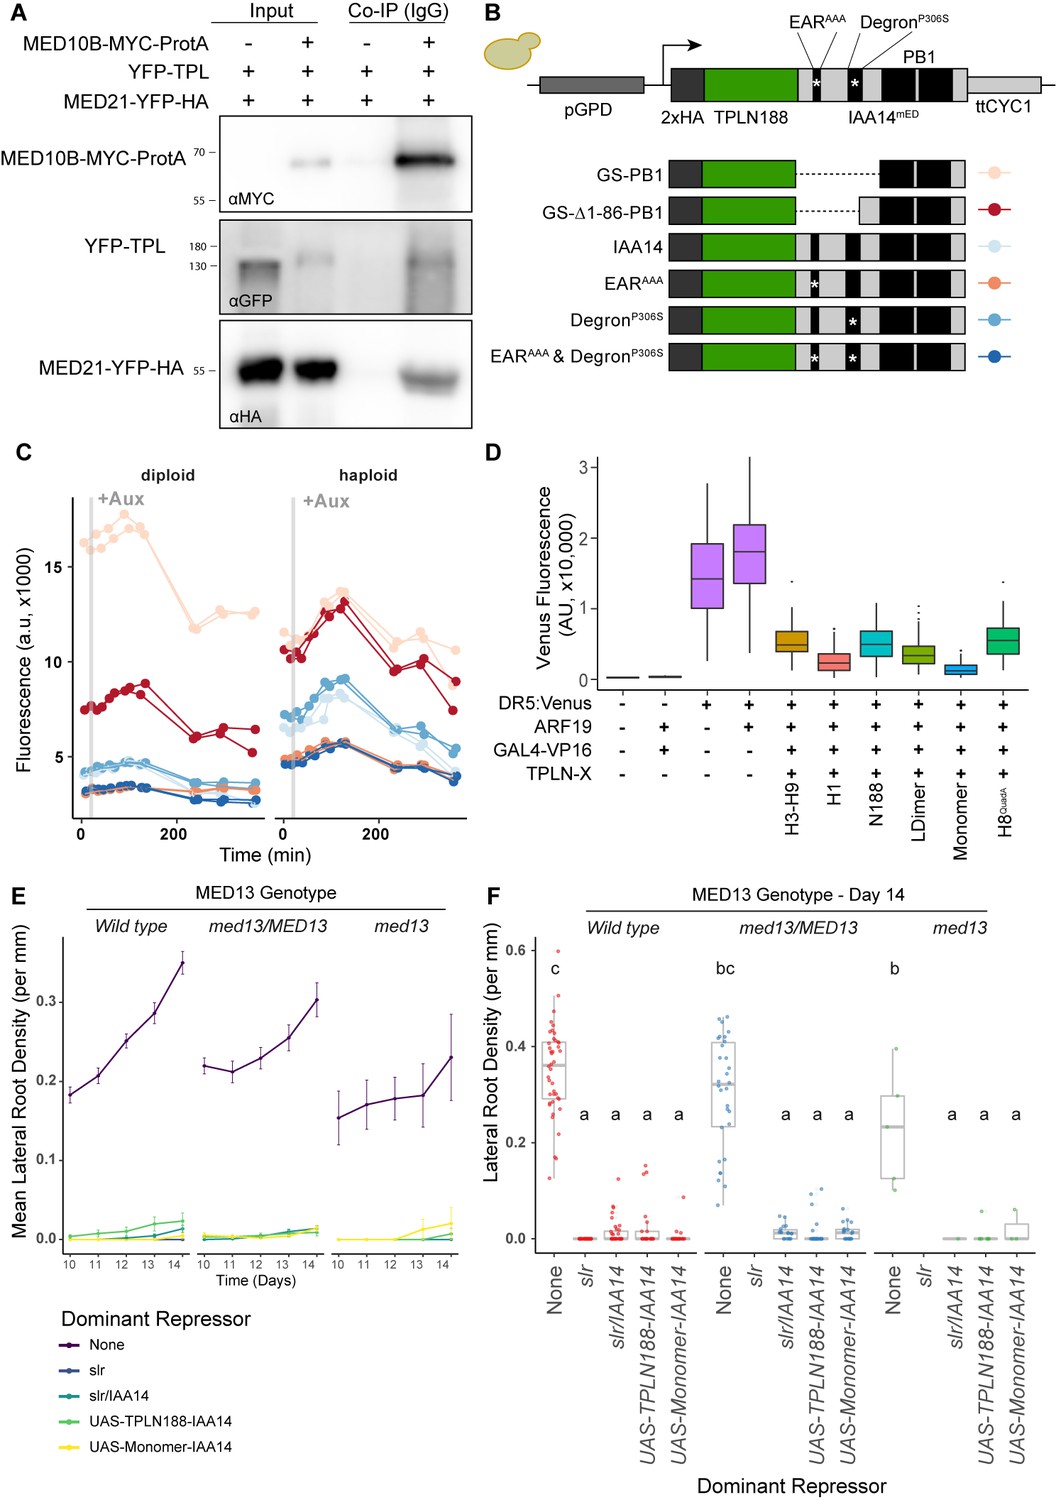
The TPL-MED21 interaction is required for repression in plants.
(A) MED21 and TPL co-immunoprecipitated with AtMED10B from tobacco extracts. Each construct was expressed under the viral 35S promoter, and tissues were harvested after 2 days of injection. MED10B was purified by incubation with IgG sepharose beads (see Materials and methods), and the presence of interacting proteins was determined by western blotting. (B, C) Engineering and prototyping a variant of TPLN-IAA14mED, which carries mutations in the EAR domain (EARAAA) and in the degron (P306S) in yeast. (B) Cartoon schematic of the mutations tested during prototyping of the TPLN188-IAA14mED construct. In each case, the identical glycine-serine linker (GS) was used as the flexible linker between the 2xHA-TPLN188 protein and the portion of IAA14 retained in the construct. (C) Time-course flow cytometry of TPLN-IAA14mED strains following auxin addition. Strains containing the TPLN-IAA14mEDwere tested in both haploid and diploid strains and demonstrated similar repression profiles. Every point represents the average fluorescence of 5–10,000 individually measured yeast cells (a.u.: arbitrary units). Auxin (IAA-10 µM) was added at the indicated time (gray bar, +Aux). Two independent experiments are shown for each construct. (D) Transient expression of indicated TPL constructs in tobacco. DR5:Venus: the synthetic DR5 auxin promoter (Ulmasov et al., 1997) driving Venus; ARF19: p35S:AtARF19-1xFLAG; GAL4:VP16: pUBQ10:GAL4-VP16, TPLN-X-UAS-TPL-IAA14mED with various TPL truncations or mutations. (E, F) The TPL-N terminus functions as a repressor independently of the MED13 component of the Mediator CDK8 kinase module in Arabidopsis. The GAL4:UAS-driven dominant lateral root repression constructs (UAS-TPLN188-IAA14, UAS-Monomer-IAA14) and the dominant slr mutant were crossed to the med13 mutant (gct-5, a.k.a. mab2-2, SAIL_1169 H11). We performed time-course lateral root density assays and genotyped the progeny in the F1 and F2 generations. We observed an ~1% transmission rate of gct-5 homozygotes. (E) Time course of the mean of lateral root density over days 10–14 post germination ± standard error. (F) Boxplots of lateral root density for day 14 (E). Lowercase letters indicate significant difference (ANOVA and Tukey HSD multiple comparison test; p<0.001).
Figure 6—figure supplement 2
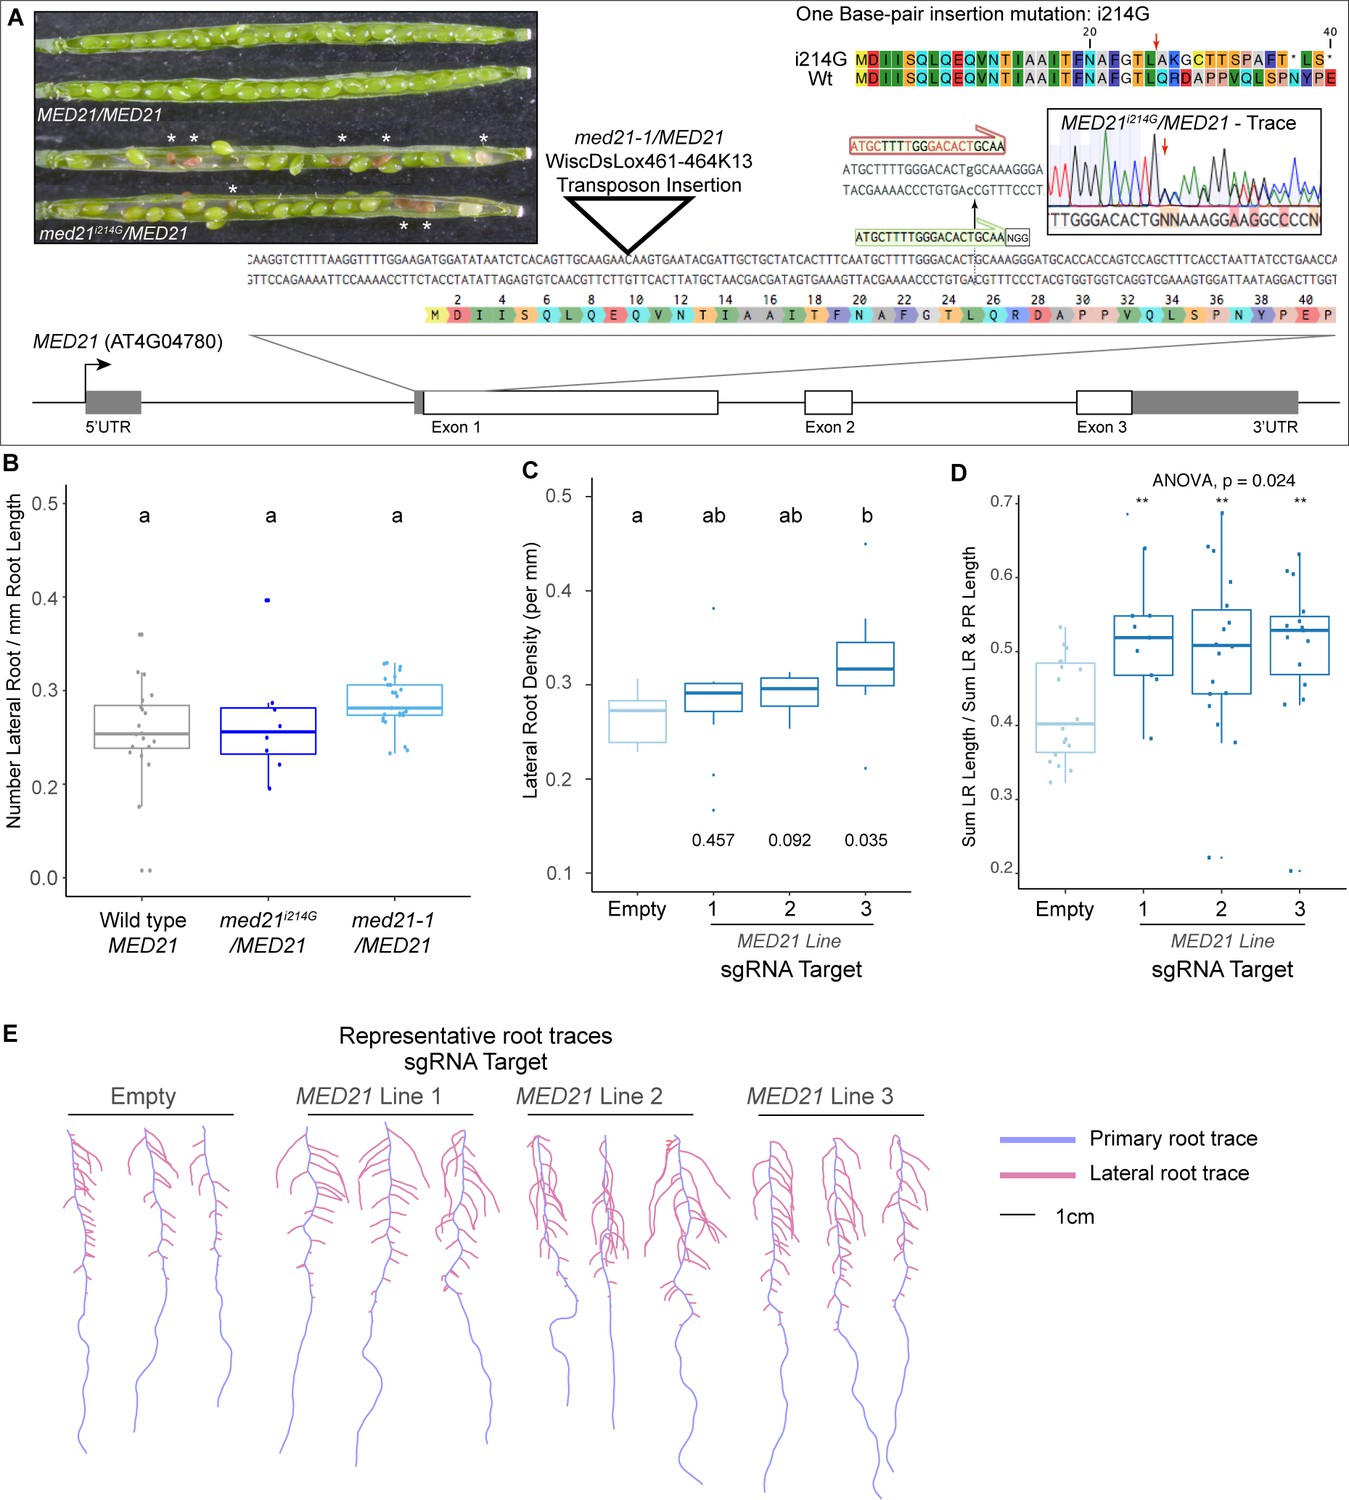
The essential gene MED21 is required for normal lateral root development in plants.
(A) Identification and characterization of a novel CAS9-based insertional mutation in MED21. The MED21 genomic locus (AT4G04780) is shown as a cartoon, with a zoom-in on the beginning of the coding sequence highlighted with the amino acid sequence. The location of the med21/MED21 mutant (WiscDsLox461-464K13, see triangle) and the sgRNA we employed (see green annotation and NGG PAM site) is highlighted. The insertion of a G at nucleotide position +214 after the transcriptional start site abrogates the sgRNA site (red annotation above with i214G). A representative sequencing trace demonstrates the position where the heterozygote carries i215G, and the predicted effect to the coding sequence is shown at the top right – a red arrow indicates the first codon affected by the i214G mutation. The inset pictures at the top left demonstrate the embryo lethality phenotype in med21i214G/MED21 heterozygote siliques. White asterisks indicate the embryos that have begun to degenerate. These aborted seeds are visibly brown, indicating that fertilization took place allowing the seed coat to form before development failed. (B) Med21/MED21 heterozygotes are haplo-sufficient for lateral root development. Lateral root density (number of lateral roots/primary root length) was calculated at 10 days post germination. Lowercase letters indicate significant difference (ANOVA and Tukey HSD multiple comparison test; p<0.005). (C) MED21-CAS9 repressors targeted to MED21 display increased lateral root densities. Lateral root density (number of lateral roots/primary root length) was calculated at 10 days post germination. Numbers below boxplots are p-values for pairwise comparisons with control using a Wilcoxon rank-sum test. (D) Ratio of lateral root lengths to total root lengths (lateral root lengths + primary root length) in dCAS9 repressor lines targeting MED21 calculated at 10 days post germination. Statistical tests (ANOVA and Wilcox test) are reported above the graph. (E) Representative root traces of dCAS9 repressor lines targeting MED21 calculated at 10 days post germination.
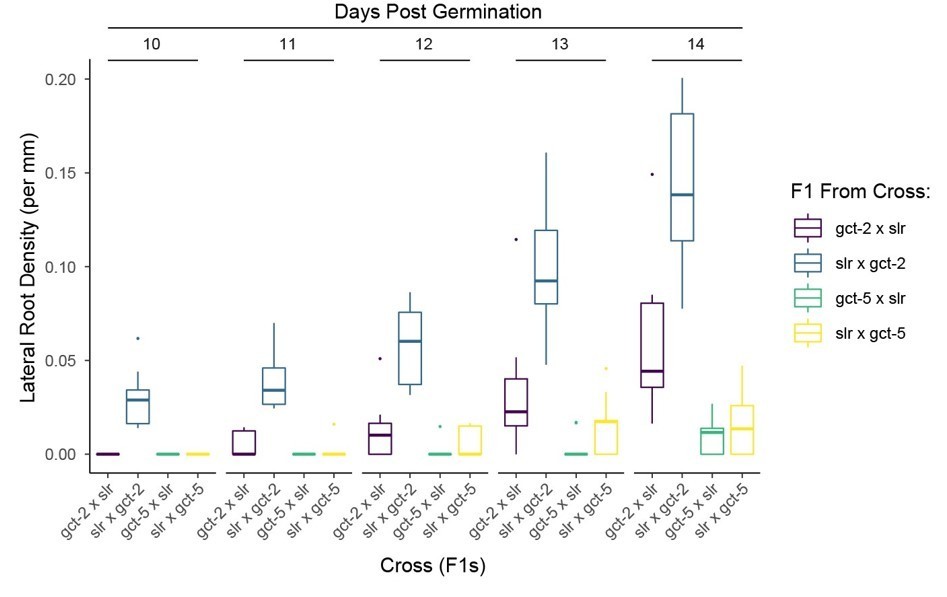
Author response image 1
Tables
Key resources table
| Reagent type (species) or resource | Designation | Source or reference | Identifiers | Additional information |
|---|---|---|---|---|
| Gene (Arabidopsis thaliana) | TOPLESS, TPL | GenBank | AT1G15750 | |
| Gene (Arabidopsis thaliana) | MEDIATOR 21, MED21 | GenBank | AT4G04780 | |
| Strain, strain background (Saccharomyces cerevisiae) | Anchor Away strains | EURO- SCARF euroscarf.de | HHY168 | See Yeast Strain list (Supplementary file 3) |
| Strain, strain background (Saccharomyces cerevisiae) | cytoSUS strains | Asseck and Grefen, 2018 | THY.AP4, THY.AP5 | See Yeast Strain list (Supplementary file 3) |
| Strain, strain background (Escherichia coli) | Rosetta 2 strain | Sigma-Aldrich | 71400 | Electrocompetent cells |
| Strain, strain background (Nicotiana benthamiana) | Nicotiana benthamiana (wild-type) | GenBank | NCBI: txid4100 | |
| Strain, strain background (Agrobacterium tumefaciens) | GV3101 | GenBank | NCBI: txid358 | Electrocompetent cells |
| Genetic reagent (Arabidopsis thaliana) | J0121 (in Col-0 accession) | Gala et al., 2021 | J0121 | |
| Genetic reagent (Arabidopsis thaliana) | slr | TAIR | SLR-1, AT4G14550 | |
| Genetic reagent (Arabidopsis thaliana) | med21-1 | Arabidopsis Biological Resource Center | WiscDsLox461-464K13 | |
| Genetic reagent (Arabidopsis thaliana) | med21i214G | This paper | ||
| Antibody | Anti-HA-HRP (Rat Monoclonal) | Roche/Millipore Sigma | RRID:AB_390917, REF-12013819001, Clone 3F10 | WB (1:1000) |
| Antibody | Anti-FLAG (Mouse Monoclonal) | Millipore Sigma | RRID:AB_259529, F3165 | WB (1:5000) |
| Antibody | Anti-FRB (Rabbit Polyclonal) | Enzo Life Sciences, (Haruki et al., 2008) | RRID:AB_2051920, ALX-215-065-1 | WB (1:10,000) |
| Antibody | Anti-VP16 (1-21) (Mouse Monoclonal) | Santa Cruz Biotechnology | RRID:AB_628443, sc-7545 | WB (1:5000) |
| Antibody | Anti-GFP (Rabbit Polyclonal) | AbCam | RRID:AB_303395, ab290 | WB (1:10,000) |
| Antibody | Anti-MYC (Rabbit Monoclonal) | Cell Signaling | RRID:AB_490778, 71d10, 2278S | WB (1:5000) |
| Antibody | Anti-PGK1 (Mouse Monoclonal) | AbCam | RRID:AB_10861977, ab113687 | WB (1:10,000) |
| Recombinant DNA reagent | RPL13A-FKBP fusion proteins | Haruki et al., 2008 | See Plasmid list (Supplementary file 2) | |
| Peptide, recombinant protein | TPL-6xH | This paper | TPL-6xHis tagged fusion proteins | |
| Commercial assay or kit | DNA Sequencing | Genewiz | Genewiz.com | |
| Chemical compound, drug | Rapamycin | LC Laboratories | R-5000 | 1 µM for Anchor Away |
| Chemical compound, drug | β-estradiol | Sigma | E2758-1G | |
| Chemical compound, drug | Auxin | plantMedia, plantmedia.com | CAT#705490 | (IAA-10 µM) |
| Chemical compound, drug | Geneticin | Thermo Fisher Scientific | G418 | |
| Software, algorithm | CLC Sequence Viewer 7 | QIAGEN | ||
| Software, algorithm | R | R Studio | rstudio.com/ | |
| Software, algorithm | ImageJ | Schneider et al., 2012 | https://imagej.nih.gov/ij/ | |
| Software, algorithm | SmartRoot | Jülich Research Centre and ROot and Soil/Shoot Interactions virtual group | https://smartroot.github.io/ | |
| Software, algorithm | NeuronJ | Erik Meijering | https://imagescience.org/meijering/software/neuronj/manual/ |
Additional files
-
Source code 1
Custom scripts.
Custom scripts used in this study in an R file format to analyze flow cytometry and to quantify root phenotypes. Comments are included to delineate sections in the code. Also available on Github: https://github.com/achillobator/TPL_Structure_Function/.
- https://cdn.elifesciences.org/articles/66739/elife-66739-code1-v2.zip
-
Supplementary file 1
Oligonucleotide list.
Sequences, names, and experimental uses of all oligonucleotides created in this study.
- https://cdn.elifesciences.org/articles/66739/elife-66739-supp1-v2.xlsx
-
Supplementary file 2
Plasmid list.
Names and descriptions of all plasmids generated in this study.
- https://cdn.elifesciences.org/articles/66739/elife-66739-supp2-v2.xlsx
-
Supplementary file 3
Yeast strain list.
Names and full genotypes of all yeast strains generated or used in this study.
- https://cdn.elifesciences.org/articles/66739/elife-66739-supp3-v2.xlsx
-
Transparent reporting form
- https://cdn.elifesciences.org/articles/66739/elife-66739-transrepform-v2.docx
Download links
A two-part list of links to download the article, or parts of the article, in various formats.
Downloads (link to download the article as PDF)
Open citations (links to open the citations from this article in various online reference manager services)
Cite this article (links to download the citations from this article in formats compatible with various reference manager tools)
Repression by the Arabidopsis TOPLESS corepressor requires association with the core mediator complex
eLife 10:e66739.
https://doi.org/10.7554/eLife.66739


