Single-cell RNA-seq analysis reveals penaeid shrimp hemocyte subpopulations and cell differentiation process
- Department of Biotechnology and Life Science, Tokyo University of Agriculture and Technology, Japan
- Laboratory of Genome Science, Tokyo University of Marine Science and Technology, Japan
- Fisheries Laboratory, Graduate School of Agricultural and Life Sciences, The University of Tokyo, Japan
- Graduate School of Fisheries and Environmental Sciences, Nagasaki University, Japan
- bitBiome Inc, Japan
- Advanced Genomics Center, National Institute of Genetics, Japan
- Department of Precision Mechanics, Faculty of Science and Engineering, Chuo University, Japan
Figures
Figure 1
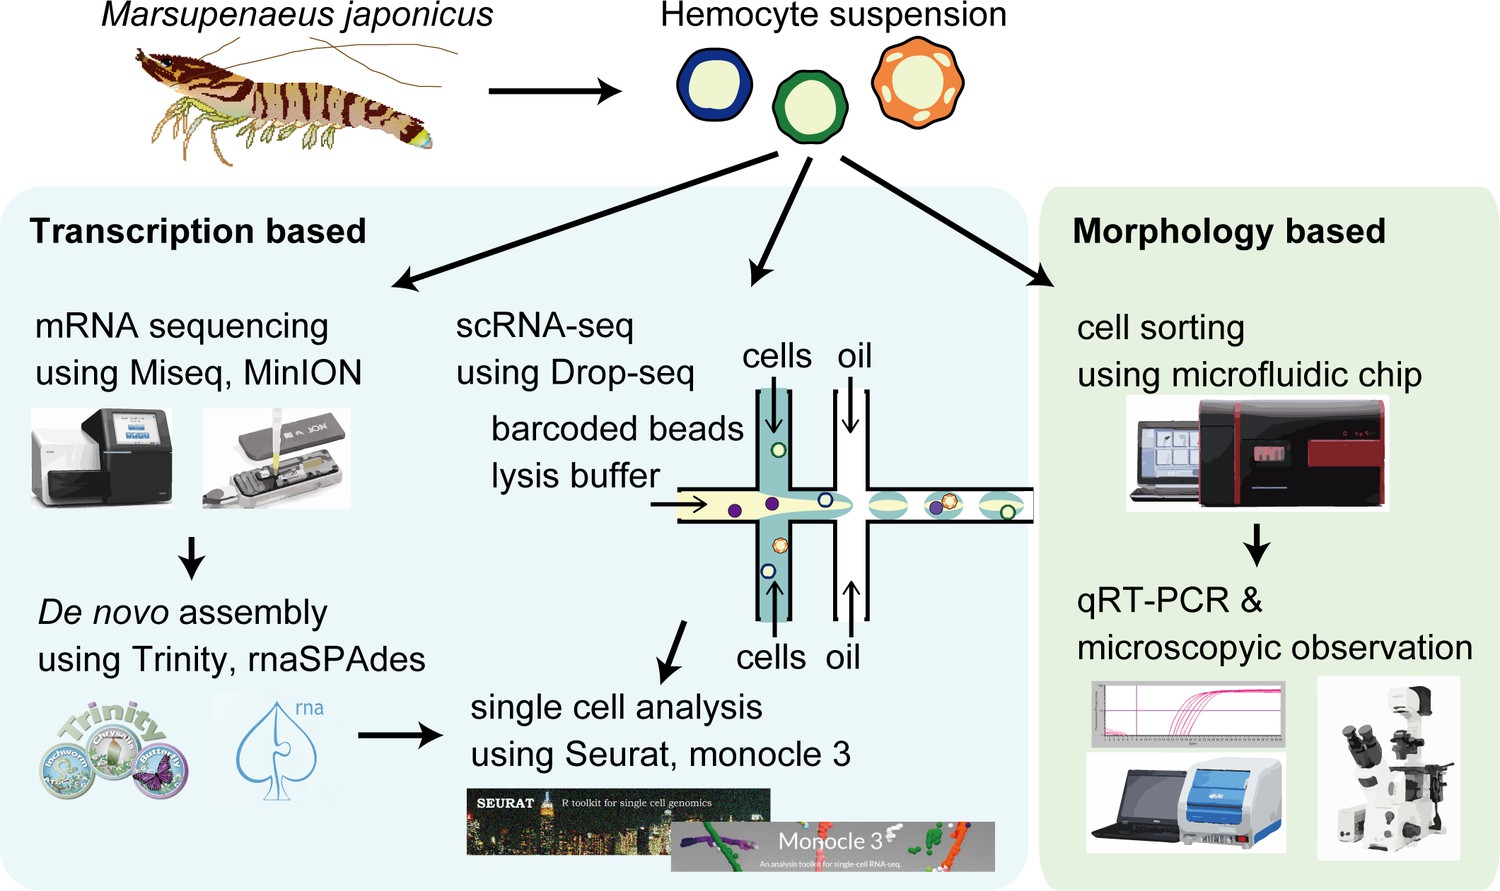
The schematic of single-cell mRNA sequencing (scRNA-seq) analysis of penaeid shrimp M. japonicus hemocytes.
Single hemocytes were analyzed through the microfluidics-based Drop-seq, mRNA sequencing for the preparation of de novo assembled gene sets, in silico analysis workflow, and morphology-based cell classification.
Figure 2 with 1 supplement
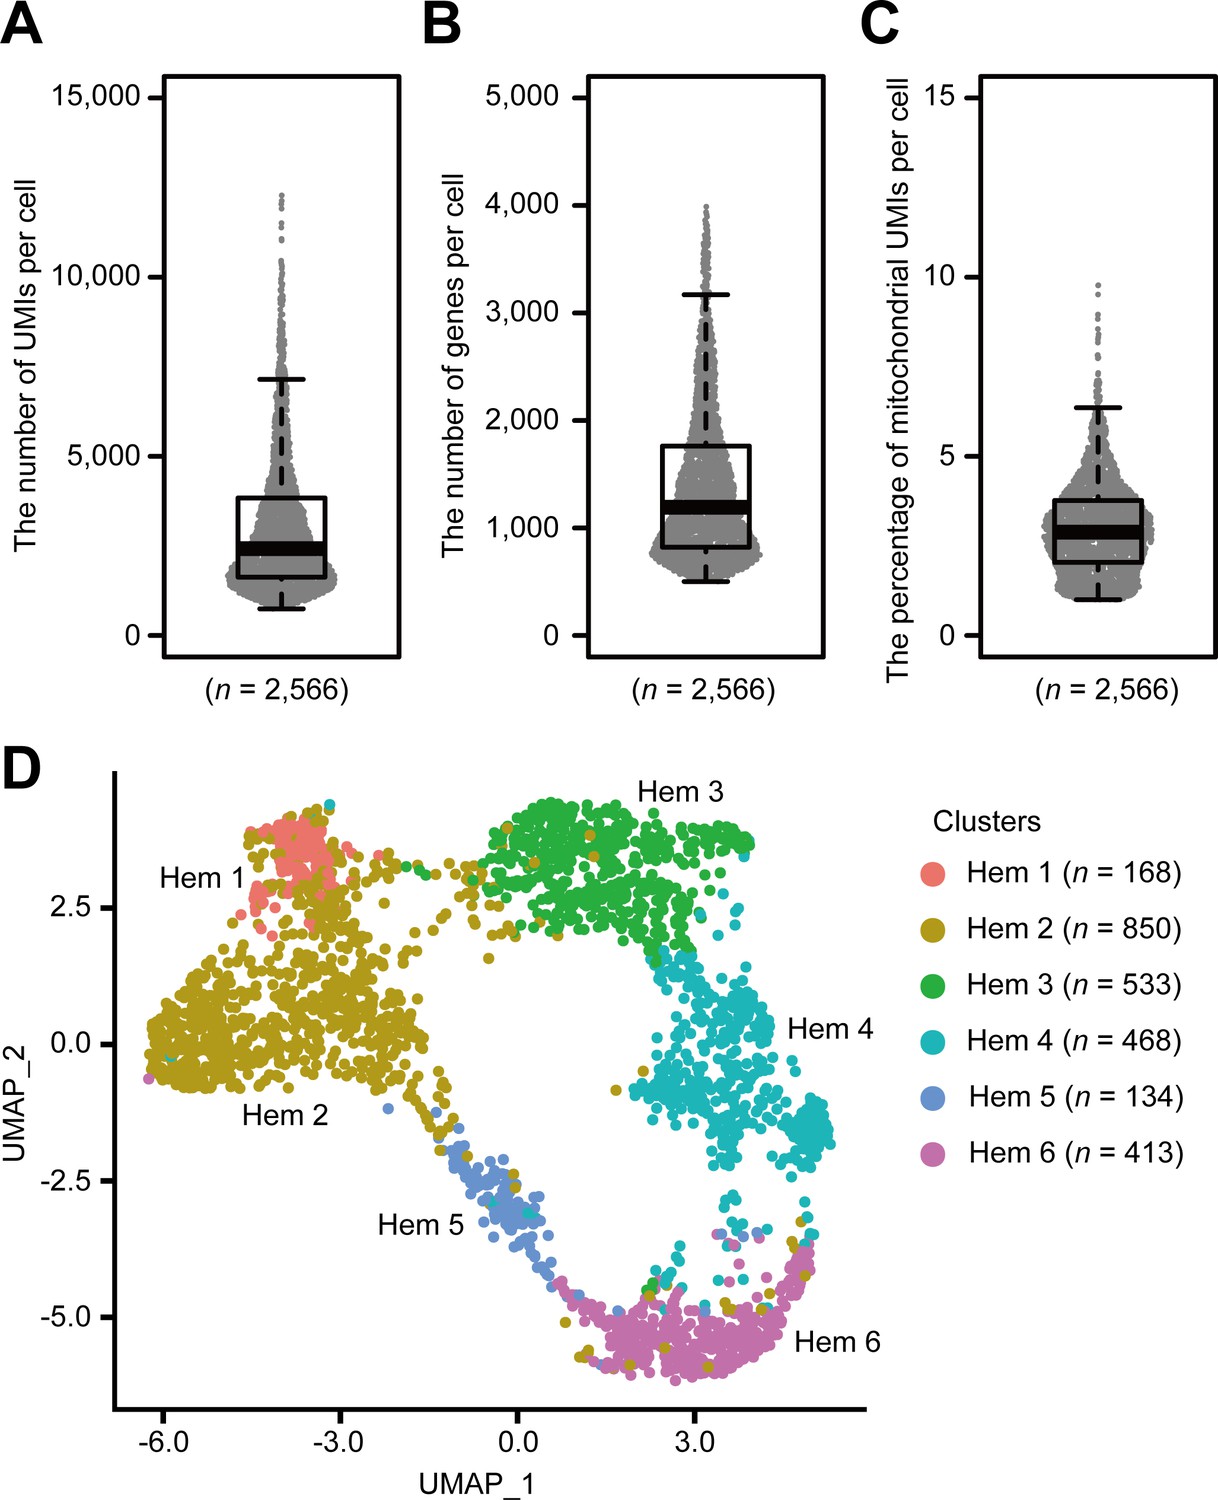
Single-cell mRNA sequencing (scRNA-seq) analysis of penaeid shrimp M. japonicus hemocytes.
Distribution and the median of the number of transcripts (unique molecular identifiers [UMIs]) (A), genes (B), and percentage of mitochondrial UMIs (C) detected per cell. Uniform manifold approximation and projection (UMAP) plot of SCTransform batch corrected and integrated of hemocytes from three shrimps (n = 2566) (D). scRNA-seq analysis of penaeid shrimp M. japonicus hemocytes.
-
Figure 2—source data 1
Excel sheets pertaining to UMIs, genes , mitochondrial UMIs detected per hemocyte used for Figure 2A-C.
- https://cdn.elifesciences.org/articles/66954/elife-66954-fig2-data1-v2.xlsx
Figure 2—figure supplement 1
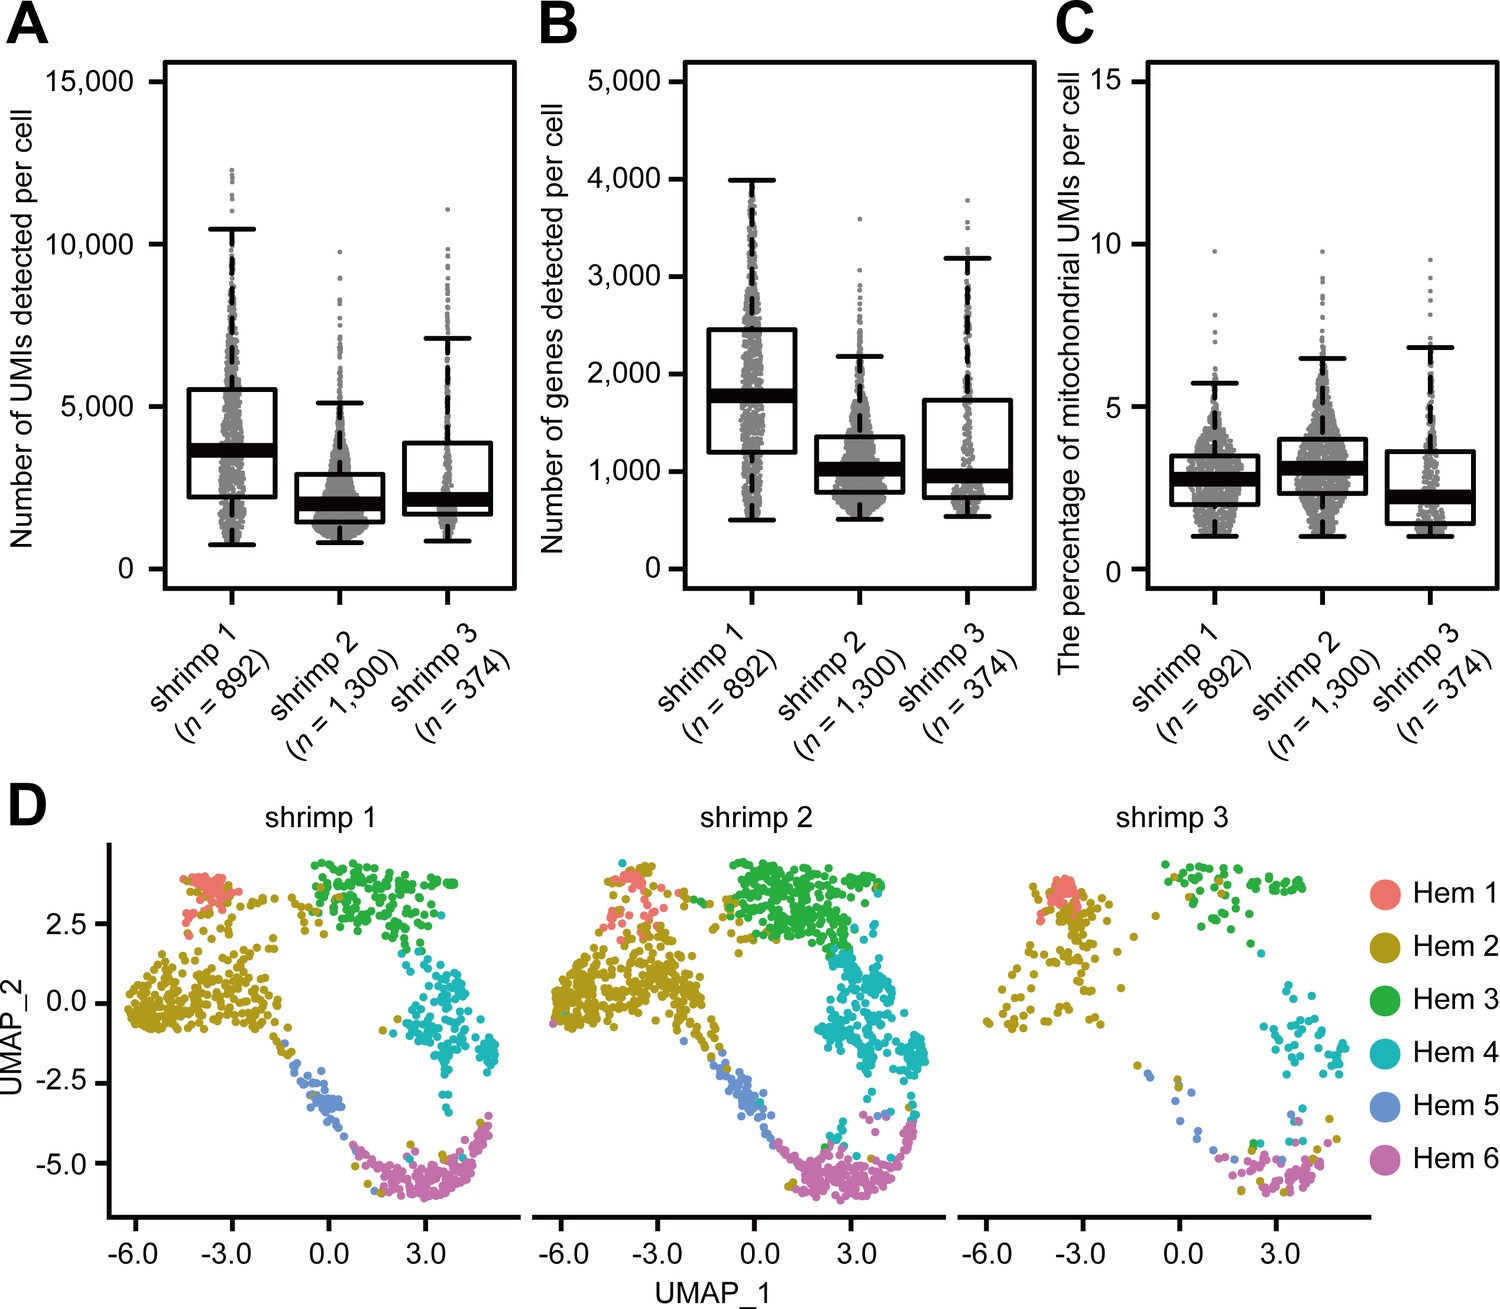
Sinaplots show the distribution of the number of transcripts (scored by unique molecular identifiers [UMIs]) (A), genes (B), and percentage of mitochondrial UMIs (C) detected per hemocyte on individual shrimp.
Uniform manifold approximation and projection plot of SCTransform batch corrected and integrated of hemocytes from individual shrimps (D).
-
Figure 2—figure supplement 1—source data 1
Excel sheets pertaining to UMIs, genes , mitochondrial UMIs detected per hemocyte on individual shrimp used for Figure 2—figure supplement 1A-C.
- https://cdn.elifesciences.org/articles/66954/elife-66954-fig2-figsupp1-data1-v2.xlsx
Figure 3
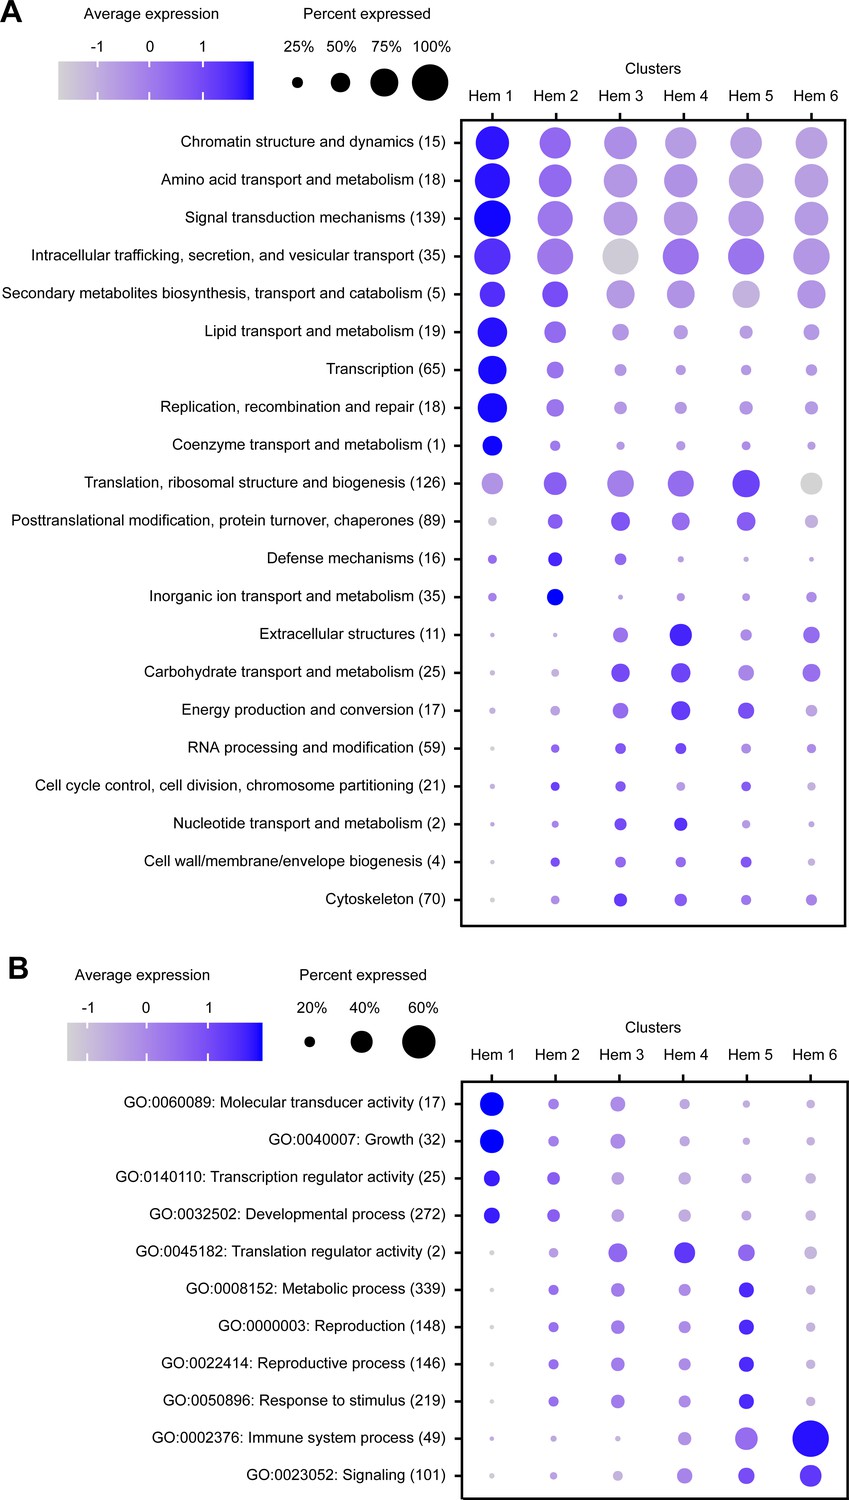
Dot plot profiling of the eukaryotic orthologous group (KOG) and gene ontology (GO) analyses in each cluster.
Dot plot representing the average expression of KOGs (A) and GOs (B) per cluster. Color gradient of dots represents the expression level, while the size represents the percentage of cells expressing any genes per cluster. The numbers in parentheses represent the number of genes estimated as distinct function of KOGs or GOs.
Figure 4

The cluster-specific marker genes predicted using the Seurat FindMarkers tool.
Heat map profile of the marker in each cluster (A). Color gradient represents the expression level of each single cell. The numbers in parentheses represent the number of genes estimated as markers of each cluster. Important marker genes in each cluster (B). Color gradient of the dot represents the expression level, while the size represents the percentage of cells expressing any genes per cluster. Detailed blast results of each marker on penaeid shrimp are listed in Supplementary file 2.
Figure 5 with 2 supplements
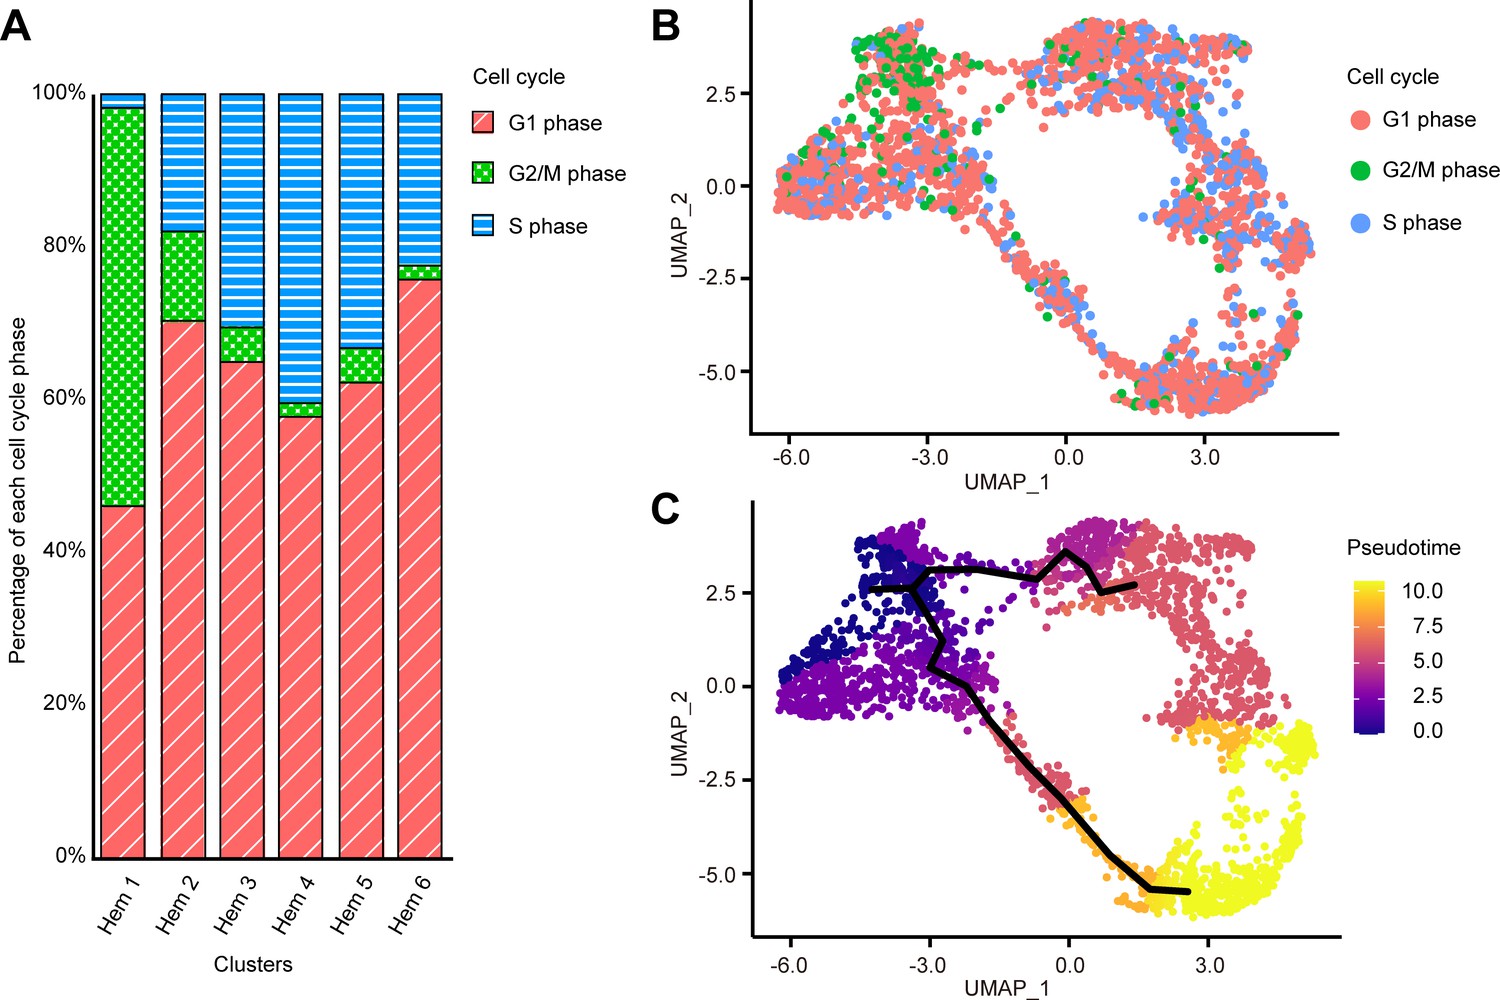
Cell cycle distribution of each cluster and pseudo-temporal ordering of hemocyte lineages.
Percentage of each cell cycle on clusters (A). Uniform manifold approximation and projection plot of cell cycles of hemocytes from three shrimps (n = 2566) (B). Visualization of clusters onto the pseudotime map using monocle 3 (C). The black lines indicate the main path of the pseudotime ordering of the cells. Color gradient of each dot represents the pseudotime.
-
Figure 5—source data 1
Source data of the percentage of each cell state per cluster used for Figure 5A.
- https://cdn.elifesciences.org/articles/66954/elife-66954-fig5-data1-v2.xlsx
Figure 5—figure supplement 1
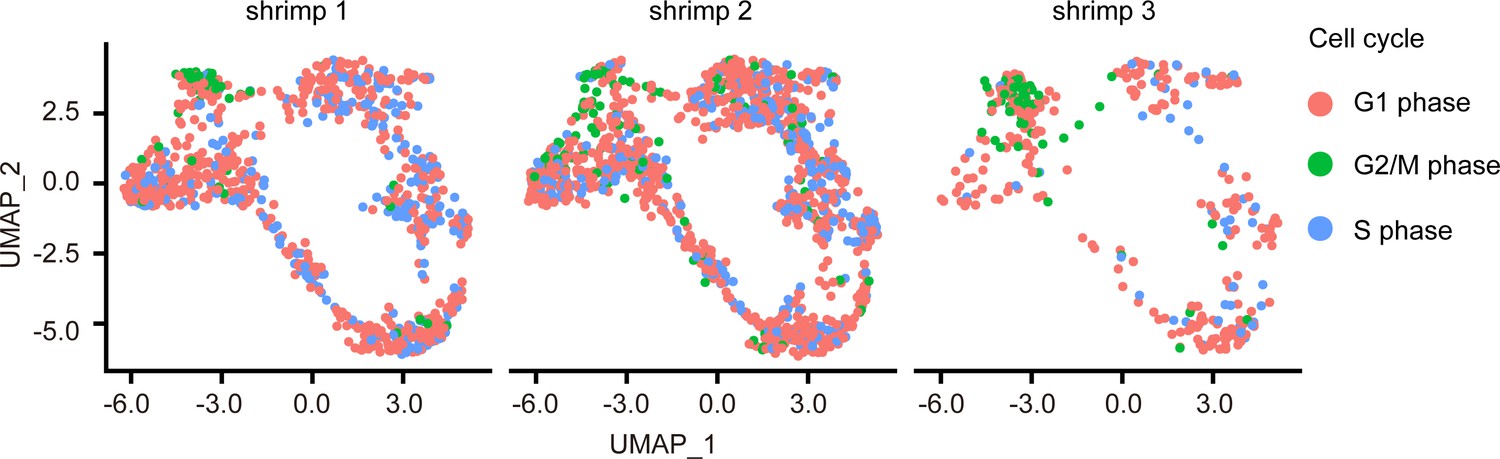
Uniform manifold approximation and projection plot of cell cycles from individual shrimps.
Batch effect was removed, and there were no differences between individuals.
Figure 5—figure supplement 2
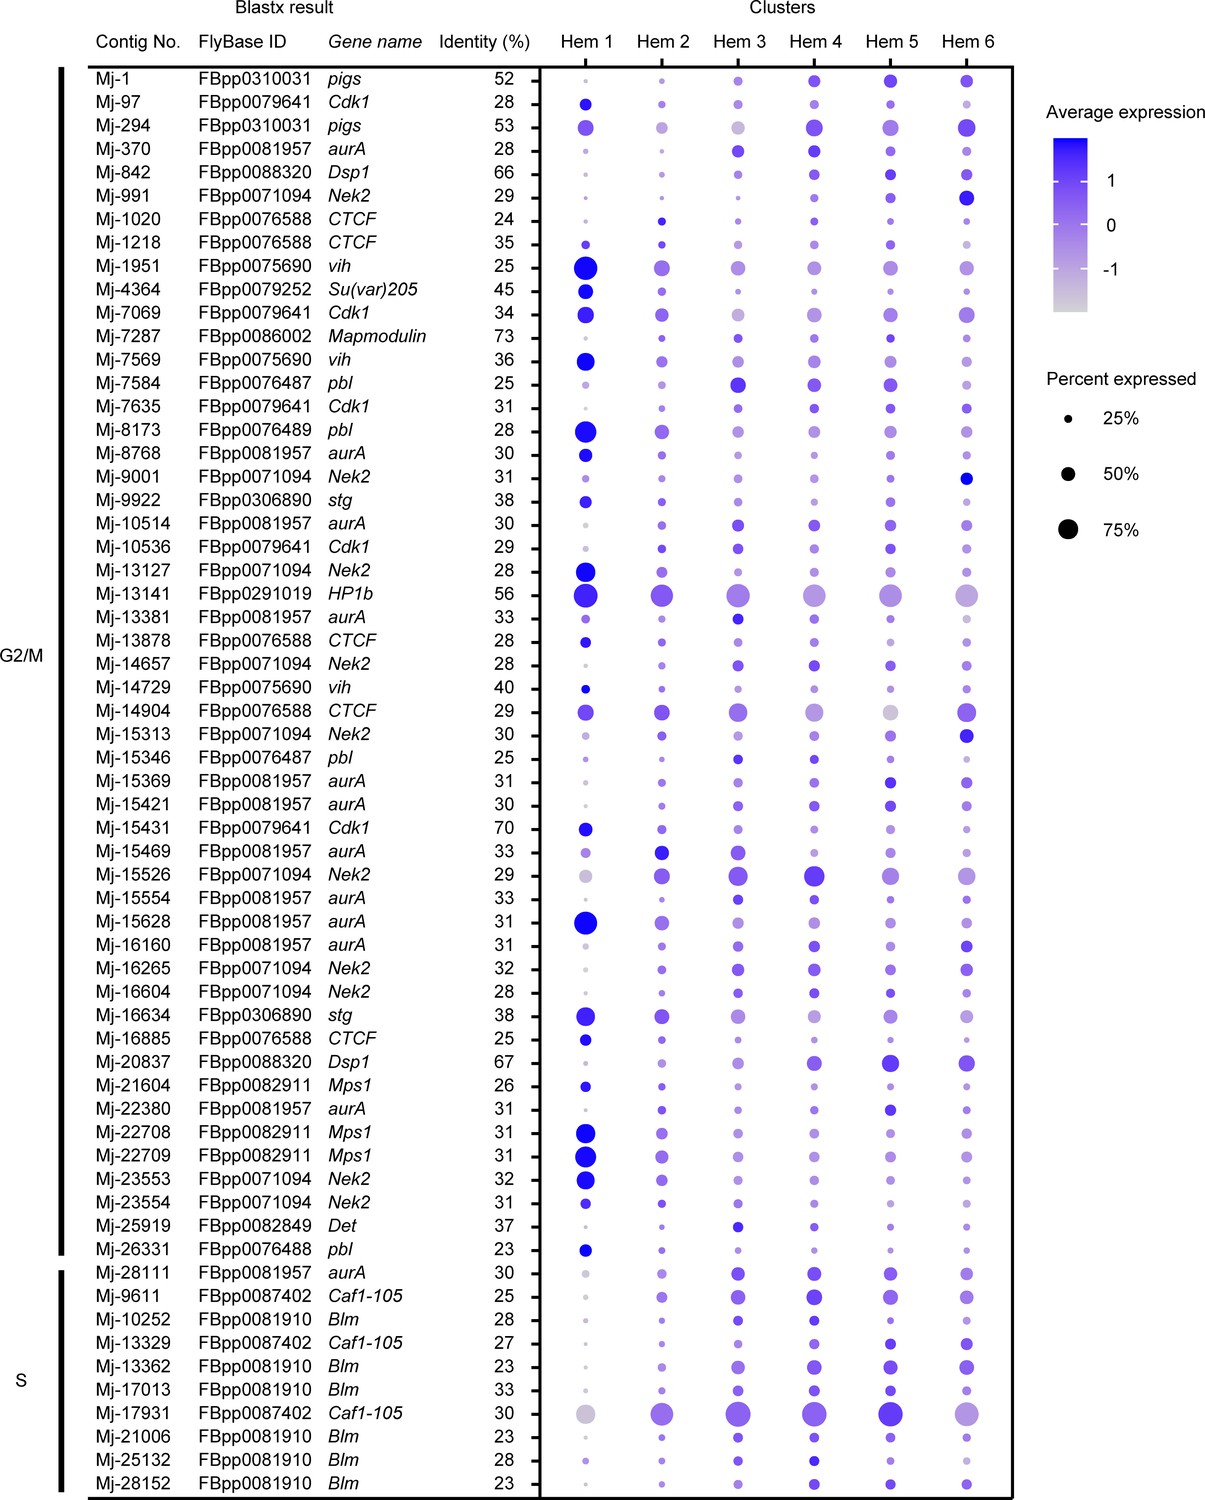
Dot plots profiling of cell cycle-related genes in each cluster.
Dot plot representing the average expression of G2/M and S phase-related genes per cluster. Color gradient of the dot represents the expression level, while the size represents the percentage of cells expressing any genes per cluster. Detailed blast results are listed in Supplementary file 3.
Figure 6
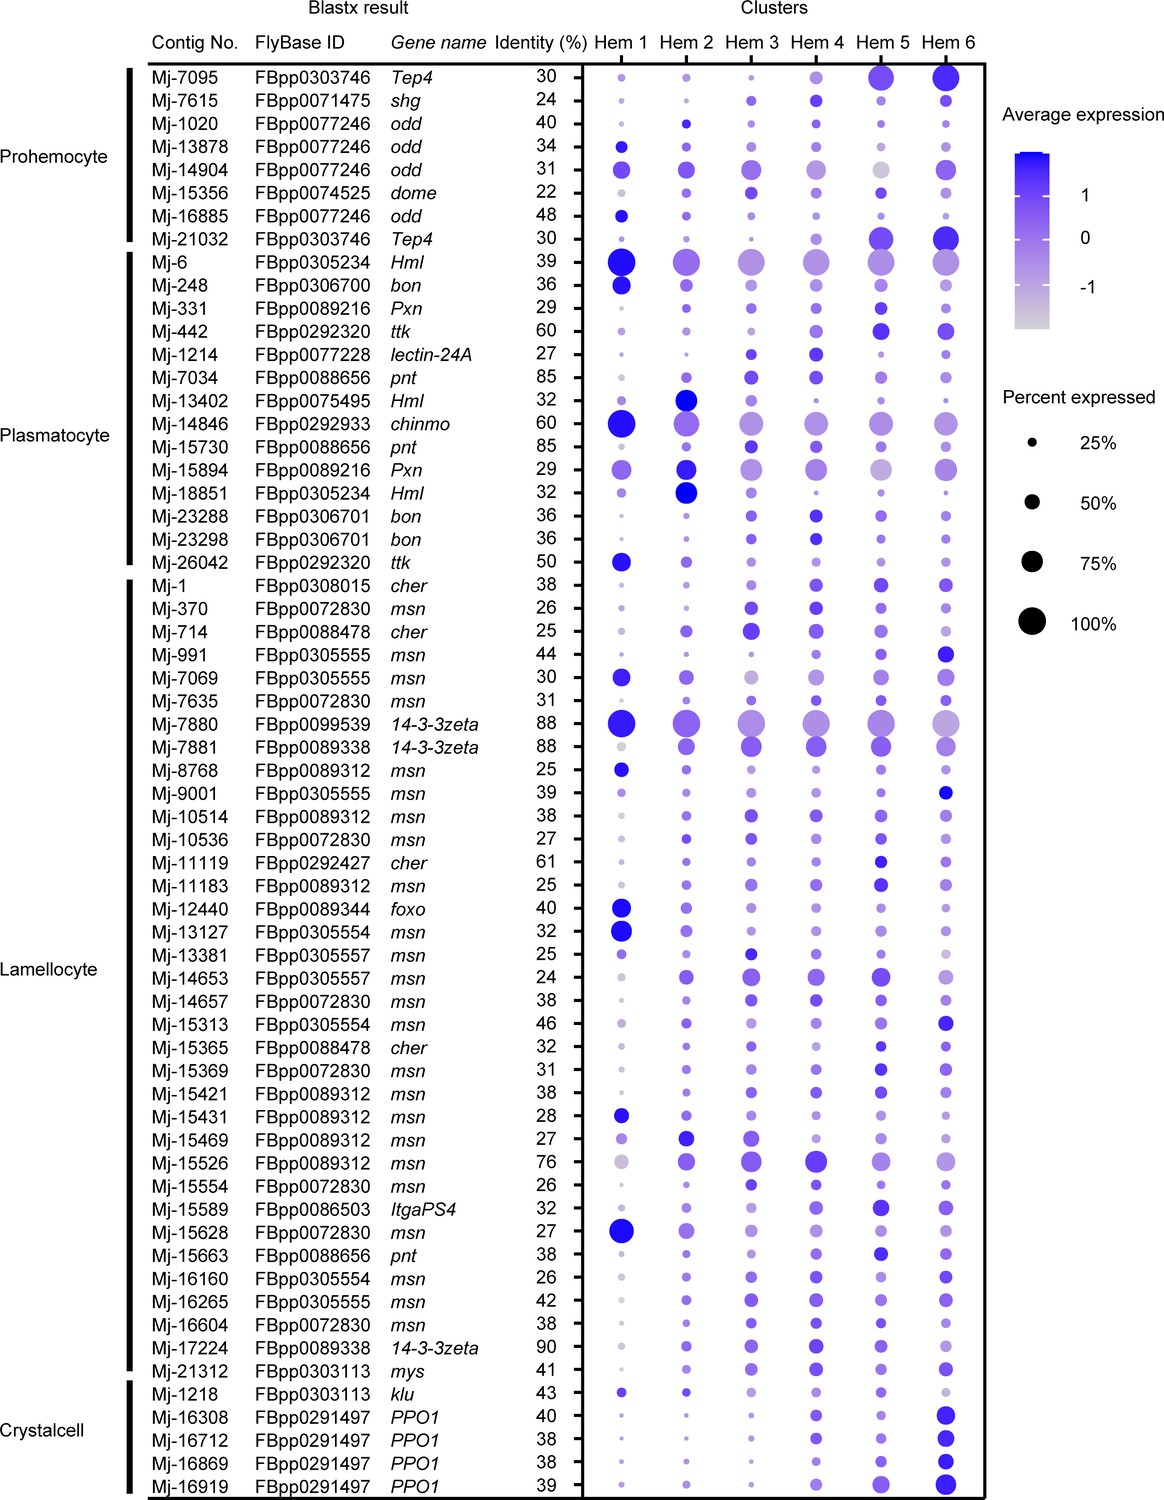
Dot plots profiling of Drosophila hemocyte-type markers in each cluster.
Color gradient of the dot represents the expression level, while the size represents the percentage of cells expressing any gene per cluster. Detailed blast results are listed in Supplementary file 4.
Figure 7

Cell growth-related gene expressions on clusters and single hemocytes.
Dot plots profiling of cell growth-related genes in each cluster (A). Color gradient of the dot represents the expression level, while the size represents the percentage of cells expressing any gene per cluster. Expression profiling of cell growth-related genes on uniform manifold approximation and projection plot (B). Color gradient of each dot represents the expression level. The details of the identified genes are listed in Supplementary file 1.
Figure 8 with 6 supplements

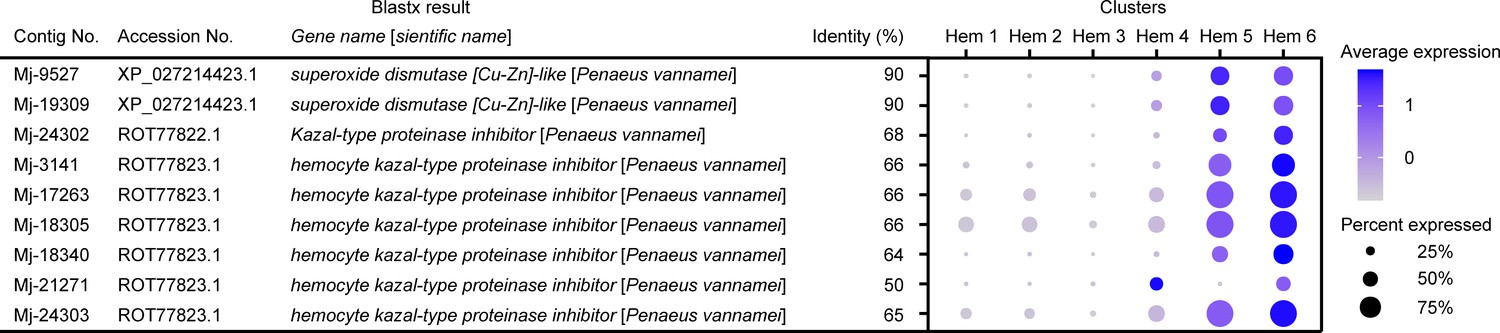
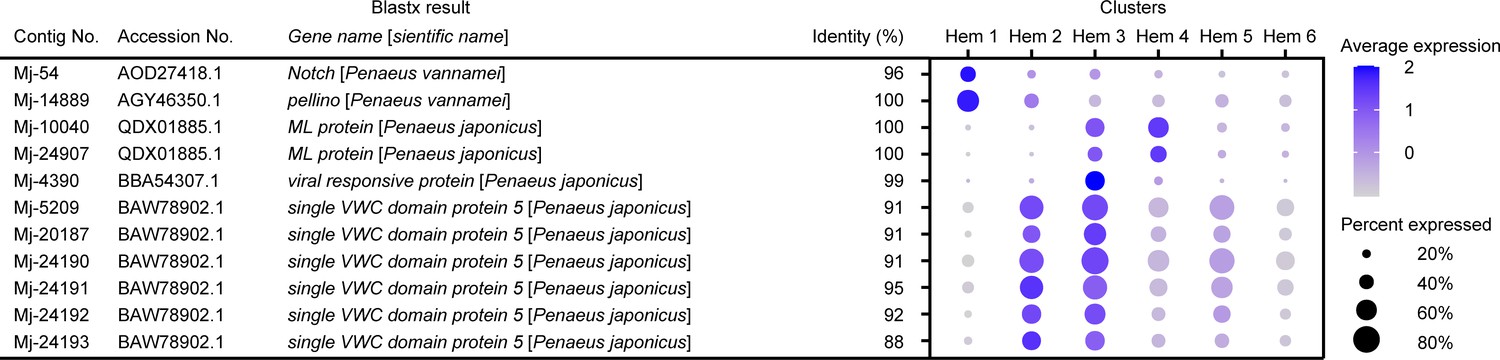
Dot plots and uniform manifold approximation and projection (UMAP) plot profiling of immune-related genes.
Dot plot representing the average expression of each immune-related gene per cluster (A). Color gradient of the dot represents the expression level, while the size represents the percentage of cells expressing any genes per cluster. The numbers in parentheses represents the number of genes estimated as immune-related. Expression profiling of immune-related genes on UMAP plot (B). Color gradient of each plot represents the expression level. The details of the identified genes are listed in Supplementary file 1.
Figure 8—figure supplement 1
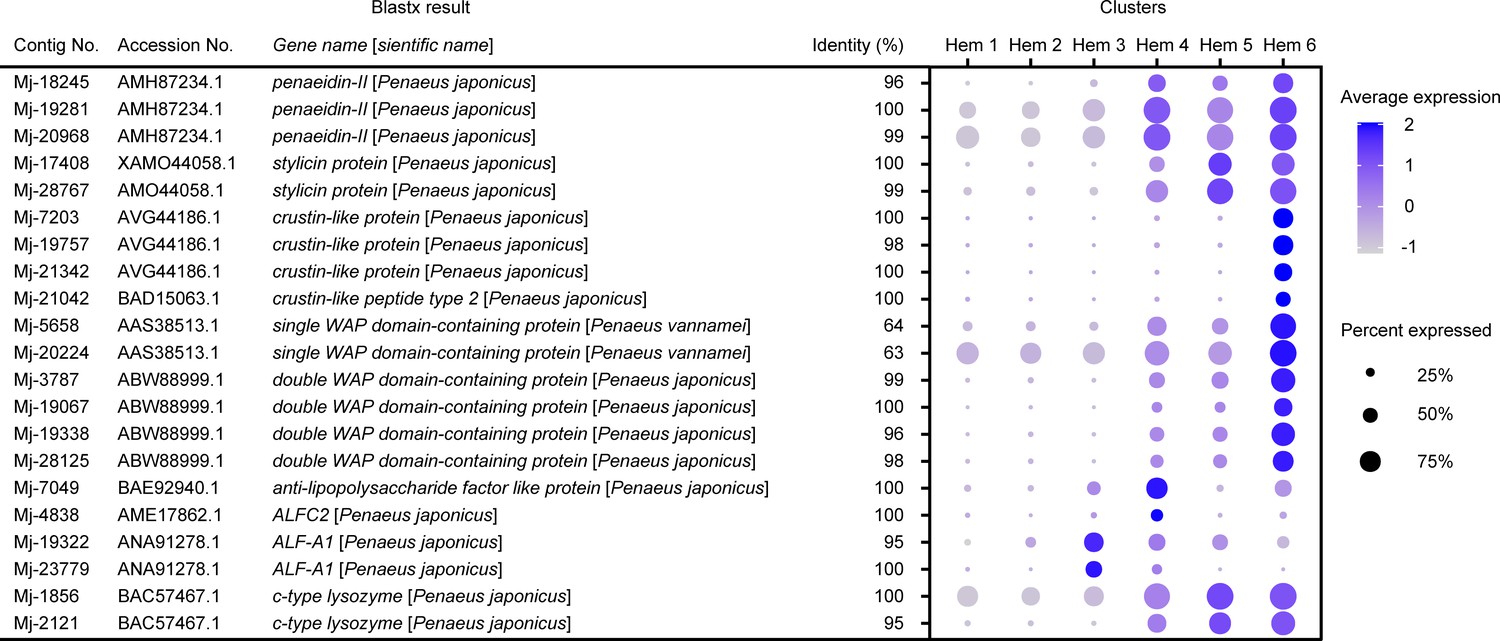
Dot plot representing the antibacterial peptides and lysozyme-related genes per cluster based on average expression.
Color gradient of the dot represents the expression level, while the size represents the percentage of cells expressing any gene per cluster. The details of the identified genes are listed in Supplementary file 1.
Figure 8—figure supplement 2
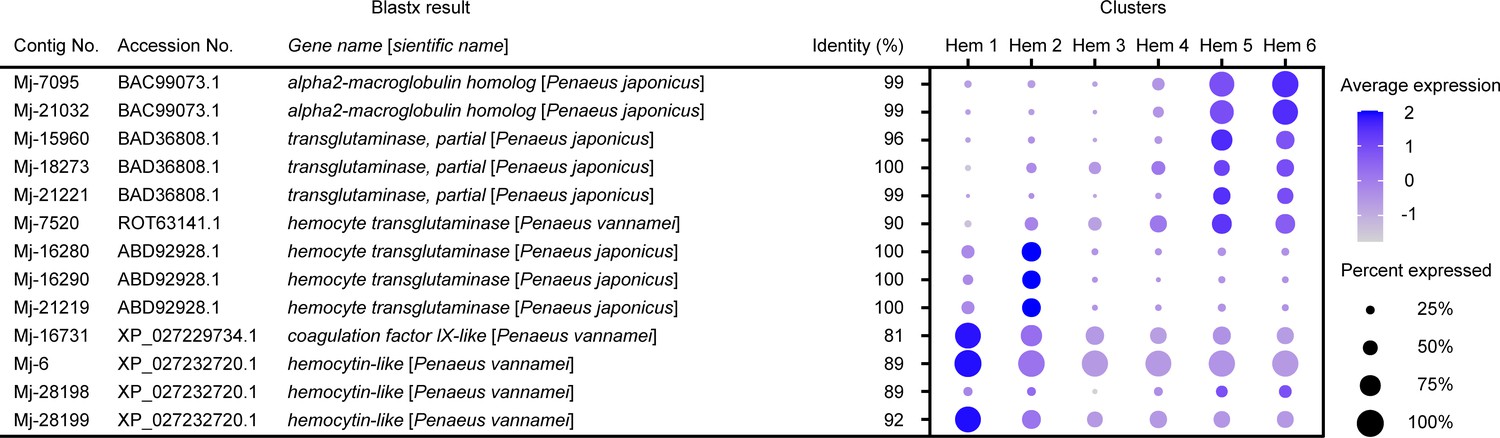
Dot plot representing the clotting-related genes per cluster based on average expression.
Color gradient of the dot represents the expression level, while the size represents the percentage of cells expressing any gene per cluster. The details of identified genes are listed in Supplementary file 1.
Figure 8—figure supplement 3
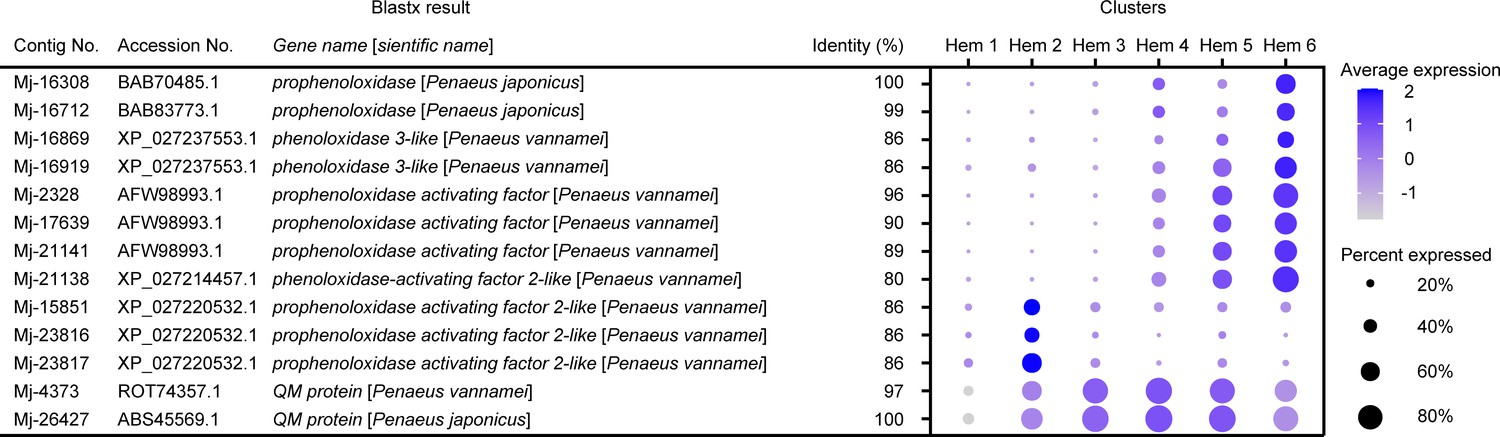
Dot plot representing the melanization-related genes per cluster based on average expression.
Color gradient of the dot represents the expression level, while the size represents the percentage of cells expressing any gene per cluster. The details of the identified genes are listed in Supplementary file 1.
Figure 8—figure supplement 4
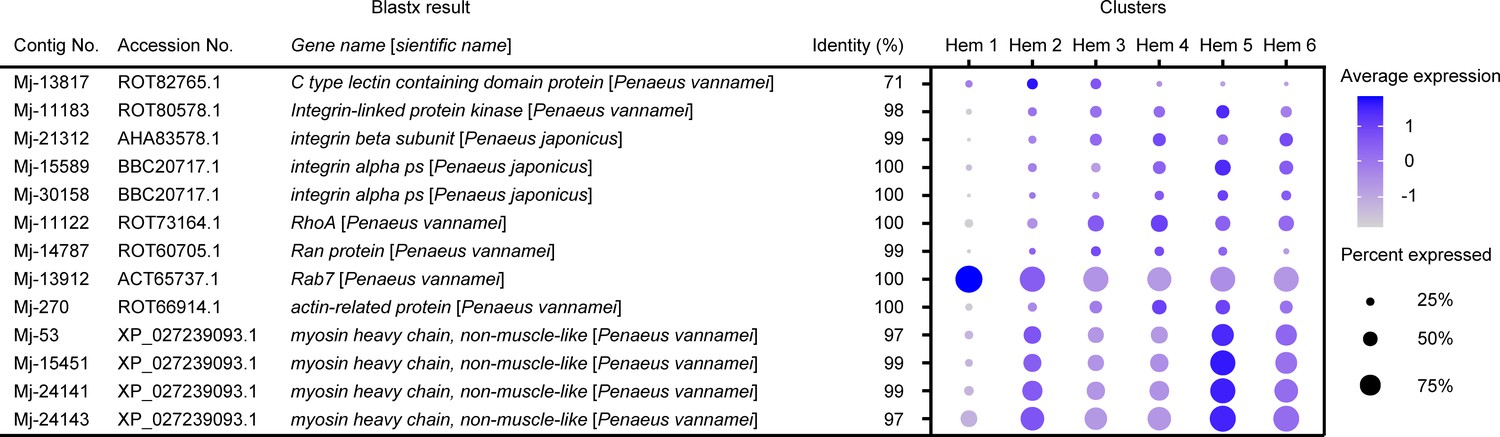
Dot plot representing the phagocytosis-related genes per cluster based on average expression.
Color gradient of the dot represents the expression level, while the size represents the percentage of cells expressing any gene per cluster. The details of the identified genes are listed in Supplementary file 1.
Figure 8—figure supplement 5
Dot plot representing the crayfish hemocyte marker genes per cluster based on average expression.
Color gradient of the dot represents the expression level, while the size represents the percentage of cells expressing any gene per cluster. The details of the identified genes are listed in Supplementary file 1.
Figure 8—figure supplement 6
Dot plot representing the other types of immune-related genes per cluster based on average expression.
Color gradient of the dot represents the expression level, while the size represents the percentage of cells expressing any gene per cluster. The details of the identified genes are listed in Supplementary file 1.
Figure 9 with 1 supplement
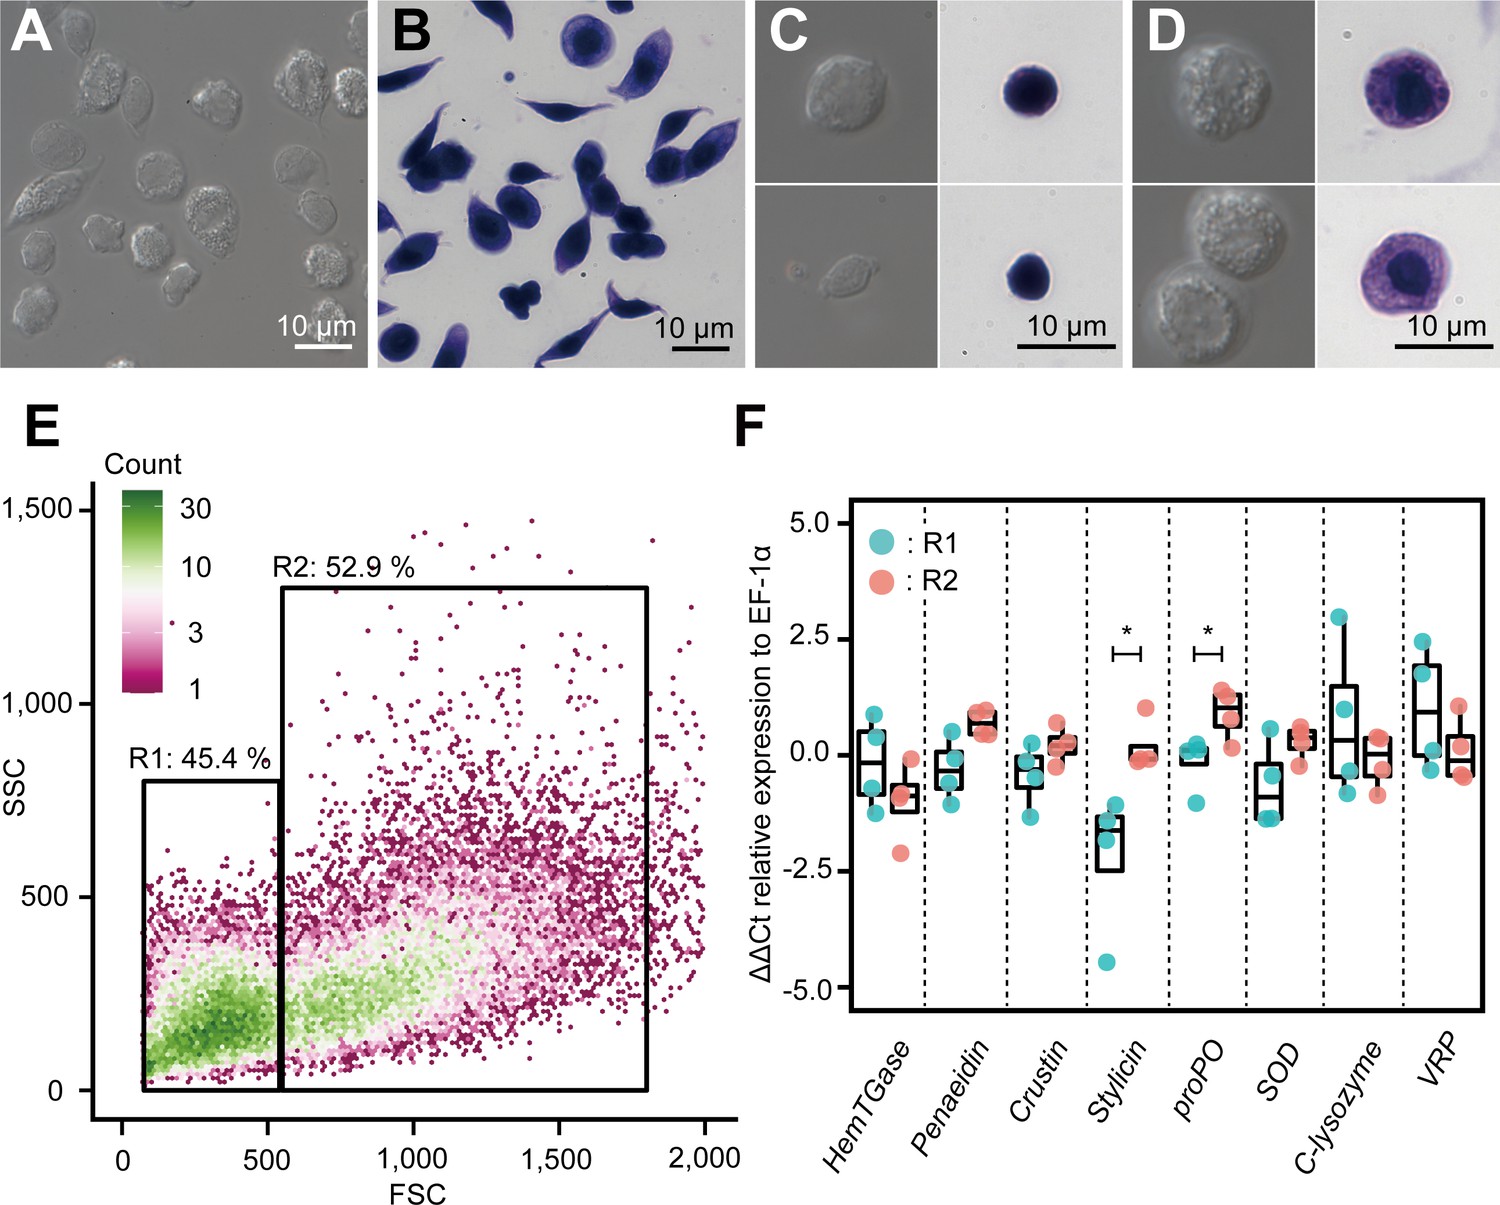
Morphological analysis of hemocytes and transcript profiles based on morphology.
(A) Differential interference contrast (DIC) image of unsorted total hemocytes. (B) Dye-stained total hemocytes. (C) DIC imaging and dye staining of region 1 (R1)-sorted hemocytes. (D) DIC imaging and dye staining of region 2 (R2)-sorted hemocytes. (E) Fluorescence-activated cell sorting (FACS) analysis of hemocytes. Based on the forward scatter (FSC) and side scatter (SSC) two-dimensional space, two regions (R1 and R2) were obtained. (F) Differential gene expression analysis between R1 and R2 of hemocytes sorted using FACS. ∆∆Ct values were analyzed using qRT-PCR. Higher ∆∆Ct values indicate a higher accumulation of mRNA transcripts. The p values shown in the figures are represented by *p<0.05.
-
Figure 9—source data 1
Source data for CT values of each gene used for Figure 9F.
- https://cdn.elifesciences.org/articles/66954/elife-66954-fig9-data1-v2.xlsx
Figure 9—figure supplement 1
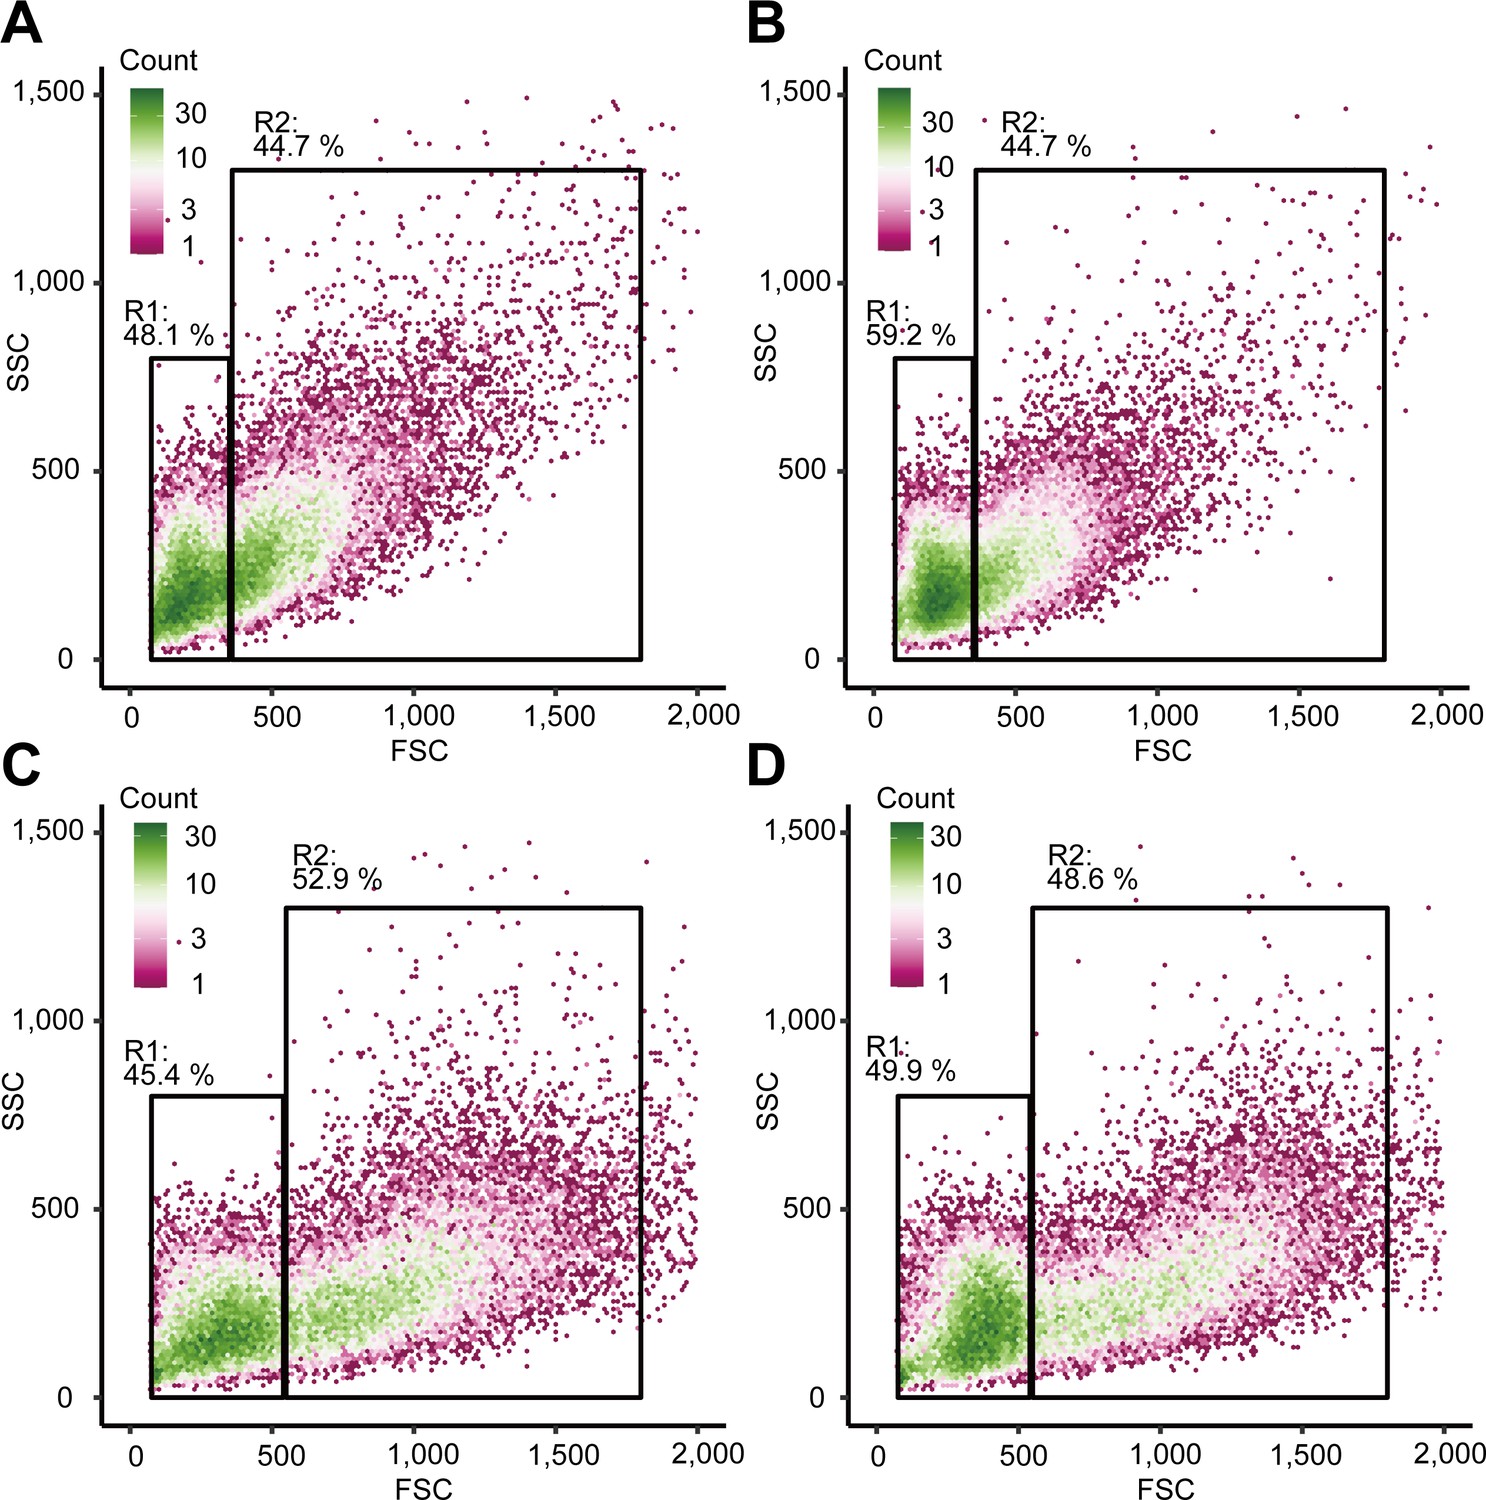
Ffluorescence-activated cell sorting analysis of hemocytes from four individual shrimps (A–D).
Based on the forward scatter (FSC) and side scatter (SSC) two-dimensional space, two regions (R1 and R2) were obtained.
Tables
Key resources table
| Reagent type (species) or resource | Designation | Source or reference | Identifiers | Additional information | |
|---|---|---|---|---|---|
| Biological sample (Marsupenaeus japonicus) | Hemocytes | NA | NA | Hemocytes from hemolymph from 20 g of kuruma shrimp | |
| Sequence-based reagent | 1st PCR primer | Macosko et al., 2015 | DOI: 10.1016/j.cell.2015.05.002 | AAGCAGTGGTATCAACGCAGAGT | |
| Sequence-based reagent | P5 universal primer | Illumina, Inc | NA | AATGATACGGCGACCACCGAGATCTACACGCCTGTCCGCGGAAGCAGTGGTATCAACGCAGAGT*A*C | |
| Sequence-based reagent | i7 index primer | Illumina, Inc | NA | N703: CAAGCAGAAGACGGCATACGAGATTTCTGCCTGTCTCGTGGGCTCGG N704: CAAGCAGAAGACGGCATACGAGATGCTCAGGAGTCTCGTGGGCTCGG N705: CAAGCAGAAGACGGCATACGAGATAGGAGTCCGTCTCGTGGGCTCGG | |
| Sequence-based reagent | Custom sequence primer | Macosko et al., 2015 | DOI: 10.1016/j.cell.2015.05.002 | GCCTGTCCGCGGAAGCAGTGGTATCAACGCAGAGTAC | |
| Sequence-based reagent | EF-1α | Koiwai et al., 2019 | DOI:10.1007/s12562-019-01311-5 sequence accession number: AB458256 | For: ATTGCCACACCGCTCACA Rev: TCGATCTTGGTCAGCAGTTCA | |
| Sequence-based reagent | HemTGase | Yeh et al., 2006 | DOI: 10.1016/j.bbapap.2006.04.005 sequence accession number: DQ436474 | For: GAGTCAGAAGTCGCCGAGTGT Rev: TGGCTCAGCAGGTCGTTTAA | |
| Sequence-based reagent | Penaeidin | An et al., 2016 | DOI: 10.1016/j.dci.2016.02.001 sequence accession number: KU057370 | For: TTAGCCTTACTCTGTCAAGTGTACGCC Rev: AACCTGAAGTTCCGTAGGAGCCA | |
| Sequence-based reagent | Crustin | Hipolito et al., 2014 | DOI: 10.1016/j.dci.2014.06.001 sequence accession number: AB121740 | For: AACTACTGCTGCGAAAGGTCTCA Rev: GGCAGTCCAGTGGCTTGGTA | |
| Sequence-based reagent | Stylicin | Liu et al., 2015 | DOI: 10.1016/j.fsi.2015.09.044 sequence accession number: KR063277 | For: GGCTCTTCCTTTTCACCTG Rev: GTCGGGCATTCTTCATCC | |
| Sequence-based reagent | proPO | Koiwai et al., 2019 | DOI: 10.1007/s12562-019-01311-5 sequence accession number: AB073223 | For: CCGAGTTTTGTGGAGGTGTT Rev: GAGAACTCCAGTCCGTGCTC | |
| Sequence-based reagent | SOD | Hung et al., 2014 | DOI: 10.1016/j.fsi.2014.07.030 sequence accession number: AB908996 | For: GCCGACACTTCCGACATCA Rev: TTTTGCTTCCGGGTTGGA | |
| Sequence-based reagent | C-lysozyme | Hikima et al., 2003 | DOI:10.1016/s0378-1119(03)00761-3 | For: ATTACGGCCGCTCTGAGGTGC Rev: CCAGCAATCGGCCATGTAGC | |
| Sequence-based reagent | VRP | Elbahnaswy et al., 2017 | DOI: 10.1016/j.fsi.2017.09.045 sequence accession number: LC179543 | For: CTACGGTCGCTACCTTCGTTTG Rev: TCAACAACGCTTCTGAACTTATTCC | |
| Commercial assay or kit | TRI REAGENT | Molecular Research Center, Inc | TR118 | NA | |
| Commercial assay or kit | Direct-zol RNA MiniPrep | Zymo Research | R2050 | NA | |
| Commercial assay or kit | Dynabeads Oligo(dT)25 | Thermo Fisher Scientific | DB61002 | NA | |
| Commercial assay or kit | Direct RNA Sequencing kit | Oxford Nanopore Technologies | SQK-RNA002 kit | NA | |
| Commercial assay or kit | MinION Flow Cell | Oxford Nanopore Technologies | Flow Cell R9.4.1 | NA | |
| Commercial assay or kit | Negative Photoresist | Nippon Kayaku Co., Ltd. | SU-8 3050 | NA | |
| Commercial assay or kit | Polydimethylsiloxane sylgard 184 | Dow Corning Corp. | SYLGARD 184 Silicone Elastomer Kit | NA | |
| Commercial assay or kit | Barcoded Bead SeqB | ChemGenes Corporation | MACOSKO-2011–10 | NA | |
| Commercial assay or kit | Maxima H Minus Reverse Transcriptase | Thermo Fisher Scientific | EP0751 | NA | |
| Commercial assay or kit | Exonuclease I | New England Biolabs | M0293S | NA | |
| Commercial assay or kit | KAPA HiFi HotStart ReadyMix | Roche Ltd. | KK2601 | NA | |
| Commercial assay or kit | KAPA HiFi DNA polymerase | Roche Ltd. | KK2103 | NA | |
| Commercial assay or kit | Agencourt AMPure XP beads | Beckman Coulter | A63882 | NA | |
| Commercial assay or kit | DNA Clean and Concentrator Kit | Zymo Research | D4013 | NA | |
| Commercial assay or kit | Qubit dsDNA HS Assay Kit | Thermo Fisher Scientific | Q32851 | NA | |
| Commercial assay or kit | High-Capacity cDNA Reverse Transcription Kit | Thermo Fisher Scientific | 4368814 | NA | |
| Commercial assay or kit | KOD SYBR qPCR | TOYOBO Co. Ltd. | QKD-201 | NA | |
| Cell staining solution | May-Grünwald‘s eosin methylene blue solution modified | Merck KGaA | 101424 | NA | |
| Cell staining solution | Giemsa’s Azure Eosin Methylene Blue solution | Merck KGaA | 109204 | NA | |
| Software, algorithm | Guppy v3.6.1 | Oxford Nanopore Technologies | NA | https://community.nanoporetech.com/ | |
| Software, algorithm | MinKNOW v3.6.5 | Oxford Nanopore Technologies | NA | https://community.nanoporetech.com/ | |
| Software, algorithm | TALC v1.01 | Broseus et al., 2020a, Broseus et al., 2020b | DOI: 10.1093/bioinformatics/btaa634 | https://gitlab.igh.cnrs.fr/lbroseus/TALC | |
| Software, algorithm | rnaSPAdes v3.14.1 | Bushmanova et al., 2019a, Bushmanova et al., 2019b | DOI: 10.1093/gigascience/giz100 | https://cab.spbu.ru/software/rnaspades/ | |
| Software, algorithm | Trinity 2.10.0 | Grabherr et al., 2011, Grabherr et al., 2018 | DOI: 10.1038/nbt.1883 | https://github.com/trinityrnaseq/trinityrnaseq/wiki | |
| Software, algorithm | EvidentialGene v2022.01.20 | Gilbert, 2019 | NA | http://arthropods.eugenes.org/EvidentialGene/ | |
| Software, algorithm | BUSCO v5.0.0 | Seppey et al., 1962 | DOI: 10.1007/978-1-4939-9173-0_14 | https://busco.ezlab.org/ | |
| Software, algorithm | Blast+ v2.2.31 | Altschul et al., 1990; Camacho et al., 2009 | DOI: 10.1016/s0022-2836(05)80360-2 DOI: 10.1186/1471-2105-10-421 | https://ftp.ncbi.nlm.nih.gov/blast/executables/blast+/LATEST/ | |
| Software, algorithm | Drop-seq tools v2.3.0 | McCarroll Lab Wysoker et al., 2020 | NA | https://github.com/broadinstitute/Drop-seq | |
| Software, algorithm | Picard Toolkit | Broad Institute Picard Toolkit, 2019 | NA | http://broadinstitute.github.io/picard/ | |
| Software, algorithm | STAR v2.7.8a | Dobin et al., 2013; Dobin et al., 2021 | DOI: 10.1093/bioinformatics/bts635 | https://github.com/alexdobin/STAR | |
| Software, algorithm | Surat v4.0.1 | Butler et al., 2018; Stuart et al., 2019 | DOI: 10.1038/nbt.4096 DOI: 10.1016/j.cell.2019.05.031 | https://satijalab.org/seurat/ | |
| Software, algorithm | Monocle 3 v0.2.3.0 | Trapnell et al., 2014, Trapnell et al., 2021 | DOI: 10.1038/nbt.2859 | https://github.com/cole-trapnell-lab/monocle3 | |
Additional files
-
Supplementary file 1
Table representing blastx researching of assembled genes against penaeid shrimp's proteins.
- https://cdn.elifesciences.org/articles/66954/elife-66954-supp1-v2.xlsx
-
Supplementary file 2
Table representing predicted marker genes per cluster.
- https://cdn.elifesciences.org/articles/66954/elife-66954-supp2-v2.xlsx
-
Supplementary file 3
Table representing blastx researching of assembled genes against Drosophila cell cycle markers.
- https://cdn.elifesciences.org/articles/66954/elife-66954-supp3-v2.xlsx
-
Supplementary file 4
Table representing blastx researching of assembled genes against Drosophila cell-type markers.
- https://cdn.elifesciences.org/articles/66954/elife-66954-supp4-v2.xlsx
-
Transparent reporting form
- https://cdn.elifesciences.org/articles/66954/elife-66954-transrepform-v2.docx
Download links
A two-part list of links to download the article, or parts of the article, in various formats.
Downloads (link to download the article as PDF)
Open citations (links to open the citations from this article in various online reference manager services)
Cite this article (links to download the citations from this article in formats compatible with various reference manager tools)
Single-cell RNA-seq analysis reveals penaeid shrimp hemocyte subpopulations and cell differentiation process
eLife 10:e66954.
https://doi.org/10.7554/eLife.66954


