Differences in interactions between transmembrane domains tune the activation of metabotropic glutamate receptors
- Physiology, Biophysics and Systems Biology Graduate Program, Weill Cornell Graduate School of Medical Sciences, United States
- Max Delbrück Center for Molecular Medicine, Germany
- Department of Biochemistry, Weill Cornell Medicine, United States
- Department of Pharmacological Sciences, Icahn School of Medicine at Mount Sinai, United States
- Tri-Institutional PhD Program in Chemical Biology, United States
- Leibniz-Forschungsinstitut für Molekulare Pharmakologie, Germany
- ISAR Bioscience Institute, Germany
Figures
Figure 1 with 5 supplements
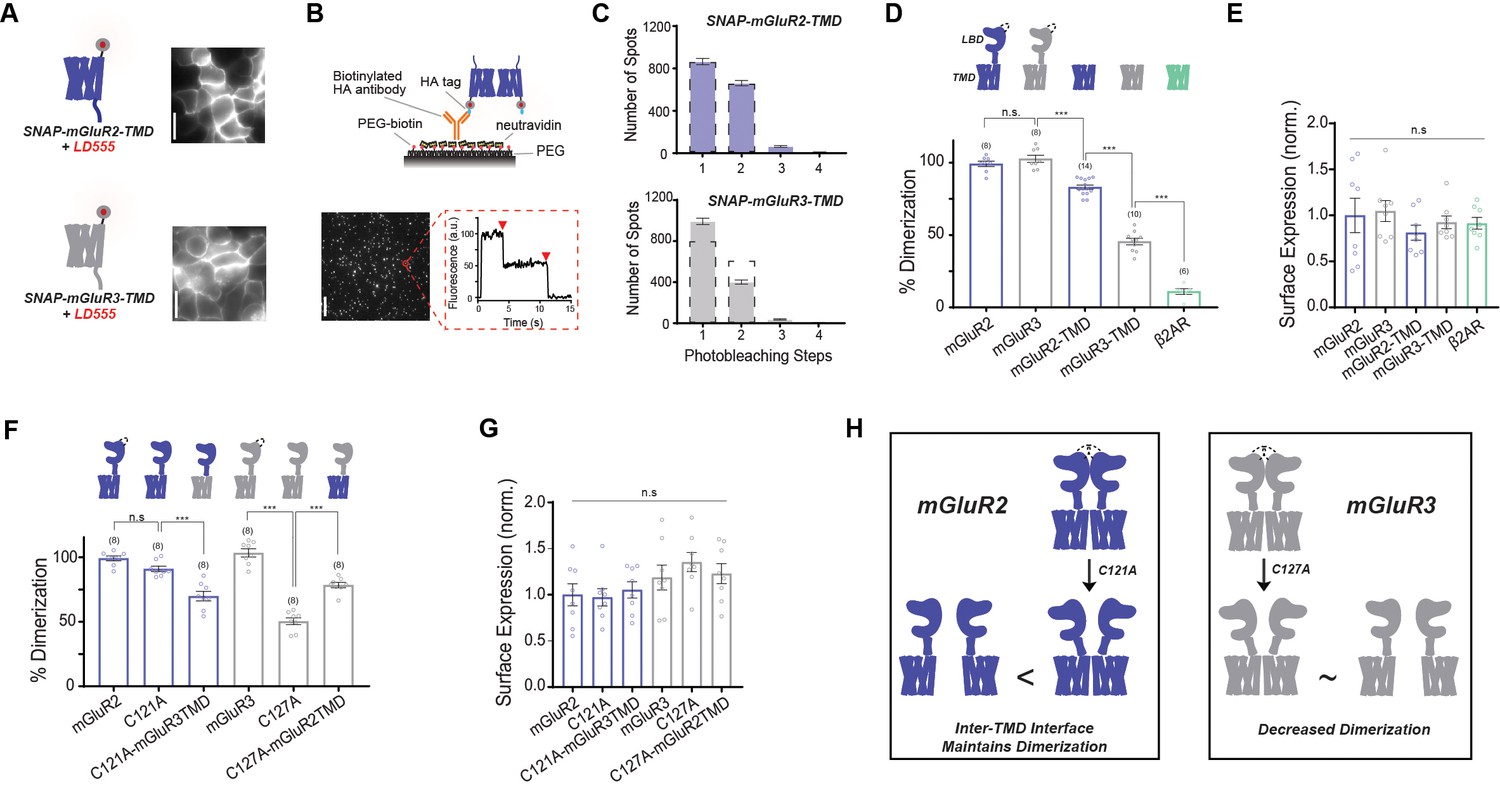
mGluR2 and mGluR3 transmembrane domains show different dimerization propensities in a single molecule pulldown assay.
(A) Left, cartoons of SNAP-mGluR2-TMD (top) and SNAP-mGluR3-TMD (bottom) labeled with fluorophore LD555. Right, representative images showing expression and surface labeling of SNAP-mGluR2-TMD (top) and SNAP-mGluR3-TMD (bottom) in HEK 293 T cells before lysis. (B) Top, schematic showing the SiMPull setup. Bottom, representative image of single molecules with representative fluorescence time course for an individual protein complex (red circle) demonstrating two-step photobleaching. Scale bar = 10 µm. (C) Histogram summarizing the photobleaching step distribution for SNAP-mGluR2-TMD (n = 1598 total spots from 14 movies) and SNAP-mGluR3-TMD (n = 1435 total spots from 10 movies). Dashed line on the SNAP-mGluR3-TMD plot shows the normalized photobleaching step distribution for SNAP-mGluR2-TMD for comparison. (D) Bar graph showing percent dimerization for SNAP-tagged constructs. * indicates statistical significance (one-way ANOVA, p=8.9E-30; Tukey-Kramer for mGluR2 vs. mGluR3 p=0.78, for mGluR3 vs. mGluR2-TMD p=6.9E-8, for mGluR2-TMD vs. mGluR3-TMD p=8.2E-13, for mGluR3-TMD vs. β2AR p=1.7E-12). (E) Bar graph showing surface expression for constructs in (D). Values are normalized to SNAP-mGluR2. Expression is not significantly different between constructs (one-way ANOVA, p=0.64). (F) Bar graph showing the percent dimerization for SNAP-tagged constructs. * indicates statistical significance (one-way ANOVA, p=2.1E-17; Tukey-Kramer for mGluR2 vs. mGluR2-C121A p=0.27, for mGluR2-C121A vs. mGluR2-C121A-mGluR3TMD p=2.5E-5, for mGluR3 vs. mGluR3-C127A p=1.1E-12, for mGluR3-C127A vs. mGluR3-C127A-mGluR2TMD p=4.1E-8). (G) Bar graph showing surface expression for constructs in (F). Values are normalized to SNAP-mGluR2. Expression is not significantly different between constructs (one-way ANOVA, p=0.12). (H) Schematic illustrating the effect of inter-TMD interactions in mGluR2 and mGluR3 dimer assembly. The '<' and '~' symbols refer to relative differences in dimerization propensity. Number of movies analyzed for each condition is shown in parenthesis above each bar. Error bars are s.e.m. Associated figure supplements include Figure 1—figure supplements 1–5.
-
Figure 1—source data 1
Data and statistics for Figure 1 and associated supplemental figures.
- https://cdn.elifesciences.org/articles/67027/elife-67027-fig1-data1-v2.xlsx
Figure 1—figure supplement 1
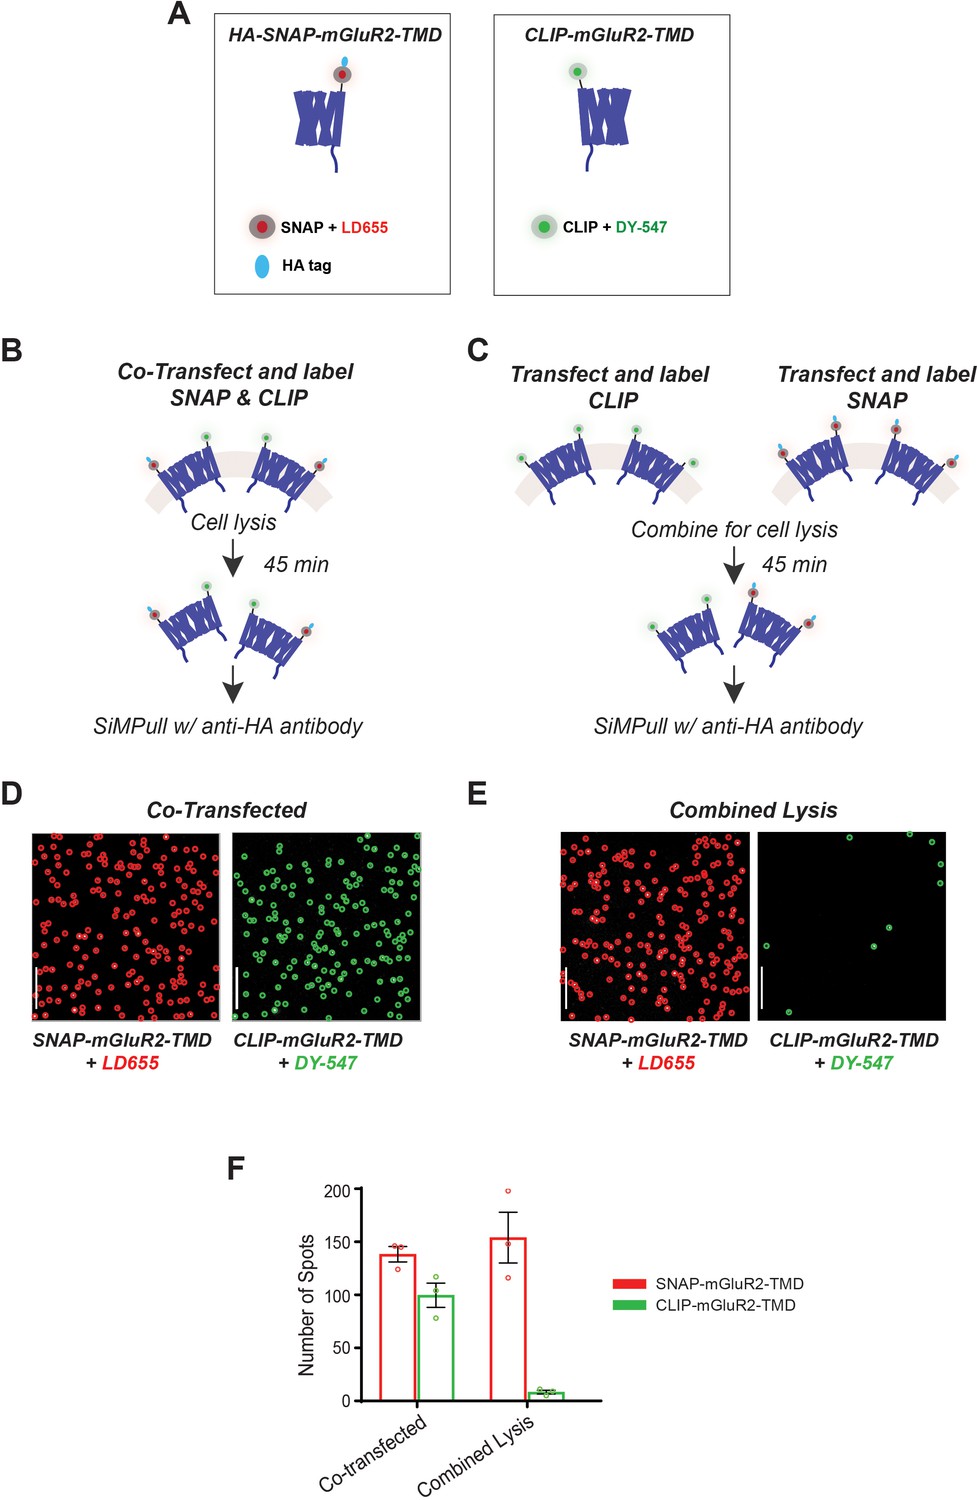
Further characterization of single-molecule pulldown of mGluR TMDs: lack of subunit exchange in detergent.
(A) Cartoons of mGluR2-TMD constructs. Left, a SNAP-tagged TMD is labeled with LD655 and has an HA tag for antibody pulldown. Right, a CLIP-tagged TMD is labeled with CLIP-Surface 547. (B) Schematic of experimental design in which cells are co-transfected with CLIP-mGluR2-TMD and SNAP-mGluR2-TMD constructs. (C) Schematic of experimental design in which cells are transfected with either CLIP-mGluR2-TMD or SNAP-mGluR2-TMD and combined just prior to cell lysis. (D) Representative single-molecule images of co-transfected HA-SNAP-mGluR2-TMD labeled with LD655 (red circled spots) and CLIP-mGluR2-TMD labeled with CLIP-Surface 547 (green circled spots). Molecules were imaged with a 640 nm laser (left) and a 561 nm laser (right). Scale bar = 10 µm. (E) Representative single-molecule images of HA-SNAP-mGluR2-TMD labeled with LD655 (red circled spots) and CLIP-mGluR2-TMD labeled with CLIP-547 (green circled spots) mixed prior to cell lysis. Molecules were imaged with a 640 nm laser (left) and a 561 nm laser (right). Scale bar = 10 µm. (F) Bar graph showing the total number of SNAP- or CLIP-mGluR2-TMD spots for the co-transfected condition and the condition in which cells were mixed just prior to lysis. Error bars represent s.e.m.
Figure 1—figure supplement 2
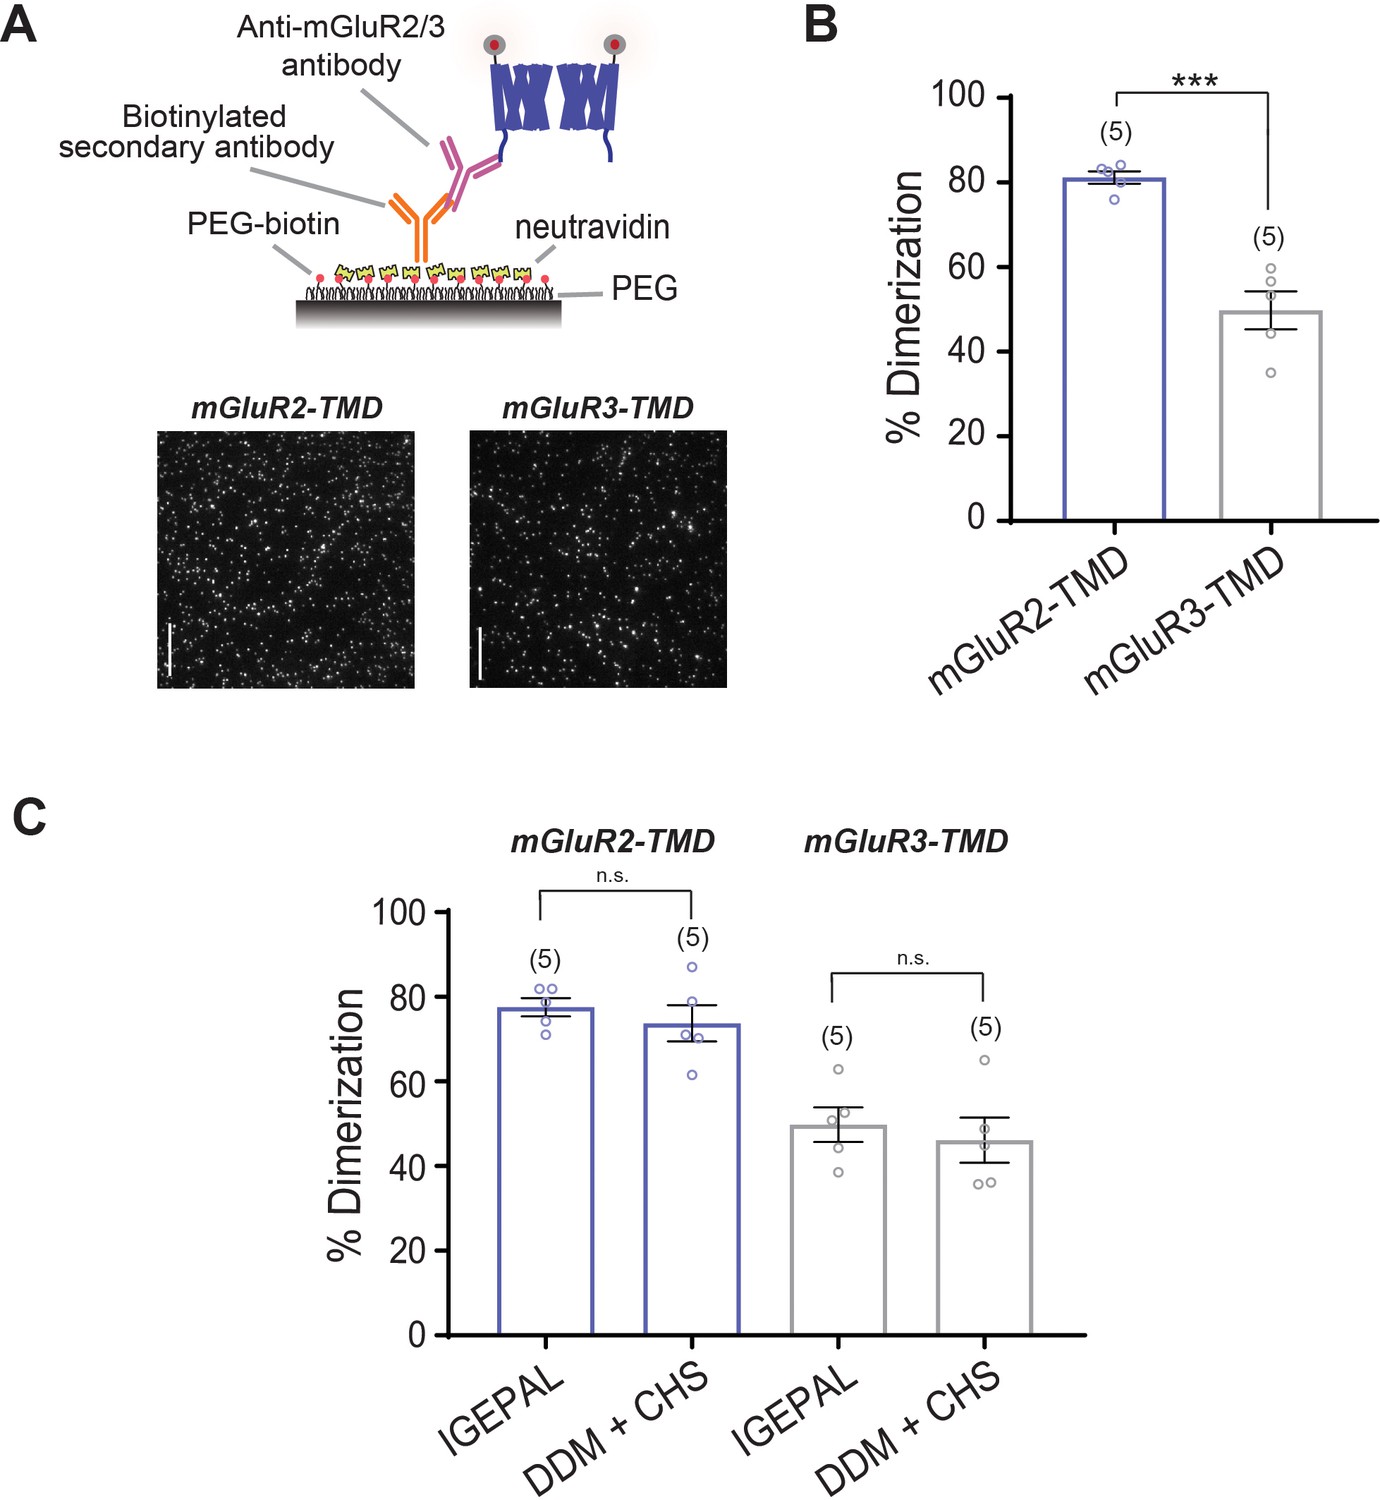
Inter-TMD dimerization propensities are maintained with C-terminal pulldown of mGluR2 and mGluR3 TMDs.
(A) Top, schematic showing SiMPull strategy with C-terminal pulldown. Bottom, representative single-molecule images of SNAP-mGluR2-TMD and SNAP-mGluR3-TMD pulled down via the C-terminal antibody. Scale bar = 10 µm. (B) Bar graph showing that dimer propensities characteristic of SNAP-mGluR2-TMD and SNAP-mGluR3-TMD are maintained upon C-terminal pulldown. * indicates statistical significance (unpaired t-test, p=0.0011). (C) Bar graph showing that dimer propensities characteristic of SNAP-mGluR2-TMD and SNAP-mGluR3-TMD are maintained in 0.1% IGEPAL detergent or 0.1% DDM detergent with 0.01% CHS. Number of movies analyzed for each condition is shown in parenthesis above each bar. Error bars represent s.e.m.
Figure 1—figure supplement 3
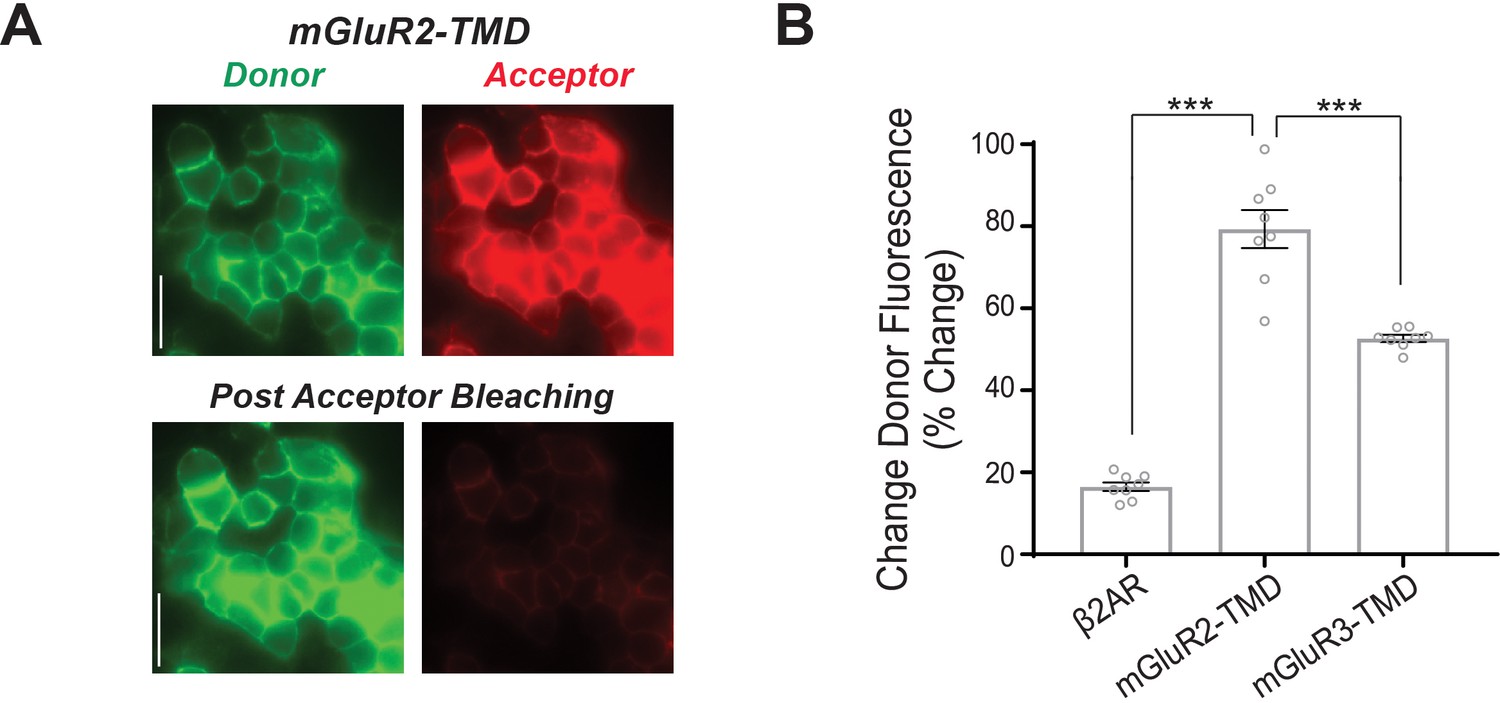
Ensemble FRET dequenching measurements show higher levels of inter-TMD FRET for mGluR2 compared to mGluR3.
(A) Representative donor and acceptor images of HEK 293 T cells before and after acceptor channel bleaching for SNAP-mGluR2-TMD. (B) Summary bar graph showing a significantly higher donor recovery for mGluR2-TMD compared mGluR3-TMD and the prototypical class A GPCR, ß2AR (unpaired t-tests; for ß2AR vs. mGluR2-TMD, p=1.3E-6; for mGluR2-TMD vs. mGluR3-TMD, p=0.00060). Error bars represent s.e.m.
Figure 1—figure supplement 4
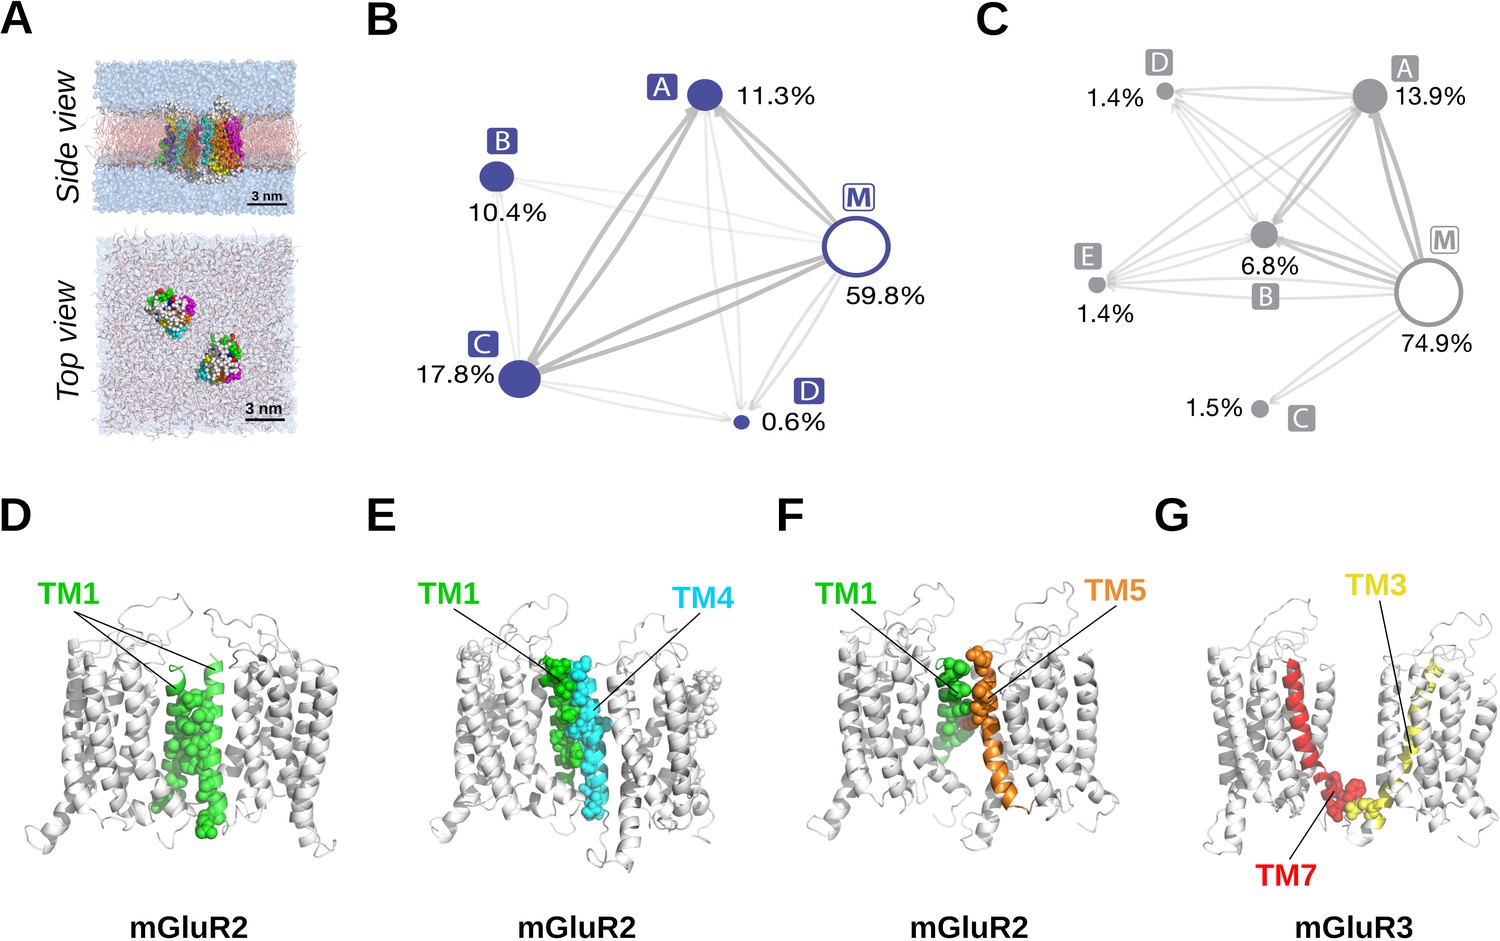
CG MD analysis of mGluR TMD dimerization.
(A) Coarse-grained (CG) representations of pairs of mGluR2 or mGluR3 simulated in a hydrated POPC bilayer. Scale bar = 3 nm. (B–C) Reactive flux between the different macrostates identified by the PCCA +analysis of the MSM analysis. Macrostates encompassing asymmetric dimers (i.e. tm1/tm4 and tm4/tm1) have been aggregated for the sake of clarity. The size of the nodes is proportional to the probability of each macrostate, and the thickness of the edges is proportional to the logarithm of the total reactive flux between the nodes. Microstates were defined by labels that contained the names of helices and loops of each protomer that formed more than 20 contacts with the other protomer, with contacts defined by a cutoff of 10 Å on the minimal distance over the beads of the residue. Total probability and fraction within a macrostate were calculated aggregating microstates if their labels contained the same helices but different loops, or if their labels were equivalent after swapping protomers. Microstates with total probability above 0.1% and macrostate fraction above 0.6% in either mGluR2 or mGluR3 are indicated below as part of the top macrostate they belong to for each receptor separately. (B) Reactive flux between the different macrostates identified for mGluR2; a consisting of 33.8% microstate (tm1,tm7)/tm4, 18.2% tm3/tm7, 7.9% (tm1,tm7)/tm3, 7.9% tm4/tm7, 5.1% (tm3,tm5)/tm7, 5.0% tm1/tm4, 4.5% tm5/tm7, 4.1% tm1/tm3, 3.9% tm1/tm5, 1.9% (tm3,tm5)/tm1, 1.5% (tm1,tm7)/(tm3,tm4), 1.0% (tm1,tm7)/(tm3,tm5), 0.6% (tm3,tm4)/tm1, 0.4% tm2/tm3, 0.3% tm4/tm4; b consisting of 32.2% microstate (tm1,tm7)/tm5, 8.5% (tm1,tm7)/(tm5,tm6), 6.1% tm2/tm5, 3.0% (tm2,tm7)/tm5, 2.4% (tm1,tm5)/tm2, 1.6% (tm5,tm7)/tm7, 1.0% (tm1,tm2)/(tm5,tm6), 1.0% (tm5,tm7)/tm2, 0.8% (tm5,tm6)/tm1; c consisting of 13.0% microstate (tm1,tm7)/(tm1,tm7), 8.8% (tm1,tm7)/tm7, 8.1% tm2/tm7, 6.0% tm7/tm7, 5.1% tm1/tm7, 4.4% (tm2,tm7)/tm7, 4.3% tm1/tm1, 3.8% (tm1,tm7)/tm1, 3.5% (tm1,tm2)/(tm1,tm7), 2.6% tm1/tm2, 1.9% (tm1,tm2)/tm7, 1.7% (tm2,tm7)/tm2, 1.5% (tm2,tm7)/(tm2,tm7), 1.5% (tm2,tm3)/tm7, 1.3% tm1/tm6, 1.2% (tm1,tm7)/tm2, 1.1% (tm1,tm2)/tm1, 0.8% (tm1,tm7)/(tm2,tm7), 0.8% (tm1,tm6)/tm1, 0.7% (tm3,tm4)/tm7, 0.7% tm2/tm2, 0.6% tm6/tm6, 0.3% (tm1,tm7)/(tm2,tm3); d consisting of 47.5% microstate tm3/tm6. (C) Reactive flux between the different macrostates identified for mGluR3; a' consisting of 17.6% microstate tm2/tm3, 10.9% tm3/tm7, 9.7% (tm1,tm7)/tm4, 9.1% (tm2,tm7)/tm3, 6.2% (tm1,tm7)/tm3, 5.2% (tm3,tm5)/tm2, 4.7% tm1/tm4, 4.3% (tm1,tm2)/tm4, 3.8% tm1/tm3, 3.5% (tm2,tm7)/tm4, 2.7% (tm3,tm5)/tm7, 2.4% tm4/tm7, 1.5% (tm3,tm5)/tm1, 1.4% (tm2,tm7)/(tm3,tm5), 1.2% (tm3,tm4)/tm1, 1.1% tm2/tm4, 1.1% (tm1,tm7)/(tm3,tm4), 0.8% (tm1,tm7)/tm2, 0.8% (tm1,tm7)/(tm2,tm3), 0.7% (tm2,tm7)/tm5, 0.7% (tm1,tm7)/(tm3,tm5), 0.5% (tm3,tm4)/tm7, 0.4% tm1/tm5, 0.4% tm2/tm5, 0.3% (tm2,tm3)/tm7, 0.3% (tm2,tm7)/tm2; b' consisting of 53.7% microstate (tm1,tm7)/(tm1,tm7), 15.1% (tm1,tm7)/tm7, 10.7% tm7/tm7, 4.3% tm1/tm7, 3.7% (tm1,tm7)/tm1, 3.3% tm2/tm7, 3.1% tm2/tm2, 1.4% (tm1,tm7)/(tm2,tm7), 1.3% (tm1,tm2)/(tm1,tm7), 0.6% (tm2,tm7)/tm7; c' consisting of 32.0% microstate tm3/tm4, 20.4% tm4/tm4, 16.0% (tm3,tm5)/tm4, 8.4% tm4/tm5; d' consisting of 56.6% microstate (tm1,tm7)/(tm5,tm6), 18.7% (tm5,tm6)/tm1, 8.6% (tm1,tm7)/tm5; e' consisting of 54.8% microstate (tm1,tm7)/tm4. (D–G) Representative structures of the largest macrostates identified by MSM analysis of simulations of mGluR2 ((D) macrostate c, (E) macrostate a, and (F) macrostate b) and mGluR3 ((G) macrostate a’). Representative coarse-grained configurations of the macrostates of mGluR2 or mGluR3 were clustered based on the RMSD of the corresponding interfaces. For a given interface, the least different configuration from all others was converted into an all-atom model using backward (Wassenaar et al., 2015). Interfacial residues within 4 Å are depicted as spheres. TM1: green, TM3: yellow, TM4: cyan, TM5: orange, TM7: red.
Figure 1—figure supplement 5
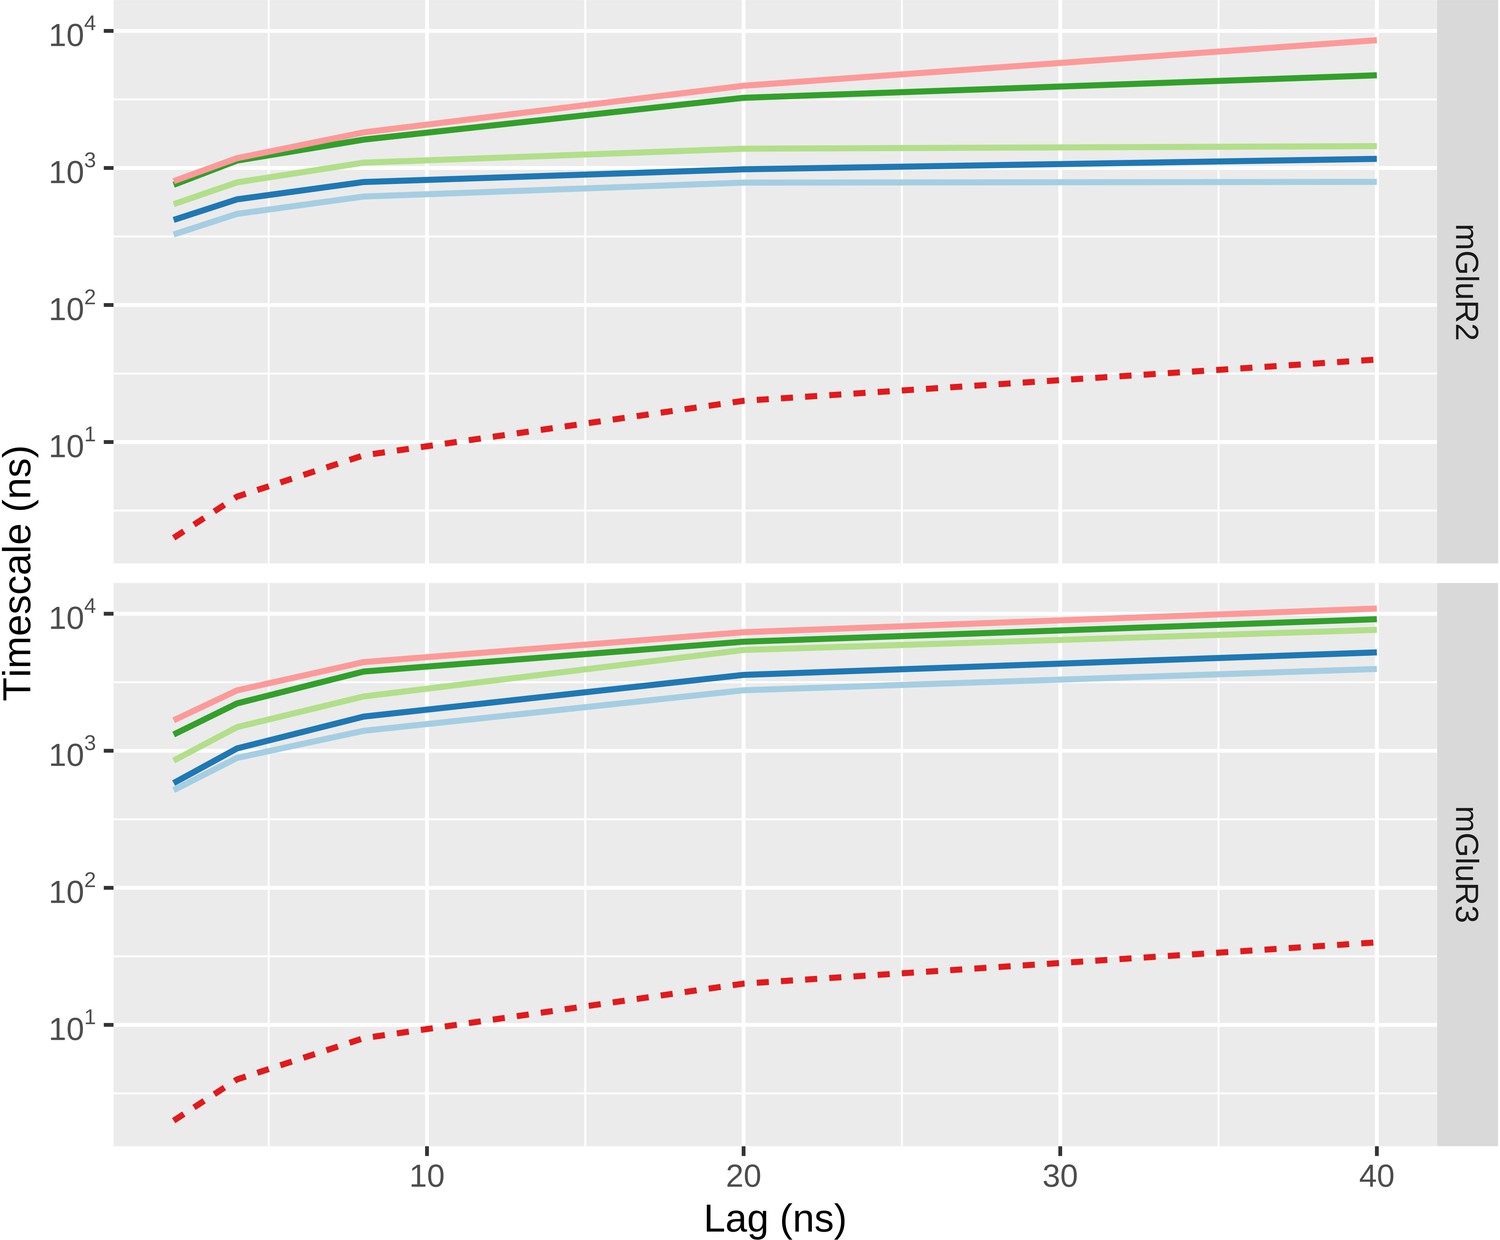
Implied timescales as a function of lag time for CG MD simulation.
The slowest five relaxation timescales are indicated by continuous lines. The limit of the smallest timescale that can be described at a given lag is shown in red.
Figure 2 with 6 supplements
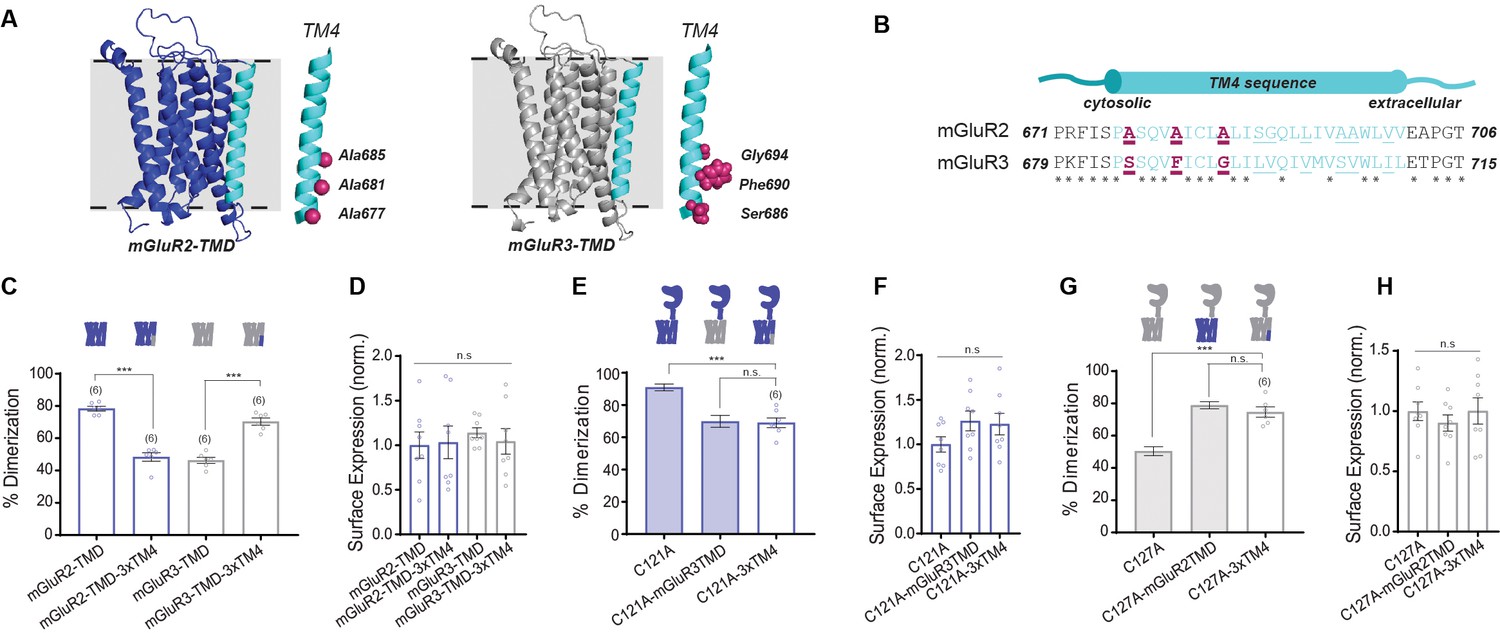
Residues in TM helix four mediate differences in inter-TMD interaction between mGluR2 and mGluR3.
(A) Homology models of the TMD of mGluR2 (purple) and mGluR3 (gray) showing TM4 (cyan) residues of interest in magenta. (B) TM4 sequence alignment for mGluR2 and mGluR3. (C) Bar graph showing percent dimerization for SNAP-tagged TMD constructs. * indicates statistical significance (one-way ANOVA, p=4.7E-10; Tukey-Kramer for mGluR2-TMD vs. mGluR2-TMD-3xTM4 p=1.5E-8, for mGluR3-TMD vs. mGluR3-TMD-3xTM4 p=5.3E-7). (D) Bar graph showing surface expression for constructs in (C). Values are normalized to SNAP-mGluR2-TMD. Expression is not significantly different between constructs (one-way ANOVA, p=0.91). (E) Bar graph showing percent dimerization for SNAP-tagged full-length constructs. * indicates statistical significance (one-way ANOVA, p=7.6E-5; Tukey-Kramer for mGluR2-C121A vs. mGluR2-C121A-3xTM4 p=0.00015, for mGluR2-C121A-mGluR3TMD vs. mGluR2-C121A-3xTM4 p=0.98). Shaded bars show repeated data from Figure 1F. (F) Bar graph showing surface expression for constructs in (E). Values are normalized to SNAP-mGluR2-C121A. Expression is not significantly different between constructs (one-way ANOVA, p=0.19). (G) Bar graph showing percent dimerization SNAP-tagged constructs labeled with LD555. * indicates statistical significance (one-way ANOVA, p=3.6E-7; Tukey-Kramer for mGluR3-C127A vs. mGluR3-C127A-3xTM4 p=1.5E-5, for mGluR3-C127A-mGluR2TMD vs. mGluR3-C127A-3xTM4 p=0.53). Shaded bars show repeated data from Figure 1F. (H) Bar graph showing surface expression for constructs in (G). Values are normalized to SNAP-mGluR3-C127A. Expression is not significantly different between constructs (one-way ANOVA, p=0.65). Number of movies analyzed for each condition is shown in parenthesis above each bar. Error bars are s.e.m. Associated figure supplements include Figure 2—figure supplements 1–6.
-
Figure 2—source data 1
Data and statistics for Figure 2 and associated supplemental figures.
- https://cdn.elifesciences.org/articles/67027/elife-67027-fig2-data1-v2.xlsx
Figure 2—figure supplement 1
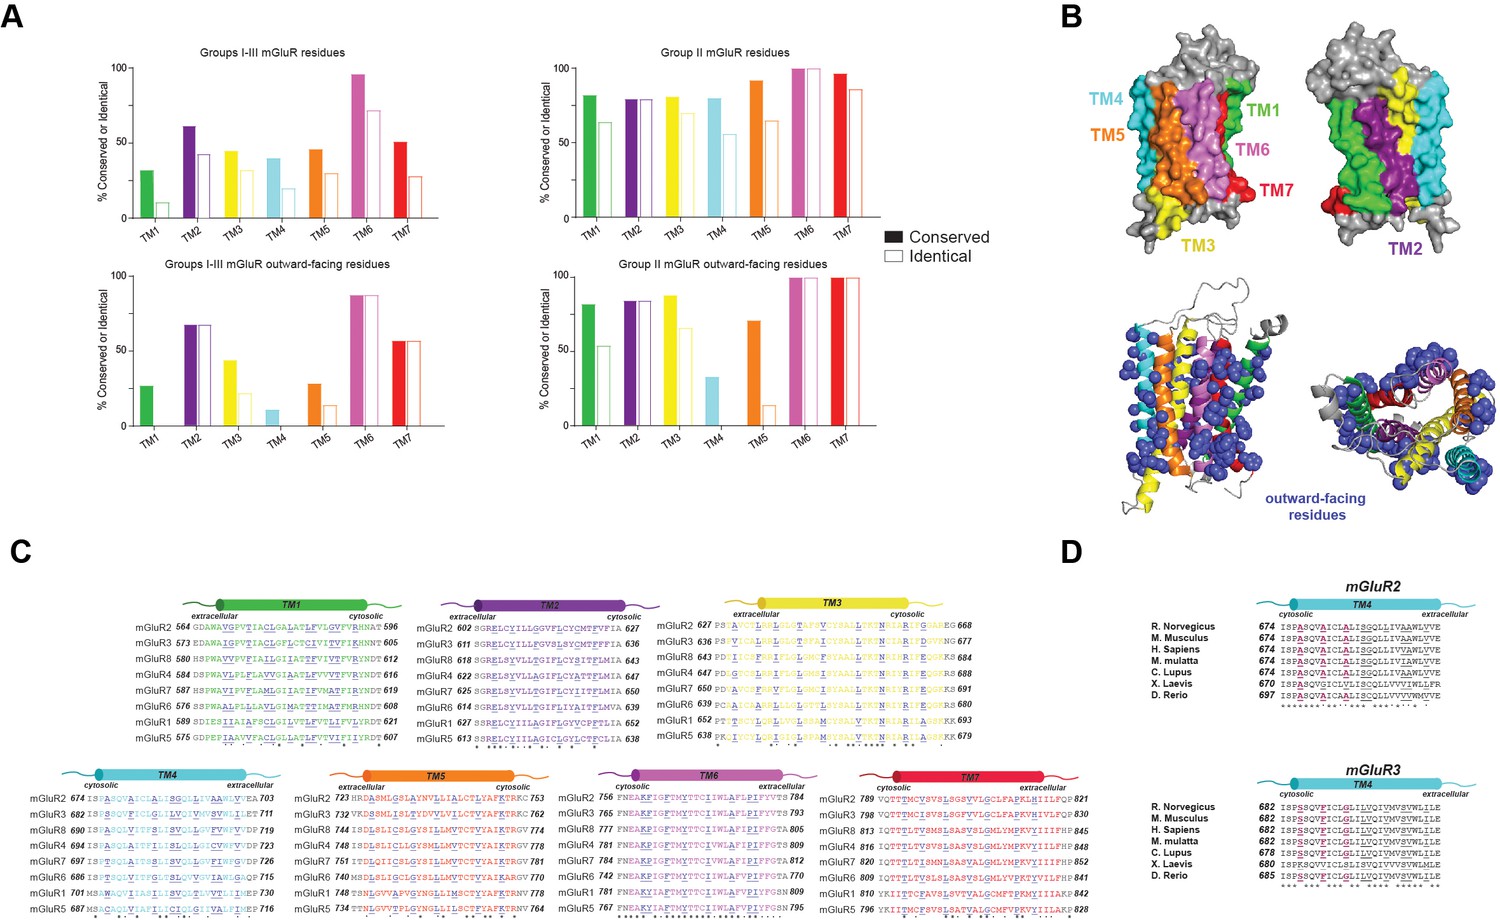
mGluR TMD sequence conservation analysis.
(A) Amino acid sequence alignments across the eight mGluR family members for all 7 TMs with outward-facing residues underlined and shown in purple. (B) Top, homology models of mGluR2-TMD in gray with TM helices highlighted. Bottom left, homology models of mGluR2-TMD showing side chains of outward-facing residues in purple. Bottom right, top view of model with outward-facing residues. (C) Quantification of percent conservation and identity across the 7 TM helices. (D) TM4 sequence alignment shows the 3xTM4 motif in mGluR2 and mGluR3 is mostly conserved across species.
Figure 2—figure supplement 2
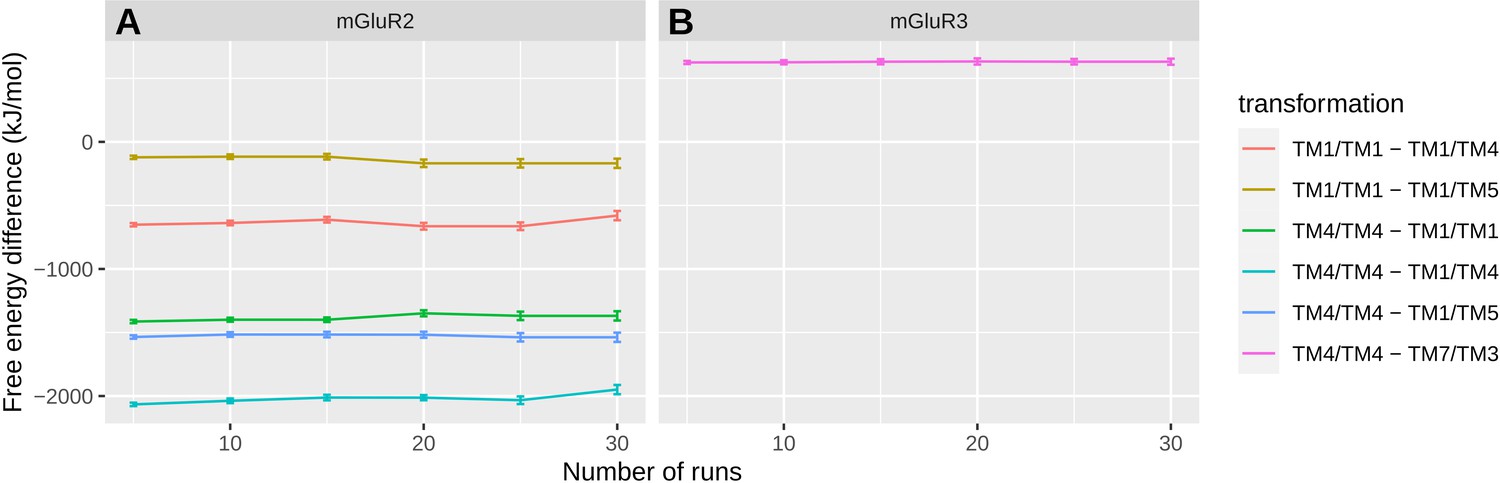
Convergence assessment of the free energy differences between representative dimeric configurations of highly populated macrostates.
(A) Free energy differences between identified dimeric configurations of mGluR2-TMD ((TM1,TM7)/(TM1,TM7), (TM1,TM7)/(TM4,TM3), (TM1,TM7)/(TM5)) and the asymmetric interface (TM1,TM7)/(TM1,TM7) or the symmetric interface (TM4)/(TM4). Convergence was assessed by calculating the differences between the respective free energies of these interfaces over an increasing number of runs. (B) Free energy differences between the dimeric configurations corresponding to the largest microstate of of mGluR3-TMD (TM2,TM7)/(TM3) and the symmetric interface (TM4)/(TM4). Convergence was assessed by calculating the differences between the respective free energies of these interfaces over an increasing number of runs.
Figure 2—figure supplement 3
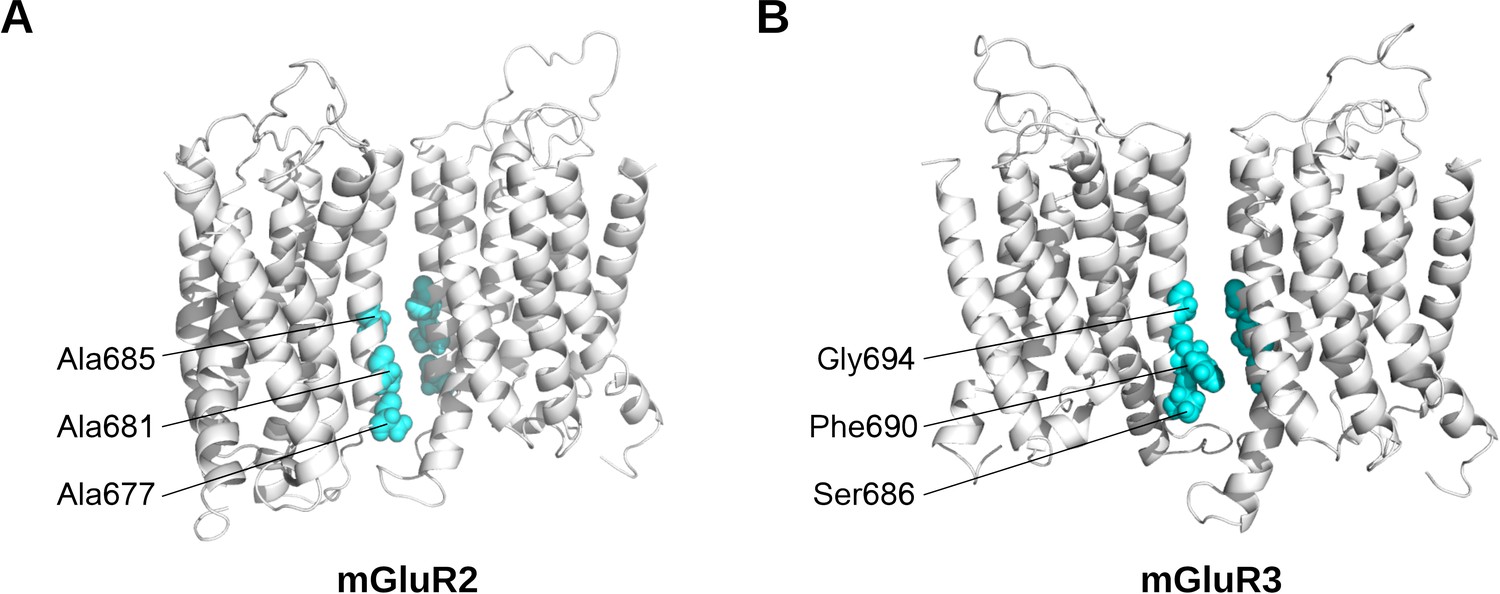
Symmetric TM4-TM4 interfaces for group II mGluR TMDs.
(A–B) Representative structures of TM4-TM4 dimeric microstates for mGluR2 (A) and mGluR3 (B) showing conserved residues (cyan) at the cytosolic end that differ between subtypes.
Figure 2—figure supplement 4
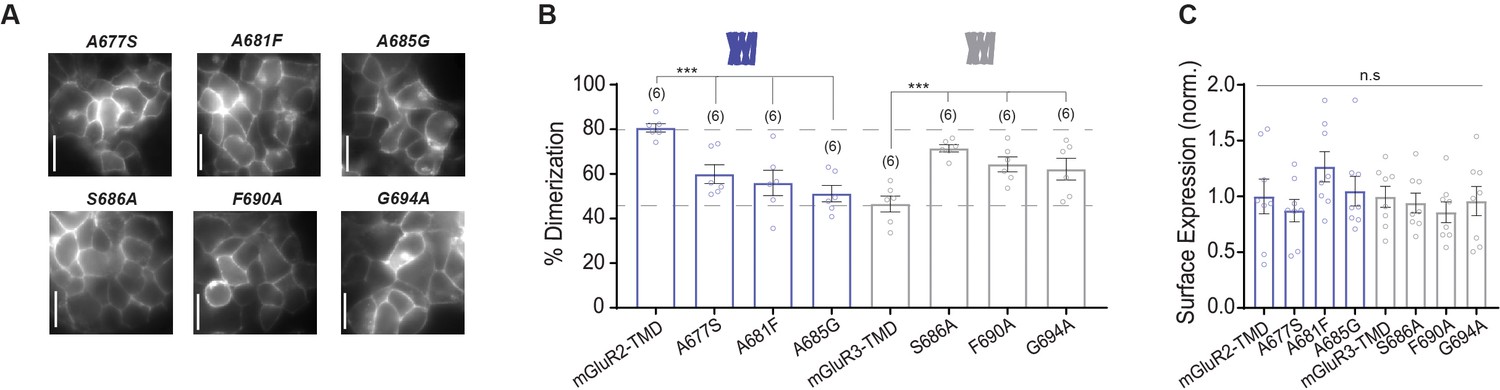
Further analysis of dimerization of TM4 mutants of mGluR2 and mGluR3 TMD constructs.
(A) Representative HEK 293 T cell images of single TM4 mutant constructs. Scale bar = 10 µm. (B) Bar graph showing percent dimerization for SNAP-tagged constructs labeled with LD555. Single TM4 mutant constructs alter SNAP-mGluR2-TMD or SNAP-mGluR3-TMD dimerization. * indicates statistical significance (one-way ANOVA for mGluR2 constructs, p=0.00029; Tukey-Kramer for mGluR2-TMD vs. mGluR2-TMD-A677S p=0.0091, for mGluR2-TMD vs. mGluR2-TMD-A681F p=0.0019, for mGluR2-TMD vs mGluR2-TMD-A685G p=0.00029; one-way ANOVA for mGluR3 constructs, p=0.00065; Tukey-Kramer for mGluR3-TMD vs. mGluR3-TMD-S686A p=0.00039, for mGluR3-TMD vs. mGluR3-TMD-F690A p=0.010, for mGluR3-TMD vs. mGluR3-TMD-G694A p=0.026). (C) Bar graph showing surface expression for constructs in (B). Values are normalized to SNAP-mGluR2-TMD. Expression is not significantly different between constructs (one-way ANOVA, p=0.34). Number of movies analyzed for each condition is in parenthesis above each bar. Error bars represent s.e.m.
Figure 2—figure supplement 5
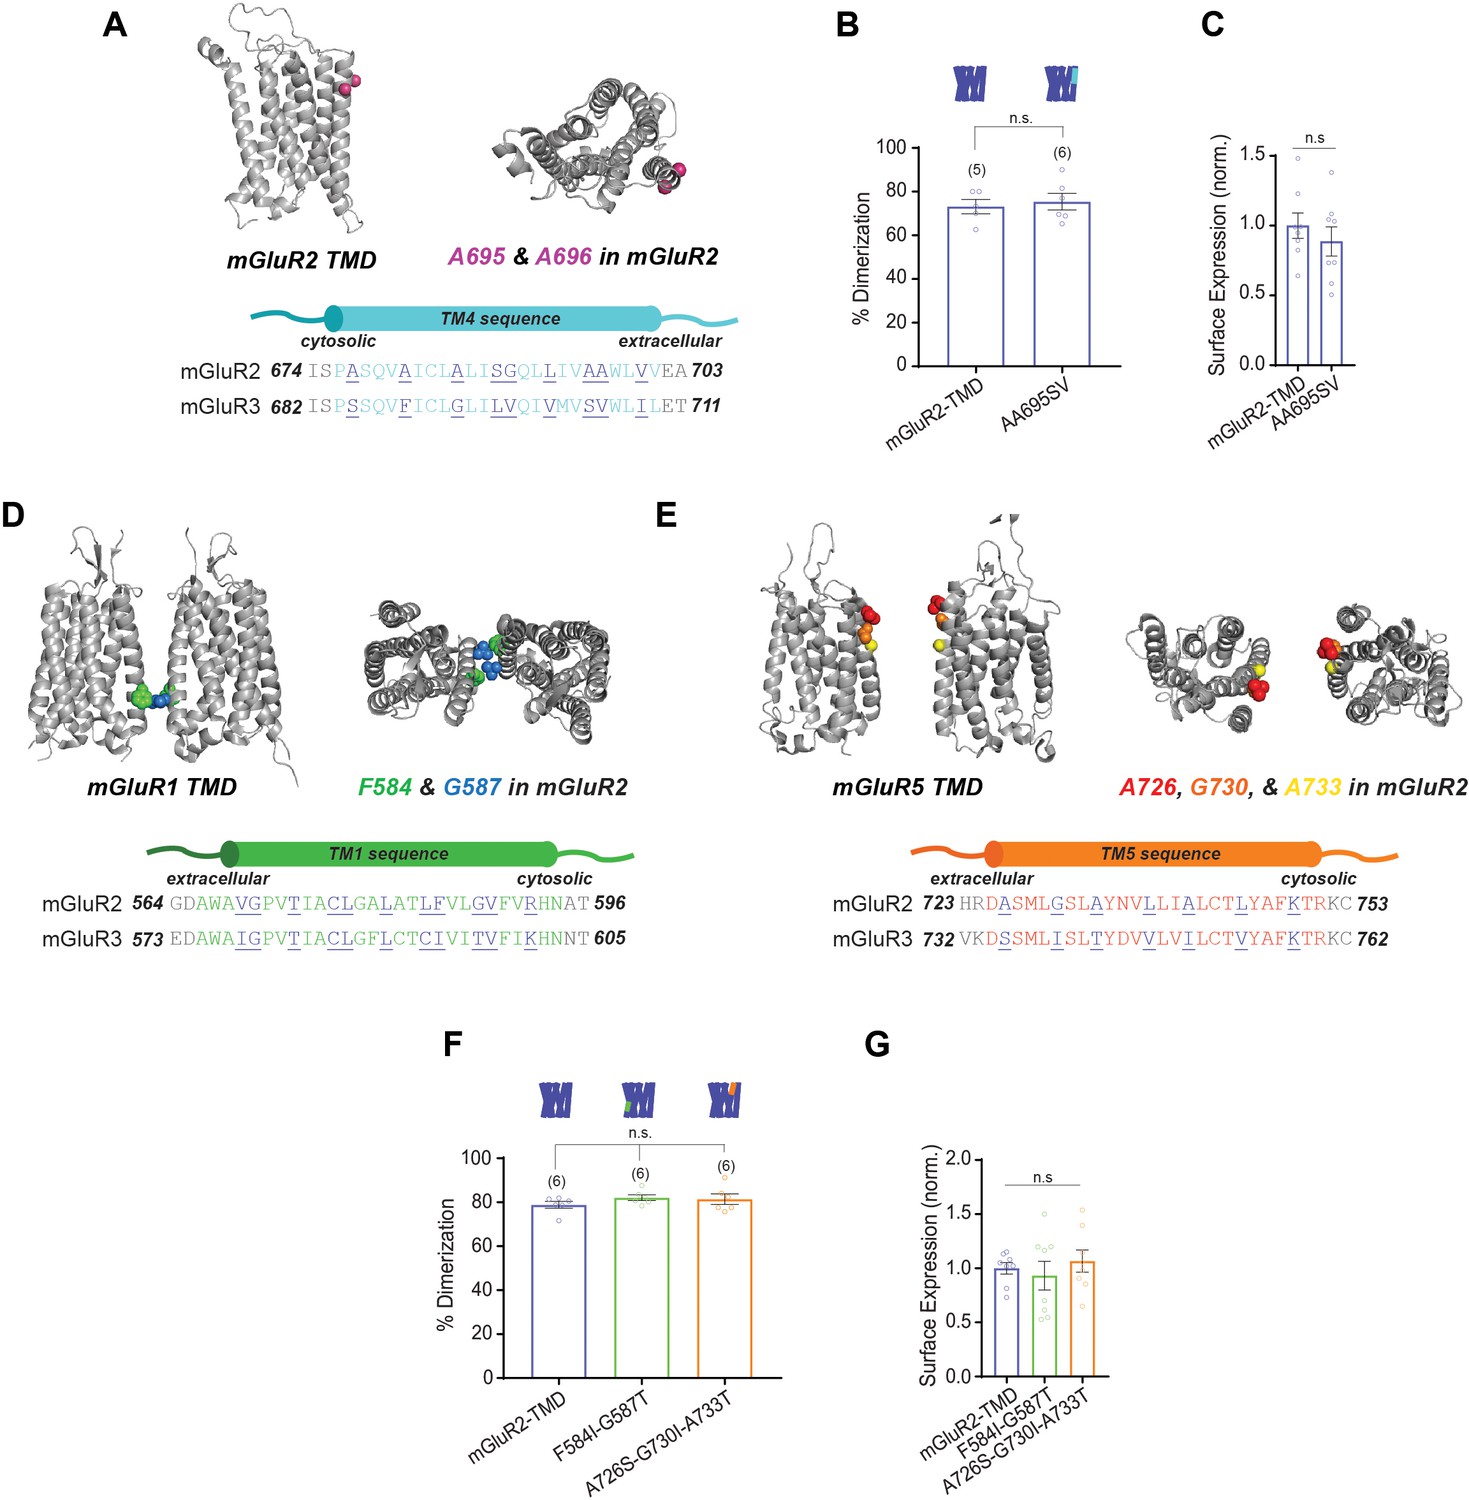
Further analysis of mutations to outward-facing mGluR2 TMD residues: TM1 and TM5 mutants do not alter dimerization .
(A) Top left, homology model of mGluR2-TMD showing side chains of residues of interest in magenta. Top right, top view. Bottom, sequence alignment of TM4 residues in mGluR2 and mGluR3 showing outward-facing residues underlined and in purple. (B) Bar graph showing percent dimerization for SNAP-tagged constructs labeled with LD555. The mutations to TM4 do not alter dimerization compared to wild-type mGluR2-TMD (unpaired t-test, p=0.67). (C) Bar graph showing surface expression for constructs in (B). Values are normalized to SNAP-mGluR2-TMD. Expression is not significantly different between constructs (unpaired t-test, p=0.43). (D) Top left, cartoon model of mGluR1-TMD (PDB: 4OR2) showing side chains of residues of interest in blue and green. Top right, top view. Bottom, sequence alignment of TM1 residues in mGluR2 and mGluR3 showing outward-facing residues underlined and in purple. (E) Top left, cartoon model of mGluR5-TMD (PDB: 6N52) showing side chains of residues of interest in red, orange, and yellow. Top right, top view. Bottom, sequence alignment of TM5 residues in mGluR2 and mGluR3 showing outward-facing residues underlined and in purple. (F) Bar graph showing percent dimerization for SNAP-tagged constructs labeled with LD555. The mutations to TM1 and TM5 do not alter dimerization compared to wild-type mGluR2-TMD (one-way ANOVA, p=0.41). (G) Bar graph showing surface expression for constructs in (F). Values are normalized to SNAP-mGluR2-TMD. Expression is not significantly different between constructs (one-way ANOVA, p=0.65). Number of movies analyzed for each condition is shown in parenthesis above each bar. Error bars represent s.e.m.
Figure 2—figure supplement 6
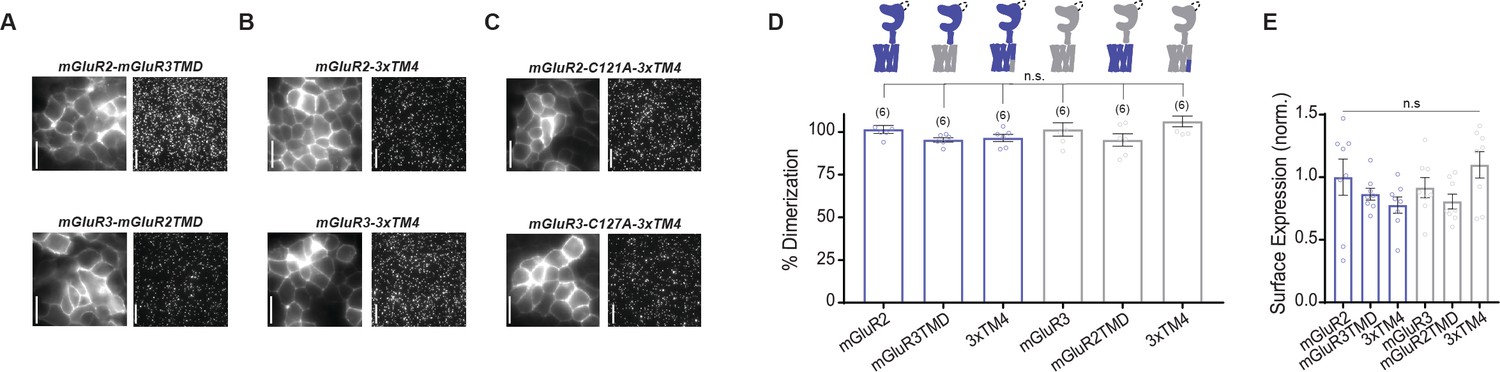
Further analysis of dimerization of mGluR2 and mGluR3 mutant constructs.
(A) Representative HEK 293 T cell images and single molecule images of SNAP-mGluR2-mGluR3TMD and SNAP-mGluR3-mGluR2TMD. Scale bar = 10 µm. (B) Representative HEK 293 T cell images and single-molecule images of SNAP-mGluR2-3xTM4 and SNAP-mGluR3-3xTM4. Scale bar = 10 µm. (C) Representative HEK 293 T cell images and single-molecule images of SNAP-mGluR2-C121A-3xTM4 and SNAP-mGluR3-C127A-3xTM4. Scale bar = 10 µm. (D) Bar graph showing percent dimerization for SNAP-tagged constructs labeled with LD555. TMD chimera constructs and 3xTM4 mutant constructs do not alter dimerization of SNAP-mGluR2 or SNAP-mGluR3 (one-way ANOVA, p=0.067). (E) Bar graph showing surface expression for constructs in (D). Values are normalized to SNAP-mGluR2. Expression is not significantly different between constructs (one-way ANOVA, p=0.12). Number of movies analyzed for each condition is shown in parenthesis above each bar. Error bars represent s.e.m.
Figure 3 with 2 supplements
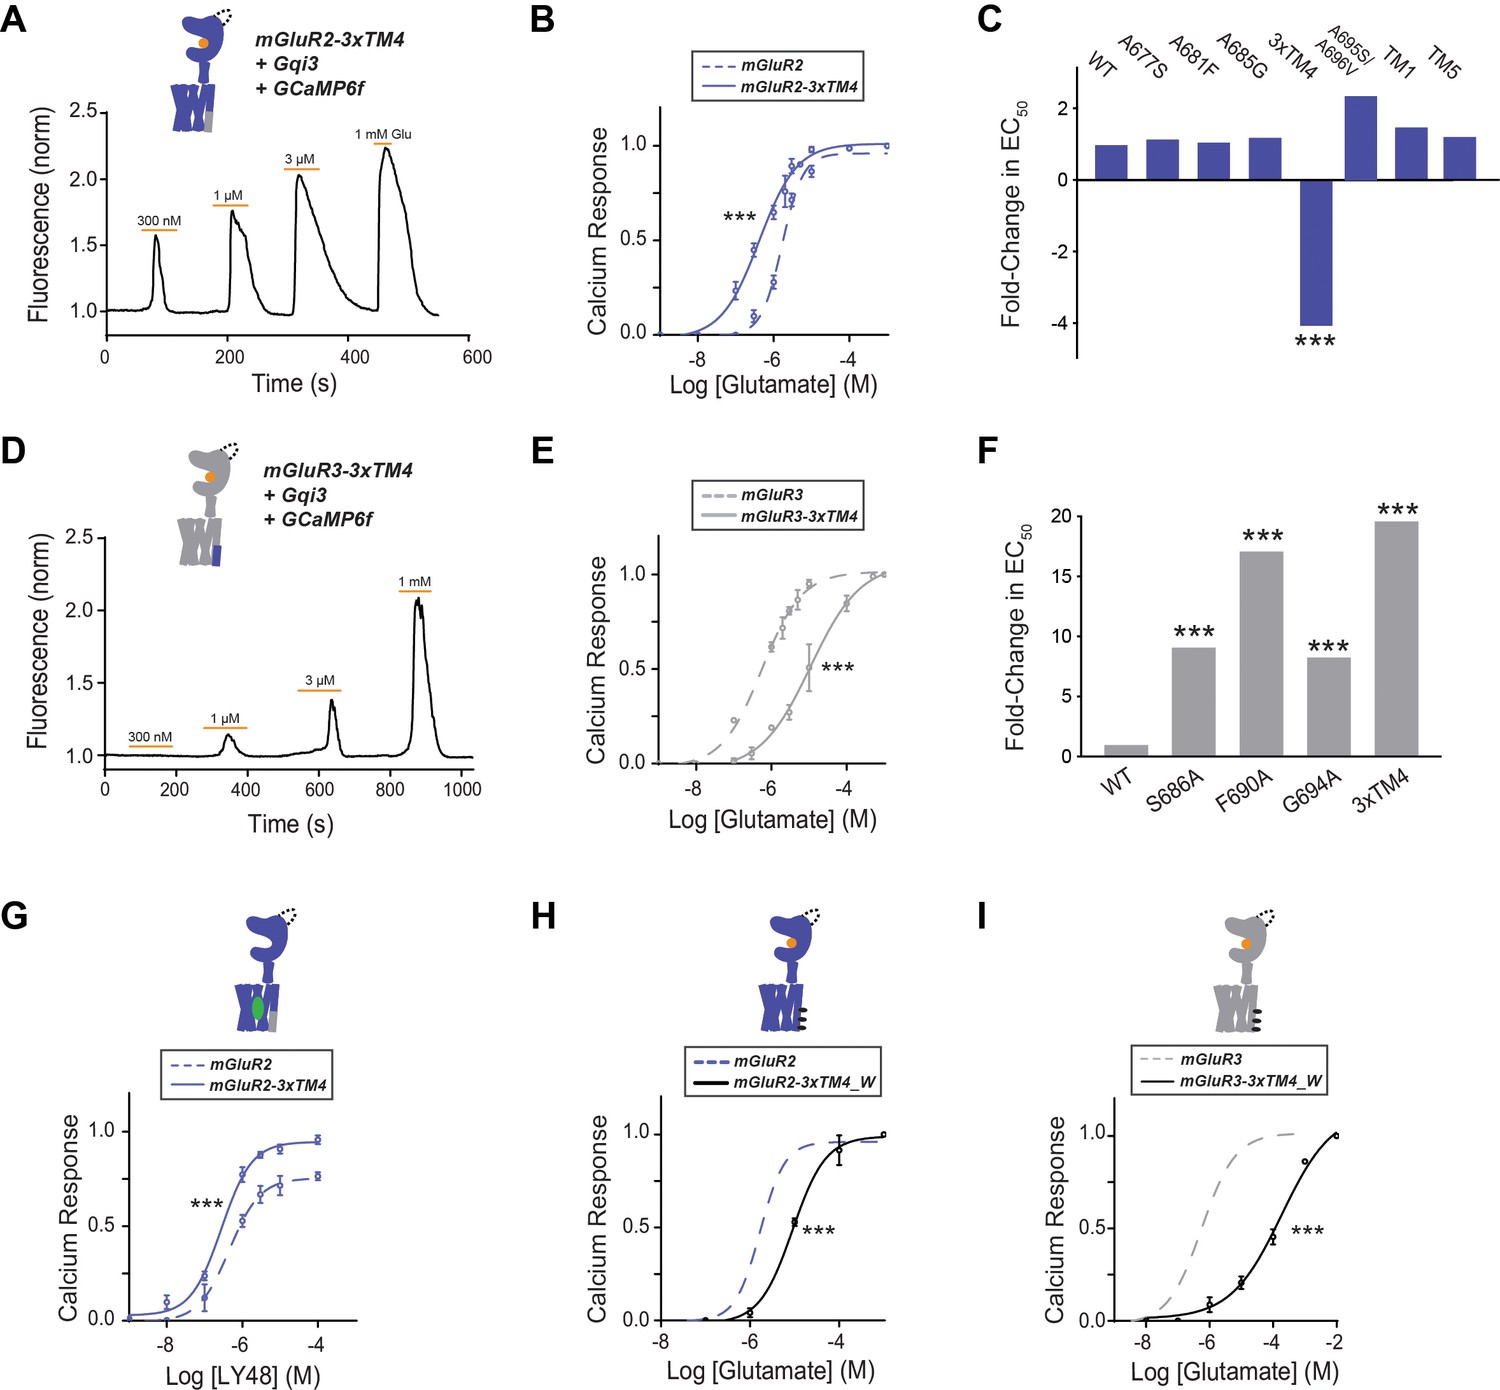
Differences in TM4 residues mediate different activation properties of mGluR2 and mGluR3.
(A) Representative calcium imaging trace showing calcium responses induced by glutamate application from a HEK 293 T cell expressing mGluR2-3xTM4, a G-protein chimera and GCaMP6f. (B) Glutamate calcium imaging concentration response curves for mGluR2 (EC50 = 1.68 ± 0.03 μM) and mGluR2-3xTM4 (EC50 = 0.41 ± 0.06). All values are normalized to saturating (1 mM) glutamate. * indicates statistical significance (two-way ANOVA, p=5.2E-10). (C) Summary of glutamate EC50 shifts relative to wild-type mGluR2 obtained for mGluR2 mutants. * indicates statistical significance (two-way ANOVA; for mGluR2 vs. mGluR2-3xTM4, p=5.2E-10). ‘TM1’=F584I, G587T; ‘TM5’=A726S, G730I, A733T (D) Representative calcium imaging trace showing calcium responses from mGluR3-3xTM4. (E) Glutamate calcium imaging concentration response curves for mGluR3 (EC50 = 0.56 ± 0.06) and mGluR3-3xTM4 (EC50 = 11.0 ± 0.1). All values are normalized to saturating (1 mM) glutamate. * indicates statistical significance (two-way ANOVA, p=3.6E-10). (F) Summary of glutamate EC50 shifts relative to wild-type mGluR3 obtained for mGluR3 mutants. * indicates statistical significance (two-way ANOVA; for mGluR3 vs. mGluR3-S686A, p=2.2E-8; for mGluR3 vs. mGluR3-F690A, p=2.6E-14; for mGluR3 vs. mGluR3-G694A, p=4.8E-10; for mGluR3 vs. mGluR3-3xTM4, p=3.6E-10). (G) LY48 calcium imaging concentration response curves for mGluR2 (EC50 = 0.45 ± 0.10) and mGluR2-3xTM4 (EC50 = 0.27 ± 0.06). mGluR2-3xTM4 has ~17% greater efficacy than mGluR2 at saturating LY48. All values are normalized to saturating (1 mM) glutamate. * indicates statistical significance (two-way ANOVA, p=1.3E-7). (H) Glutamate calcium imaging concentration response curves for mGluR2 and mGluR2-3xTM4_W (EC50 = 9.01 ± 0.08). All values are normalized to saturating (1 mM) glutamate. * indicates statistical significance (two-way ANOVA, p=0.00087). (I) Glutamate calcium imaging concentration response curves for mGluR3 and mGluR3-3xTM4_W (EC50 = 186.00 ± 0.27). All values are normalized to saturating (1 mM) glutamate. * indicates statistical significance (two-way ANOVA, p=1.2E-10). Associated figure supplement includes Figure 3—figure supplements 1–2.
-
Figure 3—source data 1
Data and statistics for Figure 3 and associated supplemental figures.
- https://cdn.elifesciences.org/articles/67027/elife-67027-fig3-data1-v2.xlsx
Figure 3—figure supplement 1
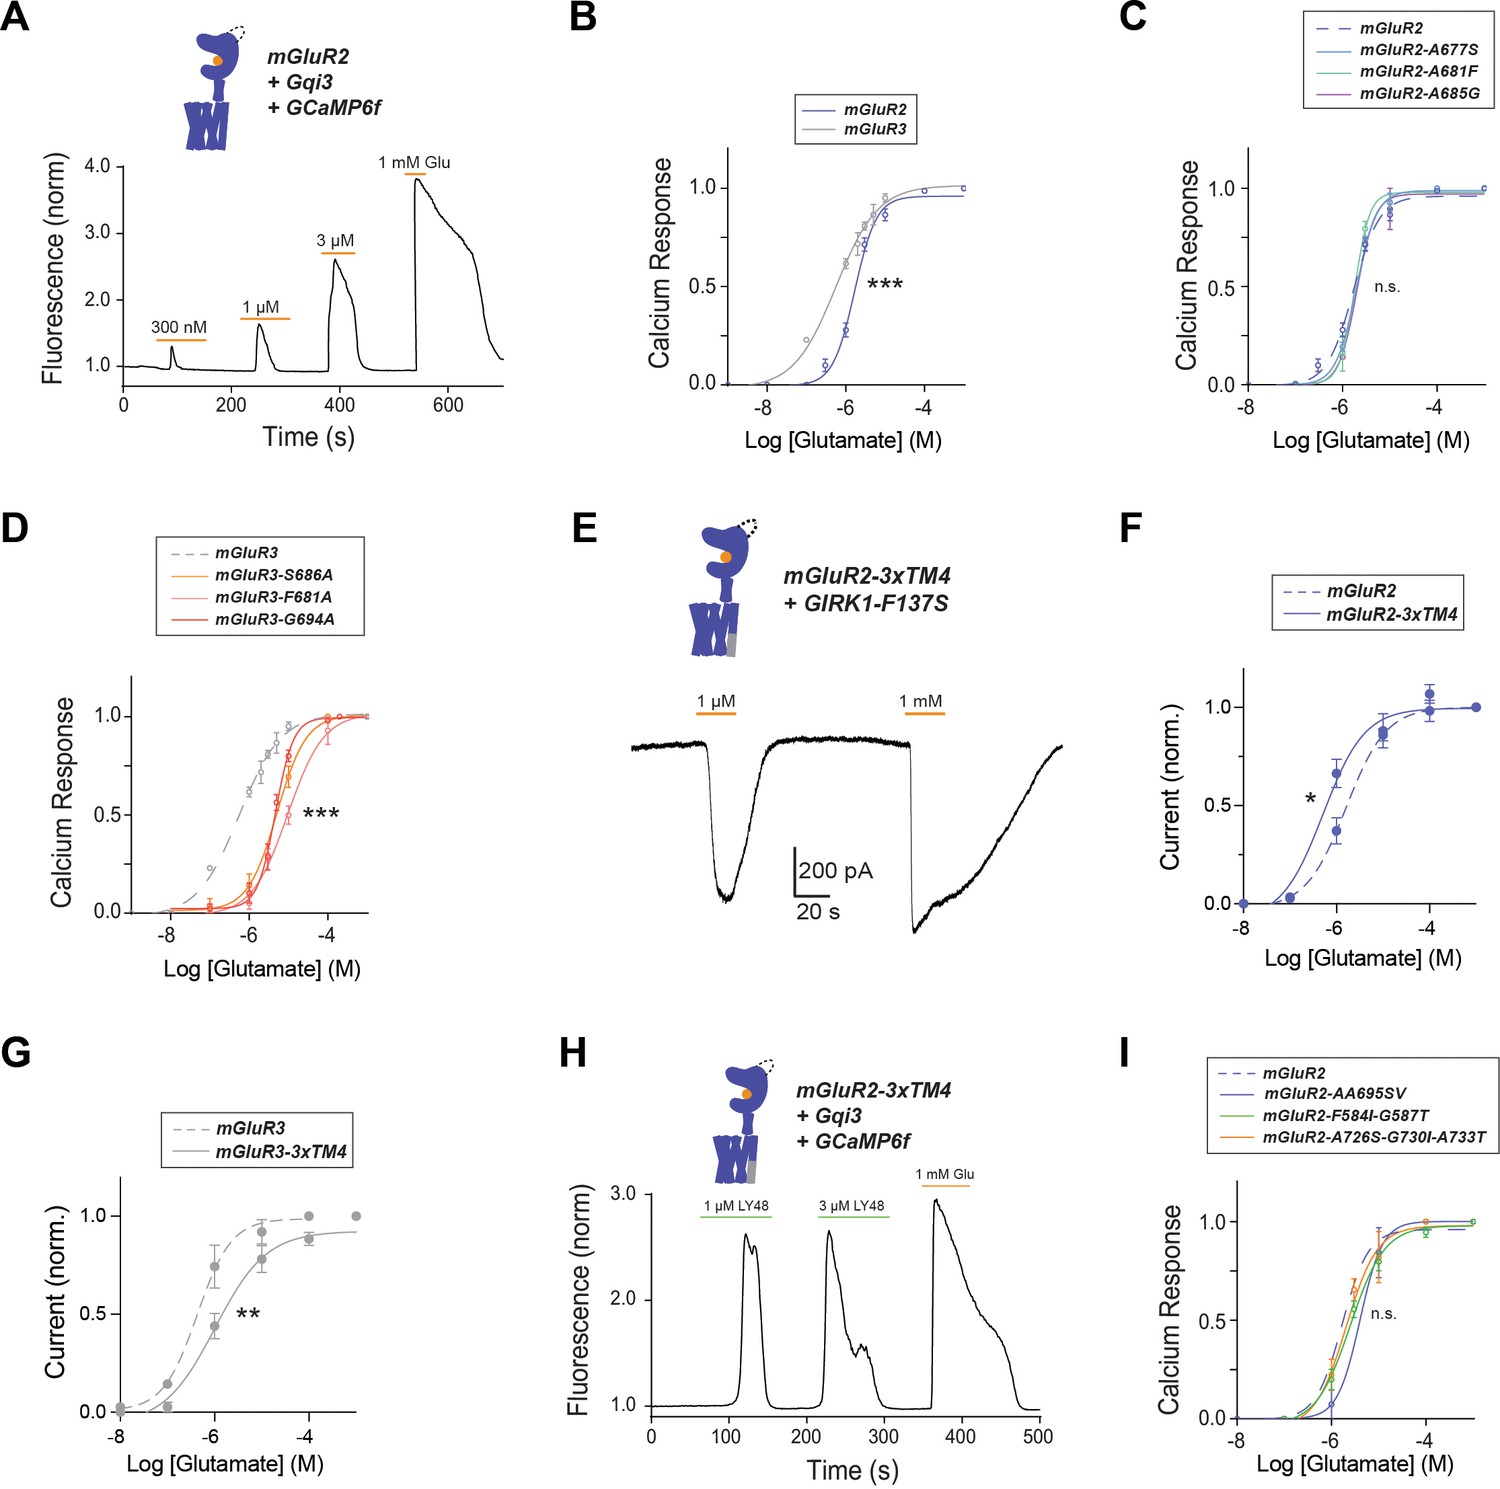
Further data showing differences in TM4 residues mediate different activation properties of mGluR2 and mGluR3.
(A) Representative calcium imaging trace showing calcium responses induced by glutamate application from HEK 293 T cells expressing mGluR2, a Gαqi protein chimera and GCaMP6f. (B) Glutamate calcium imaging concentration response curves for mGluR2 (EC50 = 1.68 ± 0.03 μM) and mGluR3 (EC50 = 0.56 ± 0.06). All values are normalized to saturating (1 mM) glutamate. * indicates statistical significance (two-way ANOVA, p=6.4E-5). (C) Glutamate calcium imaging concentration response curves for mGluR2 and TM4 mutants mGluR2-A677S (EC50 = 1.94 ± 0.03), -A681F (EC50 = 1.79 ± 0.03), -A685G (EC50 = 2.01 ± 0.06). The mutants do not significantly differ from wild-type mGluR2 (two-way ANOVA; for mGluR2 vs. mGluR2-A677S, p=0.96; for mGluR2 vs. mGluR2-A681F, p=0.81; for mGluR2 vs. mGluR2-A685G, p=0.64). (D) Glutamate calcium imaging concentration response curves for mGluR3 and TM4 mutants mGluR3-S686A (EC50 = 5.12 ± 0.06), -F690A (EC50 = 9.59 ± 0.06), -G694A (EC50 = 4.66 ± 0.03). * indicates statistical significance (two-way ANOVA; for mGluR3 vs. mGluR3-S686A, p=2.2E-8; for mGluR3 vs. mGluR3-F690A, p=2.6E-14; for mGluR3 vs. mGluR3-G694A, p=4.9E-10). (E) Representative whole cell patch clamp recording from HEK 293 T cells expressing mGluR2-3xTM4 showing inward GIRK currents induced by glutamate. (F) Glutamate GIRK activation concentration response curves for mGluR2 (EC50 = 1.29 ± 0.07) and mGluR2-3xTM4 (EC50 = 0.65 ± 0.09). All values are normalized to saturating (1 mM) glutamate. * indicates statistical significance (two-way ANOVA, p=0.021). (G) Glutamate GIRK activation concentration response curves for mGluR3 (EC50 = 0.43 ± 0.10) and mGluR3-3xTM4 (EC50 = 1.02 ± 0.17). All values are normalized to saturating (1 mM) glutamate. * indicates statistical significance (two-way ANOVA, p=0.0025). (H) Representative calcium imaging trace showing calcium responses induced by LY487379 and glutamate application from HEK 293 T cells expressing mGluR2, a Gαqi protein chimera and GCaMP6f. (I) Glutamate calcium imaging concentration response curves for mGluR2 and TM1 mutant mGluR2-F584I-G587T (EC50 = 2.50 ± 0.06), TM5 mutant mGluR2-A726S-G730I-A733T (EC50 = 2.05 ± 0.10), and mGluR2-AA695SV (EC50 = 4.00 ± 0.14). All values are normalized to saturating (1 mM) glutamate. The mutants do not significantly differ from wild-type mGluR2 (two-way ANOVA; for mGluR2 vs. mGluR2-F584I-G587T, p=0.29; for mGluR2 vs. mGluR2-A726S-G730I-A733T, p=0.71; for mGluR2 vs. mGluR2-AA695SV, p=0.33).
Figure 3—figure supplement 2
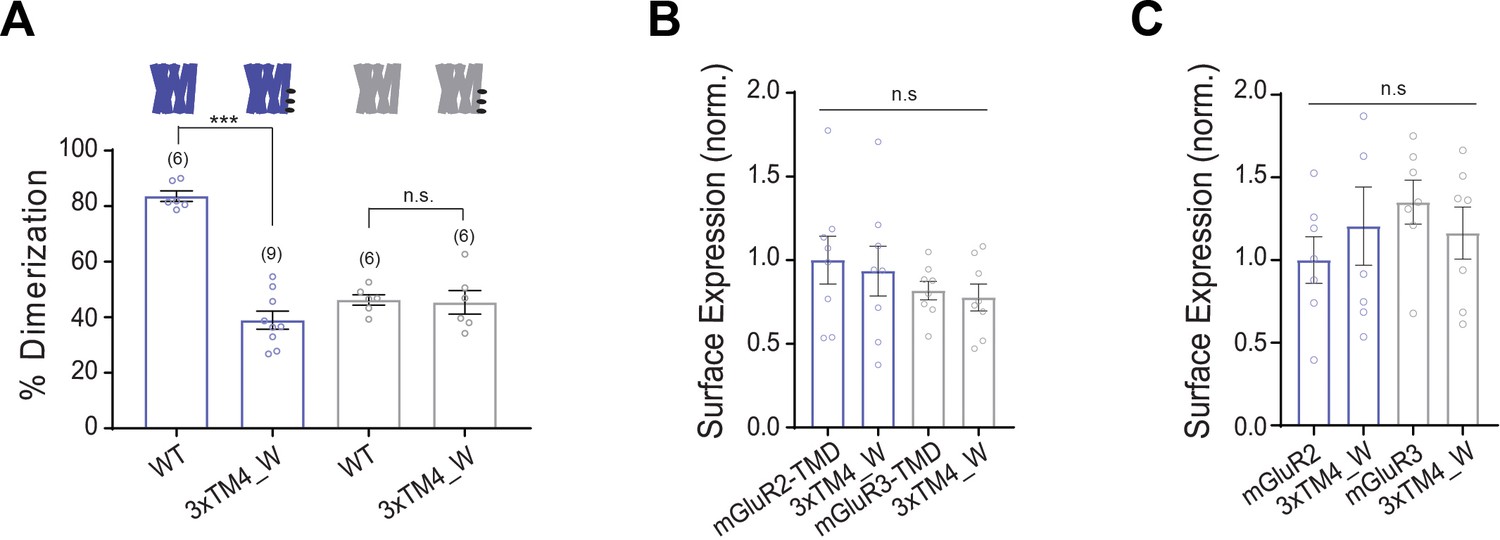
Further analysis of 3xTM4_W mutants in mGluR2 and mGluR3 constructs.
(A) Bar graph showing percent dimerization for SNAP-tagged constructs labeled with LD555. * indicates statistical significance (one-way ANOVA, p=2.5E-9; Tukey-Kramer for mGluR2-TMD vs. mGluR2-TMD-3xTM4_W, p=2.01E-9, for mGluR3-TMD vs. mGluR3-TMD-3xTM4_W p=0.99). (B) Bar graph showing surface expression for constructs in (A). Values are normalized to SNAP-mGluR2-TMD. Expression is not significantly different between constructs (one-way ANOVA, p=0.48). (C) Bar graph showing surface expression for 3xTM4_W mutants in mGluR2 or mGluR3 backgrounds. Values are normalized to SNAP-mGluR2. Expression is not significantly different between constructs (one-way ANOVA, p=0.55).
Figure 4 with 4 supplements

An inter-TMD FRET assay enables detection of inter-TMD conformational dynamics in full-length mGluR2 and mGluR3 in live cells.
(A) Top, schematic showing an mGluR2 dimer with a HaloTag inserted into intracellular loop 2 (ICL2). and labeled with donor and acceptor fluorophores. Bottom, representative cell images showing donor and acceptor channels after donor excitation with a 561 nm laser. Scale bar = 20 µm. (B) Representative FRET trace showing donor and acceptor fluorescence intensity (top) during glutamate application. A corresponding normalized FRET trace (bottom) shows reversible FRET increases upon glutamate stimulation. (C) Glutamate FRET concentration response curves for mGluR2 (EC50 = 15.75 ± 0.04) and mGluR3 (EC50 = 0.23 ± 0.08). All values are normalized to saturating (1 mM) glutamate. (D) Application of the negative allosteric modulator MNI 137 partially blocks glutamate-induced FRET increases for mGluR2. (E) Quantification of saturating LY34 (5 μM) and MNI (10 μM) blockade of glutamate responses in FRET and calcium imaging for mGluR2 and mGluR3. * indicates statistical significance (unpaired t-test, for MNI inhibition in FRET vs. function for mGluR2, p=0.0064; for MNI inhibition in FRET vs. function for mGluR3, p=0.013). (F) Representative FRET trace shows application of positive allosteric modulator LY48 at a saturating concentration induces a smaller FRET response than saturating glutamate for mGluR2. Inset, quantification of LY48 response in FRET and calcium imaging for mGluR2. * indicates statistical significance (unpaired t-test, p=0.0033) (G) Representative FRET trace showing glutamate titration for mGluR2-3xTM4. (H) Glutamate FRET concentration response curves for mGluR2 and mGluR2-3xTM4 (EC50 = 5.39 ± 0.03). All values are normalized to saturating (1 mM) glutamate. * indicates statistical significance (two-way ANOVA, p value = 1.7E-6). (I) Glutamate FRET concentration response curves for mGluR3 and mGluR3-3xTM4 (EC50 = 0.56 ± 0.10). All values are normalized to saturating (1 mM) glutamate. * indicates statistical significance (two-way ANOVA, p value = 0.0083). (J) Representative FRET trace showing weak sensitivity to LY34 in the absence of glutamate for mGluR3-3xTM4. (K) Summary showing decrease in basal FRET response to LY34 for mGluR3-3xTM4 compared to wild-type mGluR3. * indicates statistical significance (unpaired t-test, p=0.0048). (L) Summary showing decrease in basal activity as assessed by LY34 application in patch clamp recordings for mGluR3-3xTM4 compared to wild-type mGluR3. * indicates statistical significance (unpaired t-test, p=0.015). (M) Summary showing increase in basal activity as assessed by Ro 64 application in patch clamp recordings for mGluR2-3xTM4 compared to wild-type mGluR2. * indicates statistical significance (unpaired t-test, p=0.033). The number of cells tested are shown in parentheses. Error bars represent s.e.m. Associated figure supplements include Figure 4—figure supplements 1–4.
-
Figure 4—source data 1
Data and statistics for Figure 4 and associated supplemental figures.
- https://cdn.elifesciences.org/articles/67027/elife-67027-fig4-data1-v2.xlsx
Figure 4—figure supplement 1
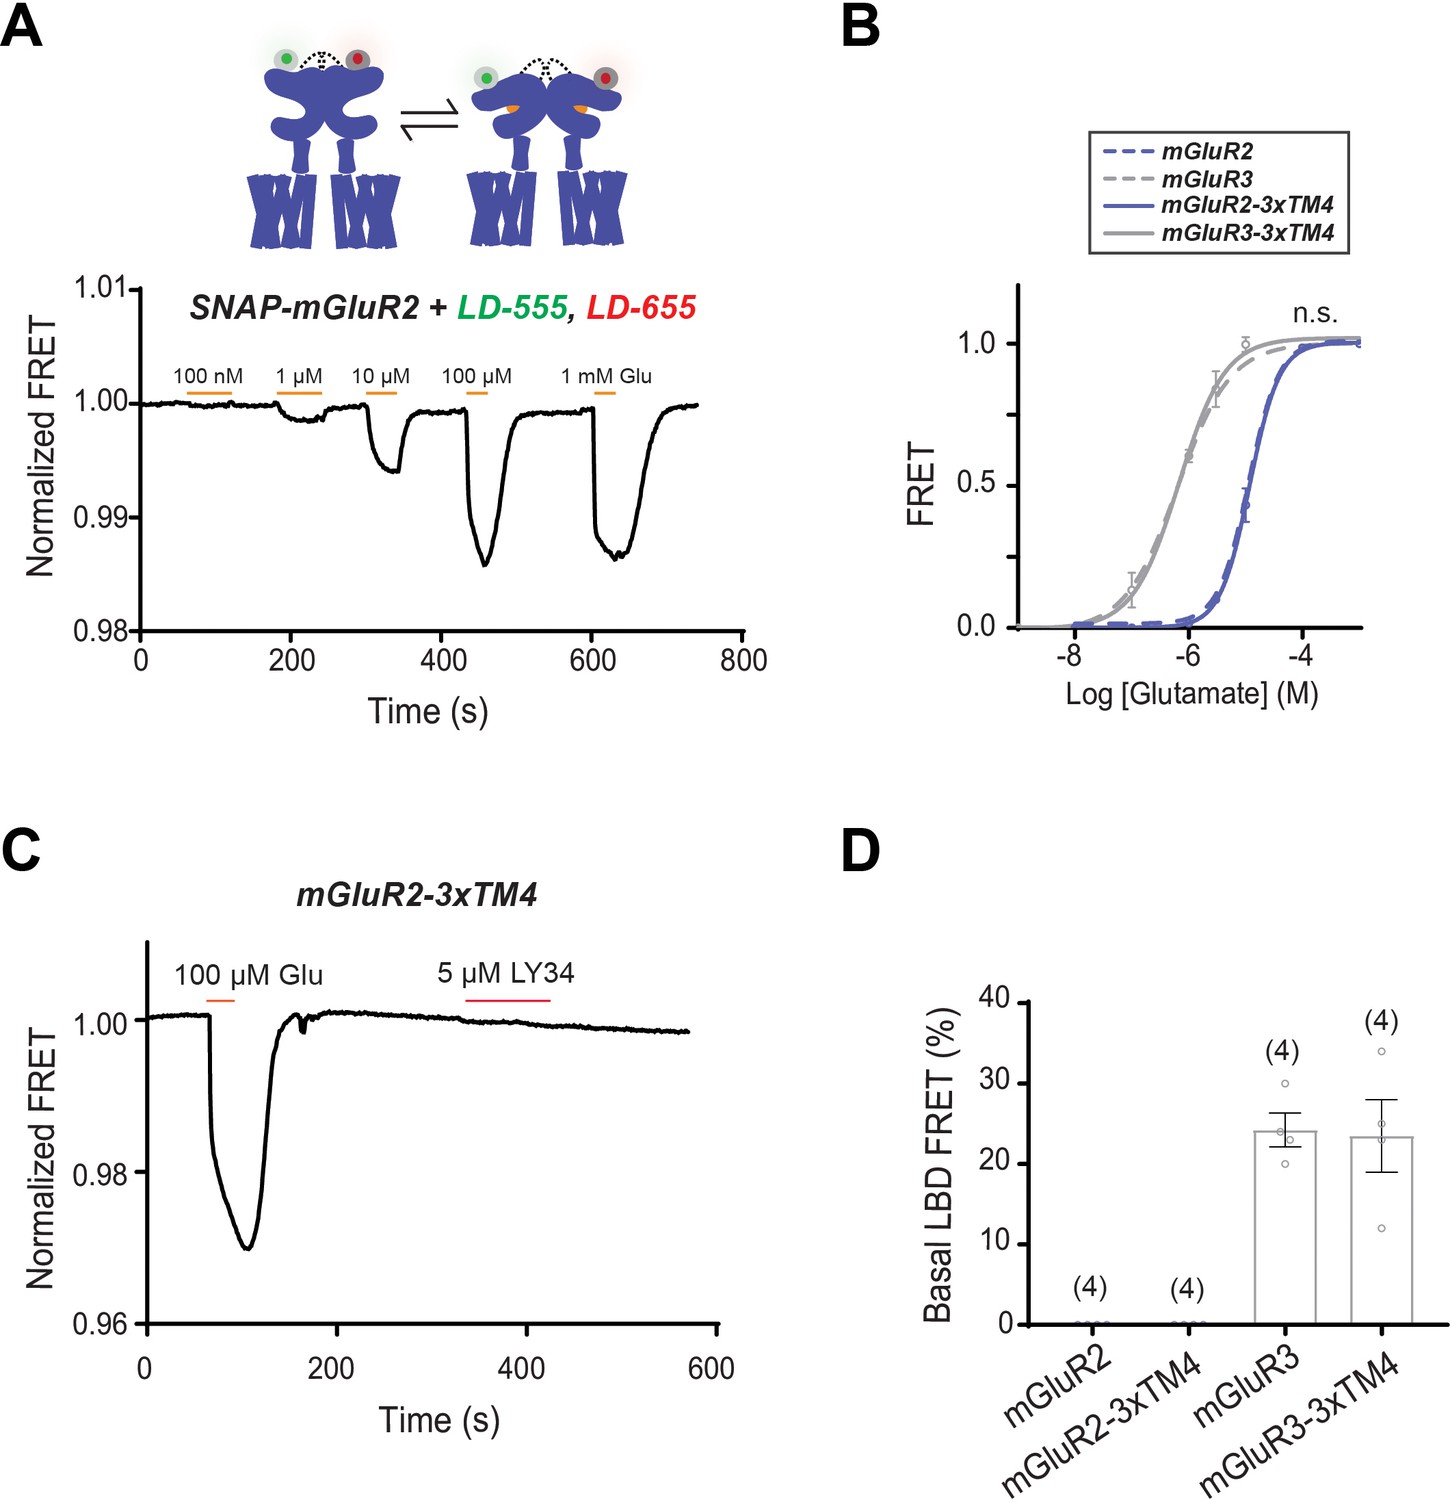
Differences in TM4 residues do not alter inter-LBD conformational dynamics.
(A) Representative LBD FRET trace showing FRET decreases in response to glutamate application. (B) Glutamate LBD FRET concentration response curves for mGluR2 (EC50 = 11 ± 0.02), mGluR2-3xTM4 (EC50 = 11 ± 0.02), mGluR3 (EC50 = 0.64 ± 0.10) and mGluR3-3xTM4 (EC50 = 0.67 ± 0.05). All values are normalized to saturating (1 mM) glutamate. The mutants do not differ from their wild-type counterparts (two-way ANOVA; for mGluR2 vs. mGluR2-3xTM4, p=0.17; for mGluR3 vs. mGluR3-3xTM4, p=0.60). (C) Representative mGluR2-3xTM4 LBD FRET trace showing a FRET response induced by glutamate application and no change induced by antagonist LY34 application. (D) Quantification of LBD basal FRET. Error bars represent s.e.m.
Figure 4—figure supplement 2
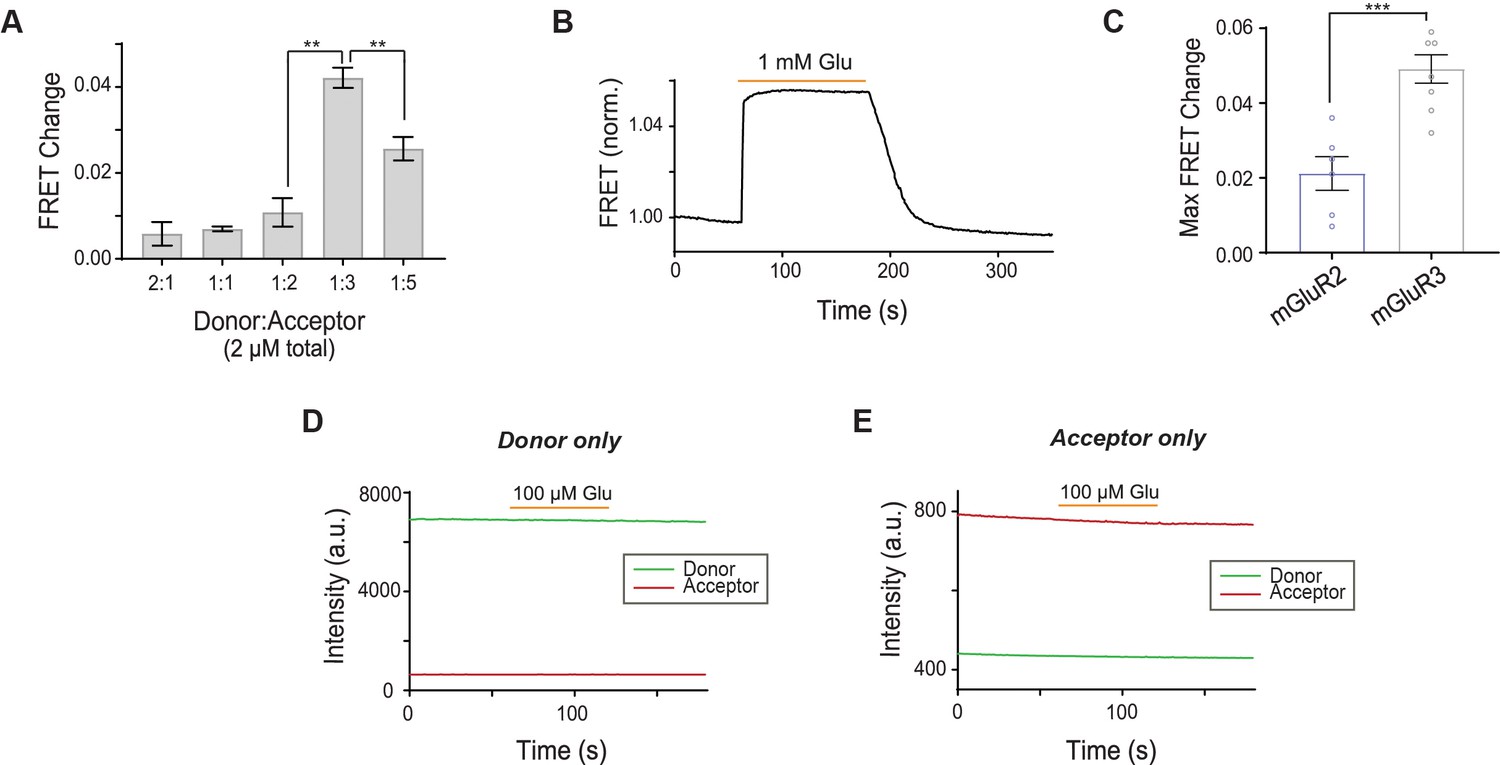
Characterization of inter-TMD FRET sensor in mGluR2 and mGluR3.
(A) Bar graph showing that 1:3 donor:acceptor dye labeling is the optimal ratio to detect FRET changes for the inter-TMD FRET sensor. * indicates statistical significance (unpaired t-tests; for 1:2 vs. 1:3, p=0.0023; for 1:3 vs. 1:5, p=0.011). (B) Representative FRET trace shows stability of signal over a 2-min glutamate application. (C) Bar graph showing maximum FRET change from saturating glutamate observed for mGluR2 compared to mGluR3. * indicates statistical significance (unpaired t-test, p=0.00066). (D) A FRET change does not occur when only donor dye (JF 549) is labeled. (E) A FRET change does not occur when only acceptor dye (JF 646) is labeled.
Figure 4—figure supplement 3
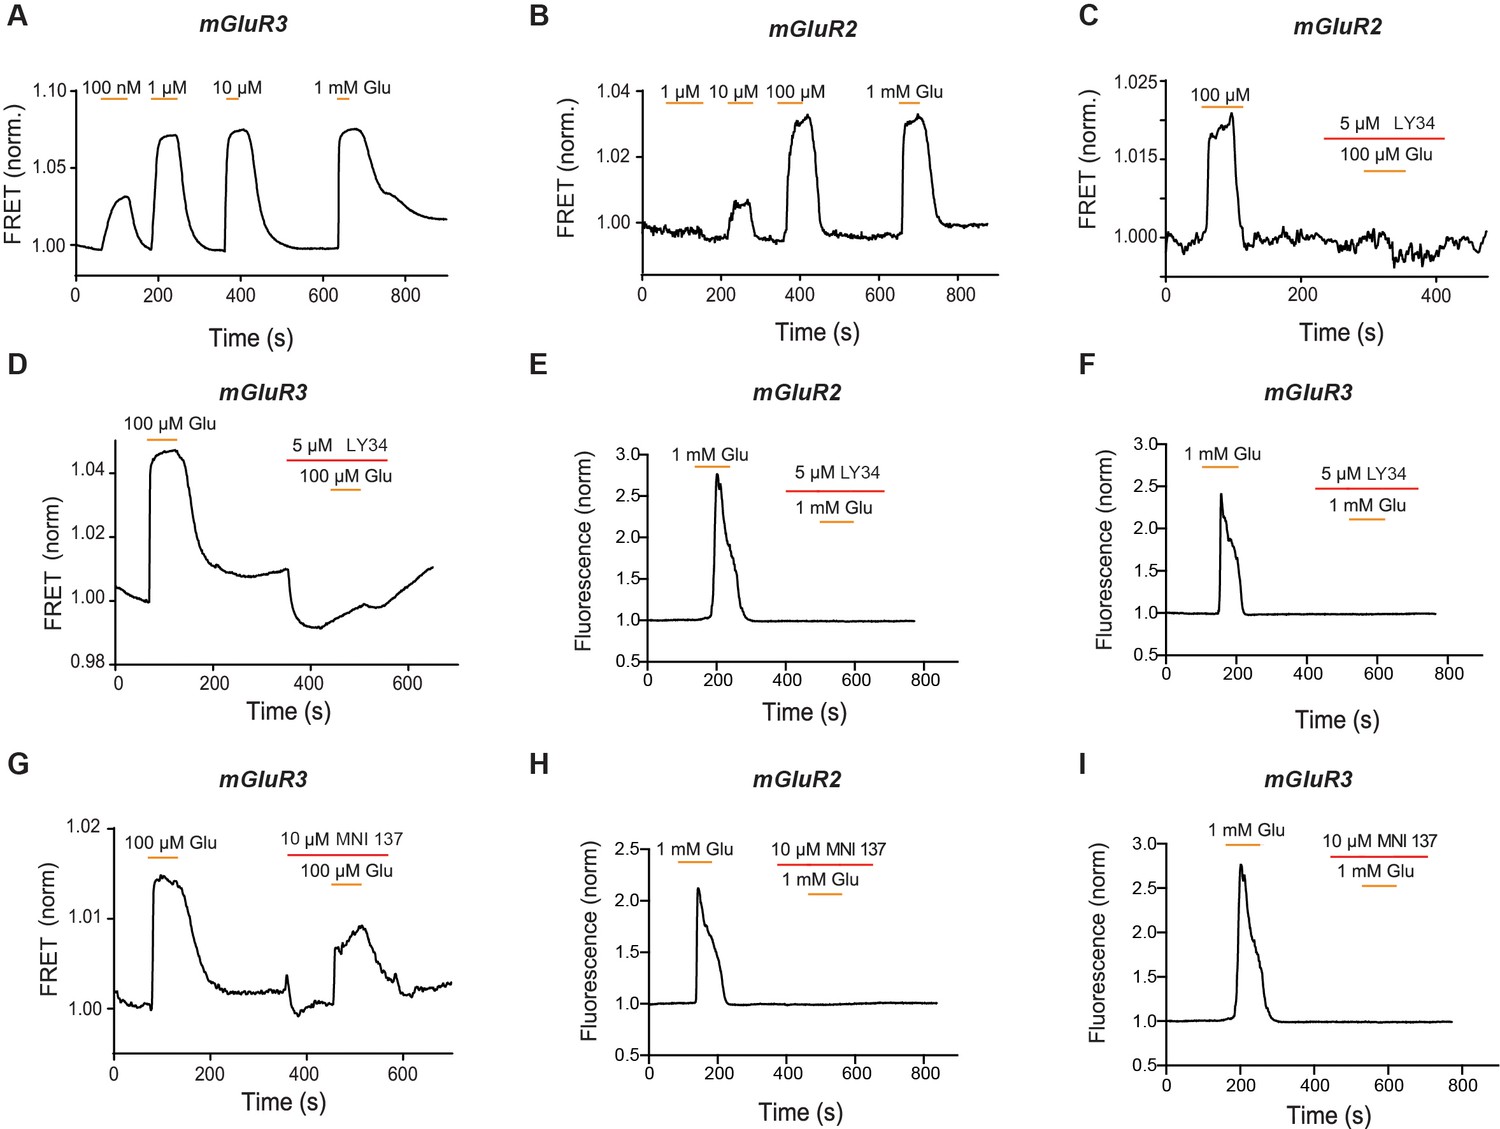
Characterization of inter-TMD conformational dynamics in response to orthosteric and allosteric drugs.
(A) Representative FRET trace for mGluR3 shows concentration-dependent glutamate responses. (B) Representative FRET trace for mGluR2 shows concentration-dependent glutamate responses. (C) Representative FRET trace for mGluR2 shows application of antagonist LY34 blocks a glutamate-induced FRET response. (D) Representative FRET trace for mGluR3 shows application of antagonist LY34 blocks a glutamate-induced FRET response. (E) Representative calcium imaging trace showing calcium responses induced by glutamate application from a HEK 293 T cell expressing mGluR2, a G-protein chimera and GCaMP6f. A second glutamate application is blocked by application of antagonist LY34. (F) Representative calcium imaging trace showing calcium responses induced by glutamate application from a HEK 293 T cell expressing mGluR3, a G-protein chimera and GCaMP6f. A second glutamate application is blocked by application of antagonist LY34. (G) Representative FRET trace for mGluR3 shows application of negative allosteric modulator MNI 137 partially blocks a glutamate-induced FRET response. (H) Representative calcium imaging trace showing calcium responses induced by glutamate application from a HEK 293 T cell expressing mGluR2, a G-protein chimera and GCaMP6f. A second glutamate application is blocked by application of negative allosteric modulator MNI 137. (I) Representative calcium imaging trace showing calcium responses induced by glutamate application from a HEK 293 T cell expressing mGluR3, a G-protein chimera and GCaMP6f. A second glutamate application is blocked by application of negative allosteric modulator MNI 137.
Figure 4—figure supplement 4
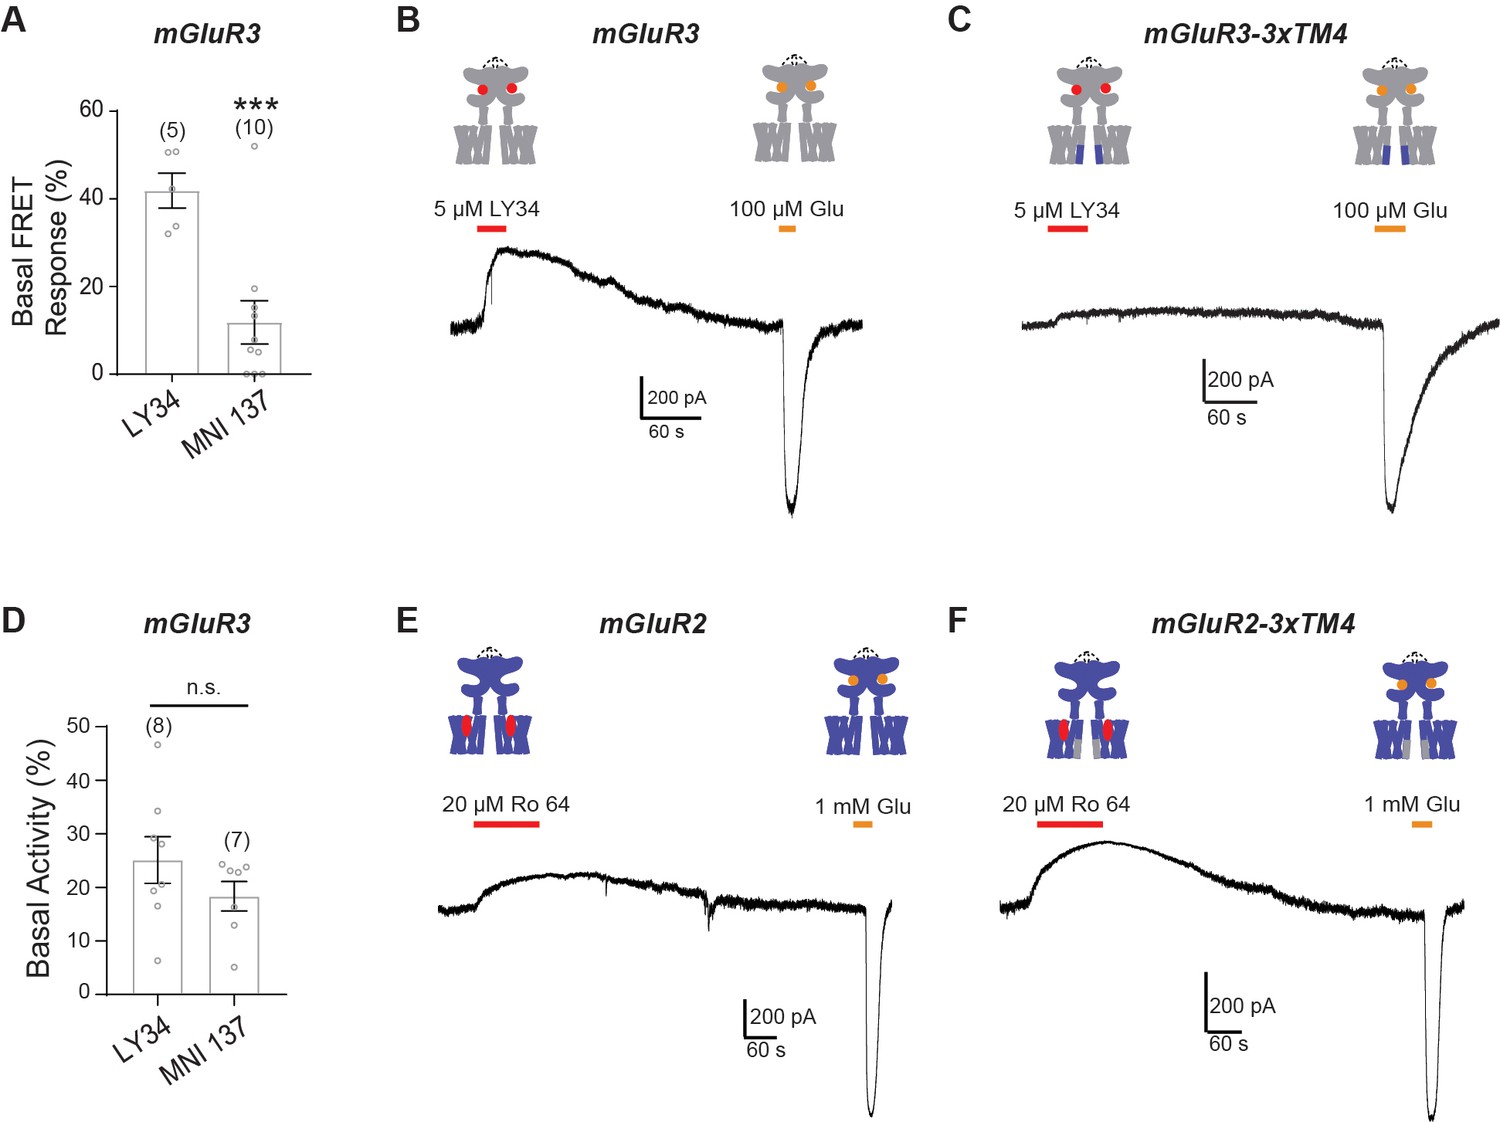
Further characterization of inter-TMD conformational dynamics and control of basal activity.
(A) Quantification of basal inter-TMD FRET response upon LY34 or MNI 137 application in mGluR3-Halo-ICL2. * indicates statistical significance (unpaired t-test, p=0.00043). (B) Representative patch clamp recording showing sensitivity in response to LY34 application in the absence of glutamate for mGluR3, indicating basal receptor signaling. (C) Representative patch clamp recording showing reduced sensitivity in response to LY34 application in the absence of glutamate for mGluR3-3xTM4. (D) Quantification of basal activity in patch clamp recordings shows no significant difference between LY34 and MNI 137. (E) Representative patch clamp recording showing low sensitivity in response to Ro64 application in the absence of glutamate for mGluR2. (F) Representative patch clamp recording showing sensitivity in response to Ro64 application in the absence of glutamate for mGluR2-3xTM4.
Figure 5 with 1 supplement
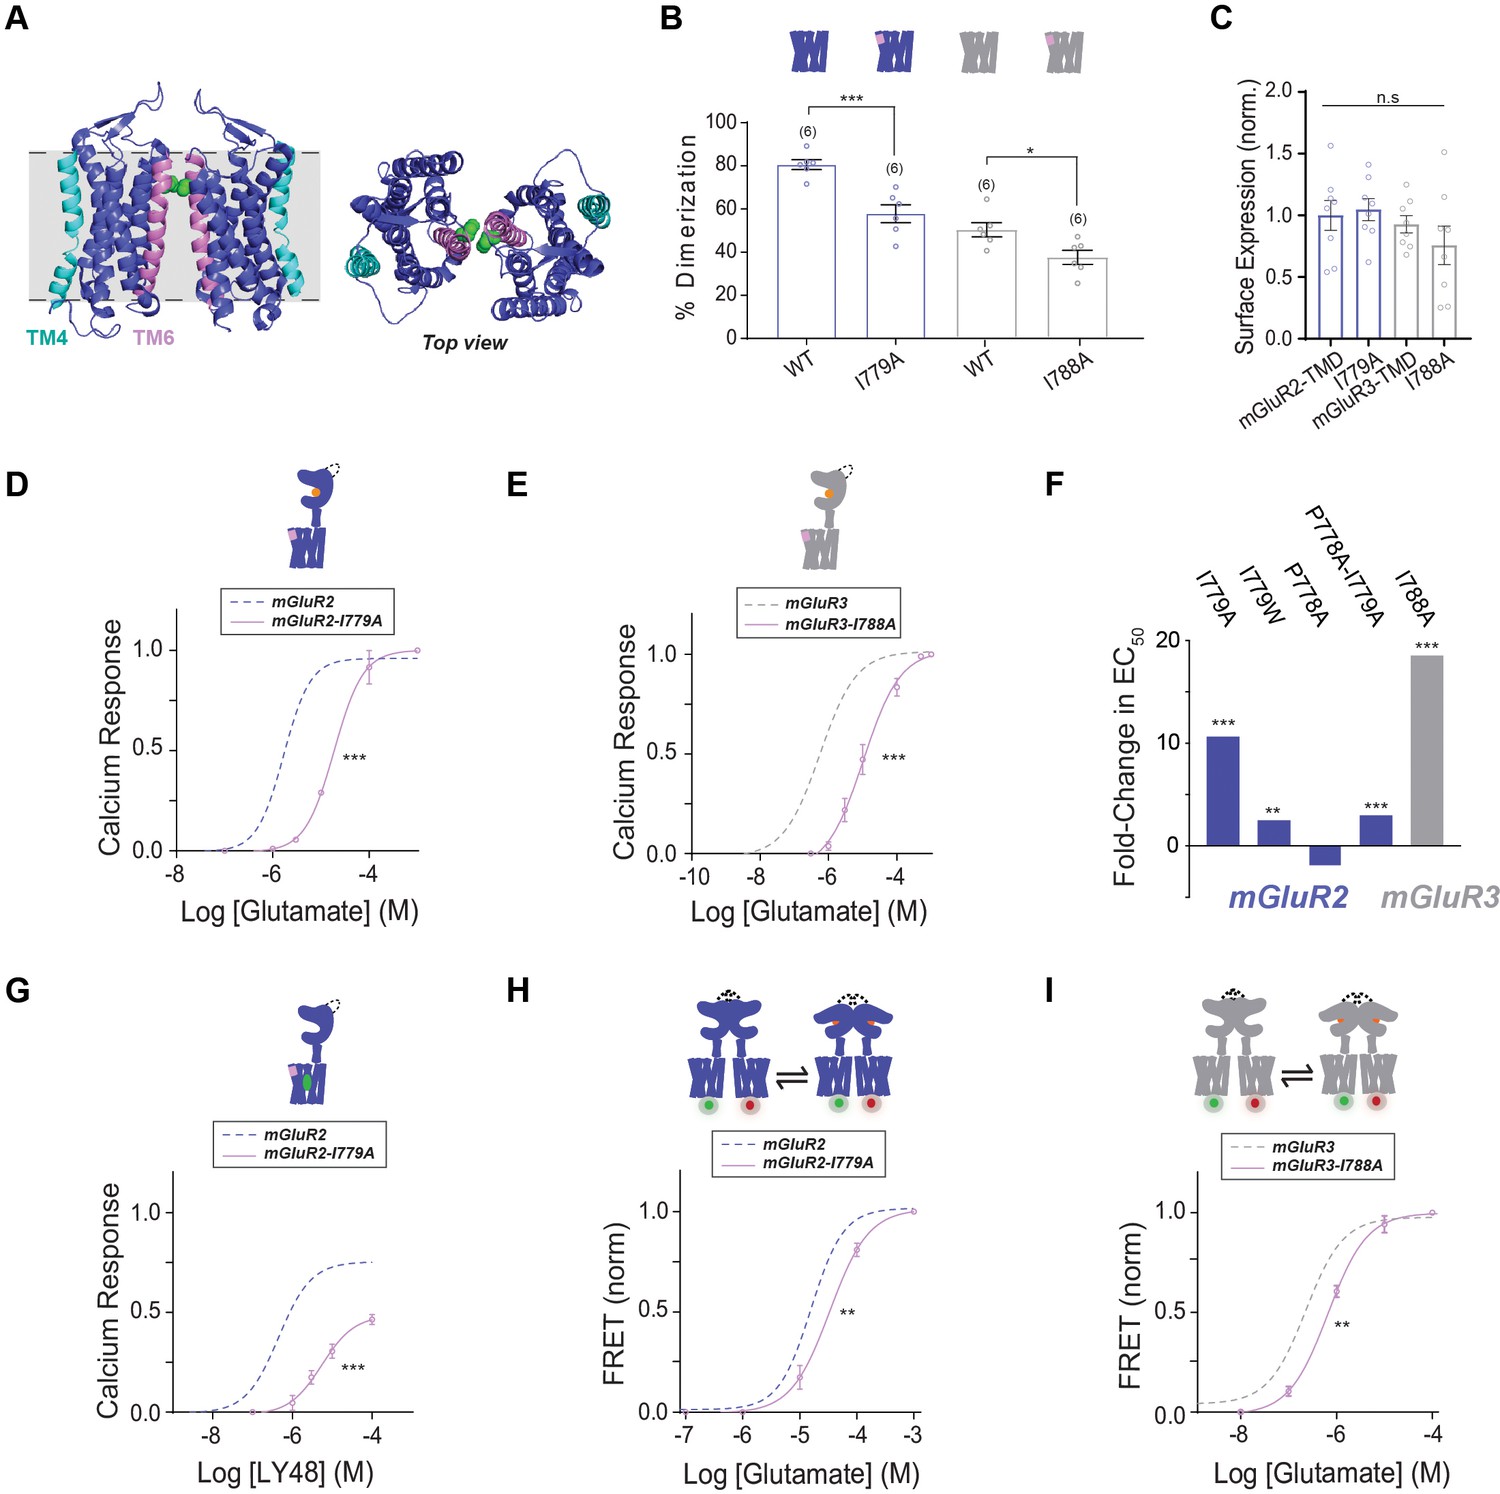
Testing the role of TM6 in group II mGluR activation.
(A) Left, cryo-EM structure of mGluR5 TMD dimer (PDB: 6N51) with TM4 highlighted in cyan and TM6 highlighted in pink. The side chain of I791 (I779 in mGluR2, I788 in mGluR3) is shown in green. Right, top view. (B) Bar graph showing percent dimerization for SNAP-tagged constructs labeled with LD555. * indicates statistical significance (one-way ANOVA, p=1.2E-8; Tukey-Kramer for mGluR2-TMD vs. mGluR2-TMD-I779A p=0.00017, for mGluR3-TMD vs. mGluR3-TMD-I788A p=0.045). (C) Bar graph showing surface expression for constructs in (B). Values are normalized to SNAP-mGluR2-TMD. Expression is not significantly different between constructs (one-way ANOVA, p=0.30). (D) Calcium imaging glutamate concentration response curves for mGluR2 and mGluR2-I779A (EC50 = 18.66 ± 0.80). All values are normalized to saturating (1 mM) glutamate. * indicates statistical significance (two-way ANOVA, p=1.2E-10). (E) Glutamate calcium imaging concentration response curves for mGluR3 and mGluR3-I788A (EC50 = 10.43 ± 0.10). All values are normalized to saturating (1 mM) glutamate. * indicates statistical significance (two-way ANOVA, p=8.2E-10). (F) Summary of glutamate EC50 shifts relative to wild type mGluR2 or mGluR3 obtained for their respective mutants. * indicates statistical significance (two-way ANOVA; for mGluR2 vs. mGluR2-I779A, p=1.2E-10; for mGluR2 vs. mGluR2-I779W, p=0.0028; for mGluR2 vs. mGluR2-P778A-I779A, p=0.0015; for mGluR3 vs. mGluR3-I788A, p=8.2E-10). mGluR2-P778A is not significantly different from mGluR2 (two-way ANOVA, p=0.27). (G) LY48 calcium imaging concentration response curves for mGluR2 and mGluR2-I779A (EC50 = 5.46 ± 0.01). mGluR2-I779A has ~31% lower efficacy than mGluR2 at saturating LY48. All values are normalized to saturating (1 mM) glutamate. * indicates statistical significance (two-way ANOVA, p=6.2E-9). (H) Glutamate FRET concentration response curve for mGluR2 and mGluR2-I779A (EC50 = 33.63 ± 0.07). All values are normalized to saturating (1 mM) glutamate. * indicates statistical significance (two-way ANOVA, p=0.00060). (I) Glutamate FRET concentration response curve for mGluR3 and mGluR3-I788A (EC50 = 0.66 ± 0.05). All values are normalized to saturating (1 mM) glutamate. * indicates statistical significance (two-way ANOVA, p=0.030). Associated figure supplement includes Figure 5—figure supplement 1.
-
Figure 5—source data 1
Data and statistics for Figure 5 and associated supplemental figure.
- https://cdn.elifesciences.org/articles/67027/elife-67027-fig5-data1-v2.xlsx
Figure 5—figure supplement 1
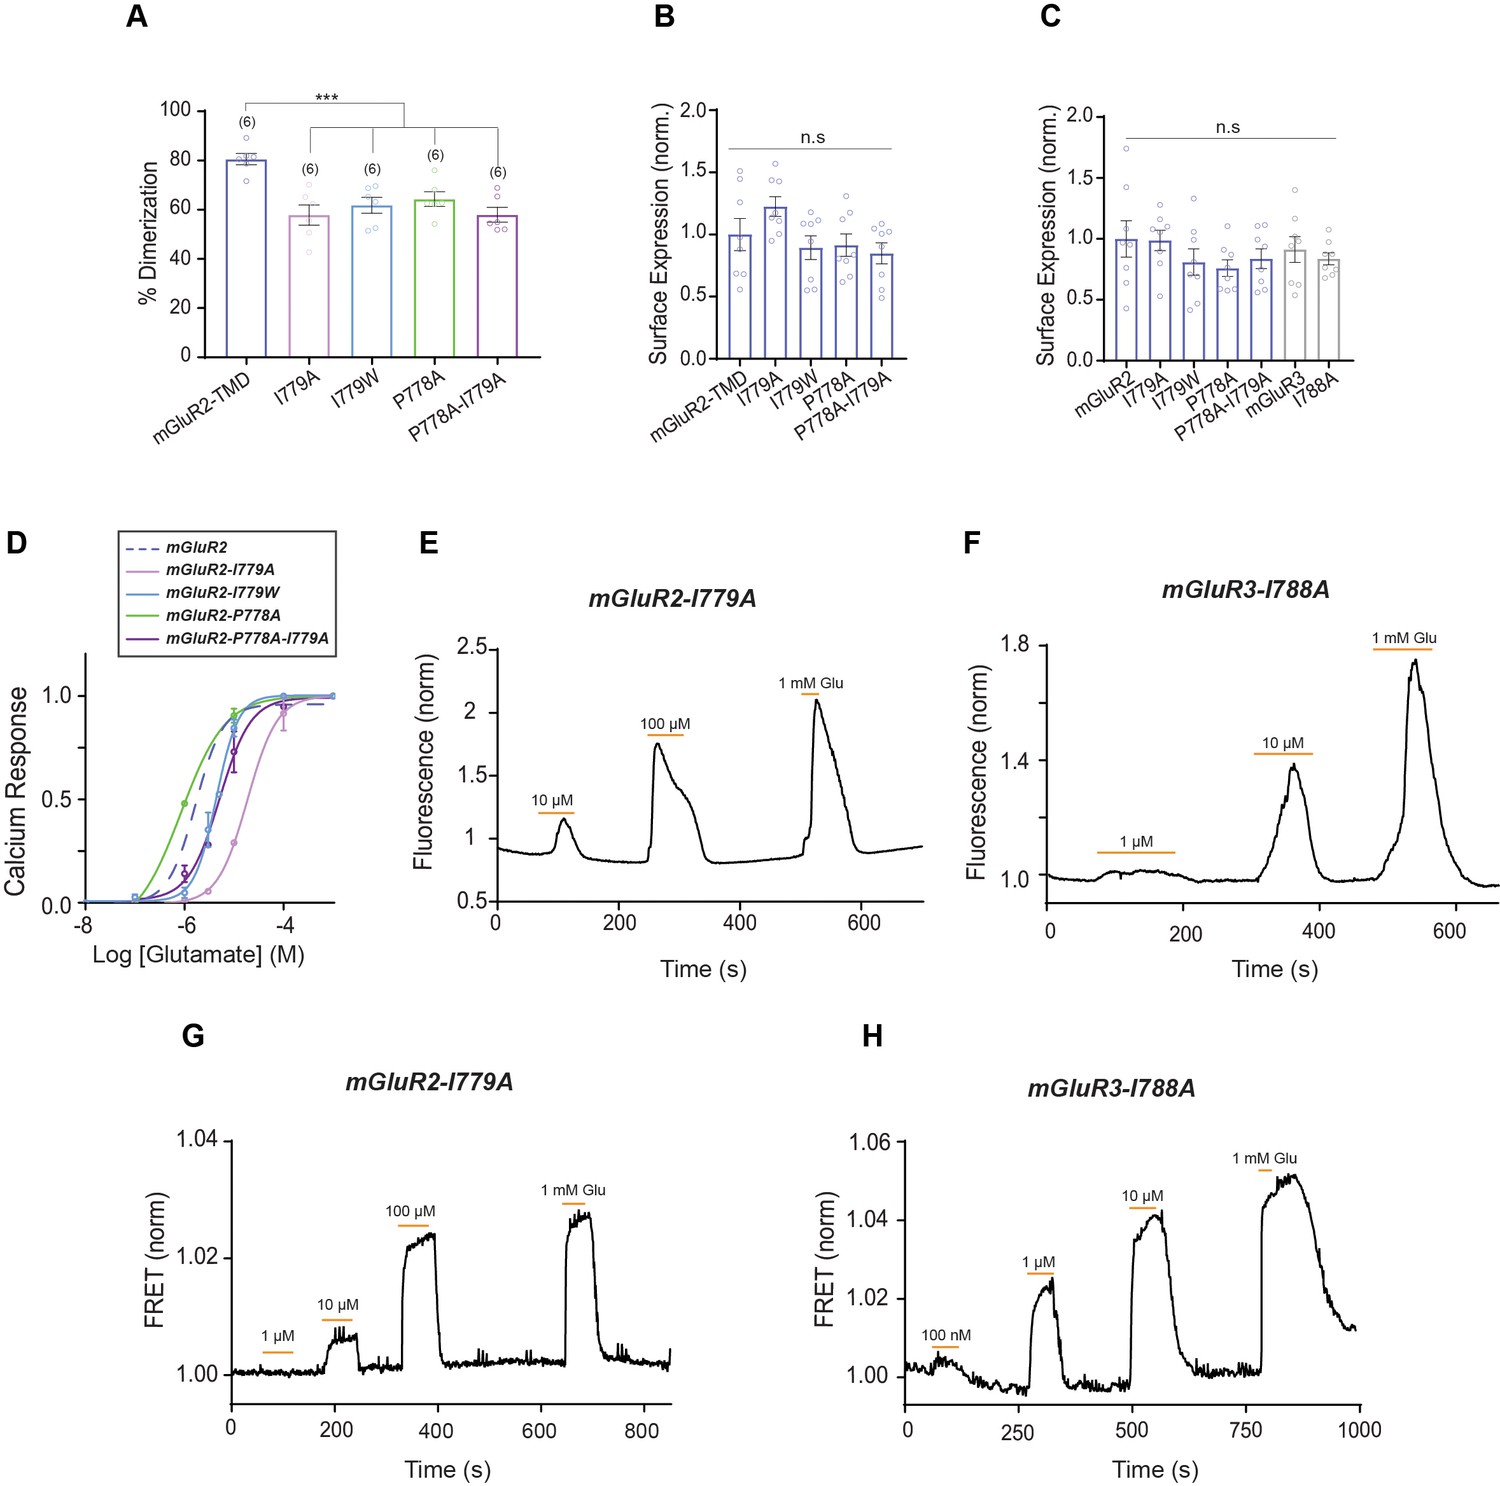
Further characterization of TM6 in mGluR activation.
(A) Bar graph showing percent dimerization for SNAP-tagged constructs labeled with LD555. * indicates statistical significance (one-way ANOVA, p=1.7E-5; Tukey-Kramer for mGluR2-TMD vs. mGluR2-TMD-I779A p=4.2E-5, for mGluR2-TMD vs. mGluR2-TMD-I779W p=0.00040, for mGluR2-TMD vs. mGluR2-TMD-P778A p=0.0017, for mGluR2-TMD vs. mGluR2-TMD-P778A-I779A p=4.5E-5). (B) Bar graph showing surface expression for TM6 mutant TMD constructs. Values are normalized to SNAP-mGluR2-TMD. Expression is not significantly different between constructs (one-way ANOVA, p=0.071). (C) Bar graph showing surface expression for TM6 mutant constructs. Values are normalized to SNAP-mGluR2. Expression is not significantly different between constructs (one-way ANOVA, p=0.51). (D) Glutamate calcium imaging concentration response curves for mGluR2 and TM6 mutants mGluR2-I779A (EC50 = 18.66 ± 0.08), -I779W (EC50 = 4.37 ± 0.04), -P778A (EC50 = 0.85 ± 0.1), -P778A-I779A (EC50 = 5.09 ± 0.08). * indicates statistical significance (two-way ANOVA; for mGluR2 vs. mGluR2-I779A, p=1.2E-10; for mGluR2 vs. mGluR2-I779W, p=0.003; for mGluR2 vs. mGluR2-P788A-I779A, p=0.0015). mGluR2-P788A is not significantly different from mGluR2 (two-way ANOVA, p=0.27). (E) Representative trace showing calcium responses induced by glutamate application from HEK 293 T cells expressing mGluR2-I779A, a G-protein chimera and GCaMP6f. (F) Representative trace showing calcium responses induced by glutamate application from HEK 293 T cells expressing mGluR3-I788A, a G-protein chimera and GCaMP6f. (G) Representative FRET trace for mGluR2-I779A. (H) Representative FRET trace for mGluR3-I788A. Number of movies analyzed for each condition is shown in parenthesis above each bar. Error bars represent s.e.m.
Figure 6 with 1 supplement

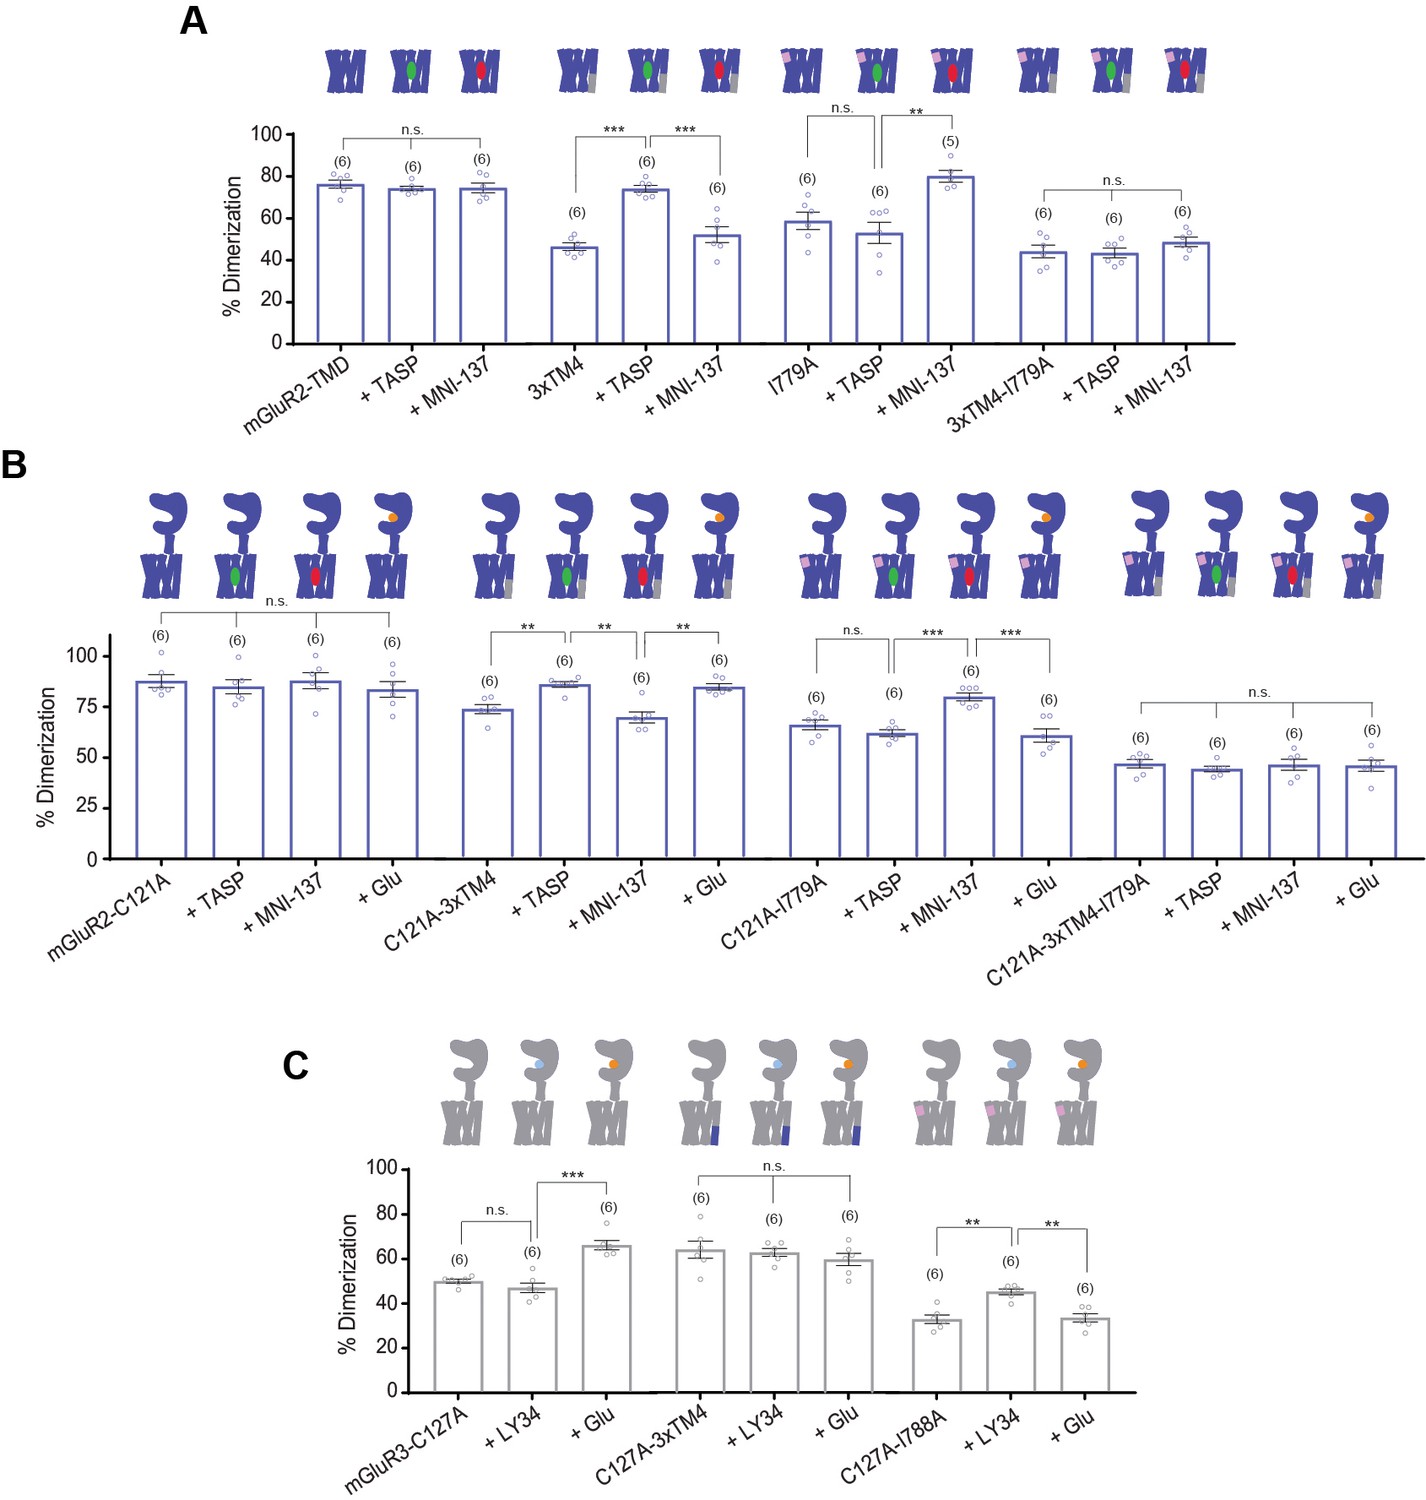
SiMPull analysis of ligand induced inter-TMD dimer rearrangement.
(A) Bar graph showing percent dimerization for SNAP-tagged constructs labeled with LD555. * indicates statistical significance (one-way ANOVA, p=3.9E-7; Tukey-Kramer for mGluR2-TMD vs. mGluR2-TMD-3xTM4-I779A p=5.1E-7). Shaded bars indicate data is repeated from Figures 2C and 5B. (B) Bar graph showing surface expression for constructs in (A). Values are normalized to SNAP-mGluR2-TMD. Expression is not significantly different between constructs (one-way ANOVA, p=0.86). (C) Bar graph showing the percent change in dimerization compared to no drug conditions for SNAP-tagged constructs labeled with LD555. * indicates statistical significance (one-way ANOVA, p=4.4E-16; Tukey-Kramer for mGluR2-TMD-3xTM4 vs. mGluR2-TMD-3xTM4 + TASP p=7.1E-6, for mGluR2-TMD-I779A vs. mGluR2-TMD-I779A + MNI 137 p=0.0036). (D) Bar graph showing percent dimerization for SNAP-tagged constructs labeled with LD555. * indicates statistical significance (one-way ANOVA, p=7.4E-11; Tukey-Kramer for mGluR2-C121A vs. mGluR2-C121A-I779A p=6.7E-7, for mGluR2-C121A-I779A vs. mGluR2-C121A-3xTM4-I779A p=0.00021). Shaded bars indicate data is repeated from Figures 1F and 2E. (E) Bar graph showing surface expression for constructs in (D). Values are normalized to SNAP-mGluR2-C121A. Expression is not significantly different between constructs (one-way ANOVA, p=0.89). (F) Bar graph showing the percent change in dimerization compared to no drug conditions for SNAP-tagged constructs labeled with LD555. * indicates statistical significance (one-way ANOVA, p=1.4E-31; Tukey-Kramer for mGluR2-C121A-3xTM4 vs. mGluR2-C121A-3xTM4 + TASP p=0.0029, for mGluR2-C121A-3xTM4 vs. mGluR2-C121A-3xTM4 + Glu p=0.0093, for mGluR2-C121A-I779A vs. mGluR2-C121A-I779A + MNI 137 p=0.036). (G) Bar graph showing percent dimerization for SNAP-tagged constructs labeled with LD555. * indicates statistical significance (one-way ANOVA, p=1.2E-7; Tukey-Kramer for mGluR3-C127A vs. mGluR3-C127A-I788A p=0.0033). Shaded bars indicate data is repeated from Figures 1F and 2G. (H) Bar graph showing surface expression for constructs in (G). Values are normalized to SNAP-mGluR3-C127A. Expression is not significantly different between constructs (one-way ANOVA, p=0.79). (I) Bar graph showing the percent change in dimerization compared to no drug conditions for SNAP-tagged constructs labeled with LD555. * indicates statistical significance (one-way ANOVA, p=1.5E-12; Tukey-Kramer for mGluR3-C127A vs. mGluR3-C127A + Glu p=9.8E-7, for mGluR3-C127A-I788A vs. mGluR3-C127A-I788A + LY34 p=0.011). The number of movies analyzed is shown in parentheses. Error bars represent s.e.m. (J) Schematic summarizing data indicating that TM4 mediates inactive interfaces which reorient to a TM6 interface upon activation by PAMs or agonists. Associated figure supplement includes Figure 6—figure supplement 1.
-
Figure 6—source data 1
Data and statistics for Figure 6 and associated supplemental figure.
- https://cdn.elifesciences.org/articles/67027/elife-67027-fig6-data1-v2.xlsx
Figure 6—figure supplement 1
Analysis of ligand induced inter-TMD rearrangement by SiMPull.
(A) Bar graph showing percent dimerization for SNAP-tagged constructs labeled with LD555 (one-way ANOVA, p=0.008). Application of PAM or NAM does not alter mGluR2-TMD dimerization. Application of PAM increases dimerization for mGluR2-TMD-3xTM4 compared to no drug and NAM conditions. * indicates statistical significance (Tukey-Kramer for mGluR2-TMD-3xTM4 vs. mGluR2-TMD-3xTM4 + TASP p=7.1E-6, for mGluR2-TMD-3xTM4 + TASP vs. mGluR2-TMD-3xTM4 + MNI 137 p=0.00018). Application of NAM significantly increases dimerization for mGluR2-TMD-I779A compared to no drug and NAM conditions (Tukey-Kramer for mGluR2-TMD-I779A + TASP vs. mGluR2-TMD-I779A + MNI 137 p=3.2E-5). Application of PAM or NAM does not alter mGluR2-TMD-3xTM4-I779A dimerization. (B) Bar graph showing percent dimerization for SNAP-tagged constructs labeled with LD555 (one-way ANOVA, p=1.4E-31). Application of ligand does not alter mGluR2-C121A dimerization. Application of PAM and glutamate significantly increases dimerization for mGluR2-C121A-3xTM4 compared to no drug and NAM conditions. * indicates statistical significance (Tukey-Kramer for mGluR2-C121A-3xTM4 vs. mGluR2-C121A-3xTM4 + TASP p=0.0028, for mGluR2-C121A-3xTM4 + TASP vs. mGluR2-C121A-3xTM4 + MNI 137 p=0.0045, for mGluR2-C121A-3xTM4 + MNI 137 vs. mGluR2-C121A-3xTM4 + Glu, p=0.013). Application of NAM significantly increases dimerization for mGluR2-C121A-I779A compared to no drug, PAM, and glutamate conditions. (Tukey-Kramer for mGluR2-C121A-I779A + TASP vs. mGluR2-C121A-I779A + MNI 137 p=0.00097; for mGluR2-C121A-I779A + MNI 137 vs. mGluR2-C121A-I779A + Glu p=0.00030). Application of ligand does not alter mGluR2-C121A-3xTM4-I779A dimerization. (C) Bar graph showing percent dimerization for SNAP-tagged constructs labeled with LD555 (one-way ANOVA, p=1.46E-12). Application of glutamate significantly increases dimerization for mGluR3-C127A compared to no drug and LY34 conditions. * indicates statistical significance (Tukey-Kramer for mGluR3-C127A + LY34 vs. mGluR3-C127A + Glu p=1.0E-5). Application of ligand does not alter mGluR3-C127A-3xTM4 dimerization. Application of LY34 significantly increases dimerization for mGluR3-C127A-I788A compared to no drug and glutamate conditions. (Tukey-Kramer for mGluR3-C127A-I788A vs. mGluR3-C127A-I788A + LY34, p=0.011; for mGluR3-C127A-I788A + LY34 vs. mGluR3-C127A-I788A + Glu, p=0.018). Number of movies analyzed for each condition is shown in parenthesis above each bar. Error bars represent s.e.m.
Figure 7 with 2 supplements
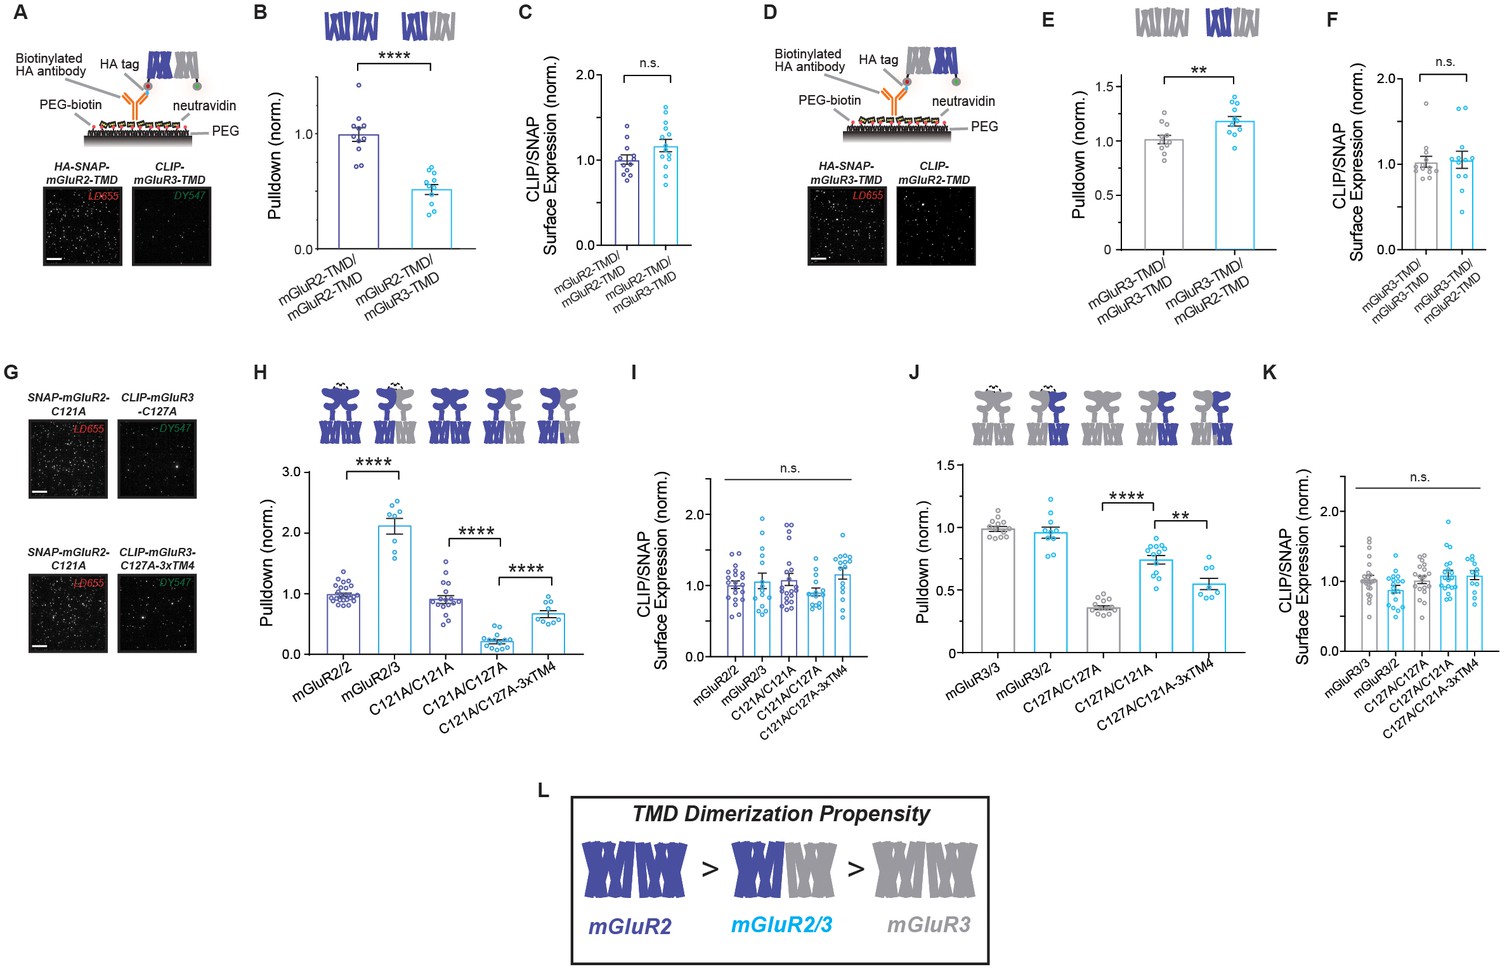
mGluR2/3 heterodimers show intermediate inter-TMD dimerization propensity compared to parent homodimers.
(A) Top, schematic of two-color heterodimer SiMPull experiments where HA-SNAP-mGluR2-TMD (labeled with LD655) is able to immobilize CLIP-mGluR3-TMD (labeled with DY-547). Bottom, representative image showing efficient pulldown in both channels, indicative of heterodimerization of mGluR2 and mGluR3 TMDs. (B) Summary bar graph showing the efficiency of pulldown of either CLIP-mGluR2-TMD or CLIP-mGluR3-TMD by SNAP-mGluR2-TMD. * indicates statistical significance (unpaired t-test; p=2.2E-6). (C) Bar graph showing ratio of surface expression of CLIP- to SNAP-tagged constructs in (B). Values are normalized to SNAP-mGluR2-TMD + CLIP-mGluR2-TMD. Expression ratio is not significantly different between constructs (unpaired t-test, p=0.087). (D) Top, schematic of two-color heterodimer SiMPull experiments where HA-SNAP-mGluR3-TMD (labeled with LD655) is able to immobilize CLIP-mGluR2-TMD (labeled with DY-547) via an anti-HA antibody. Bottom, representative image showing efficient pulldown in both channels, indicative of heterodimerization. (E) Summary bar graph showing the efficiency of pulldown of either CLIP-mGluR2-TMD or CLIP-mGluR3-TMD by SNAP-mGluR2-TMD. * indicates statistical significance (unpaired t-test; p=0.0097). (F) Bar graph showing ratio of surface expression of CLIP- to SNAP-tagged constructs in (E). Values are normalized to SNAP-mGluR3-TMD + CLIP-mGluR3-TMD. Expression ratio is not significantly different between constructs (unpaired t-test, p=0.84). (G) Representative images showing SiMPull of full-length CLIP-mGluR3 by full-length HA-SNAP-mGluR2. (H) Summary bar graph showing efficiency of pulldown of wild type and mutant full-length CLIP-tagged mGluR2 and mGluR3 by HA-SNAP-mGluR2. * indicates statistical significance (one-way ANOVA, p=1.5E-28; Tukey-Kramer for mGluR2/mGluR2 vs. mGluR2/mGluR3, p=1E-14; for C121A/C121A vs. C121A/C127A, p=1E-14; for C121A/C127A vs. C121A/C127A-3xTM4, p=3.7E-6). (I) Bar graph showing ratio of surface expression of CLIP- to SNAP-tagged constructs in (H). Values are normalized to SNAP-mGluR2 +CLIP-mGluR2. Expression ratio is not significantly different between constructs (one-way ANOVA, p=0.26). (J) Summary bar graph showing efficiency of pulldown of wild type and mutant full-length CLIP-tagged mGluR2 and mGluR3 by HA-SNAP-mGluR3. * indicates statistical significance (one-way ANOVA, p=2.3E-21; for C127A/C127A vs. C127A/C121A, p=8E-12; for C127A/C121A vs. C127A/C121A-3xTM4, p=0.0017). (K) Bar graph showing ratio of surface expression of CLIP- to SNAP-tagged constructs in (H). Values are normalized to SNAP-mGluR3 +CLIP-mGluR3. Expression ratio is not significantly different between constructs (one-way ANOVA, p=0.11). (L) Summary schematic showing relative dimerization propensities of mGluR2, mGluR2/3 and mGluR3 TMD combinations. Associated figure supplements include Figure 7—figure supplements 1–2.
-
Figure 7—source data 1
Data and statistics for Figure 7 and associated supplemental figures.
- https://cdn.elifesciences.org/articles/67027/elife-67027-fig7-data1-v2.xlsx
Figure 7—figure supplement 1
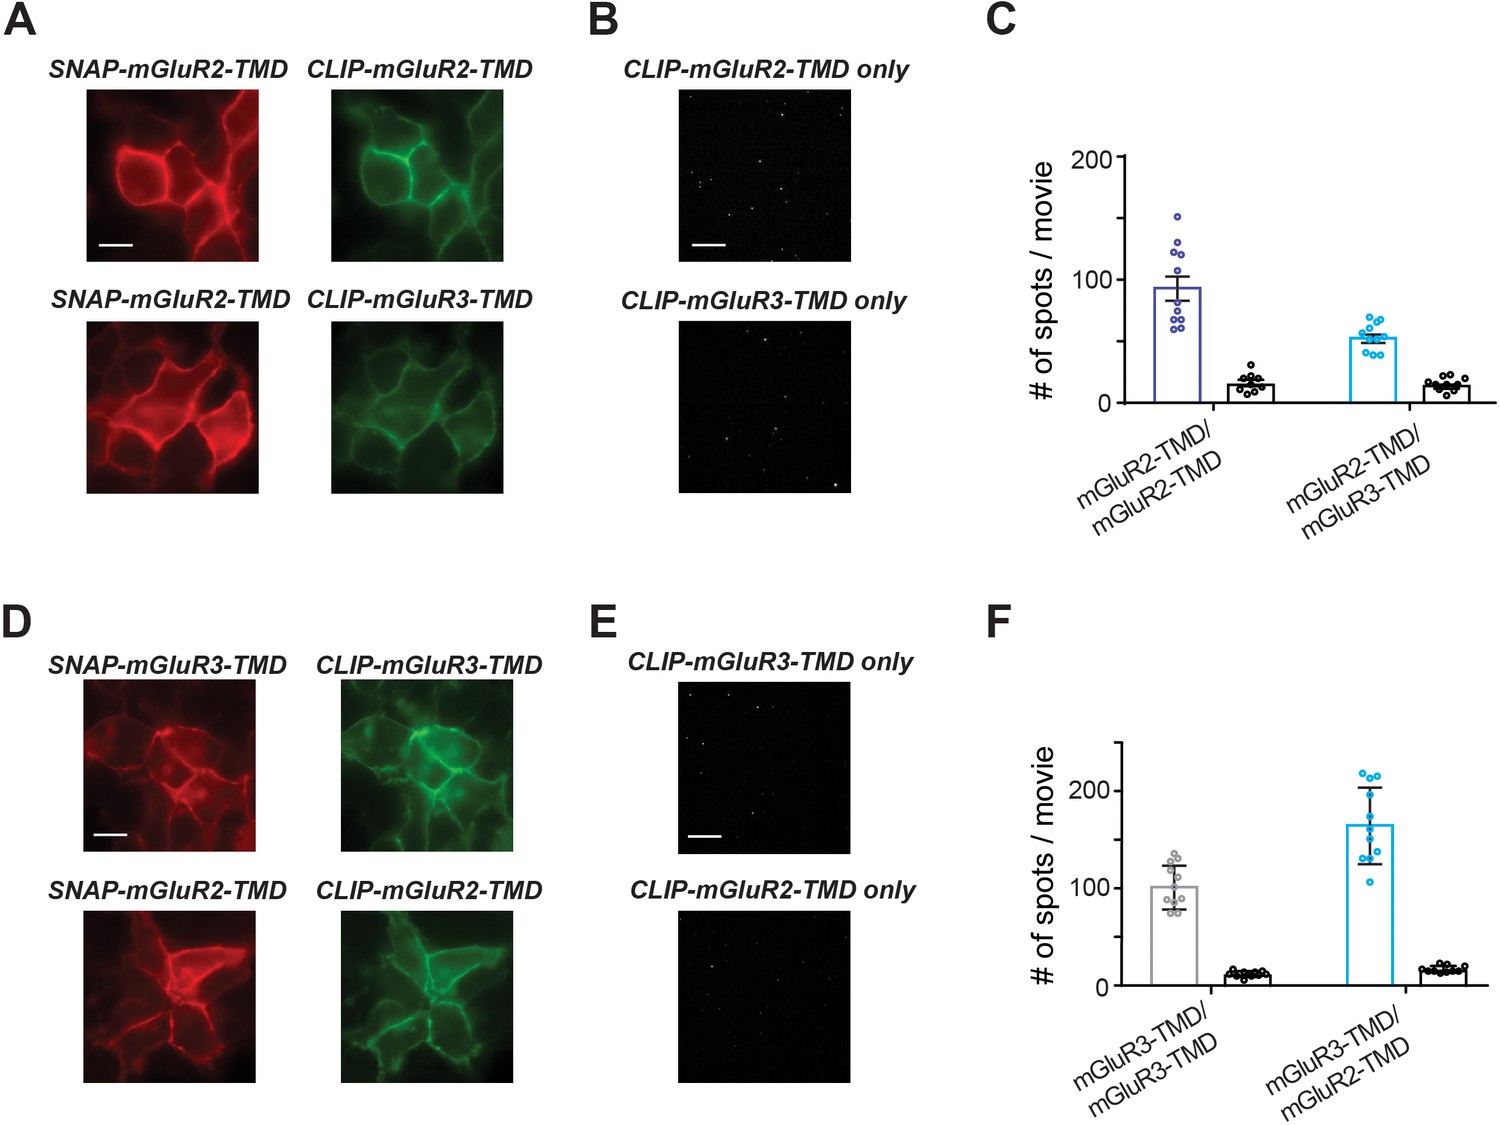
Further analysis of homo- and hetero-dimerization propensities of isolated group II mGluR TMDs.
(A) Representative images showing fluorophore-labeled receptors on the surface of HEK 293 T cells. Scale bar is 10 µm. (B) Representative SiMPull images showing background levels of pulldown from lysates containing only CLIP-tagged constructs lacking an HA tag. Scale bar is 10 µm. (C) Quantification of the number of immobilized spots for a representative experiment showing that SNAP-mGluR2-TMD is able to pull down a substantially higher amount of CLIP-mGluR2-TMD than CLIP-mGluR3-TMD. Background values for the CLIP construct expressed alone for each condition are shown as black bars. (D–F) Same as (A–C) but with SNAP-mGluR3-TMD conditions.
Figure 7—figure supplement 2
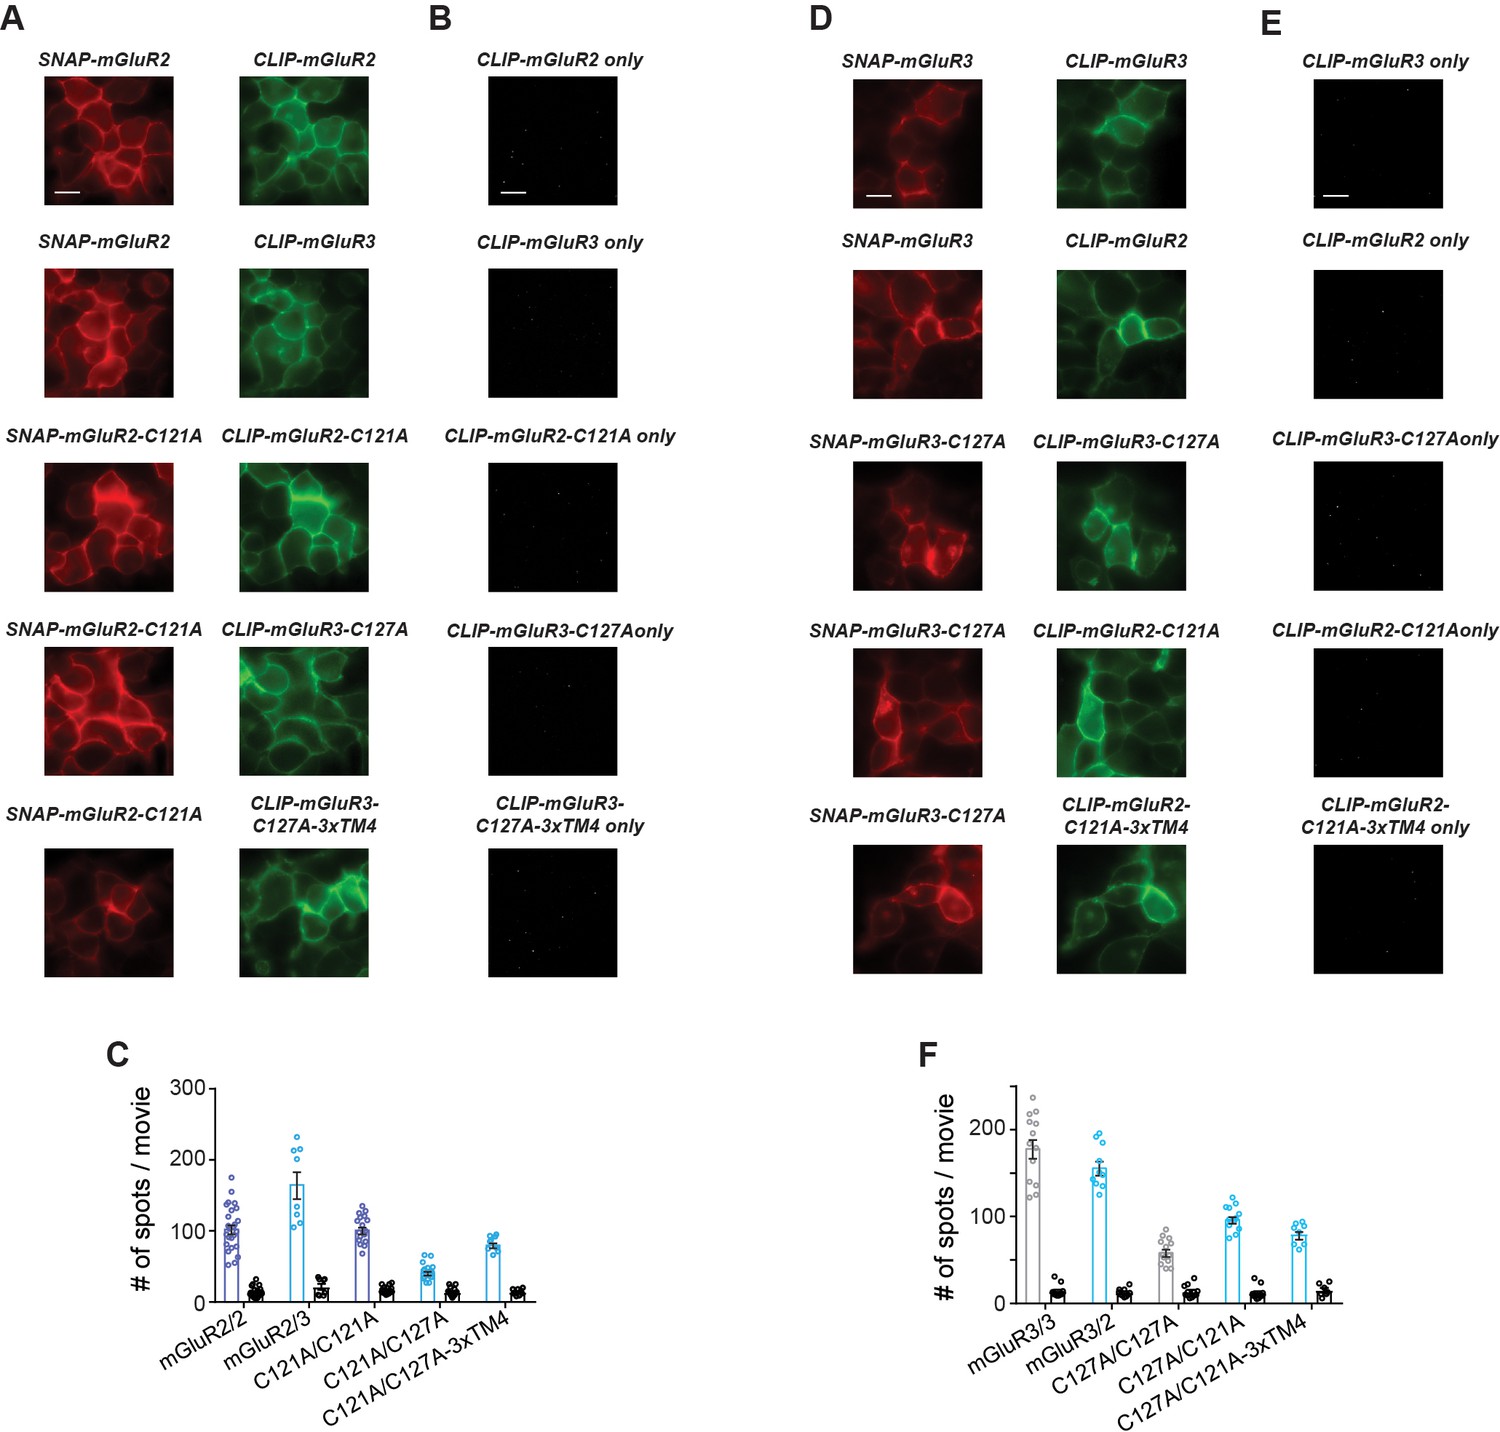
Further analysis of homo- and hetero-dimerization propensities of isolated full-length group II mGluRs.
(A) Representative images showing fluorophore-labeled receptors on the surface of HEK 293 T cells. Scale bar is 10 µm. (B) Representative SiMPull images showing background levels of pulldown from lysates containing only CLIP-tagged constructs lacking an HA tag. Scale bar is 10 µm. (C) Quantification of the number of immobilized spots for a representative SNAP-mGluR2 SiMPull experiment. Background values for the CLIP construct expressed alone for each condition are shown as black bars. (D–F) Same as (A–C) but with SNAP-mGluR3 full-length conditions.
Additional files
Download links
A two-part list of links to download the article, or parts of the article, in various formats.
Downloads (link to download the article as PDF)
Open citations (links to open the citations from this article in various online reference manager services)
Cite this article (links to download the citations from this article in formats compatible with various reference manager tools)
Differences in interactions between transmembrane domains tune the activation of metabotropic glutamate receptors
eLife 10:e67027.
https://doi.org/10.7554/eLife.67027


