Precise optical control of gene expression in C elegans using improved genetic code expansion and Cre recombinase
- Centre for Discovery Brain Sciences, University of Edinburgh, United Kingdom
- Medical Research Council Laboratory of Molecular Biology, United Kingdom
Figures
Figure 1
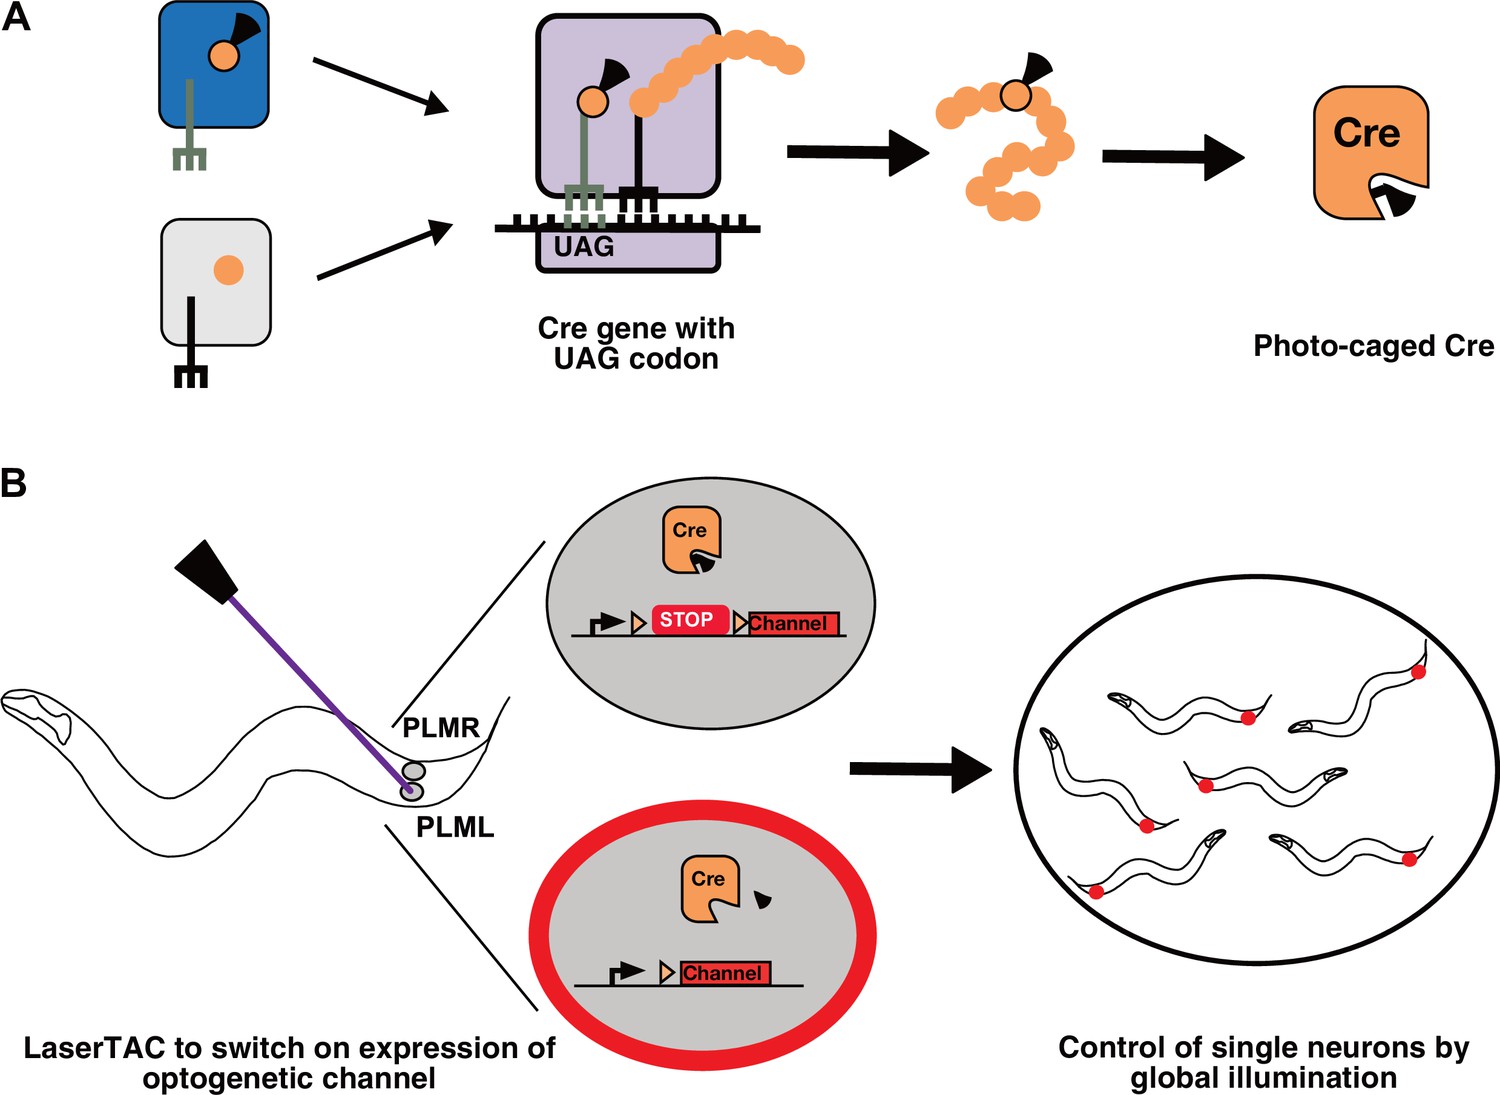
Genetic code expansion and LaserTAC.
(A) A non-canonical amino acid, e.g. photocaged lysine (PCK), is charged onto the orthogonal tRNACUA by the orthogonal aminoacyl-tRNAsynthetase (top left). The orthogonal components do not interact with the native cellular amino acids, tRNAs, or aminoacyl-tRNA-synthetases (bottom left). After charging, PCK is incorporated into the expanding polypeptide chain in response to an amber stop codon (UAG) during ribosomal translation. The resultant polypeptide is released following translation resulting in full-length photocaged Cre containing the PCK residue. (B) Photocaged Cre recombinase is activated cell-specifically in single C. elegans neurons by uncaging the PCK in its active site using a 365 nm laser. Activated Cre switches on expression of an optogenetic channel. Global illumination of freely moving animals can then be used to control cells expressing the optogenetic channel.
Figure 2 with 1 supplement
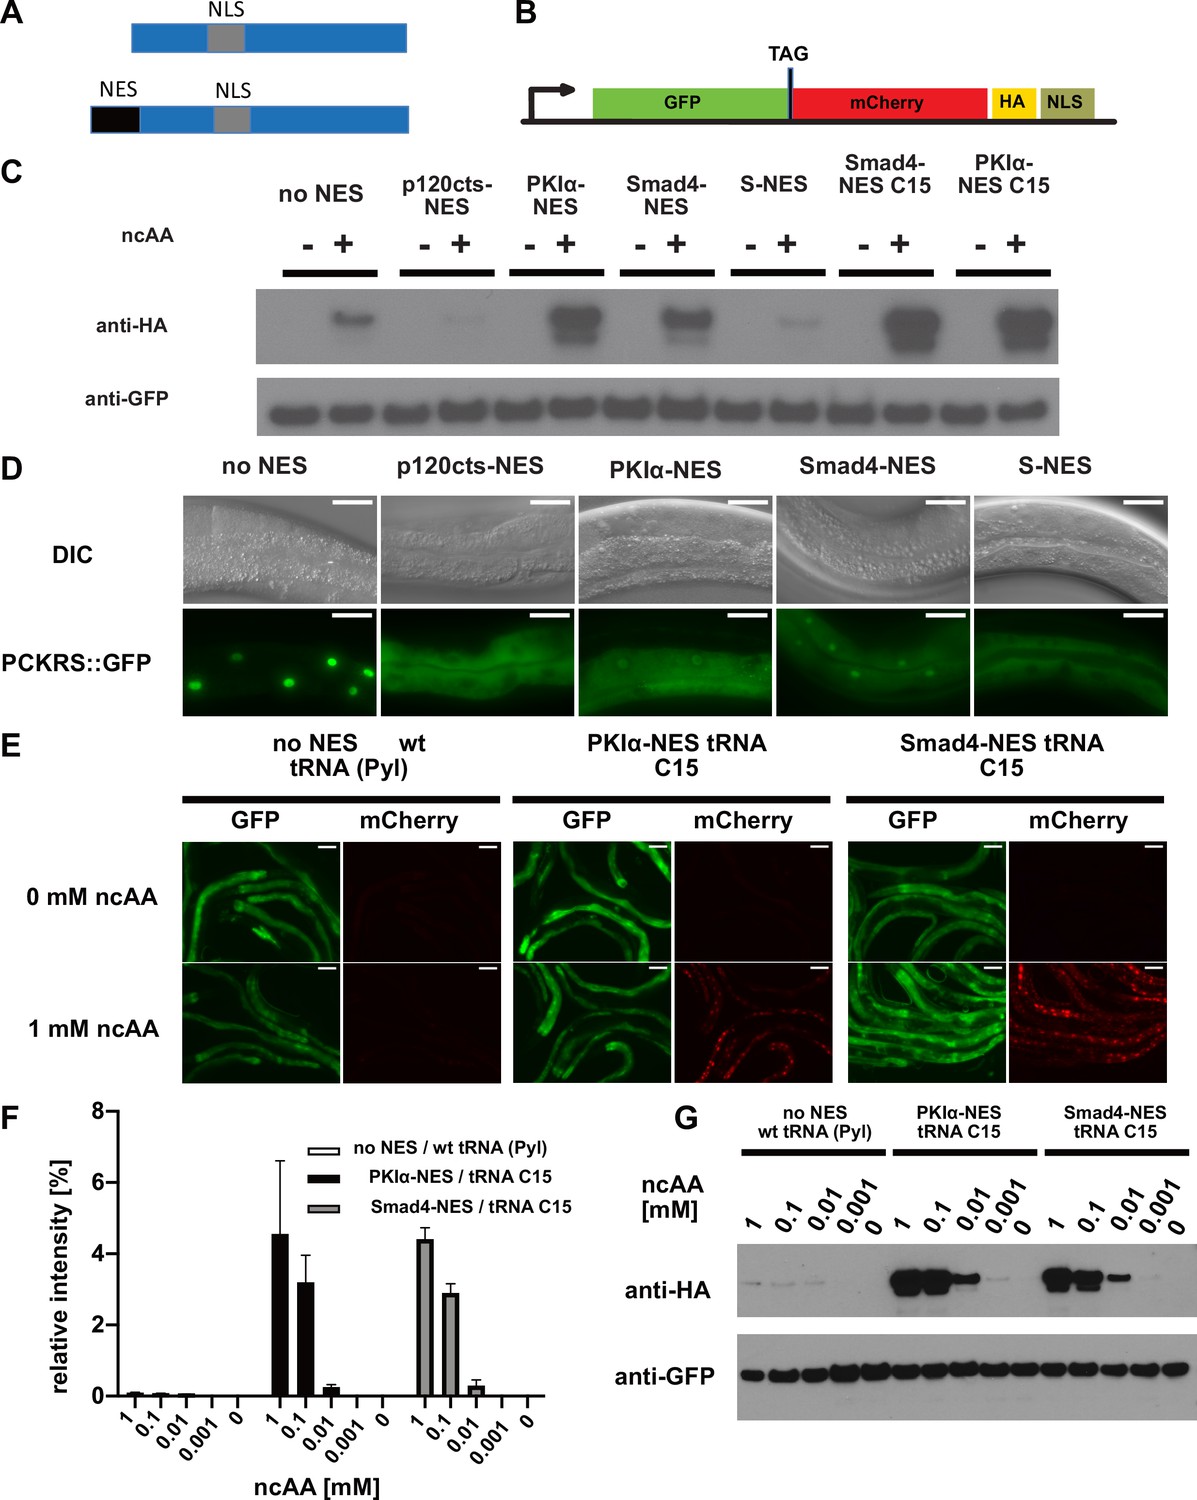
Efficiency of genetic code expansion is enhanced in C. elegans by use of NES::PCKRS variants and tRNA(C15).
(A) Wildtype PylRS/PCKRS (top) contains an internal nuclear localisation sequence (NLS) which targets it to the nucleus. A strong nuclear export sequence (NES) can be added to PylRS/PCKRS to shift it to the cytoplasm (bottom). (B) The GFP::mCherry reporter has an intersubunit linker containing an amber stop codon (TAG) to direct incorporation of ncAA. The C-terminal NLS moves full-length product to the nucleus, providing a second visual readout, whilst the C-terminal HA tag provides a target for western blotting of full-length protein. (C) Western blot (anti-HA) for full-length reporter produced using PCKRS with different NES attached to the N-terminus. For comparison, the wildtype PCKRS without NES and the two best NES variants together with optimised tRNA(C15) are also shown. + or – indicates the respective presence or absence of 1 mM ncAA. Samples were normalised using anti-GFP. Quantitative western blots of the lines used are shown in Figure 2—figure supplement 1A. (D) Nuclear localisation of NES variants fused to PCKRS. Localisation visualised by imaging of a GFP protein directly fused to each NES::PCKRS variant. Scale bars 30 µm. Nuclear to cytoplasmic ratios for the wild-type PCKRS::GFP fusion and two independent lines for each NES variant are shown in Figure 2—figure supplement 1B. (E) Fluorescent images of randomly selected worms grown in the presence or absence of 1 mM non-canonical amino acid (ncAA). GFP indicates expression of reporter construct, mCherry indicates the presence of full-length reporter protein. Scale bars 80 µm. Enlarged versions of the images for PKIa-NES and Smad4-NES are shown in Figure 2—figure supplement 1C. (F) Quantification of western blots of wild-type PCKRS (‘no NES’)/tRNA(Pyl) vs. both PKIα-NES::PCKRS/tRNA(C15) and Smad4-NES::PCKRS/tRNA(C15) at different ncAA concentrations; anti-GFP was used to detect both the full-length GFP;;mCherry protein as well as the GFP truncated at the amber stop. The graphs show the relative intensities of the full-length GFP signal vs. the signal of the GFP truncated at the amber stop codon. Graphs represent the average of two lines and three independent experiments per condition, each experiment was blotted twice. (G) Conditions shown in (F) probed with anti-HA and anti-GFP. In (G), only one line was blotted for each condition.
-
Figure 2—source data 1
Band intensities for the quantitative western blots shown in Figure 2F.
- https://cdn.elifesciences.org/articles/67075/elife-67075-fig2-data1-v3.xlsx
Figure 2—figure supplement 1
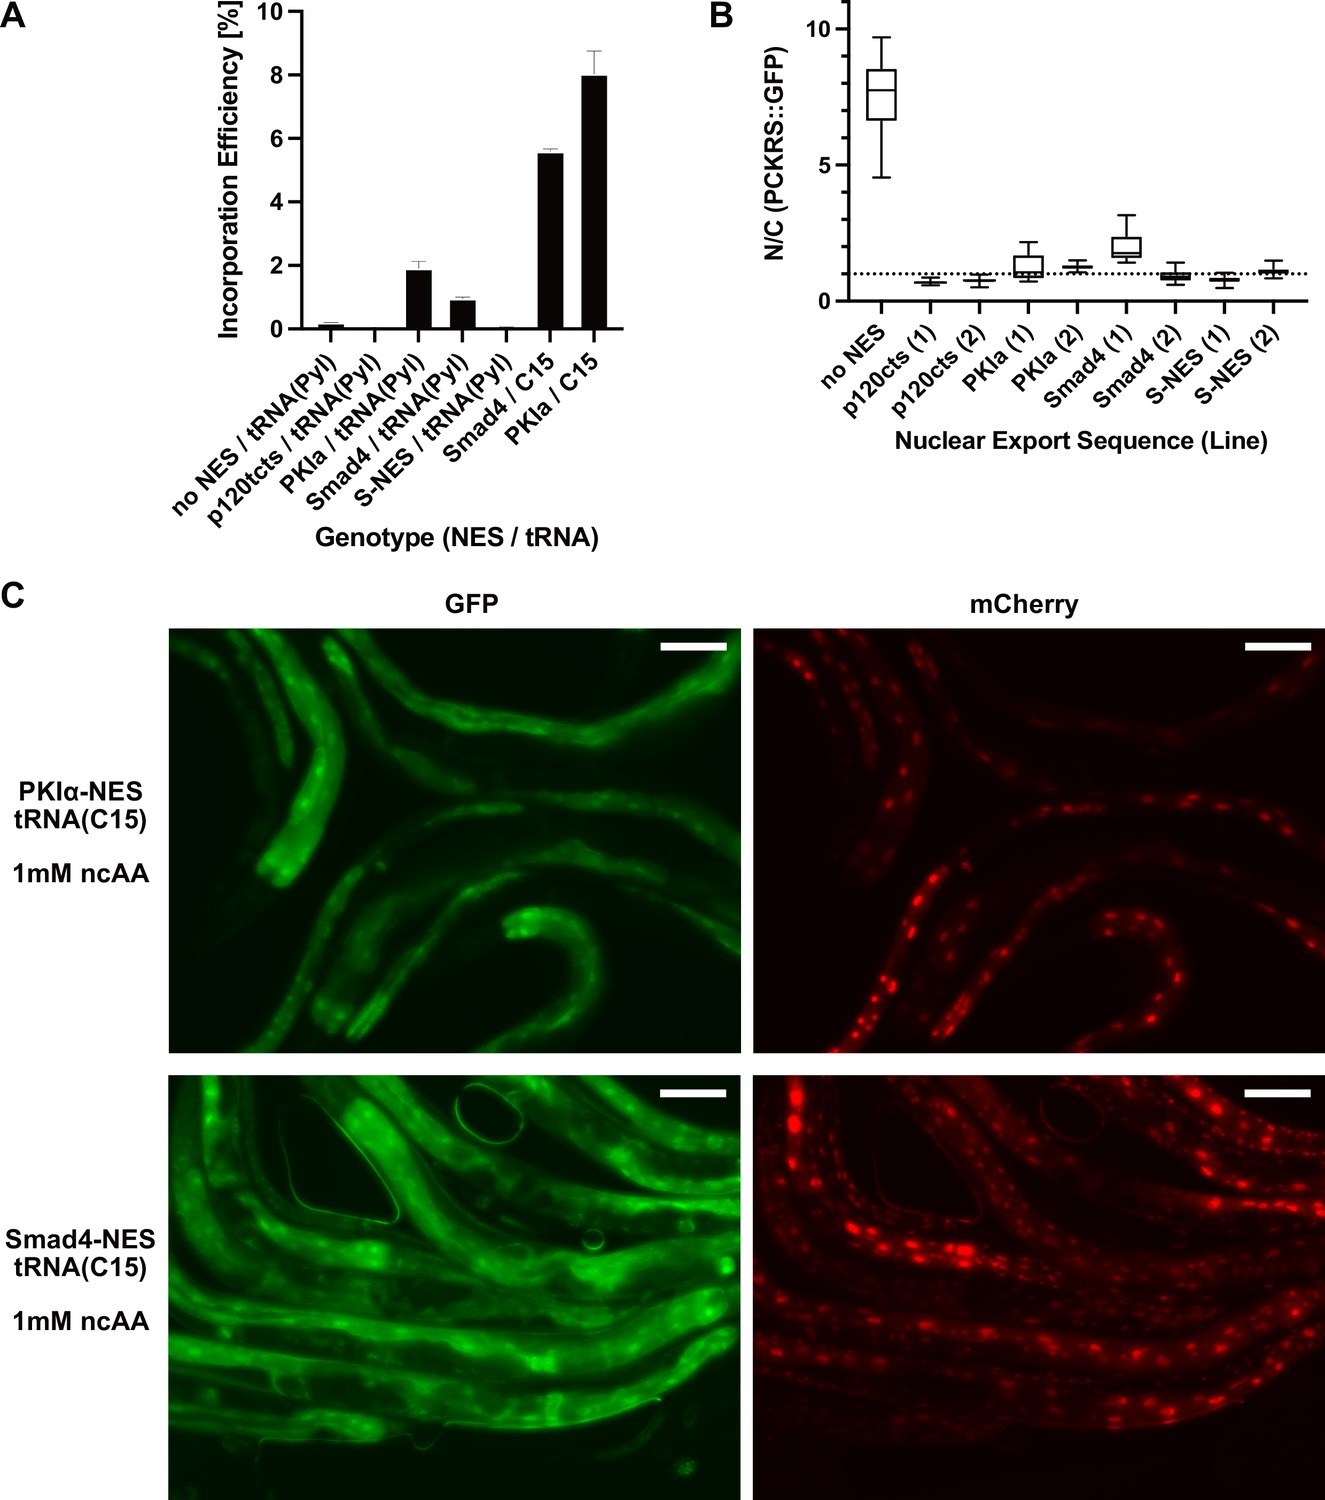
Nuclear export sequences reduce nuclear localisation of PCKRS::GFP and increase ncAA incorporation efficiency.
(A) Quantitative western blot of the lines blotted in Figure 2C. Each line was measured twice, the graph shows the mean and SEM. (B) Nuclear to cytoplasmic ratio of PCKRS::GFP fusion proteins with different nuclear export sequences for the genotypes shown in Figure 2B. Two independent lines were measured for each nuclear export sequence. N/C ratios were determined for n > 12 cells taken from at least three animals for each line. The animals shown in Figure 2B are from the first line for each NES (labelled ‘(1)’). Statistical significance was determined by Mann–Whitney, p<0.0001 for all NES lines compared to the wildtype no NES PCKRS::GFP. (C) Fluorescent images of worms shown in Figure 2E. Only the panels of animals grown in the presence of 1 mM non-canonical amino acid (ncAA) are shown. GFP indicates expression of reporter construct, mCherry indicates the presence of full-length reporter protein. Scale bars 30 µm.
-
Figure 2—figure supplement 1—source data 1
Band intensities for the quantitative western blots shown in Supplementary file 1A.
Nuclear cytoplasmic ratios for lines shown in Supplementary file 1B.
- https://cdn.elifesciences.org/articles/67075/elife-67075-fig2-figsupp1-data1-v3.xlsx
Figure 3 with 1 supplement
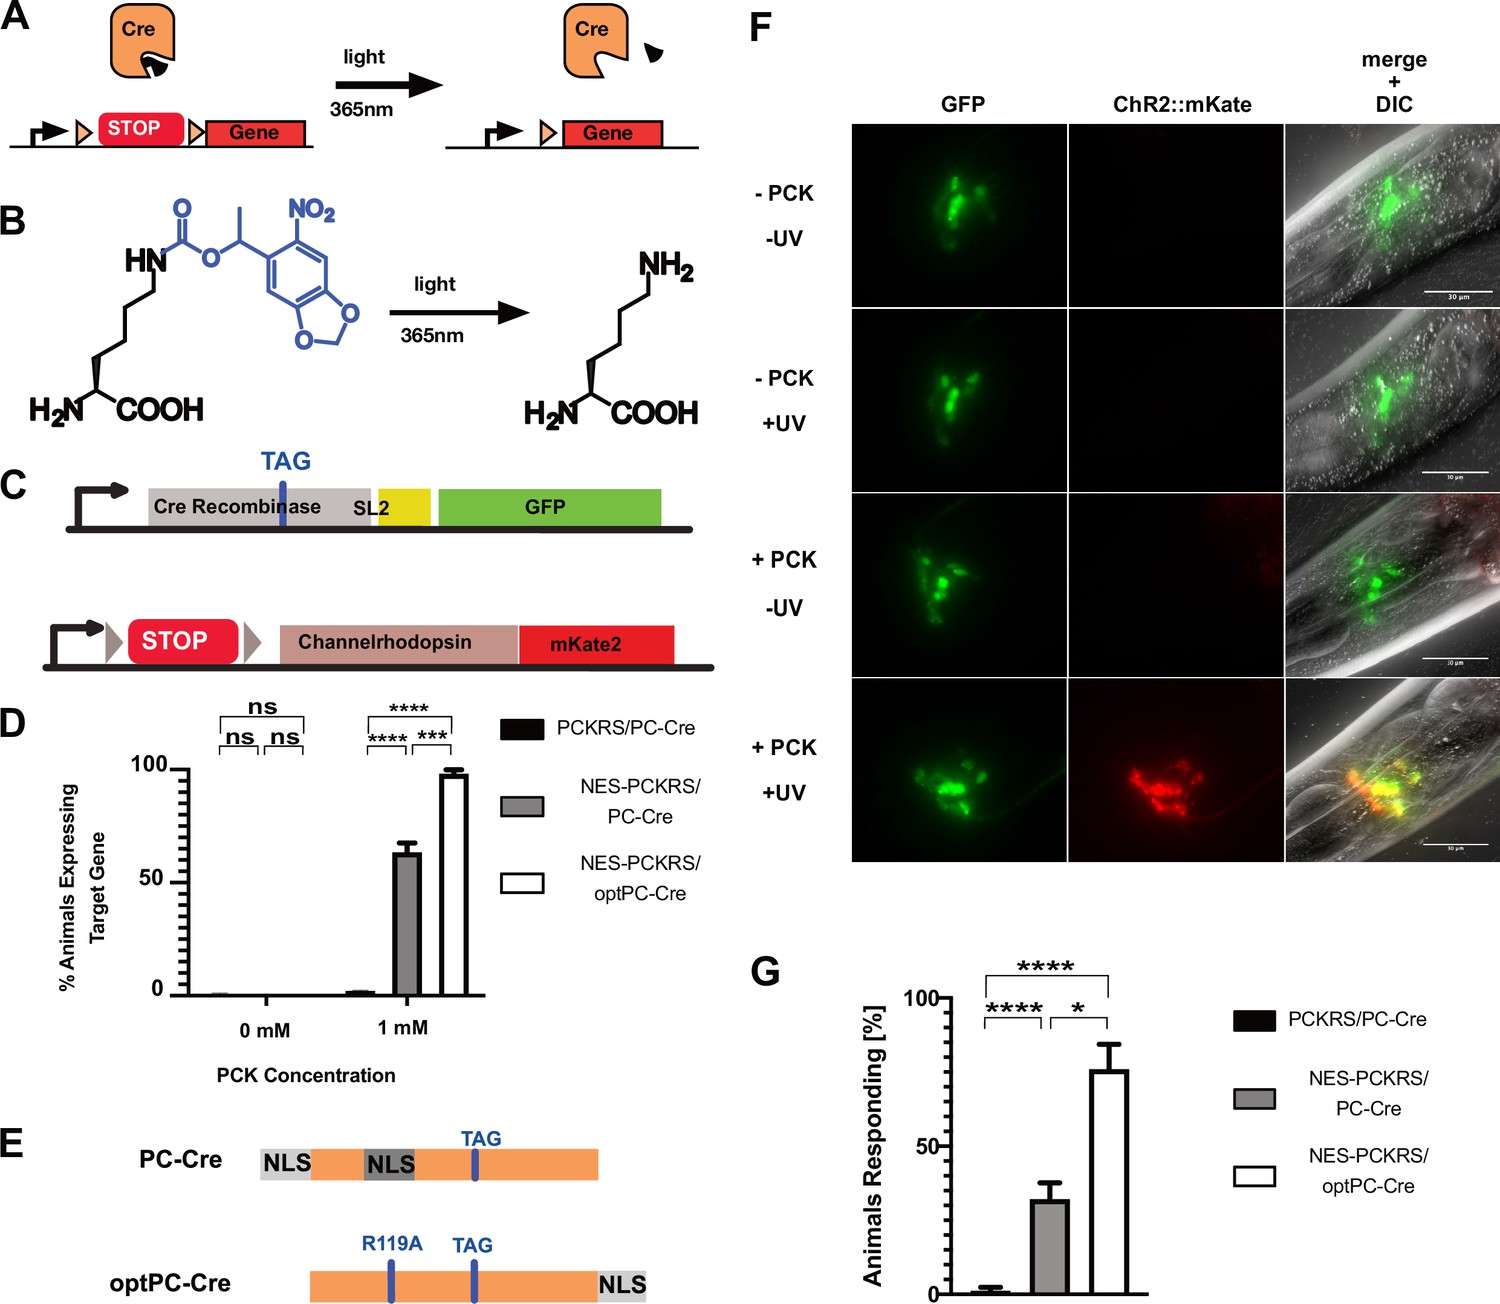
Optimisation of PC-Cre recombinase for genetic code expansion in C. elegans.
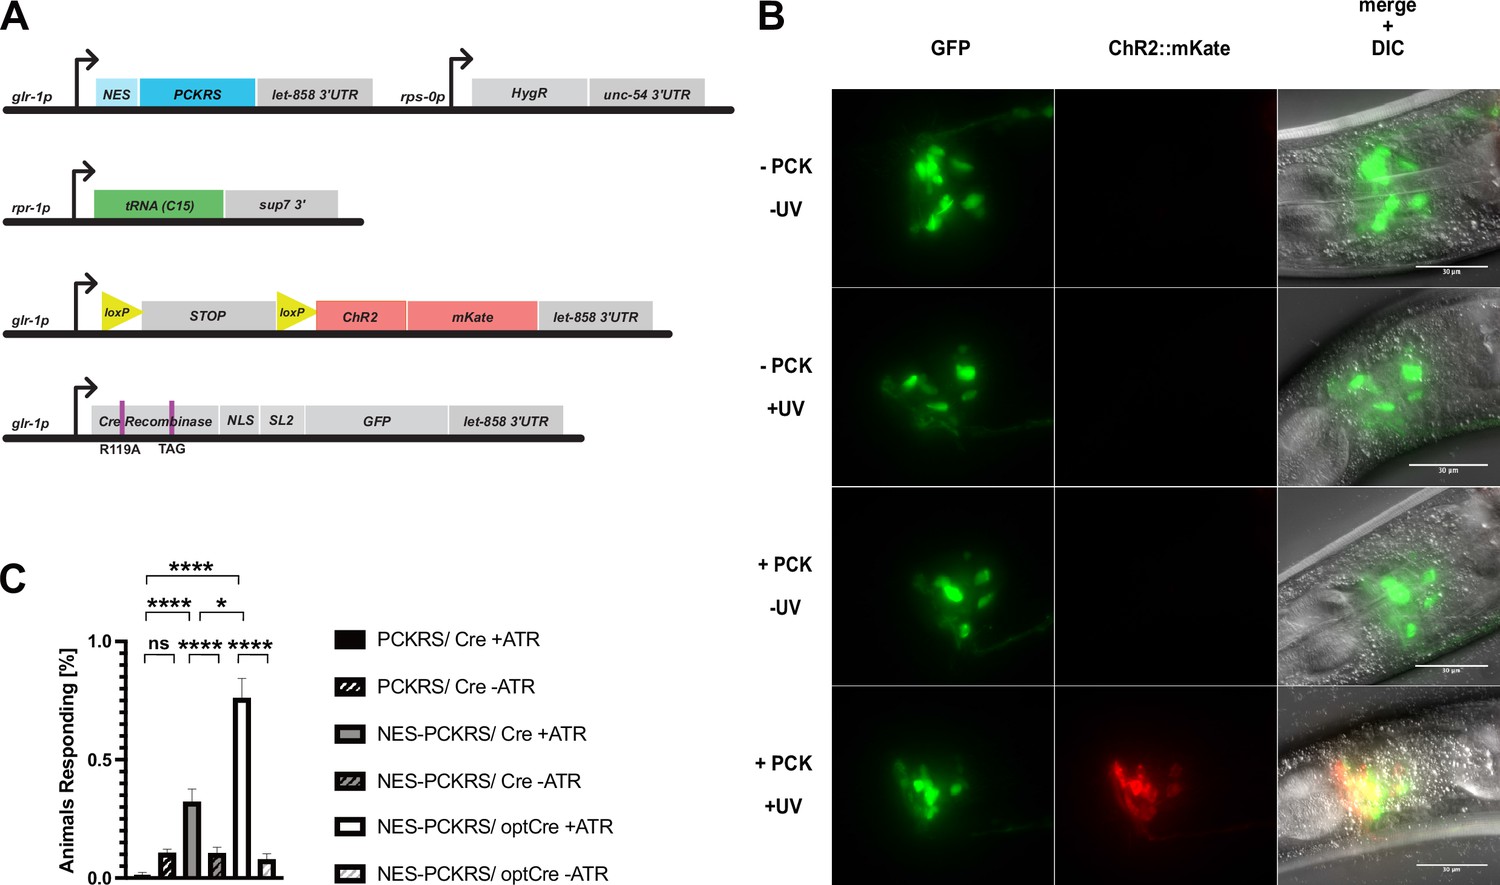
(A) Cre recombinase can be photocaged by incorporating a photocaged non-canonical amino acid (ncAA) into the active site (black wedge). Transcription of a target gene is blocked by placing a transcription terminator sequence (‘STOP’) between the gene and its promoter. The terminator sequence is flanked by loxP sites (orange triangles). Upon illumination at 365 nm, the photocaging group is removed and the uncaged, active Cre removes the transcriptional terminator. (B) 6-nitropiperonyl-L-Lysine, ‘photocaged lysine’ (PCK), is a lysine residue with a photocaging group on the side chain. The photocaging group is removed at 365 nm. (C) Genetic constructs for PC-Cre controlled expression of channelrhodopsin. See also Figure 3—figure supplement 1, . (D) Cre activation efficiency in animals with optimised vs. original constructs. Comparison of original PCKRS and tRNA(Pyl)CUA (‘PCKRS’), Smad4-NES::PCKRS and tRNA(C15) (‘NES-PCKRS’), original photocaged Cre recombinase (‘PC-Cre’), and optimised photocaged Cre (‘optPC-Cre’). Three experiments were performed using two independent lines for each condition. In each experiment, 30 animals were visually scored for ChR2::mKate2 expression for each condition. Significance determined by Welch’s t test. The error is the SEM (n = 6). (E) Schematic showing PC-Cre and optPC-Cre. Substitution mutations shown as blue bars. The TAG mutation denotes the site of PCK incorporation. PC-Cre contains both an N-terminal and internal nuclear localisation sequence (NLS). OptPC-Cre contains only a C-terminal NLS, the R119A mutation disables the internal NLS. (F) Imaging of worms expressing Smad4-NES::PCKRS, tRNA(C15), and optPC-Cre. Expression of ChR2::mKate2 is dependent on supplementation of PCK and uncaging by exposure to UV light. Scale bars 30 µm. (G) Percentage of animals reversing in response to a blue light pulse. ‘PCKRS’: original PCKRS and tRNA(Pyl)CUA; ‘NES-PCKRS’: Smad4-NES::PCKRS and tRNA(C15); ‘PC-Cre’: original photocaged Cre recombinase; ‘optPC-Cre’: optimised photocaged Cre. Assays were carried out using two independent lines and >10 animals for each genotype; the mean of three stimulations was determined. The graph shows the mean of two experiments. Significance obtained by Mann–Whitney U test. The error is the SEM (n = 4). *p<0.05, ***p<0.001, ****p<0.0001.
-
Figure 3—source data 1
Source data for Figure 3F,G.
- https://cdn.elifesciences.org/articles/67075/elife-67075-fig3-data1-v3.xlsx
Figure 3—figure supplement 1
Genetic constructs for expression of photoactivatable Cre and assays to determine Cre activation.
(A) Constructs used to generate glr-1p-driven photoactivatable Cre recombinase lines. (B) Photoactivation of Pglr-1-driven PC-Cre recombinase before optimisation, with an N-terminal nuclear localisation sequence (NLS) and intact internal NLS. Scale bars 30 µm. (C) Percentage of animals reversing in response to a blue light pulse for original PCKRS and Methanosarcina mazei tRNA(Pyl)CUA (‘PCKRS’), modified NES-PCKRS and tRNA(C15) (‘NES-PCKRS’), original photocaged Cre recombinase (‘PC-Cre’), and optimised photocaged Cre (‘optPC-Cre’). Either in the presence (‘+ ATR’) or absence (‘-ATR’) of all-trans-retinal. Significance obtained by unpaired t-test. The error is the SEM (n = 4).
Figure 4 with 1 supplement
LaserTAC using optimised photocaged Cre-recombinase facilitates cell-specific expression of optogenetic channels in C.elegans.
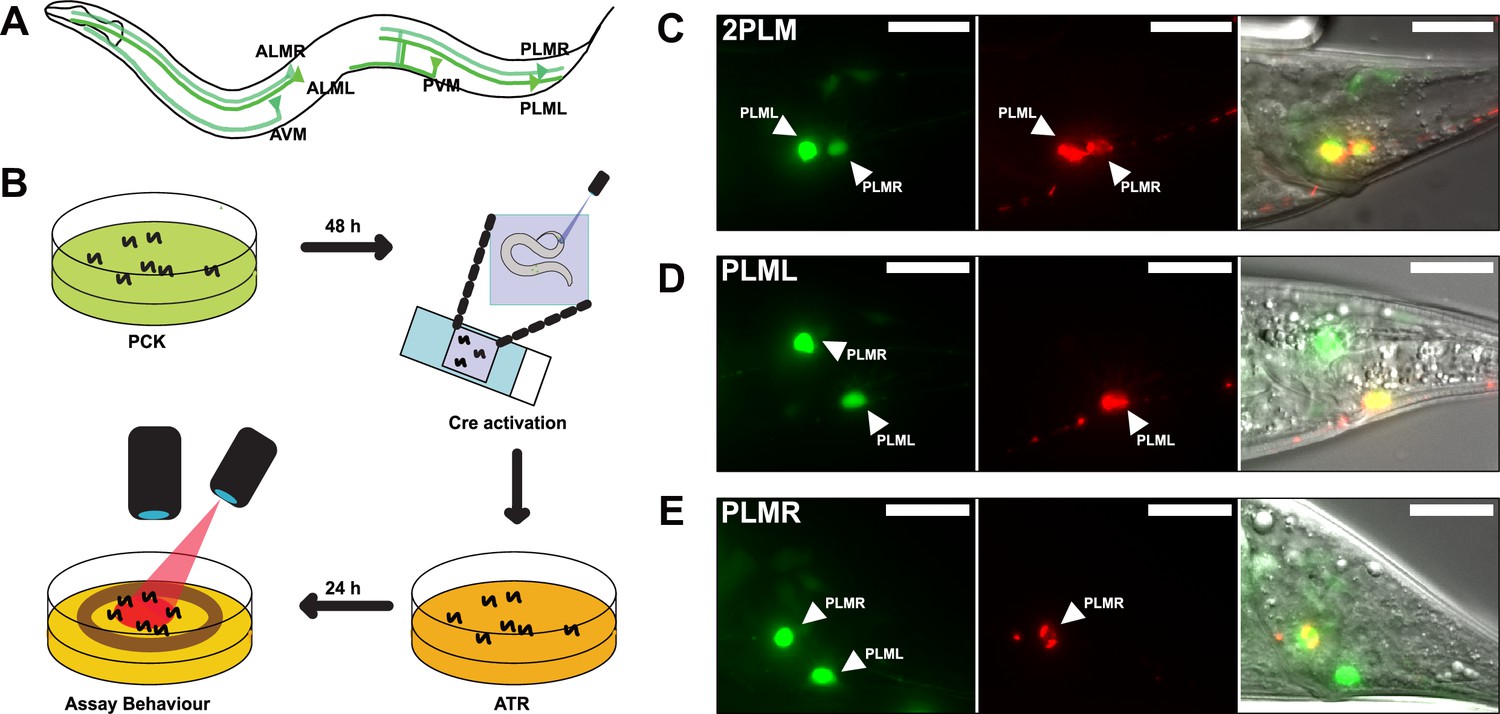
(A) Map of the six C. elegans touch receptor neurons showing the posterior location of the PLM neuron pair. (B) Diagram of experimental procedure for activating expression of target genes in single cells using LaserTAC, followed by optogenetic behavioural assay. (C–E) Fluorescent images showing targeted expression of Chrimson::mKate2 24 hr after laser induced activation of optPC-Cre (middle panels) in both PLM neurons (C), only in PLML (D), only in PLMR (E). Scale bars 20 µm. GFP signal in the left panels indicates cells expressing optPC-Cre.
Figure 4—figure supplement 1
Genetic constructs for expression of optPC-Cre in touch receptor neurons and soft touch assays to measure touch receptor neuron function.
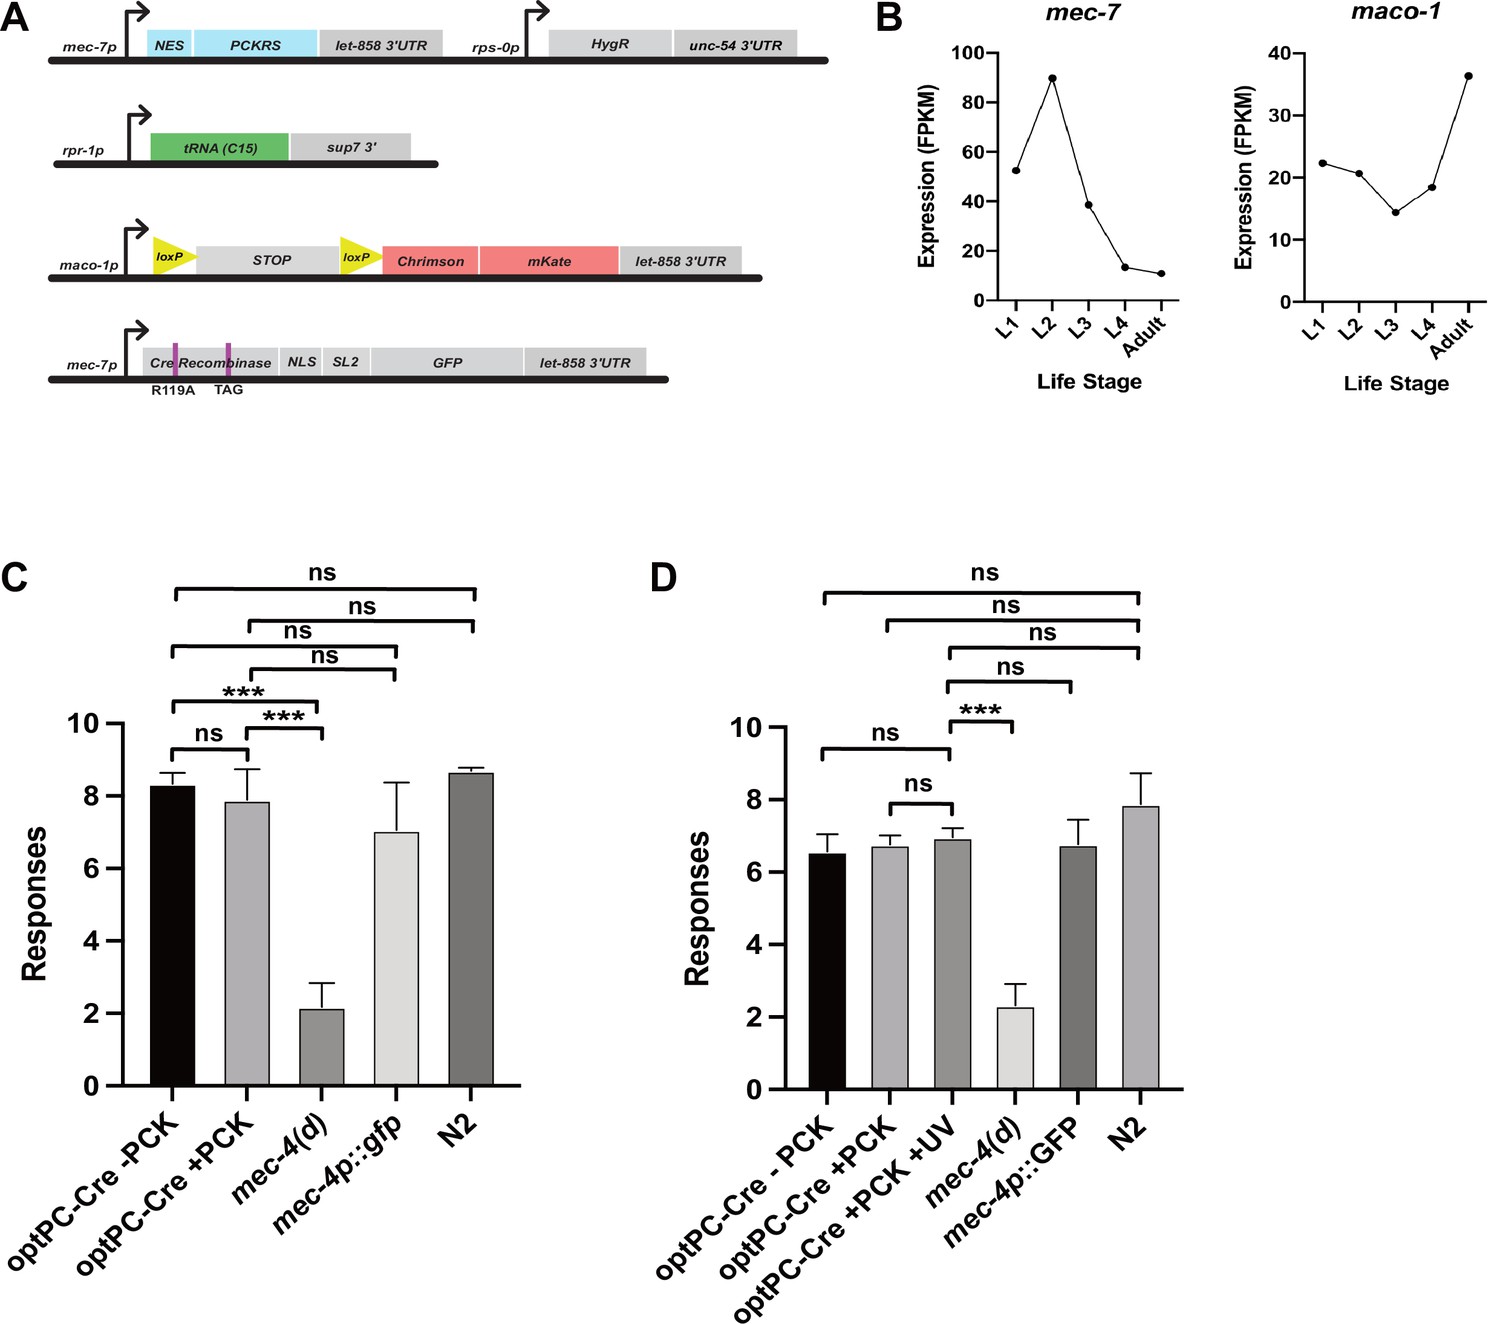
(A) Constructs used to generate the mec-7p-driven optPC-Cre recombinase lines for targeted expression of Chrimson::mKate2. (B) Aggregate expression estimates for mec-7 and maco-1 as displayed on wormbase.org. Estimates of expression calculated by averaging the FPKMs from published datasets (see wormbase.org). (C, D) Soft touch assays. Animals were subjected to alternating head/tail touches for a total of 10 touches. The mean of three experiments is depicted, and each experiment was performed with 10 animals. (C) ‘+ PCK’ indicates worms grown on photocaged lysine (PCK) for 48 hr. (D) ‘+ PCK’ indicates worms grown for 48 hr on PCK, ‘+ UV’ animals were illuminated with 365 nm light at 48 hr. All animals were assayed 24 hr after the illumination timepoint. Significance was determined by Mann–Whitney U test (n = 3). ***p<0.001.
-
Figure 4—figure supplement 1—source data 1
Source data for soft touch assays shown in Figure 4—figure supplement 1C,D.
- https://cdn.elifesciences.org/articles/67075/elife-67075-fig4-figsupp1-data1-v3.xlsx
Figure 5 with 3 supplements
PLM neurons show distinct responses to optogenetic stimulation.
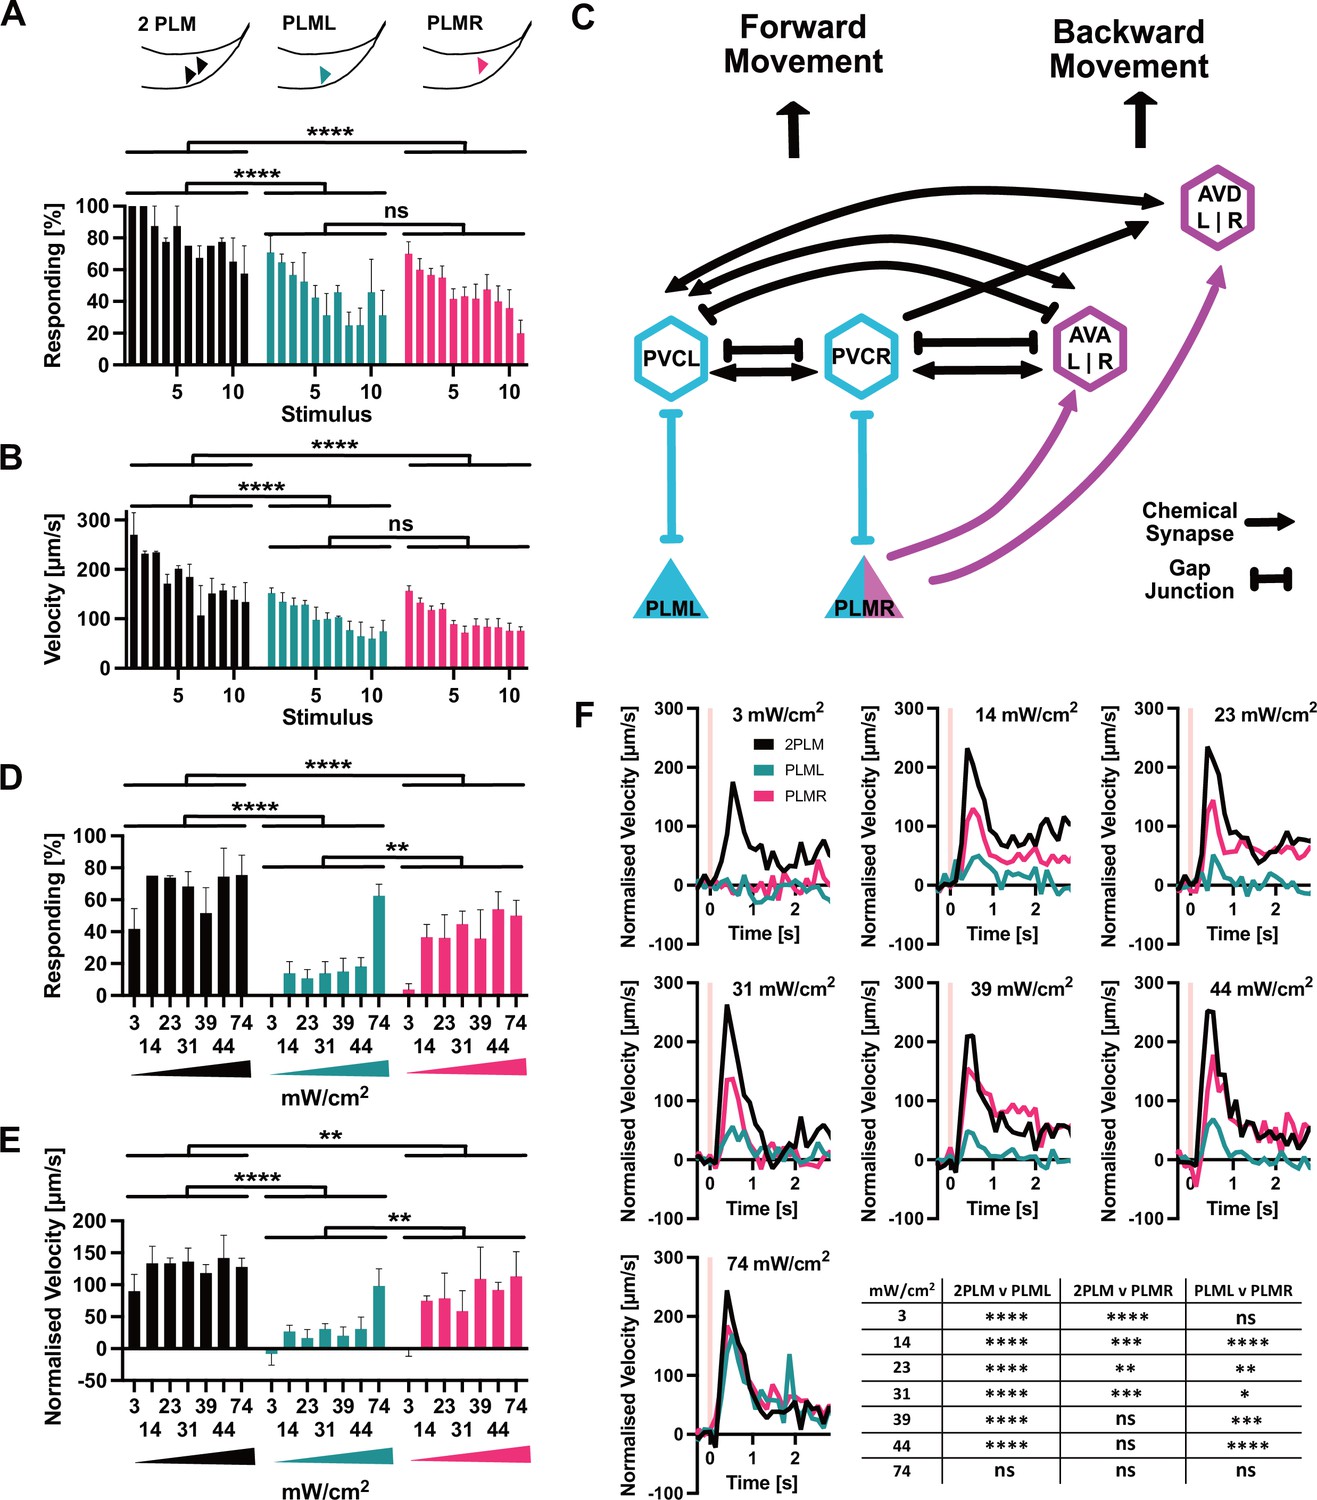
(A) Percentage of animals responding to repeated stimulations with light pulses of 1 s, 74 mW/cm2, 617 nm, delivered every 30 s. Worms expressed Chrimson in either both PLM neurons (‘2PLM’, black), only in PLML (blue-green), or only in PLMR (red). Responding worms are defined as those having mean forward speeds > 100 μm s–1 over the 2 s following stimulation. Assays were performed with cohorts of 4–6 worms stimulated simultaneously, one cohort constitutes a replicate. Replicates were assayed on different days. Significances derived from two-way ANOVA (2PLM n = 2; PLML and PLMR n = 4). (B) Mean velocity for the experiments analysed in (A). Mean velocity was determined for each cohort. Significances derived from two-way ANOVA (2PLM n = 2; PLML and PLMR n = 4). (C) Simplified schematic of the asymmetric neuronal connectivity of PLML and PLMR within the touch circuit. Symmetric PLM connections are shown in light blue, whereas asymmetric connections shown in magenta. (D) Percentages of animals which respond to stimulation (0.1 s, 617 nm) at the power levels indicated. Chrimson expressed in either both PLM neurons (‘2PLM’, black), only in PLML (blue-green) or only in PLMR (red). For each individual worm, the velocity was measured in the 1 s window from 0.4 s to 1.2 s after stimulation, which corresponds to the peak response. Velocities were then normalised by subtracting the average speed of the individual over the 0.5 s immediately prior to stimulation. Responding worms are defined as those having mean normalised forward speeds >100 μm/s in the window from 0.4 s to 1.2 s after stimulation. Cohorts of 4–8 animals were stimulated together, and the mean velocity of one cohort constitutes a replicate. Replicates were assayed on different days. Significances derived from two-way ANOVA, n = 3 for all conditions. (E) Mean normalised velocity for the experiments analysed in (D). The mean normalised velocity across all animals within a cohort was determined for the 1 s window 0.2–1.2 s after stimulation. Significances derived from two-way ANOVA. n = 3 for all conditions. (F) Normalised mean velocity traces of the experiments analysed for (D,E) across all three replicates for each condition at the power levels indicated. 2PLM (black), PLML (blue-green), and PLMR (red). Pink vertical lines indicate the light pulse. Statistical significances are provided in the table in (F). Significance was determined by two-way ANOVA using the mean of the three replicates for each of the seven speed measurements between 0.4 s and 1.2 s after stimulation, which corresponds to the peak response. *p<0.05, **p<0.01, ***p<0.001, ****p<0.0001. Traces before normalisation are shown in Figure 5—figure supplement 2.
-
Figure 5—source data 1
Velocities for all individuals and experiments depicted in Figure 5A,B and Figure 5—figure supplement 1.
- https://cdn.elifesciences.org/articles/67075/elife-67075-fig5-data1-v3.zip
-
Figure 5—source data 2
Velocities for all individuals in experiments depicted in Figure 5C–E and Figure 5—figure supplement 2.
The light pulse is delivered at the 10 s mark, which corresponds to the ‘0’ mark in the graphs in Figure 5C–E and Figure 5—figure supplement 2.
- https://cdn.elifesciences.org/articles/67075/elife-67075-fig5-data2-v3.zip
Figure 5—figure supplement 1
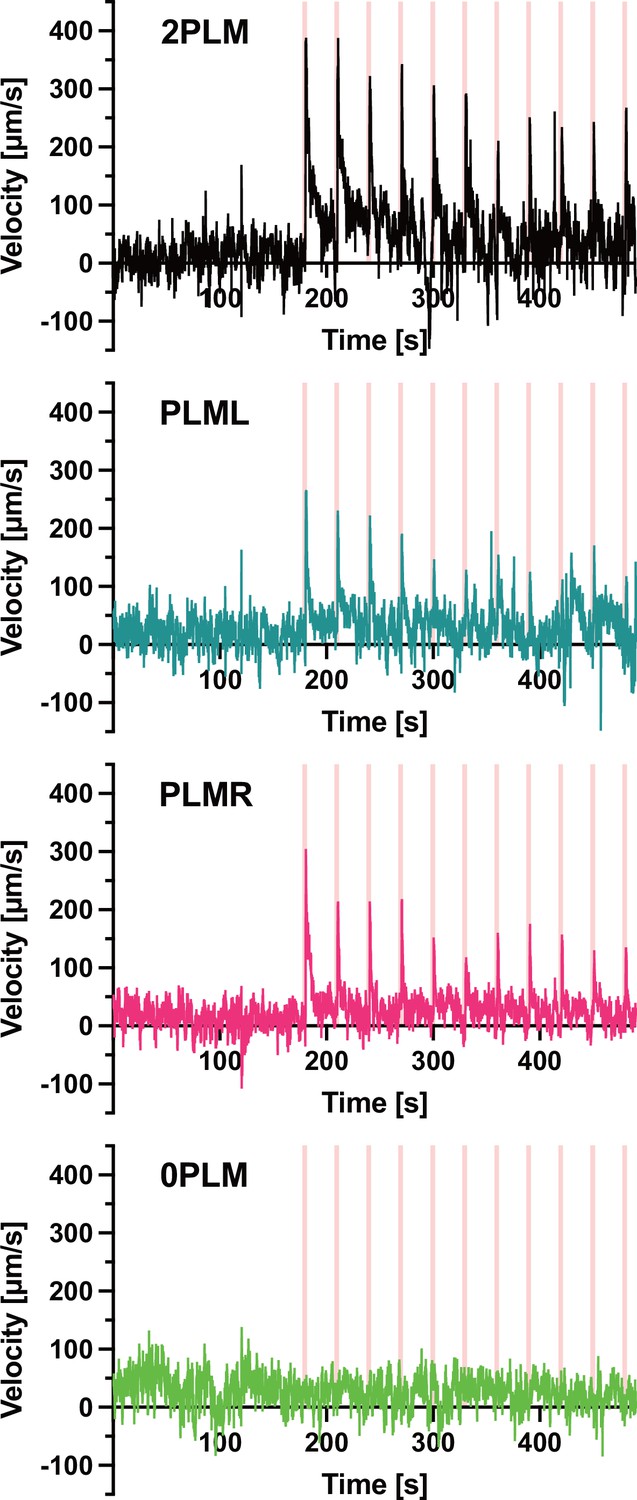
Speed traces used in Figure 5A,B.
Animals expressing Chrimson::mKate2 were stimulated with 1 s pulses of 617 nm light at 74 mW/cm2. The pulses were delivered at 30 s intervals (pink vertical lines). The assayed animals expressed Chrimson::mKate2 either in both PLM neurons (top panel), only in PLML (second panel), or only in PLMR (third panel). The bottom panel depicts mock-treated animals not expressing Chrimson::mKate2. The mock-treated animals were raised on PCK for 48 hr, then shifted to plates containing all-trans-retinal (ATR) for 24 hr before the assay was performed. The panels depict the mean velocity of two experiments (2PLM), four experiments (PLML, PLMR), and three experiments (0PLM). Each experiment was performed with between 4 and 8 animals.
Figure 5—figure supplement 2
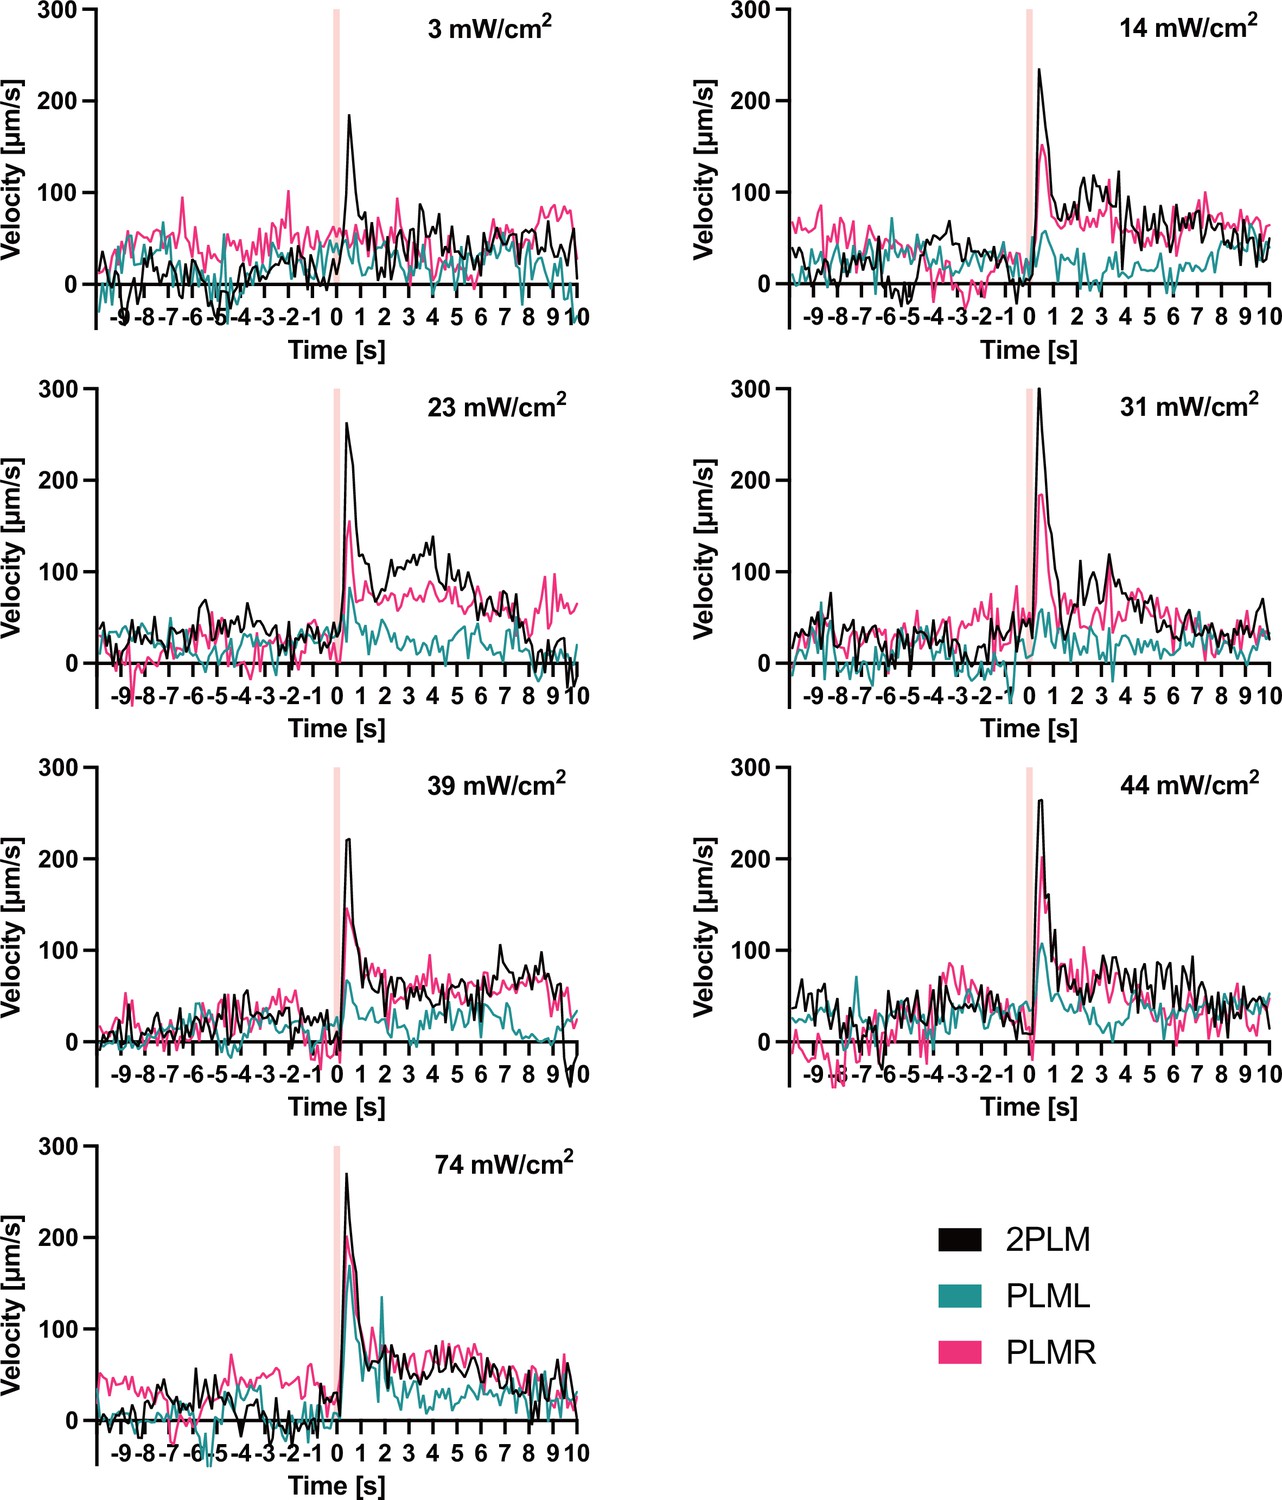
Traces before normalisation of experiments shown in Figure 5D–F.
Animals expressing Chrimson::mKate2 were stimulated with 0.1 s pulses of 617 nm light at the indicated intensities. Pink vertical lines indicate the timepoint when the pulses were delivered. The panels depict the mean velocity of three experiments performed for each condition. Each experiment was performed with between 4 and 8 animals.
Figure 5—figure supplement 3
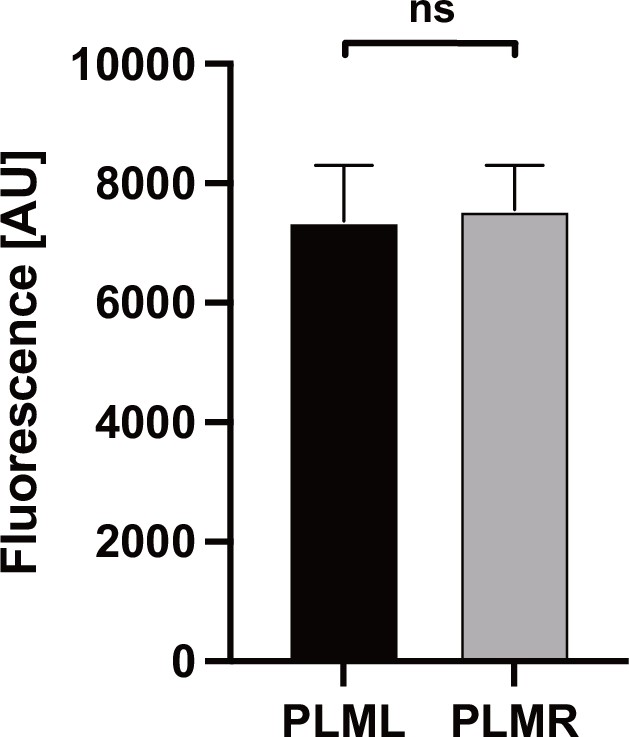
Expression levels of Chrimson::mKate2.
Expression levels were determined by measuring red mKate2 fluorescence in animals expressing Chrimson::mKate2 in either PLML (n = 7) or PLMR (n = 9). Significance was determined by Mann–Whitney U test.
-
Figure 5—figure supplement 3—source data 1
Fluorescence intensities measured in PLML and PLMR.
- https://cdn.elifesciences.org/articles/67075/elife-67075-fig5-figsupp3-data1-v3.xlsx
Videos
Video 1
Response to 470 nm light stimulation of animals expressing glr-1p::optPC-Cre, grown on photocaged lysine (PCK), uncaged, and then shifted to plates containing all-trans-retinal (ATR).
Quantifications of the response of this line and a further, independent, line are shown in Figure 3G and Figure 3—figure supplement 1C.
Video 2
Response to 470 nm light stimulation of animals expressing glr-1p::optPC-Cre, grown on photocaged lysine (PCK), uncaged, and then shifted to plates without all-trans-retinal (ATR).
Quantifications of the response of this line and a further, independent, line are shown in Figure 3G and Figure 3—figure supplement 1C.
Video 3
Response to 617 nm light stimulation of animals expressing Chrimson::mKate2 in both PLM neurons and grown in the presence of all-trans-retinal (ATR).
Video 4
Response to 617 nm light stimulation of mock treated animals, grown on photocaged lysine (PCK) and in the presence of all-trans-retinal (ATR), but without uncaging.
Video 5
Response to 617 nm light stimulation of animals expressing Chrimson::mKate2 only in PLML and grown in the presence of all-trans-retinal (ATR).
Video 6
Response to 617 nm light stimulation of animals expressing Chrimson::mKate2 only in PLMR and grown in the presence of all-trans-retinal (ATR).
Tables
Key resources table
| Reagent type (species) or resource | Designation | Source or reference | Identifiers | Additional information |
|---|---|---|---|---|
| Genetic reagent (Caenorhabditis elegans) | SGR30 | This paper | n/a | greEx17[sur-5p::FLAG::PCKRS::GFP]Figure 2D, Figure 2—figure supplement 1B |
| Genetic reagent (C. elegans) | SGR31 | This paper | n/a | greEx18[sur-5p::p120cts::PCKRS::GFP]Figure 2D, Figure 2—figure supplement 1B |
| Genetic reagent (C. elegans) | SGR32 | This paper | n/a | greEx19[sur-5p::PKI::PCKRS::GFP]Figure 2D, Figure 2—figure supplement 1B |
| Genetic reagent (C. elegans) | SGR33 | This paper | n/a | greEx20[sur-5p::smad-4::PCKRS::GFP]Figure 2D, Figure 2—figure supplement 1B |
| Genetic reagent (C. elegans) | SGR34 | This paper | n/a | greEx21[sur-5p::S-NES::PCKRS::GFP]Figure 2D, Figure 2—figure supplement 1B |
| Genetic reagent (C. elegans) | SGR35 | This paper | n/a | greEx22[sur-5p::PCKRS; rpr-1p::tRNA(Pyl); rps-0p::GFP(am)::mCherry::HA]; smg-2(e2008)Figure 2C, E, F and G, Figure 2—figure supplement 1A |
| Genetic reagent (C. elegans) | SGR36 | This paper | n/a | greEx23[sur-5p::p120cts::PCKRS; rpr-1p::tRNA(Pyl); rps-0p::GFP(am)::mCherry::HA];smg-2(e2008)Figure 2C, Figure 2—figure supplement 1A |
| Genetic reagent (C. elegans) | SGR37 | This paper | n/a | greEx24[sur-5p::PKI::PCKRS; rpr-1p::tRNA(Pyl); rps-0p::GFP(am)::mCherry::HA]; smg-2(e2008)Figure 2C, Figure 2—figure supplement 1A |
| Genetic reagent (C. elegans) | SGR38 | This paper | n/a | greEx25[sur-5p::smad-4::PCKRS; rpr-1p::tRNA(Pyl); rps-0p::GFP(am)::mCherry::HA]; smg-2(e2008)Figure 2C, Figure 2—figure supplement 1A |
| Genetic reagent (C. elegans) | SGR39 | This paper | n/a | greEx26[sur-5p::SNES::PCKRS; rpr-1p::tRNA(Pyl); rps-0p::GFP(am)::mCherry::HA]; smg-2(e2008)Figure 2C, Figure 2—figure supplement 1A |
| Genetic reagent (C. elegans) | SGR40 | This paper | n/a | greEx27[sur-5p::PCKRS; rpr-1p::tRNA(Pyl); rps-0p::GFP(am)::mCherry::HA]; smg-2(e2008)Figure 2F,G |
| Genetic reagent (C. elegans) | SGR45 | This paper | n/a | greEx32[sur-5p::PKI::PCKRS; rpr-1p::tRNA(C15); rps-0p::GFP(am)::mCherry::HA]; smg-2(e2008)Figure 2C, E, F and G, Figure 2—figure supplement 1A,CA |
| Genetic reagent (C. elegans) | SGR46 | This paper | n/a | greEx33[sur-5p::smad-4::PCKRS; rpr-1p::tRNA(C15); rps-0p::GFP(am)::mCherry::HA]; smg-2(e2008)Figure 2C, E, F and G, Figure 2—figure supplement 1A,CA |
| Genetic reagent (C. elegans) | SGR47 | This paper | n/a | greEx34[sur-5p:: PKI::PCKRS; rpr-1p::tRNA(C15); rps-0p::GFP(am)::mCherry::HA];smg-2(e2008)Figure 2F,G |
| Genetic reagent (C. elegans) | SGR48 | This paper | n/a | greEx35[sur-5p::smad-4::PCKRS; rpr-1p::tRNA(C15); rps-0p::GFP(am)::mCherry::HA];smg-2(e2008)Figure 2F,G |
| Genetic reagent (C. elegans) | SGR49 | This paper | n/a | greEx36[glr-1p::PCKRS rpr-1p::tRNA(Pyl); glr-1p::PC-Cre; glr-1p::B-gal terminator+ loxP::ChR2::mKate2]Figure 3D,G, Figure 3—figure supplement 1C |
| Genetic reagent (C. elegans) | SGR50 | This paper | n/a | greEx37[glr-1p::PCKRS; rpr-1p::tRNA(Pyl); glr-1p::PC-Cre; glr-1p::B-gal terminator+ loxP::ChR2::mKate2]Figure 3D,G, Figure 3—figure supplement 1C |
| Genetic reagent (C. elegans) | SGR51 | This paper | n/a | greEx38[glr-1p::smad-4::PCKRS; rpr-1p::tRNA(C15); glr-1p::PC-Cre; glr-1p::B-gal terminator+ loxP::ChR2::mKate2]Figure 3D,G, Figure 3—figure supplement 1B,C |
| Genetic reagent (C. elegans) | SGR52 | This paper | n/a | greEx39[glr-1p::smad-4::PCKRS; rpr-1p::tRNA(C15); glr-1p::PC-Cre; glr-1p::B-gal terminator+ loxP::ChR2::mKate2]Figure 3D,G, Figure 3—figure supplement 1C |
| Genetic reagent (C. elegans) | SGR53 | This paper | n/a | greEx40[glr-1p::smad-4::PCKRS; rpr-1p::tRNA(C15); glr-1p::optPC-Cre; glr-1p::B-gal terminator+ loxP::ChR2::mKate2]Figure 3D, F and G, Figure 3—figure supplement 1C, Video 1, Video 2 |
| Genetic reagent (C. elegans) | SGR54 | This paper | n/a | greEx41[glr-1p::smad-4::PCKRS; rpr-1p::tRNA(C15); glr-1p::optPC-Cre; glr-1p::B-gal terminator+ loxP::ChR2::mKate2]Figure 3D,G, Figure 3—figure supplement 1C |
| Genetic reagent (C. elegans) | SGR55 | This paper | n/a | greEx42[mec-7p::smad-4::PCKRS; rpr-1p::tRNA(C15); mec-7p::optPC-Cre; Pmaco-1::B-gal terminator+ loxP::ChR2::mKate2] |
| Genetic reagent (C. elegans) | SGR56 | This paper | n/a | greIs1[mec-7p::smad-4::PCKRS; rpr-1p::tRNA(C15); mec-7p::optPC-Cre; Pmaco-1::terminator+ loxP::ChR2::mKate2]Figure 4C–E generated by gamma integration from SGR55, backcrossed 2× |
| Genetic reagent (C. elegans) | SGR96 | This paper | n/a | greIs1[mec-7p::smad-4::PCKRS; rpr-1p::tRNA(C15); mec-7p::optPC-Cre; Pmaco-1::terminator+ loxP::ChR2::mKate2]Figure 4—figure supplement 1C,D, Figure 5, Figure 5—figure supplements 1–3 SGR56 backcrossed 2x |
| Genetic reagent (C. elegans) | SGR98 | This paper | n/a | greEx18[sur-5p::p120cts::PCKRS::GFP]Figure 2—figure supplement 1B |
| Genetic reagent (C. elegans) | SGR99 | This paper | n/a | greEx19[sur-5p::PKI::PCKRS::GFP]Figure 2—figure supplement 1B |
| Genetic reagent (C. elegans) | SGR100 | This paper | n/a | greEx20[sur-5p::smad-4::PCKRS::GFP]Figure 2—figure supplement 1B |
| Genetic reagent (C. elegans) | SGR101 | This paper | n/a | greEx21[sur-5p::S-NES::PCKRS::GFP]Figure 2—figure supplement 1B |
| Strain, strain background (C. elegans) | N2 | CGC | WBStrain00000001 | Wild type Figure 4—figure supplement 1C |
| Genetic reagent (C. elegans) | CZ10175 | CGC | WBStrain00005421 | zdIs5[mec-4p::GFP+ lin-15(+)]Figure 4—figure supplement 1C ("mec-4p::gfp") |
| Genetic reagent (C. elegans) | Chalfie and Au 1989(10.1126/science.2646709) | WBVar00266589 | mec-4(u231)Figure 4—figure supplement 1C ("mec-4(d)") | |
| Antibody | Mouse anti-GFP, monoclonal (clones 7.1 and 13.1) | Roche | Cat# 11814460001RRID:AB_390913 | Figure 2C, F and G, Figure 2—figure supplement 1A(1:4000) |
| Antibody | Rat anti-HA, monoclonal (clone 3F10) | Roche | Cat# 11867423001RRID:AB_390918 | Figure 2C,G (1:2000) |
| Antibody | Horse anti-mouse IgG HRP | Cell Signaling Technology | Cat# 7076SRRID:AB_330924 | Figure 2C, F and G, Figure 2—figure supplement 1A(1:5000) |
| Antibody | Goat anti-Rat IgG (H + L) HRP | Thermo Fisher Scientific | Cat# 31470RRID:AB_228356 | Figure 2C,G (1:5000) |
| Chemical compound | Photocaged lysine (6-nitropiperonyl-L-Lysine) | ChiroBlock GmbH;Gautier et al., 2010 | CAS number:1221189-11-2 | Custom synthesised by ChiroBlock GmbH, Germany.Synthesis described in Gautier et al. (10.1021/ja910688s) |
Additional files
-
Supplementary file 1
Expression constructs and source plasmids used in this study.
- https://cdn.elifesciences.org/articles/67075/elife-67075-supp1-v3.docx
-
Transparent reporting form
- https://cdn.elifesciences.org/articles/67075/elife-67075-transrepform1-v3.docx
Download links
A two-part list of links to download the article, or parts of the article, in various formats.
Downloads (link to download the article as PDF)
Open citations (links to open the citations from this article in various online reference manager services)
Cite this article (links to download the citations from this article in formats compatible with various reference manager tools)
Precise optical control of gene expression in C elegans using improved genetic code expansion and Cre recombinase
eLife 10:e67075.
https://doi.org/10.7554/eLife.67075


