T-cell receptor (TCR) signaling promotes the assembly of RanBP2/RanGAP1-SUMO1/Ubc9 nuclear pore subcomplex via PKC-θ-mediated phosphorylation of RanGAP1
- MOE Key Laboratory of Gene Function and Regulation, Guangdong Province Key Laboratory of Pharmaceutical Functional Genes, State Key Laboratory of Biocontrol, School of Life Sciences, Sun Yat-sen University, China
- Center for Cancer Immunotherapy, La Jolla Institute for Immunology, United States
Figures
Figure 1 with 1 supplement
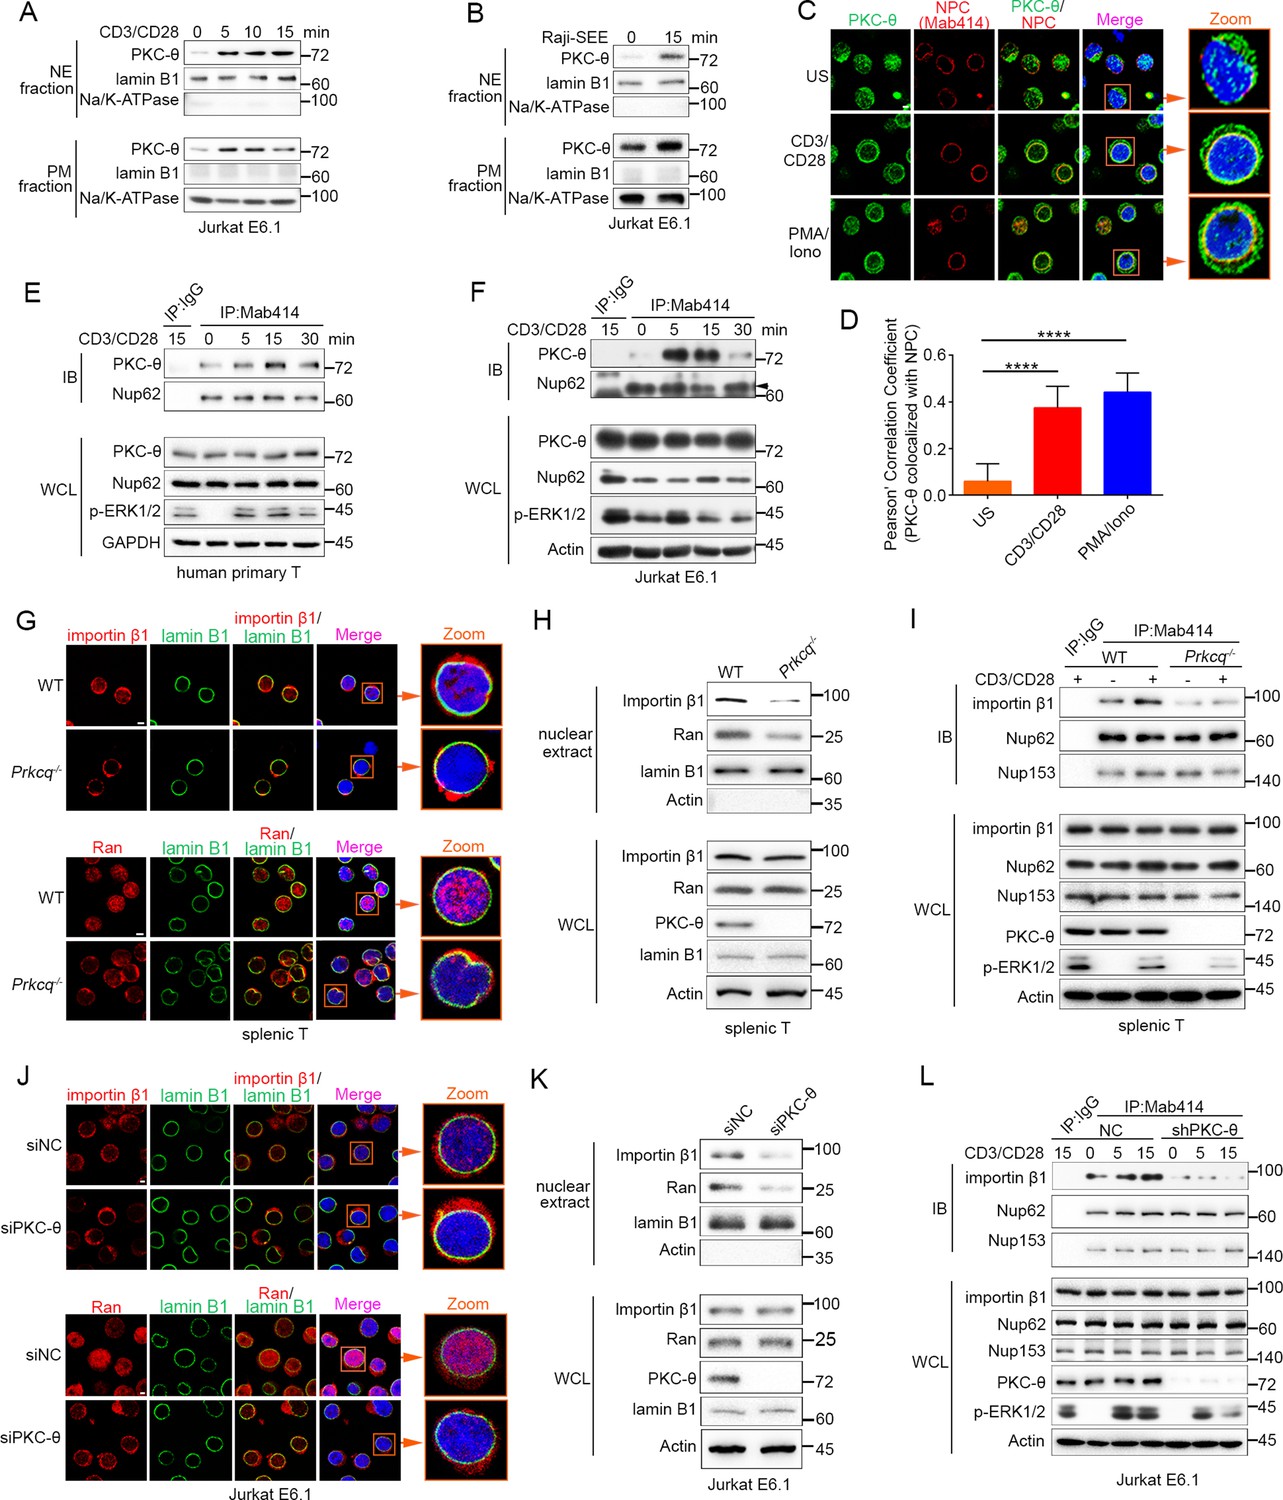
TCR stimulation promotes PKC-θ colocalization with the NPC and PKC-θ deficiency decreases nuclear import of importin-β1 and Ran and NPC association with importin-β1.
(A, B) Subcellular fractionation of Jurkat E6.1 cells stimulated for 0–15 min with anti-CD3 plus anti-CD28 (A) or with superantigen (SEE)-pulsed Raji B cells (B) and immunodetection with the indicated antibodies. NE, nuclear envelope; PM, plasma membrane. (C) Confocal imaging of PKC-θ (green) and NPCs (Mab414, red) colocalization in representative Jurkat E6.1 cells left unstimulated (US) or stimulated for 15 min with anti-CD3 plus anti-CD28 or with PMA plus Iono. Nuclei are stained with DAPI (blue). Areas outlined by squares in the merged images are enlarged at right. Scale bars, 2 μm. (D) Quantification of PKC-θ colocalization with NPCs by Pearson correlation coefficient. Analysis was based on at least three different images covering dozens of cells using the ImageJ software. ****p<0.0001 (one-way ANOVA with post hoc test). (E, F) Immunoblot analysis of NPC IPs (Mab414) or whole-cell lysates (WCL) from human primary T cells (E) or Jurkat E6.1 cells (F) stimulated for 0–30 min with anti-CD3 plus anti-CD28. Control IP with normal IgG is shown in the left lane. Nup62, an NPC component, was used a as loading control for the IPs. The arrowhead indicates the Nup62 protein band. (G) Confocal imaging of importin-β1 and Ran in representative wild-type (WT) or Prkcq−/− mouse primary splenic T cells stained with the indicated antibodies. Areas outlined by squares in the merged images are enlarged at right. Scale bars, 2 μm. (H) Subcellular fractionation of mouse splenic T cells and immunodetection with the indicated antibodies. (I) Immunoblot analysis of NPC IPs (Mab414) or whole-cell lysates (WCL) from unstimulated or anti-CD3 plus anti-CD28-stimulated WT or Prkcq−/− mouse splenic T cells. Control IP with normal IgG is shown in the left lane. (J, K) Confocal imaging of importin-β1 and Ran (J) and subcellular fractionation (K), analyzed as in (G, H), of Jurkat E6.1 cells transfected with scrambled siRNA-negative control (siNC) or PKC-θ targeting siRNA (siPKC-θ). Scale bars, 2 μm. (L) Immunoblot analysis of NPC IPs (Mab414) or WCL from unstimulated or stimulated Jurkat E6.1 T cells stably expressing a control small hairpin RNA (shRNA) or a PKC-θ targeting shRNA (shPKC-θ), analyzed as in (I). Data are representative of three (A, B, E, F, H, I, K, L) or two (C, D, G, J) biological replicates.
-
Figure 1—source data 1
Uncropped western blot for Figure 1.
- https://cdn.elifesciences.org/articles/67123/elife-67123-fig1-data1-v3.pdf
-
Figure 1—source data 2
Row data for Figure 1 and for Figure 1—figure supplement 1.
- https://cdn.elifesciences.org/articles/67123/elife-67123-fig1-data2-v3.xlsx
Figure 1—figure supplement 1
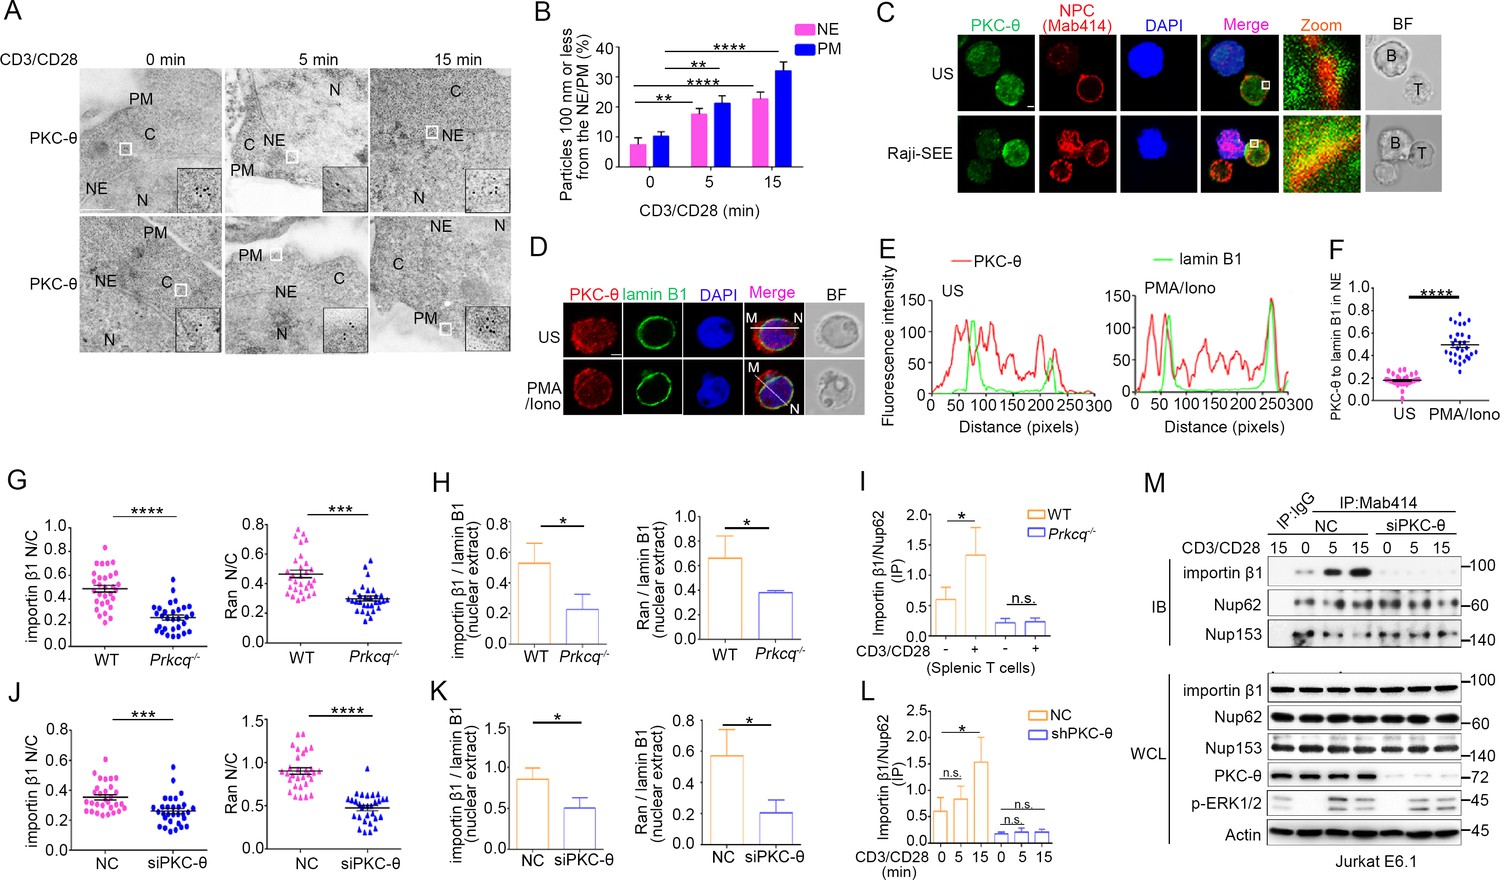
PKC-θ translocates to the NE following TCR stimulation and PKC-θ deficiency decreases nuclear import of importin β1 and Ran and NPC association with importin β1.
(A) Transmission electron microscopy (TEM) images of PKC-θ labeled by antibody-conjugated gold particles in Jurkat E6.1 cells stimulated for 0–15 min with anti-CD3 plus anti-CD28. The areas outlined by small white squares in middle are enlarged at bottom right corner (black squares). C, cytoplasm; N, nucleus; NE, nuclear envelope; PM, plasma membrane. Scale bars, 500 nm. (B) Quantitation of the percentage of gold particles localized ≤100 nm from the NE or from the PM in cells from (A). **p<0.01, ****p<0.0001 (one-way ANOVA with post hoc test). (C) Confocal imaging of PKC-θ and NPCs colocalization in Jurkat E6.1 cells unstimulated (US) or stimulated for 15 min with superantigen (SEE)-pulsed Raji B cells that have been labeled with Cell Tracker Blue (blue). Areas outlined by squares in the merged images are enlarged at right. Scale bars, 2 μm. (D, E) Confocal imaging showing colocalization of endogenous PKC-θ (red) with lamin B1 (green) in representative Jurkat E6.1 cells left unstimulated or stimulated for 15 min with PMA plus Iono (D). Nuclei are stained with DAPI (blue). Lamin B1 marks the NE. Scale bars, 2 μm. Pixel intensity along a line from M to N in the merged images is shown in (E). (F) Quantification of ~30 cells with NE-localized PKC-θ from two biological replicates in (D). Each symbol represents an individual T cell. Horizontal lines indicate the mean ± s.e.m. ****p<0.0001 (two-tailed unpaired Student’s t-test). (G) Quantification of the N/C ratio of importin β1 (left) and Ran (right) based on analysis of ~30 cells in about six random fields from two biological replicates of Figure 1G. Horizontal lines indicate the mean ± s.e.m. ***p<0.001, ****p<0.0001 (two-tailed unpaired Student’s t-test). (H) Statistical analysis of importin β1 and Ran in nuclear extract from the experiment of Figure 1H. Analysis was based on three biological replicates. *p<0.05 (two-tailed unpaired Student’s t-test). (I) Statistical analysis of importin β1 binding to NPCs in Mab414 antibody IPs from the experiment of Figure 1I. Analysis was based on three biological replicates. n.s., not significant, *p<0.05 (one-way ANOVA with post hoc test). (J) Quantification of the N/C ratios of importin β1 (left) and Ran (right) based on analysis of ~30 cells in about six random fields from two biological replicates of Figure 1J. Horizontal lines indicate the mean ± s.e.m. ***p<0.001, ****p<0.0001 (two-tailed unpaired Student’s t-test). (K) Statistical analysis of importin β1 and Ran in nuclear extract from the experiment of Figure 1K. Analysis as based on three biological replicates. *p<0.05 (two-tailed unpaired Student’s t-test). (L) Statistical analysis of importin β1 binding to NPCs (immunoprecipitated with Mab414 antibody) in the experiment shown in Figure 1L. Analysis was based on three biological replicates. n.s., not significant, *p<0.05 (one-way ANOVA with post hoc test). (M) Immunoblot analysis of NPC IPs (Mab414) or WCL from unstimulated or stimulated Jurkat E6.1 T cells transfected with scrambled siRNA-negative control (siNC) or PKC-θ targeting siRNA (siPKC-θ). Data are representative of two (A–F) or three (G–M) biological replicates.
-
Figure 1—figure supplement 1—source data 1
Uncropped western blot for Figure 1—figure supplement 1.
- https://cdn.elifesciences.org/articles/67123/elife-67123-fig1-figsupp1-data1-v3.pdf
Figure 2 with 1 supplement
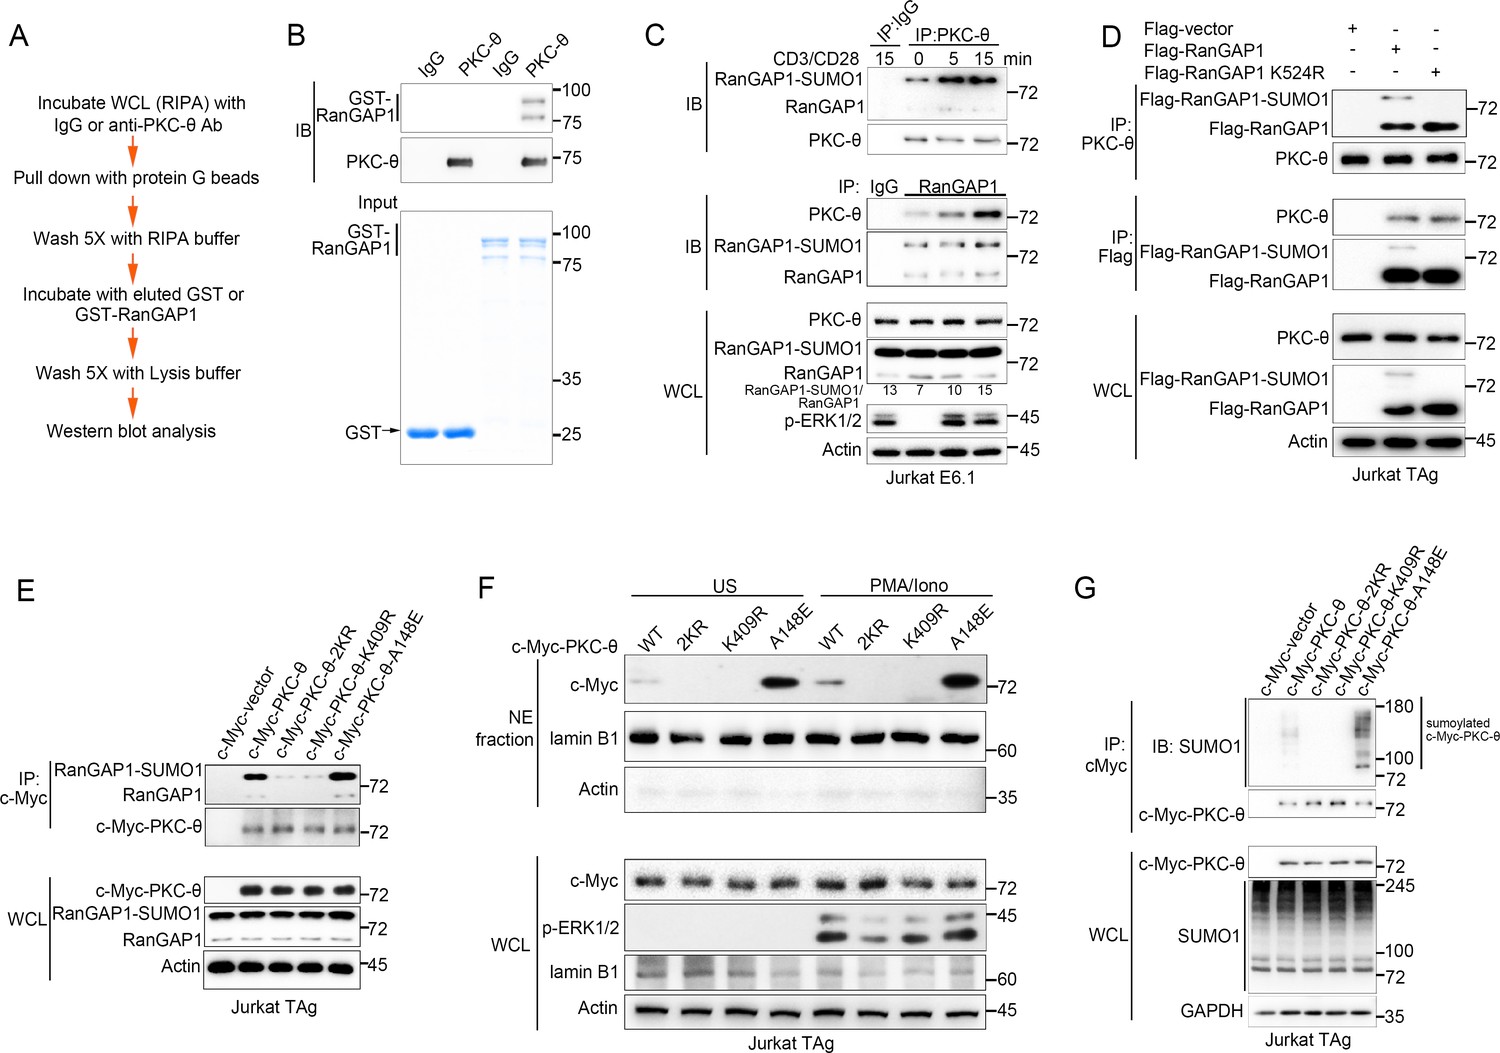
PKC-θ association with both RanGAP1 and RanGAP1-SUMO1 requires PKC-θ sumoylation.
(A) Scheme for in vitro protein direct binding assay. (B) Analysis of direct association between RanGAP1 and PKC-θ using approach in (A). GST-fusion proteins were detected by Coomassie blue staining (bottom). (C) Immunoblot analysis of PKC-θ or RanGAP1 IPs or WCL from Jurkat E6.1 cells stimulated for 0–15 min with anti-CD3 plus anti-CD28. (D) Reciprocal IP analysis of the association between endogenous PKC-θ and transfected Flag-tagged wild-type or mutated RanGAP1 in Jurkat-TAg cells. (E) Immunoblot analysis of c-Myc-tagged PKC-θ IPs or WCL from Jurkat-TAg cells that were transiently transfected with wild-type PKC-θ or the indicated PKC-θ mutants. (F) Subcellular fractionation of Jurkat-TAg cells transiently transfected with wild-type PKC-θ or the indicated PKC-θ mutants (2KR, K325R/K506R desumoylation mutant; K409R, kinase dead; A148E, constitutive active), followed by immunodetection with the indicated antibodies. (G) Immunoblot analysis of c-Myc-tagged PKC-θ IPs or WCL from Jurkat-TAg cells that were transiently transfected with the indicated expression vectors. Data are representative of at least three biological replicates (B–G).
-
Figure 2—source data 1
Uncropped western blot for Figure 2.
- https://cdn.elifesciences.org/articles/67123/elife-67123-fig2-data1-v3.pdf
Figure 2—figure supplement 1
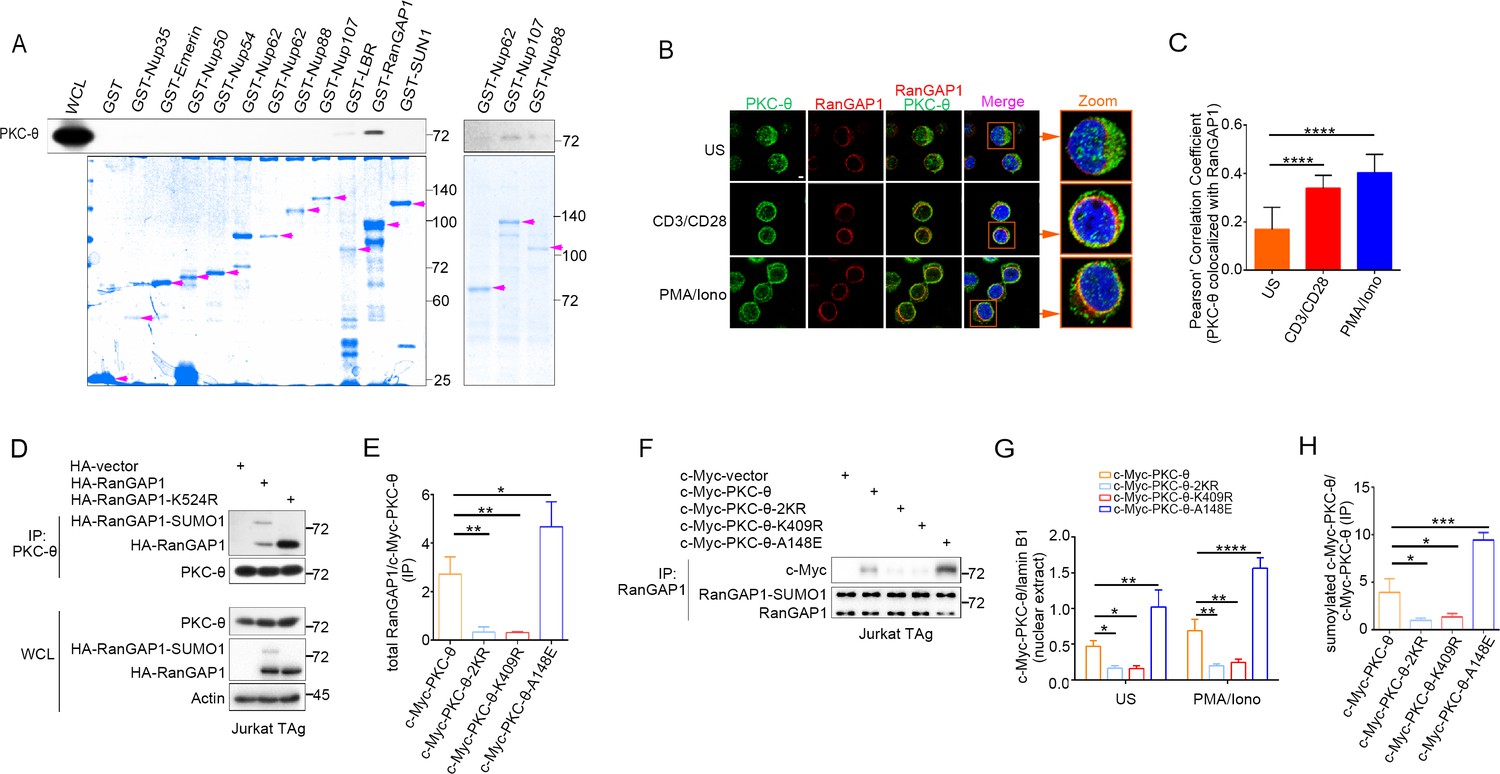
PKC-θ binds to and colocalizes with RanGAP1 in NE.
(A) Association of PKC-θ with the indicated GST-fusion proteins representing different NPC components demonstrated by a pull-down assay from unstimulated Jurkat E6.1 cell. The recombinant proteins were revealed by Coomassie blue staining. Purple arrows indicate the bands corresponding to GST, GST-fusion proteins. (B) Confocal imaging of intracellular of PKC-θ (green) and RanGAP1(red) colocalization in Jurkat E6.1 cells left unstimulated or stimulated for 15 min with anti-CD3 plus anti-CD28 or with PMA plus Iono. Cell nuclei are stained with DAPI. Areas outlined by squares in the merged images are enlarged at right. Scale bar, 2 μm. (C) Quantitative analysis of colocalization of PKC-θ with RanGAP1 shown in (B). Statistical analysis was based on at least three different colocalization images covering dozens of cells using the ImageJ software. ****p<0.0001 (one-way ANOVA with post hoc test). (D) Immunoblot analysis of endogenous PKC-θ IPs from Jurkat-TAg cells, detected by HA antibody. (E) Statistical analysis of RanGAP1 binding to PKC-θ in c-Myc antibody IPs from the experiment of Figure 2E. Analysis was based on three biological replicates. *p<0.05, **p<0.01 (one-way ANOVA with post hoc test). Total RanGAP1 included RanGAP1 and RanGAP1-SUMO1. (F) Immunoblot analysis of endogenous RanGAP1 IPs from Jurkat-TAg cells transfected with the indicated c-Myc-tagged PKC-θ expression vectors. Data are representative of three independent experiments. (G) Statistical analysis of c-Myc-PKC-θ in nuclear extract from the experiment of Figure 2F. Analysis was based on three biological replicates. *p<0.05, **p<0.01, ****p<0.0001 (one-way ANOVA with post hoc test). (H) Statistical analysis of c-Myc-PKC-θ sumoylation from the experiment of Figure 2G. Analysis was based on three biological replicates. *p<0.05, ***p<0.001 (one-way ANOVA with post hoc test). Data are representative of three biological replicates.
-
Figure 2—figure supplement 1—source data 1
Uncropped western blot for Figure 2—figure supplement 1.
- https://cdn.elifesciences.org/articles/67123/elife-67123-fig2-figsupp1-data1-v3.pdf
-
Figure 2—figure supplement 1—source data 2
Row data for Figure 2—figure supplement 1.
- https://cdn.elifesciences.org/articles/67123/elife-67123-fig2-figsupp1-data2-v3.xlsx
Figure 3 with 1 supplement

PKC-θ deficiency inhibits RanGAP1 sumoylation and its incorporation into the NPC and TCR-induced nuclear import of c-Jun in mature T cells.
(A, B) Confocal imaging of RanGAP1 (red) and lamin B1 (green) localization in representative unstimulated WT or Prkcq−/− mouse primary T cells (A), or in representative unstimulated Jurkat E6.1 cells transfected with siNC or siPKC-θ (B). Nuclei are stained with DAPI (blue). Areas outlined by squares in the merged images from (A) or (B) are enlarged at right in (A) or (B). Scale bars, 2 μm. Quantification of the ratio of NE/total RanGAP1 based on analysis of ~30 cells in about six random fields from two biological replicates as presented in (A) or (B) is shown at far right in (A) or (B), with each symbol representing an individual cell. Horizontal lines indicate the mean ± s.e.m. ****p<0.0001 (two-tailed, unpaired Student’s t-test). (C) Immunoblot analysis of RanGAP1-SUMO1 and RanGAP1 in human primary T cells unstimulated or stimulated for 15 min with anti-CD3 plus anti-CD28 or PMA plus Iono. (D–F) Immunoblot analysis of Mab414 IPs or WCL from WT and Prkcq−/− mouse primary splenic T cells (D) and thymocytes (F) stimulated with or without anti-CD3 plus anti-CD28 for 15 min, or from Jurkat E6.1 cells transfected with siNC or siPKC-θ stimulated for 0–15 min with anti-CD3 plus anti-CD28. (E) Statistical analysis of the amount ratio of RanGAP1-SUMO1 to Nup62 or to RanGAP1 in IPs or in WCL from the experiment in (D), (E), or (F) is shown at right in each figure. Analysis was based on three biological replicates for each experiment. n.s., not significant, *p<0.05, **p<0.01 (one-way ANOVA with post hoc test). (G, I) Confocal imaging of c-Jun (red) localization in representative WT or Prkcq−/− mouse splenic T cells (G) or thymocytes (I) unstimulated (US) or stimulated with anti-CD3 plus anti-CD28, costained with anti-lamin B1 (green) and DAPI (blue). Areas outlined by squares in the merged images from (G) or (I) are enlarged at right in (G) or (I). Scale bars, 2 μm. Quantitative analysis of the N/C ratio of c-Jun analyzed in ~30 cells in about six random fields from two biological replicates as presented in in (G) or (I) is shown at far right in (G) or (I). Each symbol represents an individual cell. Horizontal lines indicate the mean ± s.e.m. n.s., not significant; ****p<0.0001 (one-way ANOVA with post hoc test). (H, J) Subcellular fractionation of WT or Prkcq-/- mouse splenic T cells (H) or thymocytes (J) stimulated for 0–15 min with anti-CD3 plus anti-CD28, followed by immunodetection with the indicated antibodies. Data are representative of two (A, B, G, I) or three (C–F, H, J) biological replicates.
-
Figure 3—source data 1
Uncropped western blot for Figure 3.
- https://cdn.elifesciences.org/articles/67123/elife-67123-fig3-data1-v3.pdf
-
Figure 3—source data 2
Row data for Figure 3 and for Figure 3—figure supplement 1.
- https://cdn.elifesciences.org/articles/67123/elife-67123-fig3-data2-v3.xlsx
Figure 3—figure supplement 1

PKC-θ deficiency inhibits RanGAP1 sumoylation and its incorporation into the NPC, but does not affect TCR-induced phosphorylation of c-Jun.
(A) Immunoblot analysis of the association between RanGAP1-SUMO1 and NPC in Mab414 IPs, and of the indicated proteins expression in WCL from NC and shPKC-θ Jurkat T cells stimulated for 0–15 min with anti-CD3 plus anti-CD28. (B) Statistical analysis of the amount ratio of RanGAP1-SUMO1 to Nup62 or to RanGAP1 in IPs or in WCL under unstimulated condition from the experiment in Figure 3D–F. Analysis was based on three biological replicates. n.s., not significant, *p<0.05, **p<0.01 (two-tailed unpaired Student’s t-test). (C, D) Immunoblot analysis of phospho-c-Jun in lysates of WT or Prkcq−/− mouse peripheral T cells (C) or thymocytes (D) that were left unstimulated (US) or stimulated with anti-CD3 plus anti-CD28 for 15 min. (E,F) Statistical analysis of c-Jun nuclear import from the experiment of Figure 3H, J. Analysis was based on three biological replicates. n.s., not significant, **p<0.01, ***p<0.001 (two-tailed unpaired Student’s t-test). Immunoblot analysis of NPC IPs (Mab414) or whole-cell lysates (WCL) (G) and subcellular fractionation (H) of NC or shPKC-θ Jurkat E6.1Jurkat E6.1 T cells stimulated for 0–12 hr with anti-CD3 plus anti-CD28 and immunodetection with the indicated antibodies. Data are representative of three biological replicates.
-
Figure 3—figure supplement 1—source data 1
Uncropped western blot for Figure 3—figure supplement 1.
- https://cdn.elifesciences.org/articles/67123/elife-67123-fig3-figsupp1-data1-v3.pdf
Figure 4 with 1 supplement
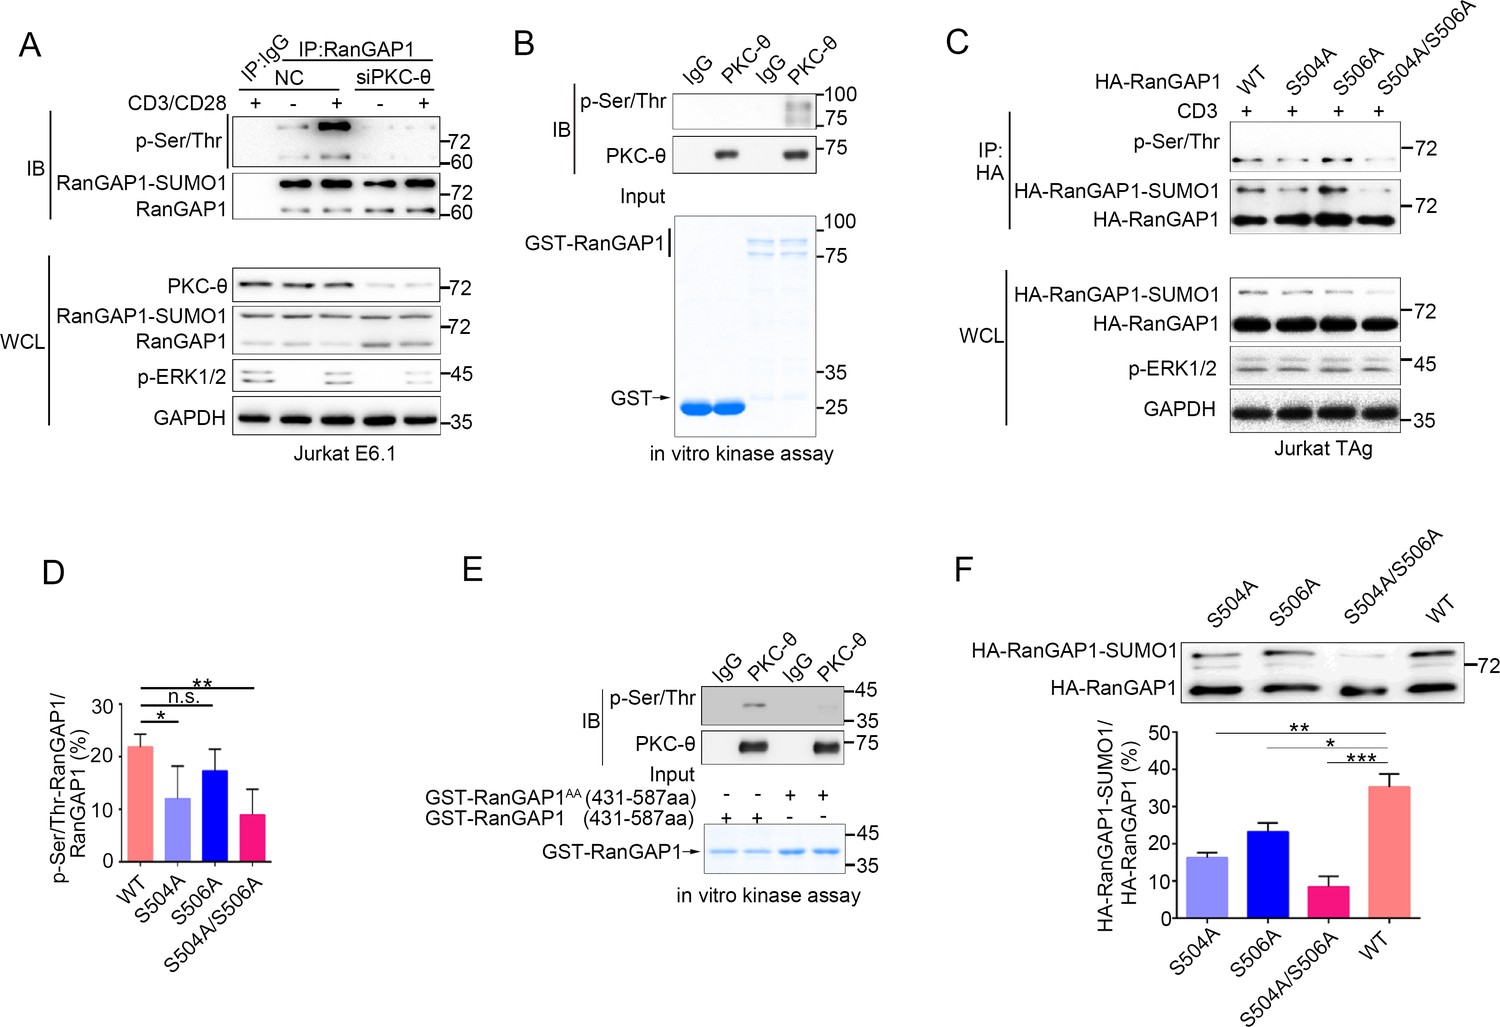
PKC-θ-mediated sumoylation of RanGAP1 requires its phosphorylation on Ser504 and Ser506.
(A) Immunoblot analysis of serine-phosphorylated RanGAP1 in Jurkat E6.1 T cells transfected with siNC or siPKC-θ, and left unstimulated or stimulated with anti-CD3 plus anti-CD28. (B) In vitro PKC-θ kinase assay using PKC-θ immunoprecipitated from Jurkat E6.1 cells and recombinant GST-RanGAP1 as substrate. (C, D) Immunoblot analysis of the phosphorylation of transfected wild-type or Ser-mutated HA-tagged RanGAP1 using a mixture of p-Ser- and p-Thr-specific antibodies in Jurkat-TAg cells, which were left unstimulated or stimulated for 15 min with anti-CD3 (C). Immunoblotting of the indicated proteins in WCL is shown at bottom. The ratio of phospho-RanGAP1 to immunoprecipitated RanGAP1 is shown in (D). Analysis is based on three biological replicates. n.s., not significant, *p<0.05, **p<0.01 (one-way ANOVA with post hoc test). (E) In vitro PKC-θ kinase assay as in (B), using purified truncated GST-RanGAP1 or GST-RanGAP1 AA (S504A/S506A) as substrate. (F) Immunoblot analysis of the sumoylation of wild-type or the indicated HA-tagged RanGAP1 mutants in Jurkat-TAg cells using an anti-HA antibody (top panel). The ratios of RanGAP1-SUMO1 to RanGAP1 are shown at the bottom panel. Analysis is based on three biological replicates. n.s., not significant, *p<0.05, **p<0.01, ***p<0.001 (one-way ANOVA with post hoc test). Data are representative of three biological replicates.
-
Figure 4—source data 1
Uncropped western blot for Figure 4.
- https://cdn.elifesciences.org/articles/67123/elife-67123-fig4-data1-v3.pdf
-
Figure 4—source data 2
Row data for Figure 4 and for Figure 4—figure supplement 1.
- https://cdn.elifesciences.org/articles/67123/elife-67123-fig4-data2-v3.xlsx
Figure 4—figure supplement 1
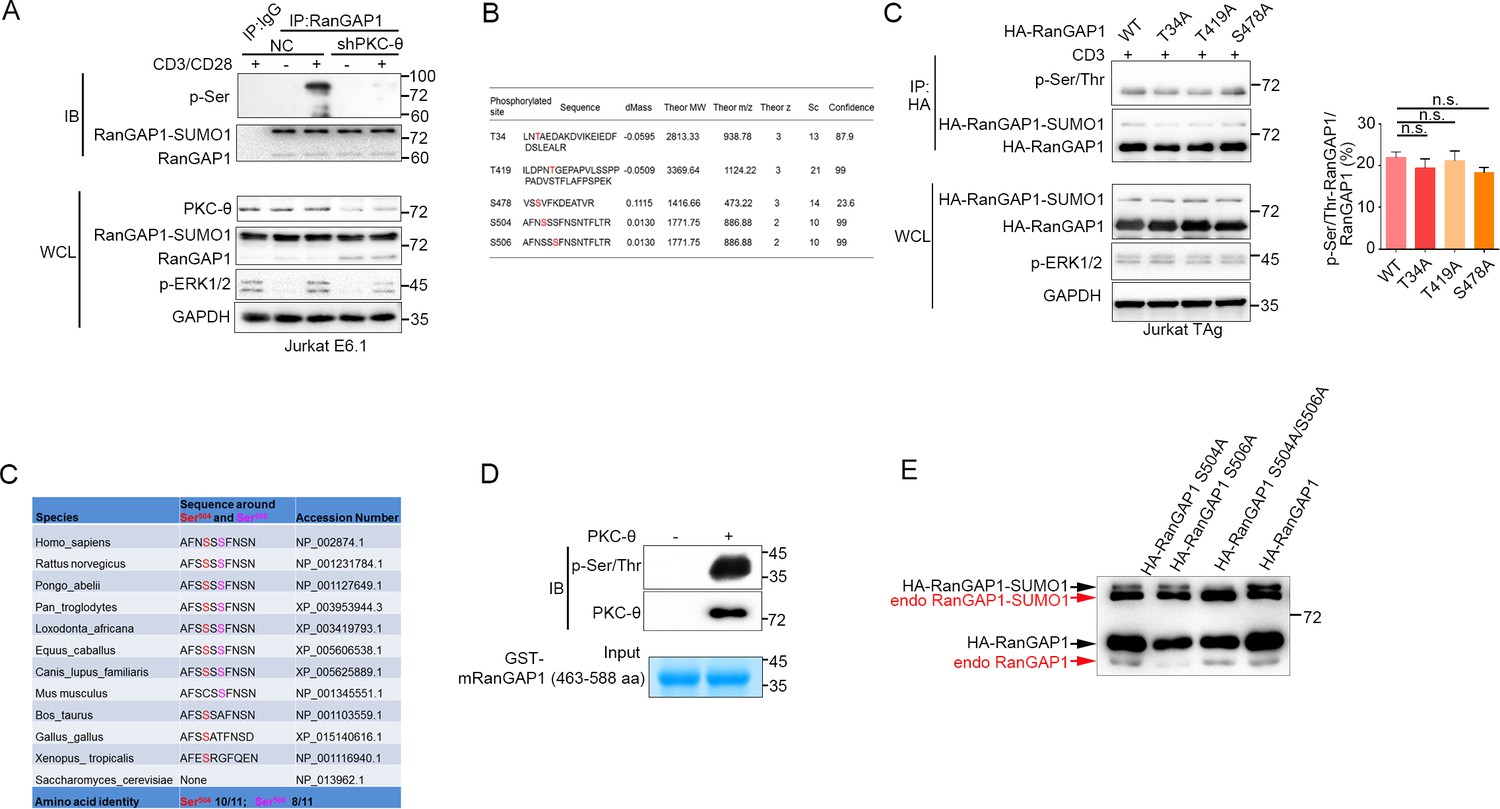
PKC-θ-dependent phosphorylation of RanGAP1.
(A) Immunoblot analysis of the serine-phosphorylated RanGAP1 in stably transfected control (NC) or shPKC-θ-expressing Jurkat E6.1 T cells left unstimulated or stimulated with anti-CD3 plus anti-CD28. Asterisk indicates a nonspecific protein band. (B) Listing of 5 RanGAP1 Ser/Thr phosphorylation sites (red) identified by MS analysis of RanGAP1 phosphorylated in vitro by PKC-θ. (C) Immunoblot analysis of the phosphorylation of transfected wild-type or Ser-mutated HA-tagged RanGAP1 using a mixture of p-Ser- and p-Thr-specific antibodies in Jurkat-TAg cells, which were left unstimulated or stimulated for 15 min with anti-CD3 (left). Immunoblotting of the indicated proteins in WCL is shown at bottom. The ratio of phospho-RanGAP1 to immunoprecipitated RanGAP1 is shown in (right). Analysis is based on three biological replicates. n.s., not significant (one-way ANOVA with post hoc test). (D) Sequence alignment of RanGAP1 proteins from the indicated species, showing conservation of Ser504 and Ser506. (E) In vitro PKC-θkinase assay using recombinant truncated GST-mouse mRanGAP1463-588 as a substrate. (F) Immunoblot analysis of both HA-RanGAP1 and endogenous RanGAP1 in WCL from Figure 4F, detected by RanGAP1 antibody. Data are representative of three (A, C, E, F) or two (B) biological replicates.
-
Figure 4—figure supplement 1—source data 1
Uncropped western blot for Figure 4—figure supplement 1.
- https://cdn.elifesciences.org/articles/67123/elife-67123-fig4-figsupp1-data1-v3.pdf
Figure 5 with 1 supplement
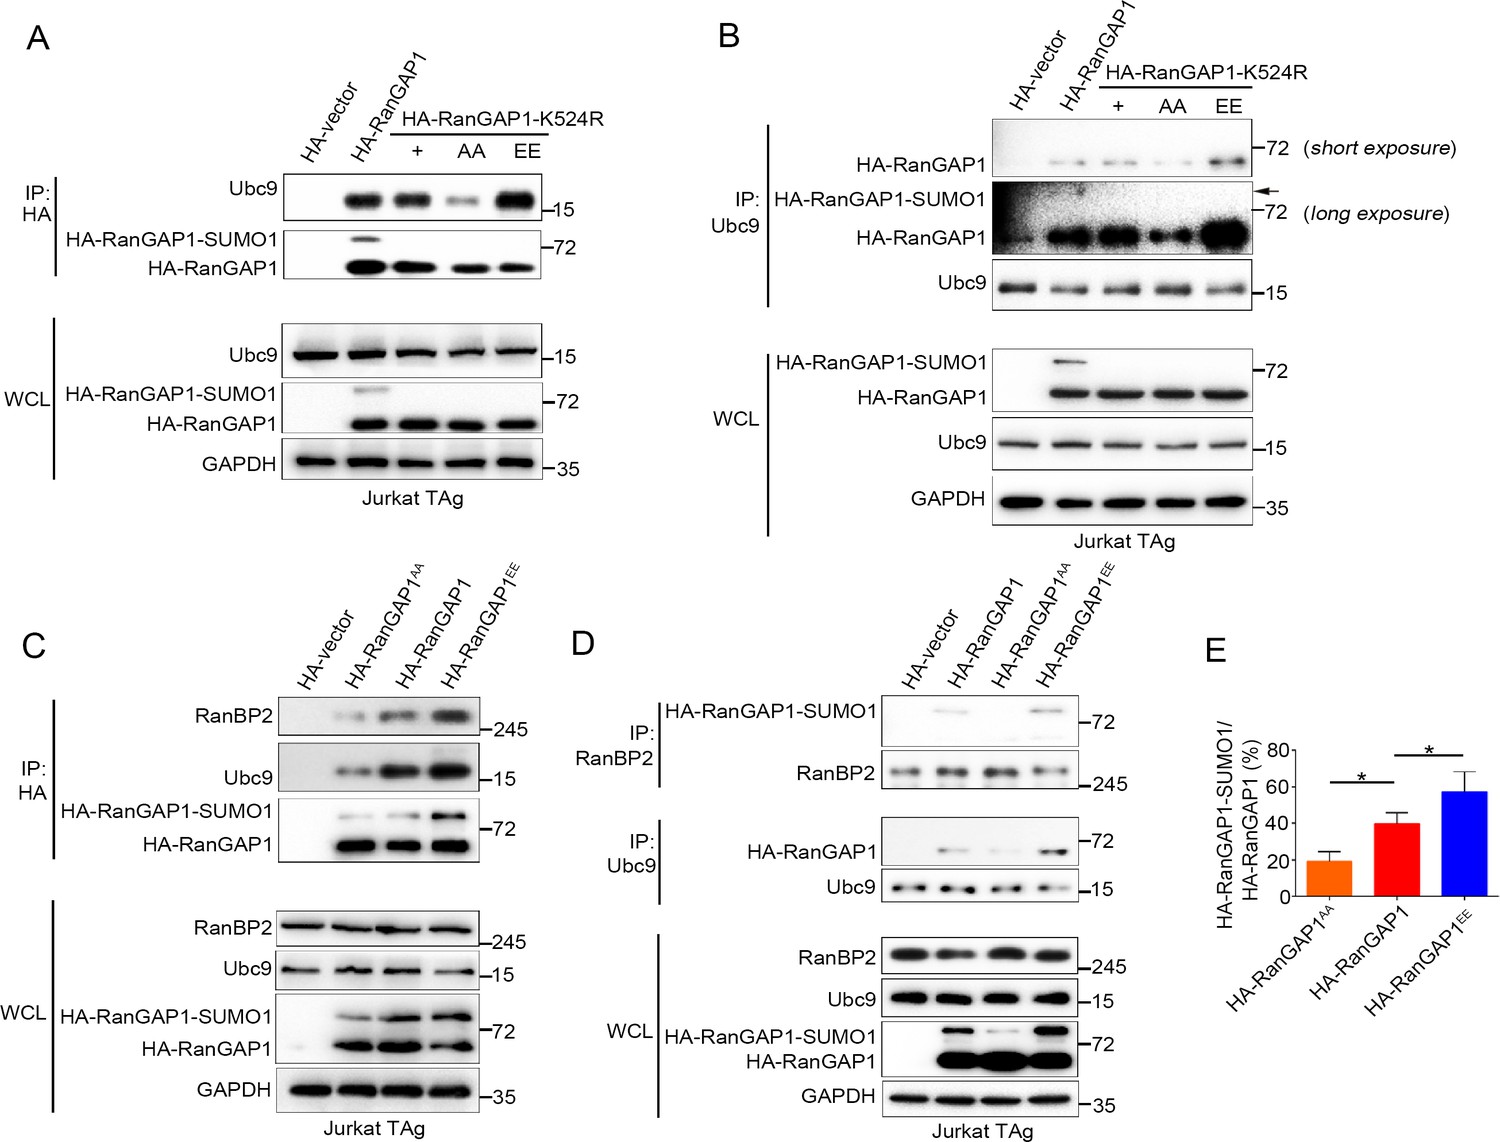
PKC-θ-mediated phosphorylation of RanGAP1 is required for its association with Ubc9 and RanBP2.
(A, B) Reciprocal IP analysis of the association between HA-tagged wild-type or K524-mutated RanGAP1 and endogenous Ubc9. RanGAP1 expression was analyzed by anti-HA antibody immunoblotting in WCL (bottom panels). RanGAP1AA (S504A/S506A); RanGAP1EE (S504E/S506E). (C–E) Immunoblot analysis of HA-RanGAP1 IPs (C) and Ubc9 IPs or RanBP2 IPs (D) from Jurkat-TAg cells transfected with HA-RanGAP1 and HA-RanGAP1 mutants. The ratio of RanGAP1-SUMO1 to RanGAP1 in the WCL of (C) and (D) is quantified in (E); quantification is based on three biological replicates. *p<0.05 (one-way ANOVA with post hoc test). Data are representative of three biological replicates.
-
Figure 5—source data 1
Uncropped western blot for Figure 5.
- https://cdn.elifesciences.org/articles/67123/elife-67123-fig5-data1-v3.pdf
-
Figure 5—source data 2
Row data for Figure 5.
- https://cdn.elifesciences.org/articles/67123/elife-67123-fig5-data2-v3.xlsx
Figure 5—figure supplement 1
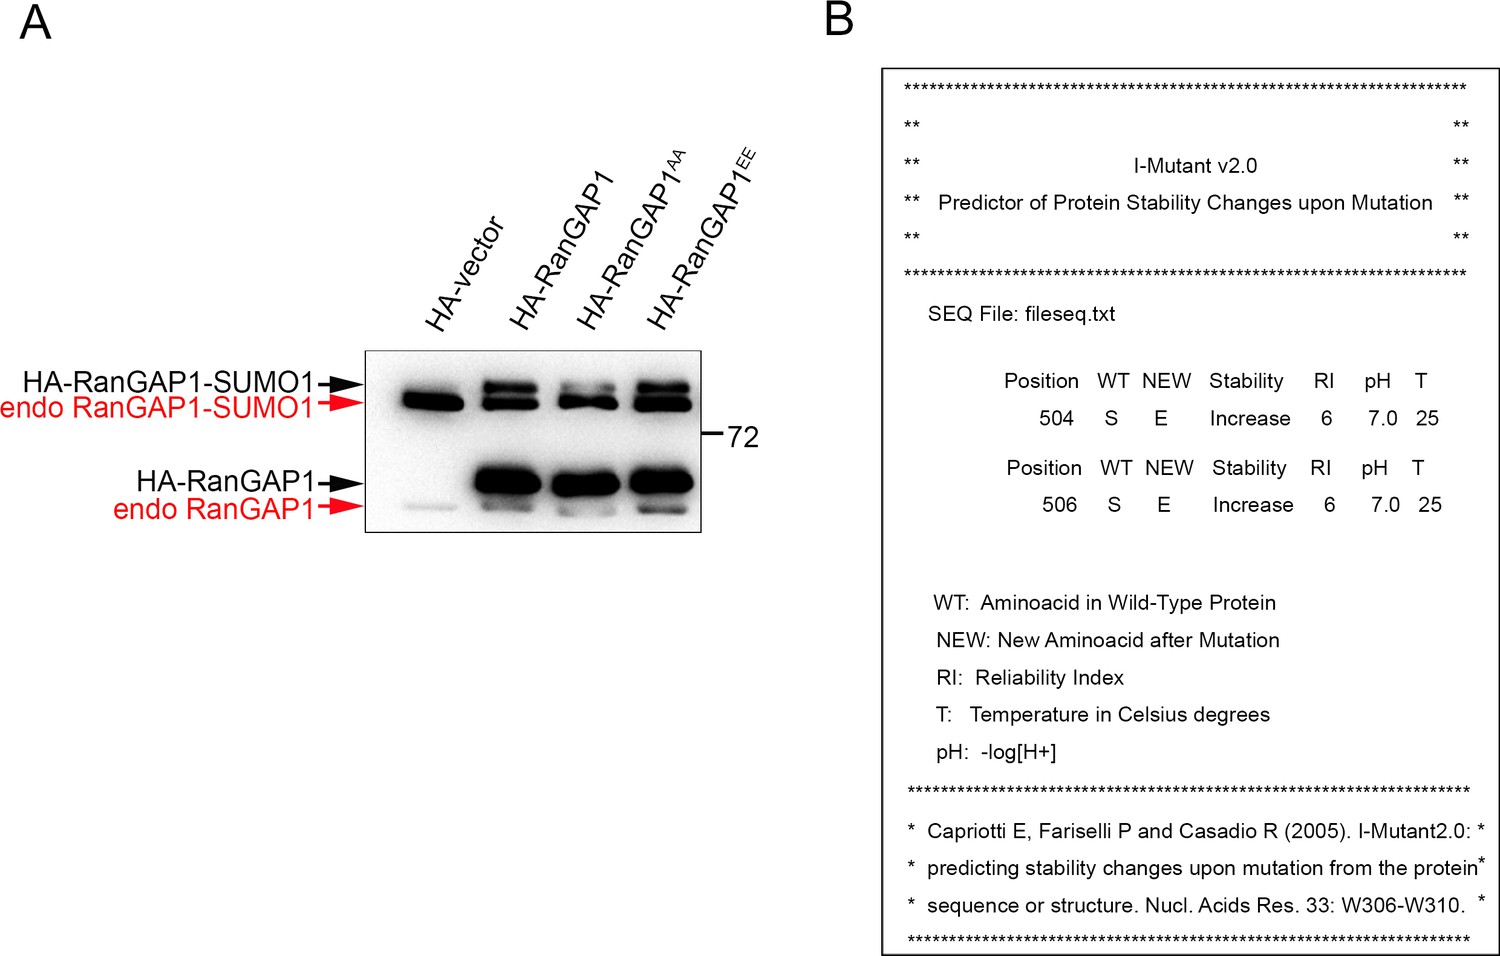
Characterization of the effect of Ser/Glu mutation on RanGAP1.
(A) Immunoblot analysis of both HA-RanGAP1 and endogenous RanGAP1 in WCL from Figure 5(D), detected by RanGAP1 antibody. (B) Prediction of RanGAP1 stability changes upon mutating Ser504 and Ser506 to Glu. Predicted increase of protein stability due to mutations at serine 504 or serine 506 of RanGAP1 to glutamic acid as determined by i-Mutant2.0 (folding.biofold.org/i-mutant/i-mutant2.0.html). Data are representative of three (A) biological replicates.
-
Figure 5—figure supplement 1—source data 1
Uncropped western blot for Figure 5—figure supplement 1.
- https://cdn.elifesciences.org/articles/67123/elife-67123-fig5-figsupp1-data1-v3.pdf
Figure 6 with 1 supplement
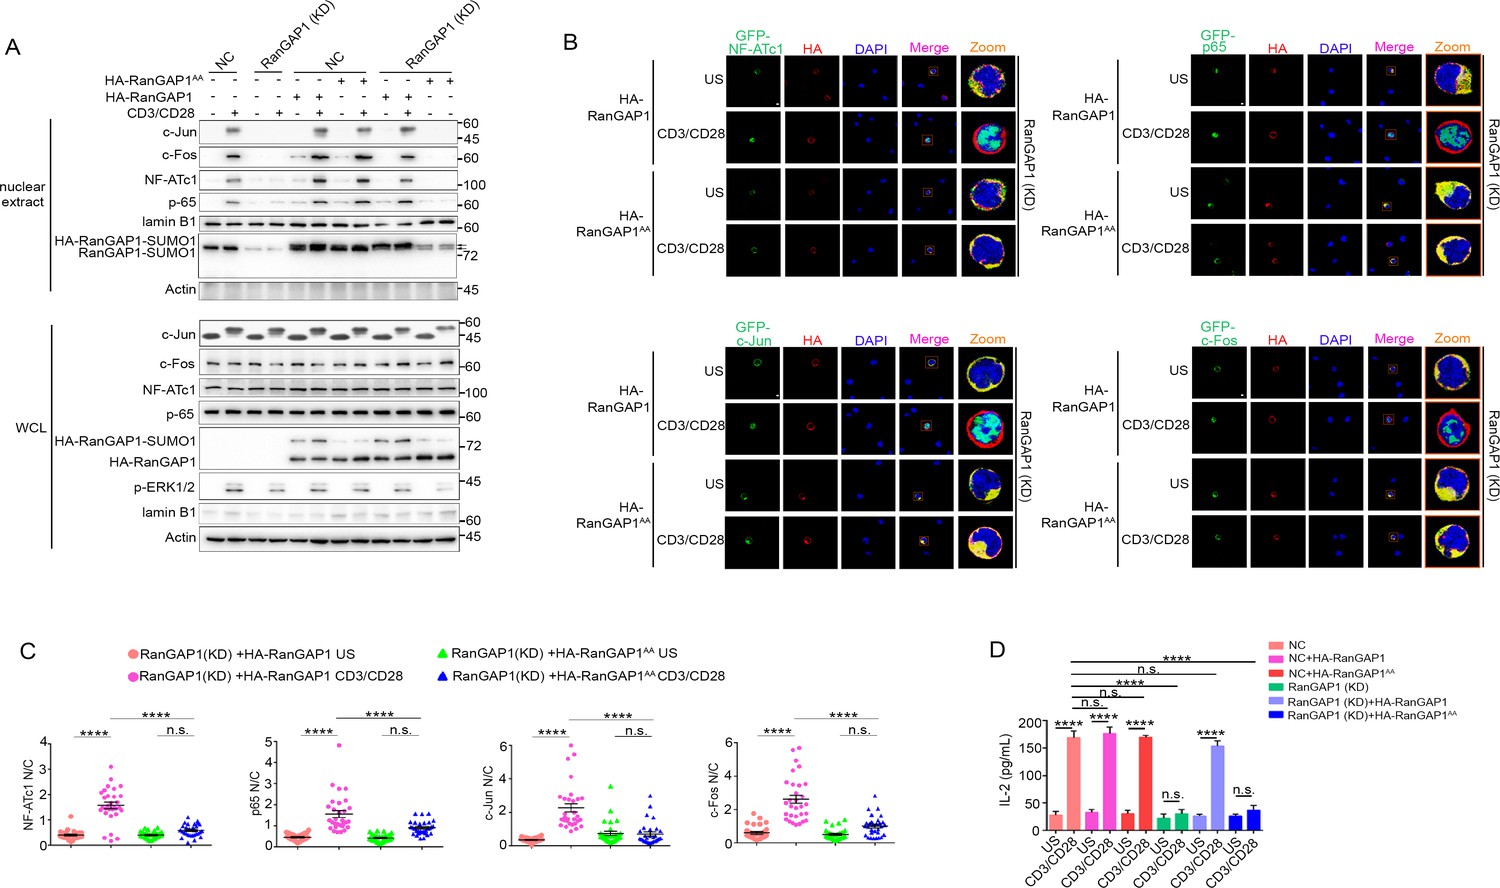
Wild-type RanGAP1, but not RanGAP1AA, rescues deficient TCR-induced nuclear import of NF-ATc1, NF-κB, AP-1 in RanGAP1 (KD) Jurkat T cells.
(A) Immunoblot analysis of NC (transfected with CRISPR/Cas9 vector expressing a scrambled gRNA) and RanGAP1(KD) (containing an in-frame nucleotide deletion in RanGAP1 gene induced by CRISPR/Cas9 genome editing) Jurkat E6.1 cells transfected with HA-RanGAP1 or HA-RanGAP1AA, which were left unstimulated or stimulated for 15 min with anti-CD3 plus anti-CD28, followed by nuclear fractionation and immunodetection with the indicated antibodies. RanGAP1AA (S504A/S506A). (B) Confocal imaging of the nuclear import of GFP-tagged NF-ATc1, p65 (NF-κB), c-Jun and c-Fos in RanGAP1 (KD) cells cotransfected with HA-RanGAP1 or HA-RanGAP1AA, and left unstimulated or stimulated with anti-CD3 plus anti-CD28. Scale bars, 3 μm. (C) Quantification of the nuclear import of GFP-tagged NF-ATc1, p65 (NF-κB), c-Jun and c-Fos in ~30 cells from two biological replicates as presented in (B). Each symbol represents an individual T cell. Horizontal lines indicate the mean ± s.e.m. n.s., not significant, ****p<0.0001 (one-way ANOVA with post hoc test). (D) Enzyme-linked immunosorbent assay of IL-2 in supernatants of NC or RanGAP1 (KD) cells transfected with HA-RanGAP1 or HA-RanGAP1AA and left unstimulated or stimulated for 24 hr with anti-CD3 plus anti-CD28. n.s., not significant, ****p<0.0001 (one-way ANOVA with post hoc test). Data are representative of three (A, D) or two (B, C) biological replicates.
-
Figure 6—source data 1
Uncropped western blot for Figure 6.
- https://cdn.elifesciences.org/articles/67123/elife-67123-fig6-data1-v3.pdf
-
Figure 6—source data 2
Row data for Figure 6 and for Figure 6—figure supplement 1.
- https://cdn.elifesciences.org/articles/67123/elife-67123-fig6-data2-v3.xlsx
Figure 6—figure supplement 1
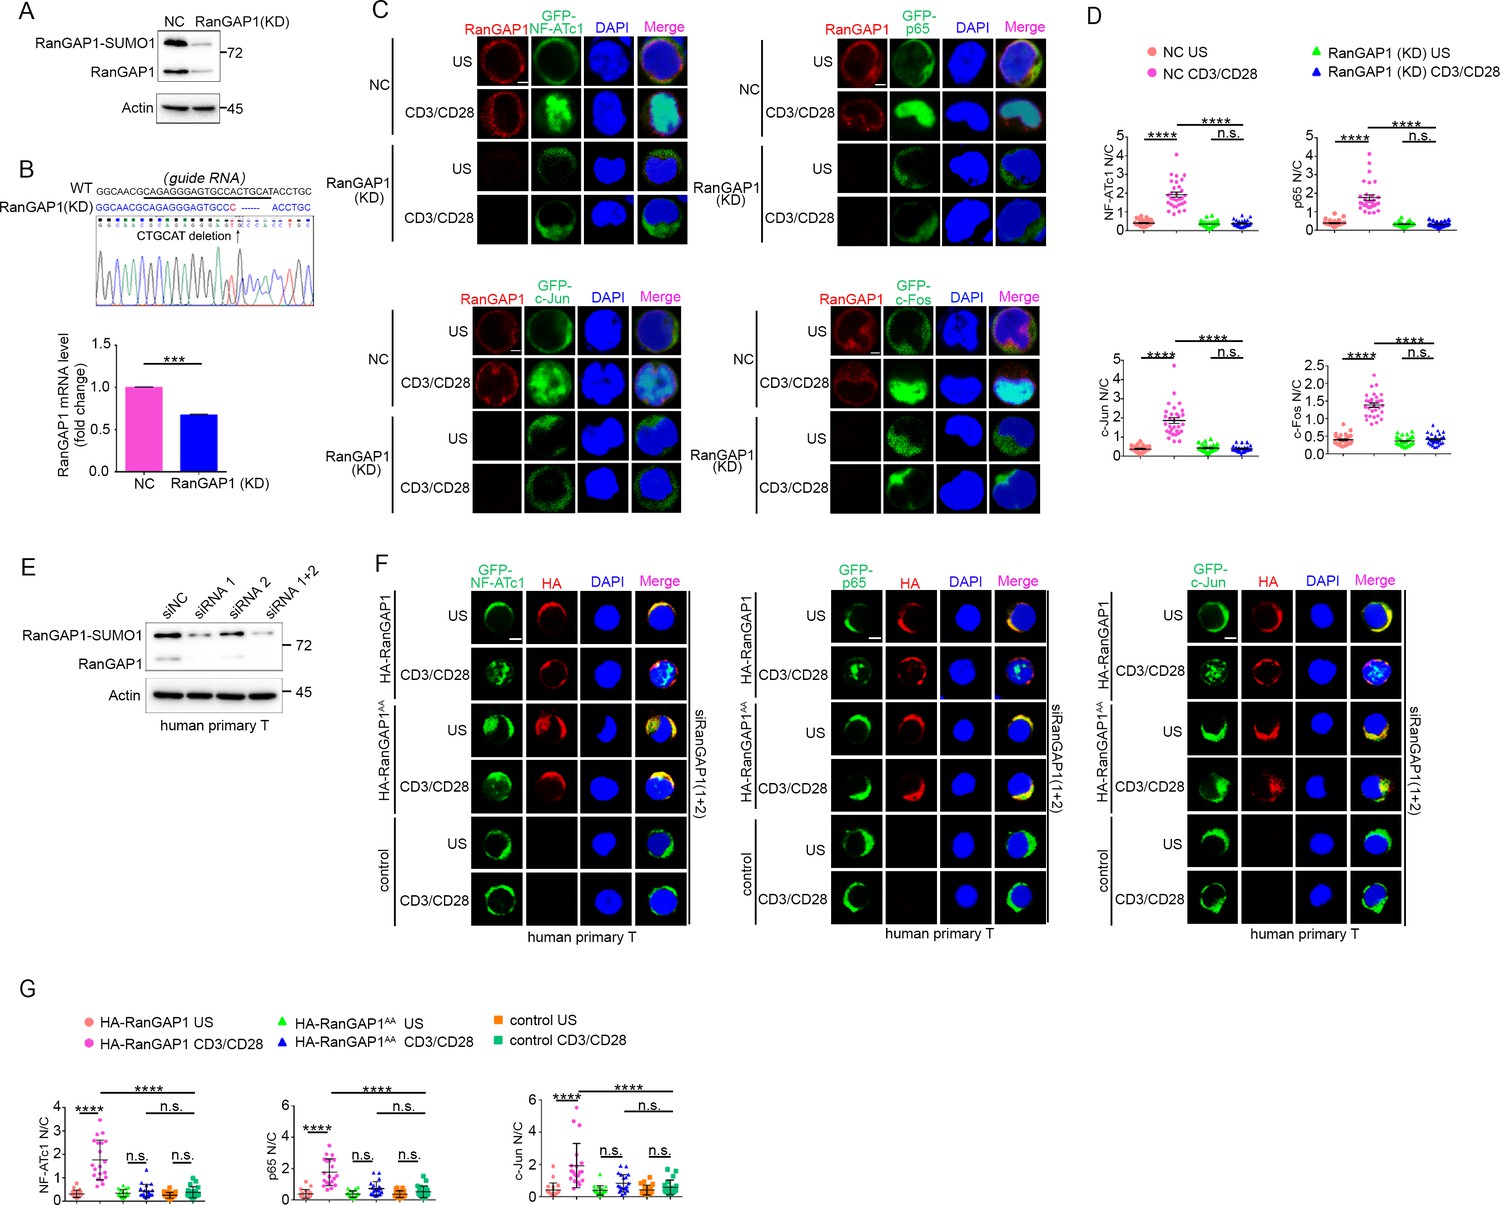
RanGAP1 is required for TCR-induced nuclear import of NF-ATc1, NF-κB, and AP-1.
(A) RanGAP1 expression in negative control (NC, cells transfected with scrambled gRNA) Jurkat E6.1 T cells or cells with stable CRISPR/Cas9-edited RanGAP1 knockdown (KD). (B) Sequence alignment of RanGAP1 genomic fragment (WT) and the CRISPR/Cas9-edited RanGAP1 genomic fragment in the RanGAP1 (KD) Jurkat T cell line (top). The underlined sequence represents the guide RNA. The mRNA expression levels of RanGAP1 in NC and RanGAP1 (KD) T cells are shown at the bottom. Horizontal lines indicate the mean ± s.e.m. n.s., ***p<0.001 (two-tailed unpaired Student’s t-test). (C) Confocal imaging showing the nuclear import of GFP-tagged NF-ATc1, p65 (NF-κB), c-Jun and c-Fos in NC and RanGAP1 (KD) T cells unstimulated or stimulated with anti-CD3 plus anti-CD28. Scale bars, 2 μm. These images are representative of ~30 cells analyzed in each group from two biological replicates. (D) Quantification of the nuclear import of GFP-tagged NF-ATc1, p65 (NF-κB), c-Jun, and c-Fos as presented in (C). Each symbol represents an individual T cell. Horizontal lines indicate the mean ± s.e.m. n.s., not significant, ***p<0.0001 (one-way ANOVA with post hoc test). (E) The knockdown effect of siRanGAP1 in human primary T cells. (F) Confocal imaging showing the nuclear import of transfected GFP-tagged NF-ATc1, p65 (NF-κB) or c-Jun in human primary T cells cotransfected with siNC or siRanGAP1 (siRNA 1 + 2), unstimulated or stimulated with anti-CD3 plus anti-CD28. Scale bars, 2 μm. These images are representative of ~30 cells analyzed in each group from two biological replicates. (G) Quantification of the nuclear import of GFP-tagged NF-ATc1, p65 (NF-κB), c-Jun as presented in (F). Each symbol represents an individual T cell. Horizontal lines indicate the mean ± s.e.m. n.s., not significant, ****p<0.0001 (one-way ANOVA with post hoc test). Data are representative of three (A, E) or two (C, D, F, G) biological replicates.
-
Figure 6—figure supplement 1—source data 1
Uncropped western blot for Figure 6—figure supplement 1.
- https://cdn.elifesciences.org/articles/67123/elife-67123-fig6-figsupp1-data1-v3.pdf
Figure 7
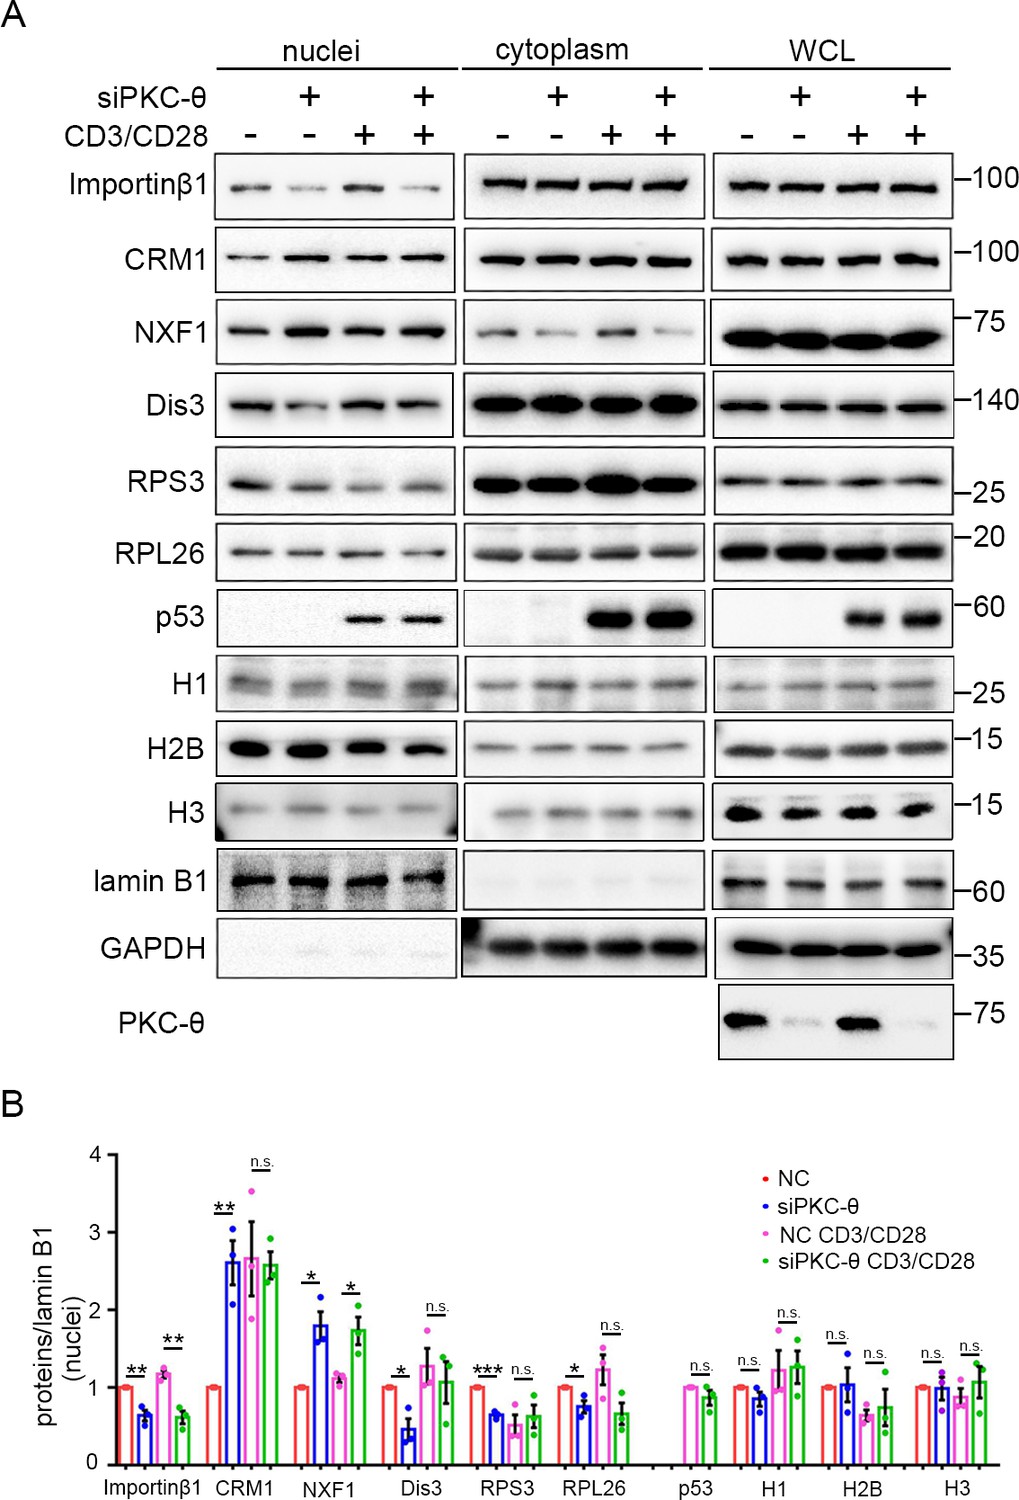
PKC-θ-RanGAP signaling axis is differentially required in various nuclear transport pathways.
(A) Subcellular fractionation of Jurkat E6.1 cells transfected with siNC or siPKC-θ and stimulated for 0–15 min with anti-CD3 plus anti-CD28, followed by immunodetection with the indicated antibodies. (B) Statistical analysis of the indicated proteins in nuclear extract from the experiment of (A). n.s., not significant, *p<0.05, **p<0.01, ***p<0.001 (two-tailed, unpaired Student’s t-test). Data are representative of three biological replicates.
-
Figure 7—source data 1
Uncropped western blot for Figure 7.
- https://cdn.elifesciences.org/articles/67123/elife-67123-fig7-data1-v3.pdf
-
Figure 7—source data 2
Row data for Figure 7.
- https://cdn.elifesciences.org/articles/67123/elife-67123-fig7-data2-v3.xlsx
Figure 8

RanGAP1EE, but not RanGAP1AA, rescues TCR-induced nuclear import of c-Jun in PKC-θ-deficient cells.
(A) Immunoblot analysis of Jurkat-TAg cells cotransfected with siNC or siPKC-θ plus HA-RanGAP1AA or HA-RanGAP1EE as indicated, which were left unstimulated or stimulated for 15 min with anti-CD3, followed by nuclear fractionation and immunodetection with the indicated antibodies. (B) Confocal imaging showing the nuclear import of c-Jun, NF-ATc1 or p65 (NF-κB) in wild-type (WT) murine splenic T cells transduced with GFP-vector or Prkcq−/− murine splenic T cells transduced with GFP-vector or RanGAP1AA or RanGAP1EE, left unstimulated or stimulated with anti-CD3 plus anti-CD28 for 15 min. Scale bars, 2 μm. These images are representative of ~30 cells analyzed in each group in two independent experiments. (C) Quantification of the nuclear import of c-Jun, NF-ATc1, or p65 as presented in (B). Each symbol represents an individual T cell. Horizontal lines indicate the mean ± s.e.m. n.s., not significant, ****p<0.0001 (one-way ANOVA with post hoc test). Data are representative of two biological replicates.
-
Figure 8—source data 1
Uncropped western blot for Figure 8.
- https://cdn.elifesciences.org/articles/67123/elife-67123-fig8-data1-v3.pdf
-
Figure 8—source data 2
Row data for Figure 8.
- https://cdn.elifesciences.org/articles/67123/elife-67123-fig8-data2-v3.xlsx
Figure 9

Schematic model of nuclear import regulation by the TCR-PKC-θ-RanGAP1 axis.
Upon TCR stimulation, PKC-θ phosphorylates RanGAP1 to increase its association with Ubc9, thereby enhancing the sumoylation of RanGAP1, which is required for assembly of the RanBP2/RanGAP1-SUMO1/Ubc9 subcomplex. This complex then promotes the nuclear import of NF-ATc1, NF-κB, and AP-1.
Tables
Key resources table
| Reagent type (species) or resource | Designation | Source or reference | Identifiers | Additional information |
|---|---|---|---|---|
| Strain, strain background (Mus musculus) | C57BL/6 (Prkcq−/−) | A gift from D. Littman (Wang et al., 2015) | PMID:26390157 | |
| Cell line (Homo-sapiens) | Jurkat, Clone E6-1 | ATCC | TIB-152 | |
| Cell line (Homo-sapiens) | Jurkat-TAg | Cellosaurus | CVCL_C831 RRID:CVCL_C831 | |
| Antibody | Goat polyclonal anti-PKC-θ | Santa Cruz Biotechnology | Cat #: sc-1875, RRID:AB_675806 | IF (1:200) |
| Antibody | Mouse monoclonal anti-RanGAP1 | Santa Cruz Biotechnology | Cat #: sc-28322, RRID:AB_2176987 | WB (1:1000) |
| Antibody | Mouse monoclonal anti-importin β1 | Santa Cruz Biotechnology | Cat #: sc-137016, RRID:AB_2133993 | WB (1:1000) IF (1:200) |
| Antibody | Mouse monoclonal anti- Ran | Santa Cruz Biotechnology | Cat #: sc-271376, RRID:AB_10610890 | WB (1:1000) IF (1:200) |
| Antibody | Mouse monoclonal anti- RanBP2 | Santa Cruz Biotechnology | Cat #: sc-74518, RRID:AB_2176784 | WB (1:1000) |
| Antibody | Mouse monoclonal anti- Ubc9 | Santa Cruz Biotechnology | Cat #: sc-271057, RRID:AB_10610674 | WB (1:1000) |
| Antibody | Mouse monoclonal anti- NF-ATc1 | Santa Cruz Biotechnology | Cat #: sc-7294, RRID:AB_2152503 | WB (1:1000) |
| Antibody | Mouse monoclonal anti-c-Myc | Santa Cruz Biotechnology | Cat #: sc-40, RRID:AB_2857941 | WB (1:1000) IF (1:200) |
| Antibody | Mouse monoclonal anti- actin | Santa Cruz Biotechnology | Cat #: sc-8432, RRID:AB_626630 | WB (1:1000) |
| Antibody | Mouse monoclonal anti-p-Ser/Phosphoserine | Santa Cruz Biotechnology | Cat #: sc-81516, RRID:AB_1128626 | WB (1:1000) |
| Antibody | Goat polyclonal anti-Lamin B1 | Santa Cruz Biotechnology | Cat #: sc-30264, RRID:AB_2136305 | WB (1:1000) IF (1:200) |
| Antibody | Rabbit monoclonal anti-p65(NF-κB) | Santa Cruz Biotechnology | Cat #: sc-109, RRID:AB_632039 | WB (1:1000) IF (1:200) |
| Antibody | Mouse monoclonal anti-Histone 1 | Santa Cruz Biotechnology | Cat #: sc-8030, RRID:AB_675641 | WB (1:500) |
| Antibody | Rabbit monoclonal anti-c-Jun | Cell Signaling Technology | Cat #: 9165, RRID:AB_2130165 | WB (1:1000) IF (1:200) |
| Antibody | Mouse monoclonal anti-Dis3 | Santa Cruz Biotechnology | Cat #: sc-398663 | WB (1:1000) |
| Antibody | Rabbit monoclonal anti-c-Fos | Cell Signaling Technology | Cat #: 2250, RRID:AB_2247211 | WB (1:1000) IF (1:200) |
| Antibody | Rabbit monoclonal anti-phospho-Ser/Thr | Cell Signaling Technology | Cat #: 9631, RRID:AB_330308 | WB (1:1000) |
| Antibody | Mouse monoclonal anti-phospho-ERK1/2 | Cell Signaling Technology | Cat #: 9106, RRID:AB_331768 | WB (1:1000) |
| Antibody | Rabbit monoclonal anti-Na/K-ATPas | Cell Signaling Technology | Cat #: 3010, RRID:AB_2060983 | WB (1:1000) |
| Antibody | Rabbit monoclonal anti-GAPDH | Cell Signaling Technology | Cat #: 2118, RRID:AB_561053 | WB (1:1000) |
| Antibody | Rabbit monoclonal anti-CRM1 | Cell Signaling Technology | Cat #: 46249, RRID:AB_2799298 | WB (1:1000) |
| Antibody | Rabbit monoclonal anti-Histone 2B | Cell Signaling Technology | Cat #: 12364, RRID:AB_2714167 | WB (1:1000) |
| Antibody | Rabbit monoclonal anti-Histone 3 | Cell Signaling Technology | Cat #: 4499, RRID:AB_10544537 | WB (1:1000) |
| Antibody | Rabbit monoclonal anti-NF-ATc1 | Abcam | Cat #: ab25916, RRID:AB_448901 | IF (1:200) |
| Antibody | Rabbit monoclonal anti-RanGAP1 | Abcam | Cat #: ab92360, RRID:AB_10564003 | IF (1:200) |
| Antibody | Rabbit polyclonal anti-RPL26 | Abcam | Cat #: ab59567, RRID:AB_945306 | WB (1:2000) |
| Antibody | Rabbit monoclonal anti-RPS3 | Abcam | Cat #: ab181992 | WB (1:2000) |
| Antibody | Rabbit monoclonal anti-NXF1 | Abcam | Cat #: ab129160, RRID:AB_11142853 | WB (1:2000) |
| Antibody | Mouse monoclonal anti- Mab414 | BioLegend | Cat #: 902901, RRID:AB_2565026 | WB (1:1000) IF (1:200) |
| Antibody | Rat monoclonal anti-mouse CD3 | BioLegend | Cat #: 100202, RRID:AB_312659 | 5 μg/ml |
| Antibody | Syrian Hamster monoclonal anti-mouse CD28 | BioLegend | Cat #: 102102, RRID:AB_312867 | 2 μg/ml |
| Antibody | Mouse monoclonal anti-Human CD3(OKT3) | BioLegend | Cat #: 317302, RRID:AB_571927 | 5 μg/ml |
| Antibody | Mouse monoclonal anti-Human CD28(CD28.2) | BioLegend | Cat #: 302902, RRID:AB_314304 | 2 μg/ml |
| Antibody | Alexa Fluor 488-coupled chicken anti-mouse IgG | Invitrogen | Cat #: A-21200, RRID:AB_2535786 | IF (1:2000) |
| Antibody | Alexa Fluor 594-coupled chicken anti-mouse IgG | Invitrogen | Cat #: A-21201, RRID:AB_141630 | IF (1:2000) |
| Antibody | Alexa Fluor 594-coupled chicken anti-rabbit IgG | Invitrogen | Cat #: A-21442, RRID:AB_141840 | IF (1:2000) |
| Antibody | Alexa Fluor 488-coupled donkey anti-goat IgG | Invitrogen | Cat #: A-11055, RRID:AB_2534102 | IF (1:2000) |
| Other | Cell Tracker Blue | Invitrogen | Cat #: C2110 | IF: 10 μM |
| Recombinant DNA reagent | pcDNA3.1( ) (plasmid) | Invitrogen | Cat #: V79020 | |
| Recombinant DNA reagent | pGEX-4T-2 | GE | Cat #: 27-4581-01 | |
| Recombinant DNA reagent | pFlag-CMV2 | Sigma | Cat #: E7396 | |
| Recombinant DNA reagent | pMXs-IRES-GFP Retroviral Vector | Cell Biolabs | Cat #: RTV-013 | |
| Recombinant DNA reagent | LentiCRISPRv2 | Addgene | Cat #: 52961 | |
| Sequence-based reagent | RanGAP1-F | NM_001278651.2 | CGGGATCCATGGCCTCGGAAGACATTGCCAAGC | Primer for PCR |
| Sequence-based reagent | RanGAP1-R | NM_001278651.2 | ATAAGAATGCGGCCGCCTAGACCTTGTACAGCGTCTGCAGC | Primer for PCR |
| Sequence-based reagent | RanGAP1-S34A-F | NM_001278651.2 | CAAGAGCCTCAAACTCAACGCCGCAGAAGATGCTAAAGATG | Primer for PCR |
| Sequence-based reagent | RanGAP1-T419A-F | NM_001278651.2 | CTGGACCCTAACGCCGGGGAGCCAGCTC | Primer for PCR |
| Sequence-based reagent | RanGAP1-S478A-F | NM_001278651.2 | CCTTCCTAAAGGTGTCAGCCGTGTTCAAGGACGAAG | Primer for PCR |
| Sequence-based reagent | RanGAP1-S504A-F | NM_001278651.2 | GAAGGCTTTCAACGCCTCGTCCTTCAAC | Primer for PCR |
| Sequence-based reagent | RanGAP1-S506A-F | NM_001278651.2 | CTTTCAACTCCTCGGCCTTCAACTCCAAC | Primer for PCR |
| Sequence-based reagent | RanGAP1-S504A/S506A-F | NM_001278651.2 | CTGATGCAGAAGGCTTTCAACGCCAGCGCCTTCAA CTCCAACACCTTCC | Primer for PCR |
| Sequence-based reagent | RanGAP1-S504E/S506E-F | NM_001278651.2 | CTGATGCAGAAGGCTTTCAACGAGAGCGAGTTCAAC TCCAACACCTTCC | Primer for PCR |
| Sequence-based reagent | RanGAP1-K524R-F | NM_001278651.2 | CATGGGTCTGCTCAGGAGTGAAGACAAG | Primer for PCR |
| Sequence-based reagent | RanGAP1 sgRNA | NM_001278651.2 | CACCGCAGAGGGAGTGCCACT | CRISPR-Cas9 guides |
| Sequence-based reagent | shPKC-θ | NM_006257.5 | GAGTATGTCGAATCAGAGA | dsRNA for RNAi |
| Sequence-based reagent | siPKC-θ | Previous study in lab (Wang et al., 2015) | GCUUGUAACUUGAGAUCUA | dsRNA for RNAi |
| Sequence-based reagent | siRanGAP1-1 | NM_001278651.2 | GGAGUGUUGACAACCCAAA | dsRNA for RNAi |
| Sequence-based reagent | siRanGAP1-2 | NM_001278651.2 | GUGAGCUGCUCCGCCAUUAAA | dsRNA for RNAi |
| Software algorithm | Fiji/Image-J | MPI-CBG, Dresden/ National Institutes of Health (NIH) | PMID:22743772 RRID:SCR_002285 | Image processing and analysis |
| Software algorithm | Graphpad Prism v6 | Graphpad | RRID:SCR_002798 | Graphs and statistical analysis |
Additional files
Download links
A two-part list of links to download the article, or parts of the article, in various formats.
Downloads (link to download the article as PDF)
Open citations (links to open the citations from this article in various online reference manager services)
Cite this article (links to download the citations from this article in formats compatible with various reference manager tools)
T-cell receptor (TCR) signaling promotes the assembly of RanBP2/RanGAP1-SUMO1/Ubc9 nuclear pore subcomplex via PKC-θ-mediated phosphorylation of RanGAP1
eLife 10:e67123.
https://doi.org/10.7554/eLife.67123


