Tissue-specific modulation of gene expression in response to lowered insulin signalling in Drosophila
- Max-Planck Institute for Biology of Ageing, Germany
- CECAD Cologne Excellence Cluster on Cellular Stress Responses in Aging Associated Diseases, Germany
- Department of Proteomics and Signal Transduction, Max-Planck-Institute of Biochemistry, Germany
- Center for Molecular Medicine (CMMC) & Cologne School for Computational Biology (CSCB), University of Cologne, Germany
- Institute of Healthy Ageing, and GEE, UCL, United Kingdom
Figures
Figure 1
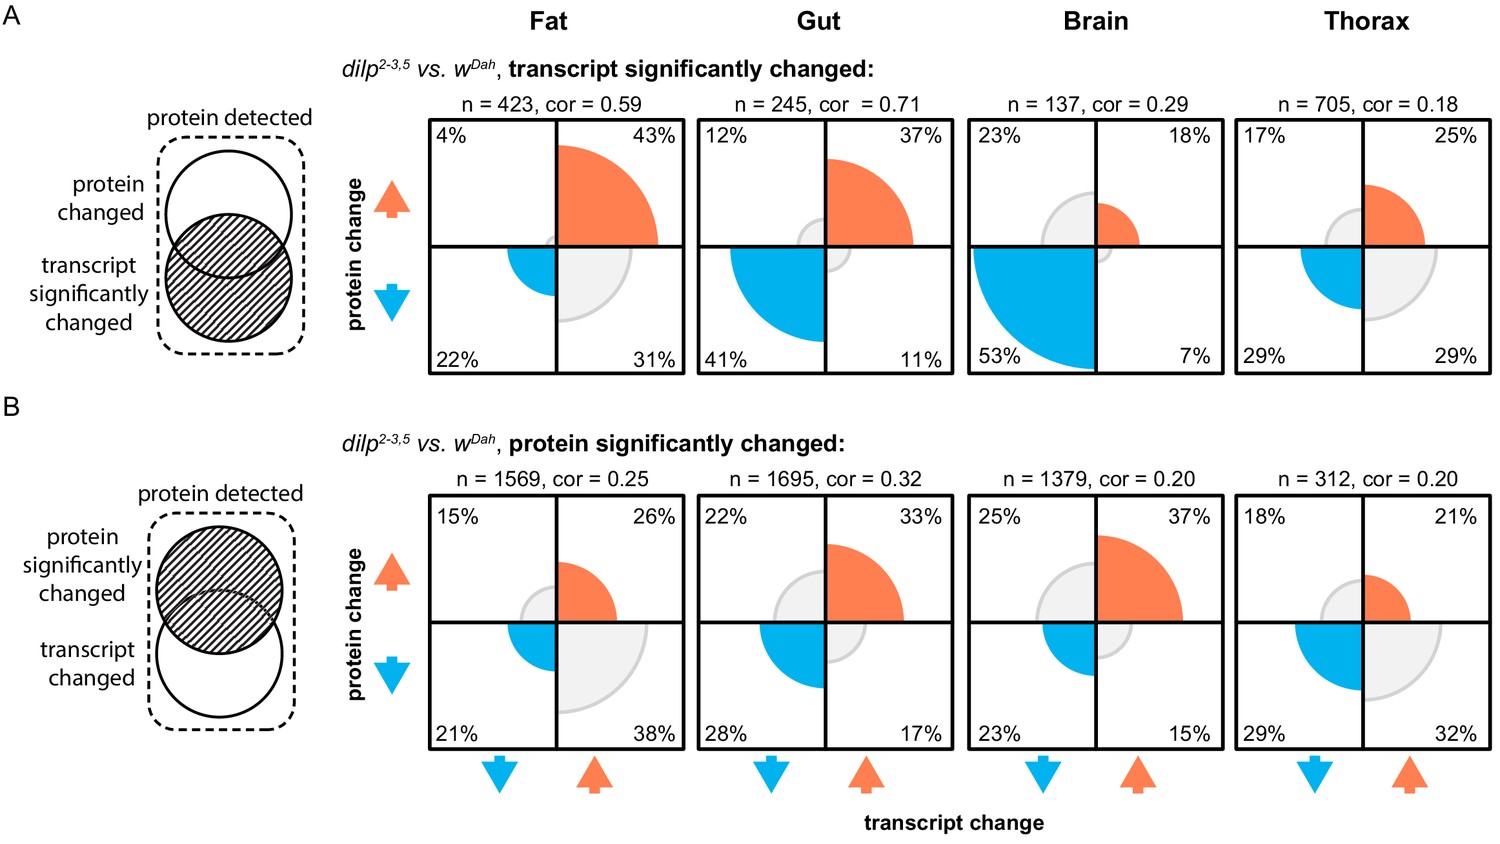
Reducing IIS modulates both the tissue-specific transcriptomic and proteomic landscapes.
Plots show the proportion of protein/transcript pairs that are regulated in the same (both up [orange] or both down [blue]) or opposite (grey) directions in response to reduced IIS (dilp2-3,5 vs. wDah). Correlations were calculated between the protein and transcript log-fold changes of significantly regulated protein/transcript pairs in each plot. (A) All protein/transcript pairs in the respective tissue where the transcript is significantly regulated (adj. p-value≤0.1) in response to reduced IIS, irrespective of if the associated protein is significantly regulated (Supplementary file 3–4). (B) All protein/transcript pairs in the respective tissue where the protein is significantly regulated (adj. p-value≤0.1) in response to reduced IIS, irrespective of if the associated transcript was significantly regulated (Supplementary file 3–4). Correlations (cor.), number of protein/transcript pairs (n) shown above each plot. Rounded percentages of protein/transcript pairs within a specific quadrant of the plots are shown within the respective quadrants (may not total 100%).
Figure 2
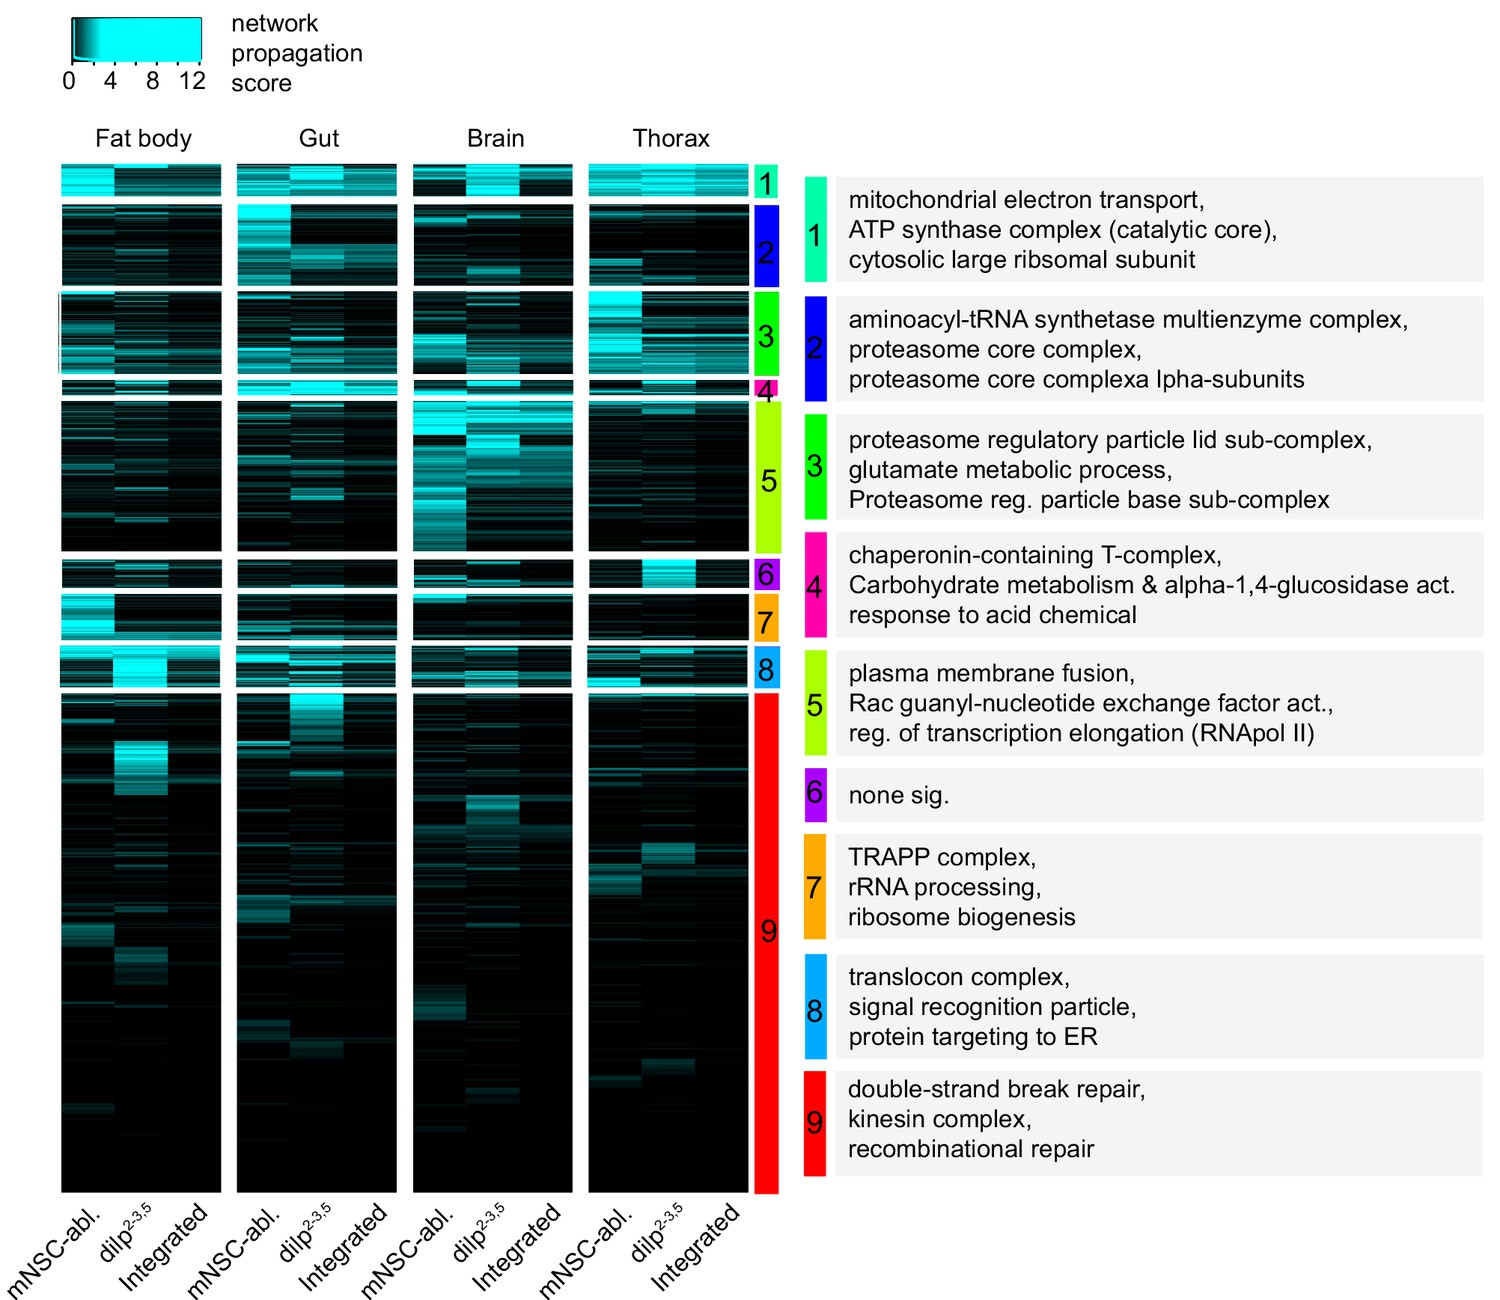
Hierarchical clustering and GO enrichment analysis of significantly regulated proteins in two independent models of reduced IIS activity.
Tissue-specific heatmap of network propagation scores (Supplementary file 7) based on the comparisons of tissue-specific, long-lived IIS mutant proteomes vs. wild-type controls in two independent model systems of reduced IIS: dilp2-3,5 vs. wDah (dilp2-3,5) and InsP3‐Gal4/UAS‐rpr vs. wDah (mNSC-abl.). For every protein and tissue, the minimum of both scores in that tissue was calculated to show conserved changes between the models (Integrated). Clusters denoted by colour and for each cluster. GO enrichment analysis and selected terms shown in grey boxes (see Supplementary file 8 for all significant terms).
Figure 3
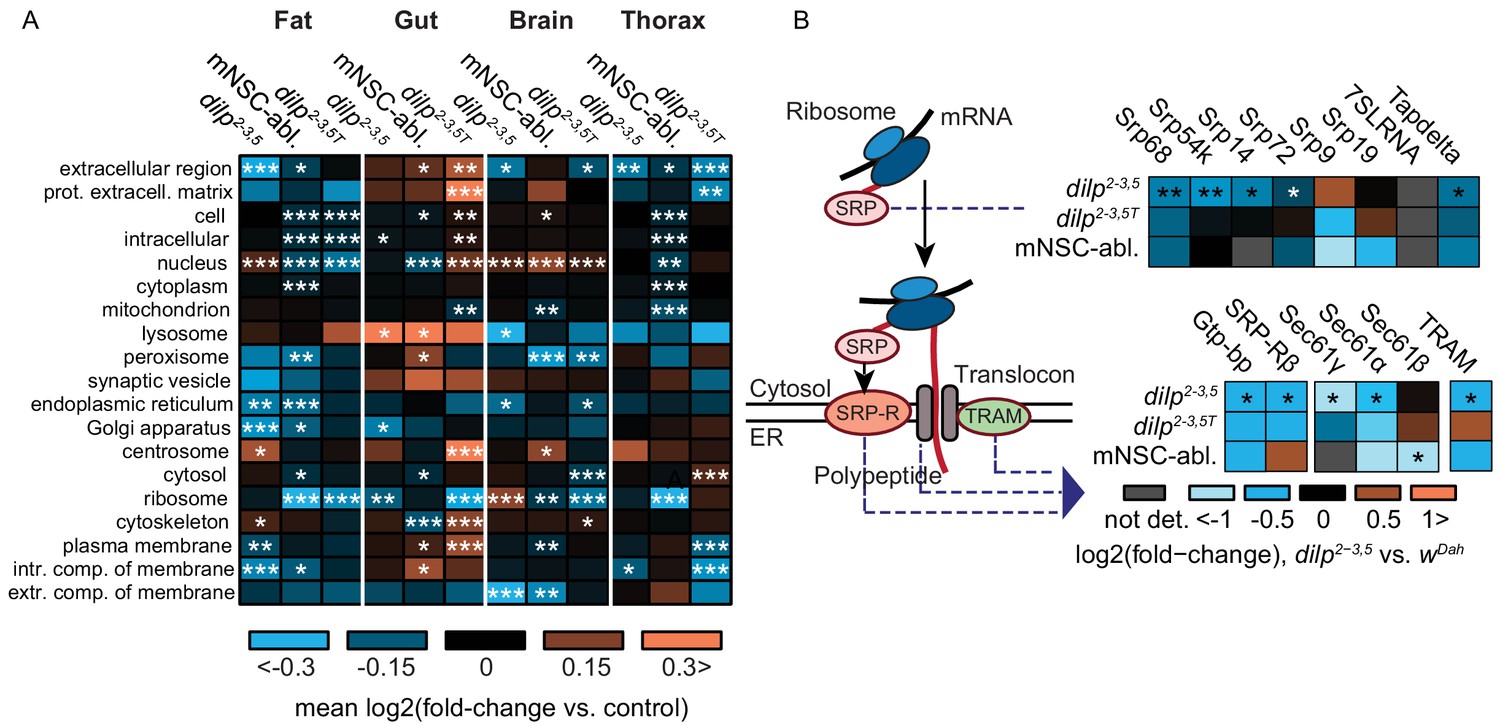
Tissue-specific regulation of ER-associated cellular compartments and the ER co-translational targeting machinery in two independent models of reduced IIS.
(A) Heatmap of mean log-fold changes in proteins annotated with selected GO cellular compartment terms, in the contrasts dilp2-3,5 vs. wDah (dilp2-3,5), dilp2-3,5T vs. wDahT (dilp2-3,5T (T denotes Wolbachia minus genotypes, see Methods section) ), and InsP3‐Gal4/UAS‐rpr vs. wDah (mNSC-abl.) flies (Tain et al., 2017). Significance of difference vs. zero was calculated using a two-sided Student’s t-test (*p<0.05,**p<0.01,***p≤0.001). (B) Changes in protein expression of SRP, SRP-receptor (SRP-R) sub-units, TRAM and translocon components. Asterisks indicate Benjamini-Hochberg-corrected significance of the limma moderated t-test (*p≤0.1, **p≤0.01, ***p≤0.001).
Figure 4 with 1 supplement
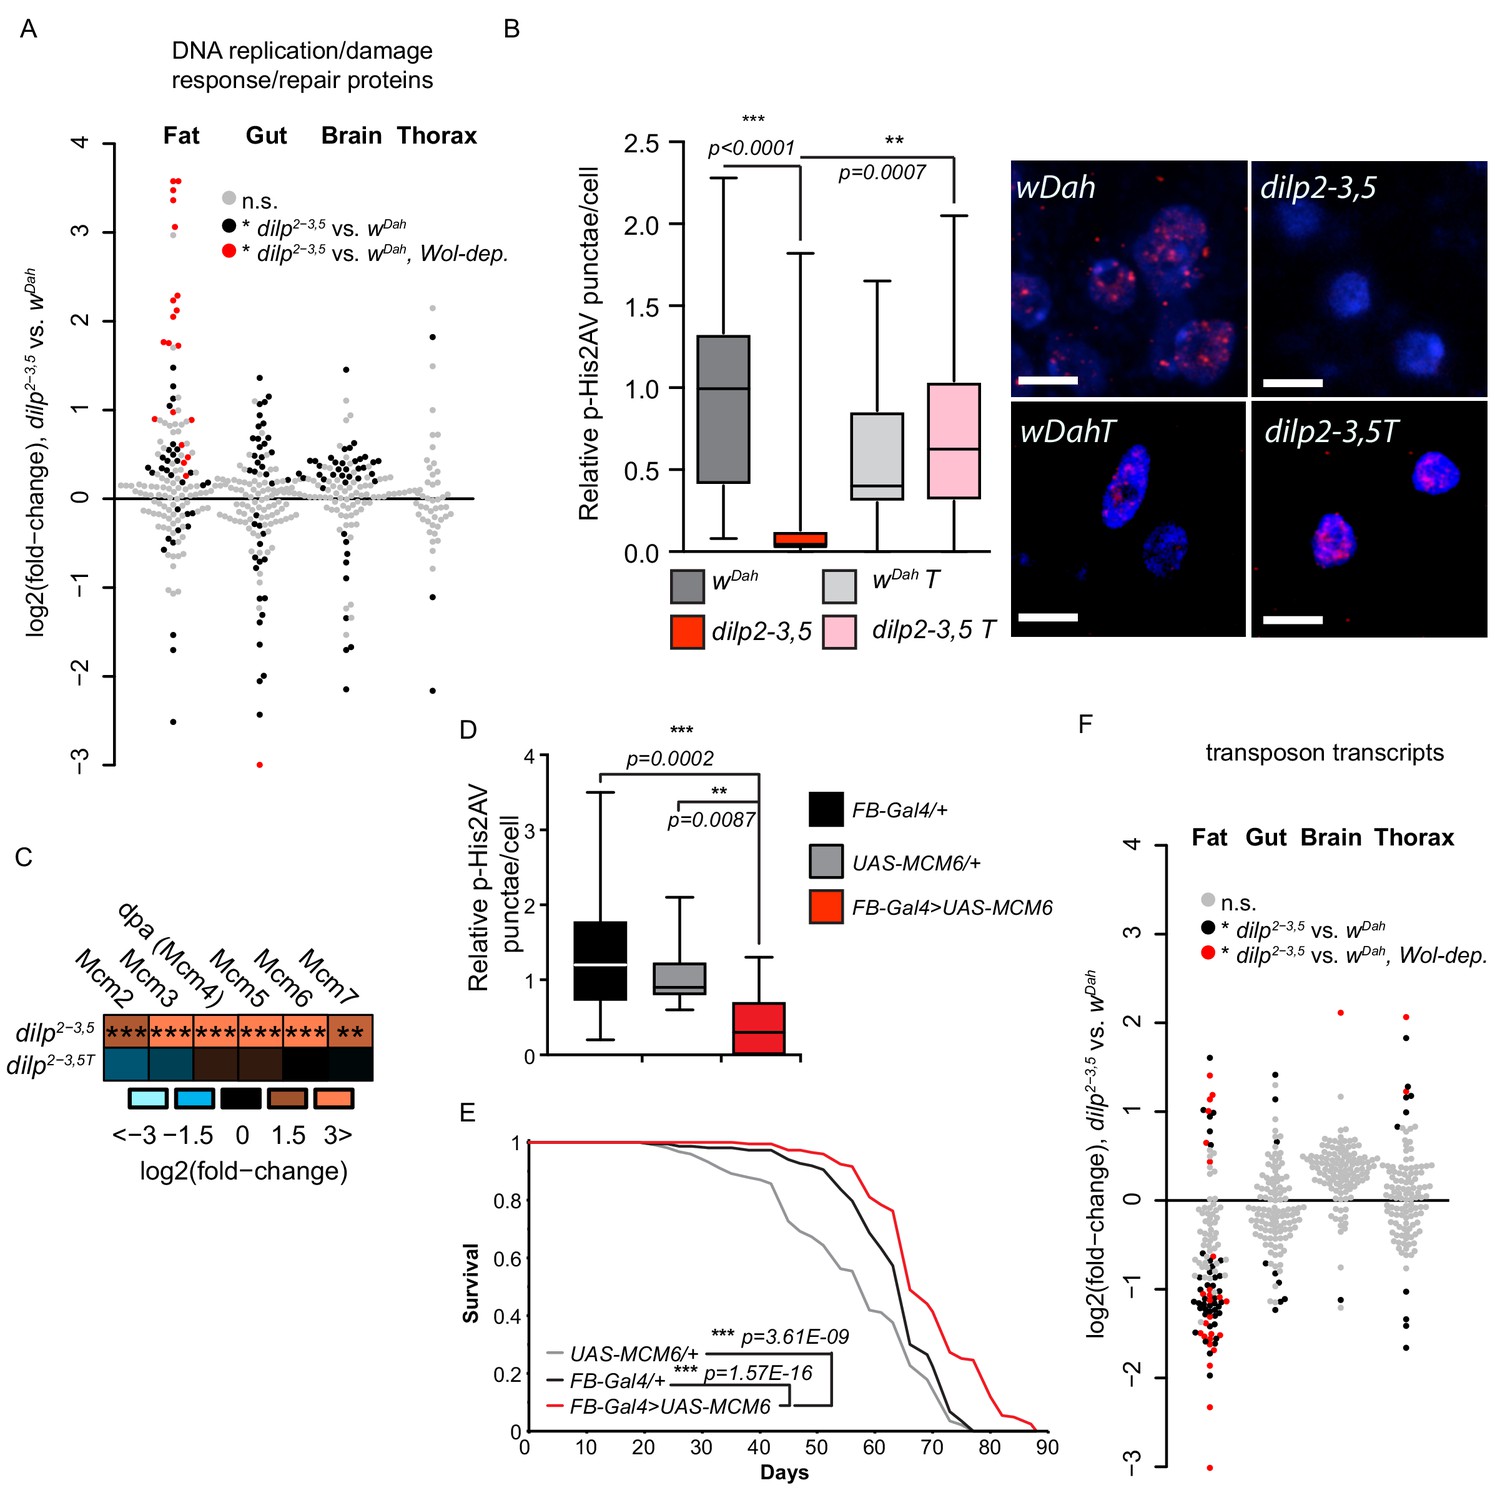
Regulation of DNA damage responses and genome stability in response to reduced IIS.
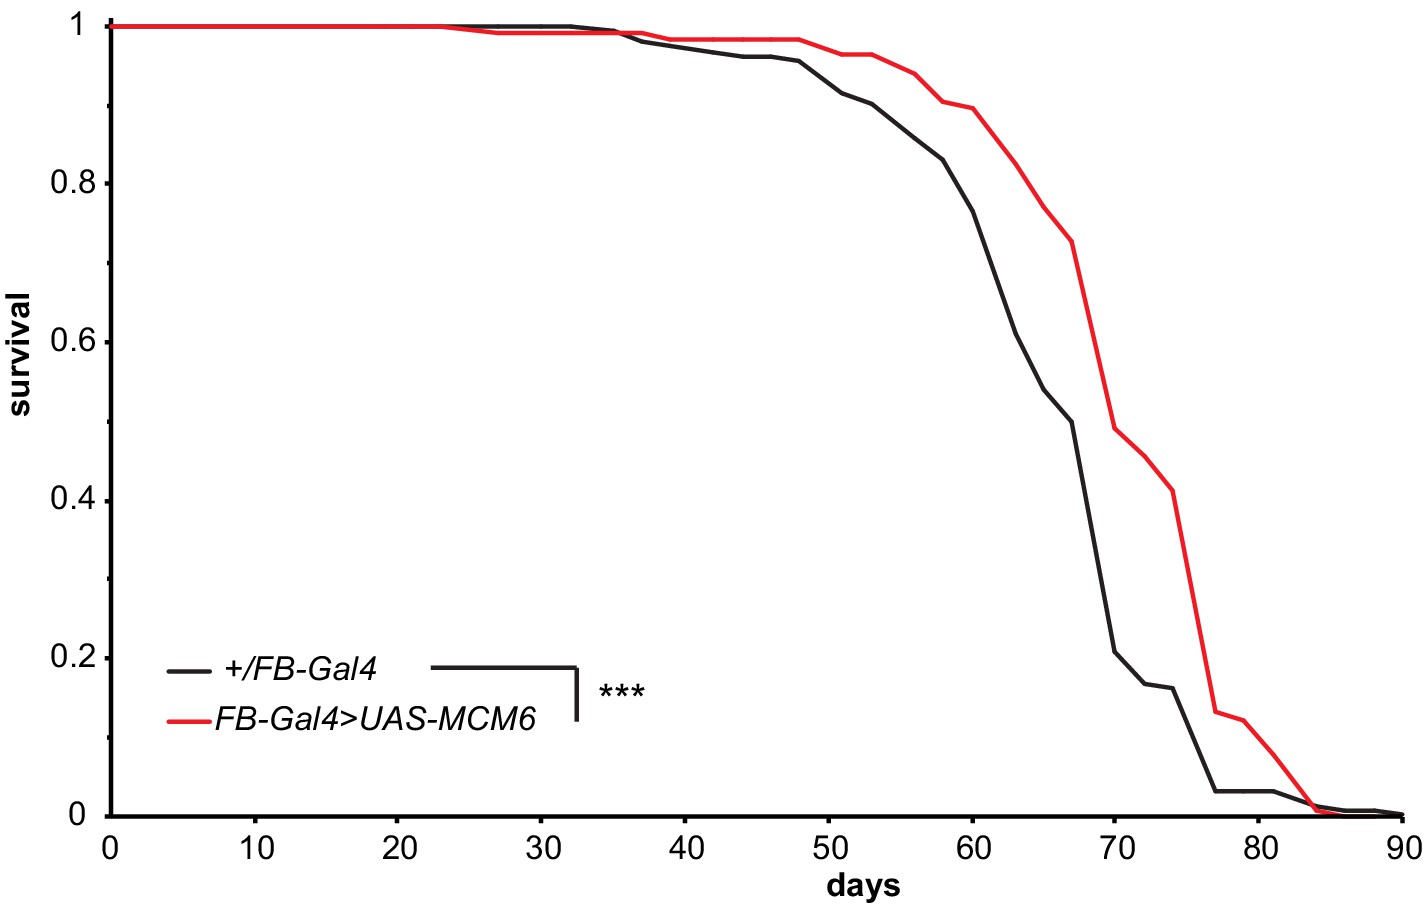
(A) log2-fold change of DNA replication/DNA damage response proteins, dilp2-3,5 vs. wDah (Supplementary file 9). Significantly regulated proteins (black dots), Wolbachia-dependent (red dots regulation (adj. p-value≤0.1)), and unregulated (grey dots). (B) Relative p-His2Av foci per fat body nuclei in aged (60d) of dilp2-3,5 mutants compared to controls (wDah) in the presence (dilp2-3,5) and absence (wDahT and dilp2-3,5T) of Wolbachia (averaged foci/nucleus from independent samples n > 14, scale bar shows 5 μM). (C) Regulation MCM complex proteins, dilp2-3,5 vs. wDah, in the presence and absence (dilp2-3,5T) of Wolbachia. Significance of difference vs. zero was calculated using a two-sided Student’s t-test (*p<0.05, **p<0.01, ***p≤0.001) exact p values shown in Supplementary file 2. (D) Relative p-His2Av foci per fat body nuclei in aged (60d) of flies overexpressing MCM6 specifically in the fat body (FB-Gal4>UAS-MCM6, n = 15) compared to genetic controls (FB-Gal4/+, n = 16 and UAS-MCM6/+, n = 13). Averaged foci/nucleus from independent samples. (E) Survival analysis of flies fat-body-specifically overexpressing MCM6 (FB-Gal4;UAS-MCM6) compared to the UAS-MCM6/+ and FB-Gal4/+ genetic controls. Statistical significance between survival curves was determined by log-rank test (n = 150). (F) Differential expression of transposons, dilp2-3,5 and wDah, in each tissue (fat, gut, brain, thorax) (Supplementary file 10). Significantly changed transposons (black dots), regulated and expression is Wolbachia-dependent (red dots) (adj. p-value≤0.1) and not significantly regulated (grey dots).
Figure 4—figure supplement 1
Replicate lifespans showing tissue-specific expression of UAS-MCM6 or UAS-LManV extends lifespan.
(A) Survival analysis of flies fat-body-specifically overexpressing MCM6 (FB-Gal4;UAS-MCM6) compared to FB-Gal4/+ genetic control. Statistical significance between survival curves was determined by log-rank test (n = 150). ***<0.001.
Figure 5 with 1 supplement
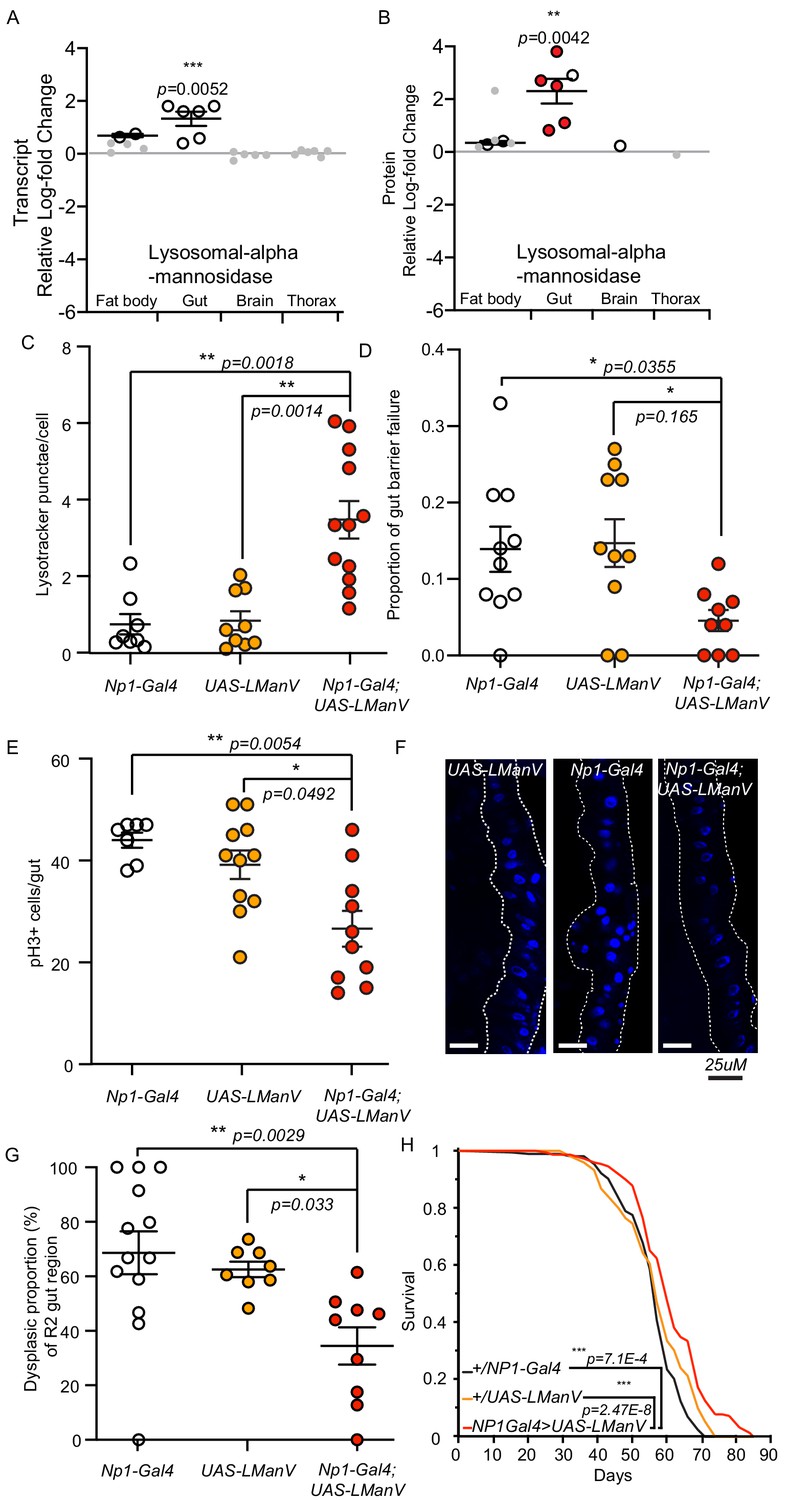
Lysosomal alpha-mannosidase expression is gut-specifically increased in response to reduced IIS, and gut-specific expression is sufficient to maintain gut health and extend lifespan.
(A) Significant (white circles) and non-significant (grey points) tissue-specific log2-fold change of lysosomal alpha-mannosidase transcript (A) and protein (B) expression in dilp2-3,5 vs. wDah. Significantly regulated proteins (white circles), Wolbachia-dependent (red circles) regulation (adj. p-value≤0.1). Directional significance established by one sided Student’s t-test. (C) Quantification of LysoTracker Red stained vacuoles per nucleus in the gut of flies gut-specifically overexpressing LManV (Np1-Gal4;UAS-LManV, n = 12, Red circles) compared to genetic controls (Np1-Gal4/+, n = 8, white circles and UAS-LManV/+, n = 9, orange circles). Chart shows mean and error bars represent S.E.M. Significance determined by Kruskall-Wallace test and Dunn’s multiple comparisons test. (D) Proportion of aged (65d) flies exhibiting gut barrier function failure in response to gut-specific overexpression of LManV (Np1-Gal4;UAS-LManV red circles) compared to genetic controls (Np1-Gal4/+ white circles and UAS-LManV/+ orange circles) (n = 10). Significance determined by Kruskal-Wallis test and Dunn’s multiple comparisons test. (E) Age-related changes in intestinal stem cell proliferation in response to gut-specific overexpression of LManV (Np1-Gal4;UAS-LManV, n = 10, 65d, red circles) compared to genetic controls (Np1-Gal4/+ white circles, n = 7, and UAS-LManV/+ orange circles, n = 11). Significance determined by Kruskal-Wallis test and Dunn’s multiple comparisons test. (F) Representative images and (G) quantification of age-related dysplasia in gut epithelia. Gut-specific overexpression of LManV (Np1-Gal4;UAS-LManV red circles) significantly reduced age-related intestinal dysplasia in 65-day-old flies compared to genetic controls (Np1-Gal4/+ white circles and UAS-LManV/+ orange cirlces). Significance determined by One-way ANOVA and multiple comparisons (Sidak’s). (H) Survival analysis of flies gut-specifically overexpressing LManV (Np1-Gal4;UAS-LManV, red) compared to the UAS-LManV/+ (orange) and Np1-Gal4/+ (black) heterozygous controls. Statistical significance between survival curves was determined by log-rank test (n = 150). **<0.01, *<0.05.
Figure 5—figure supplement 1
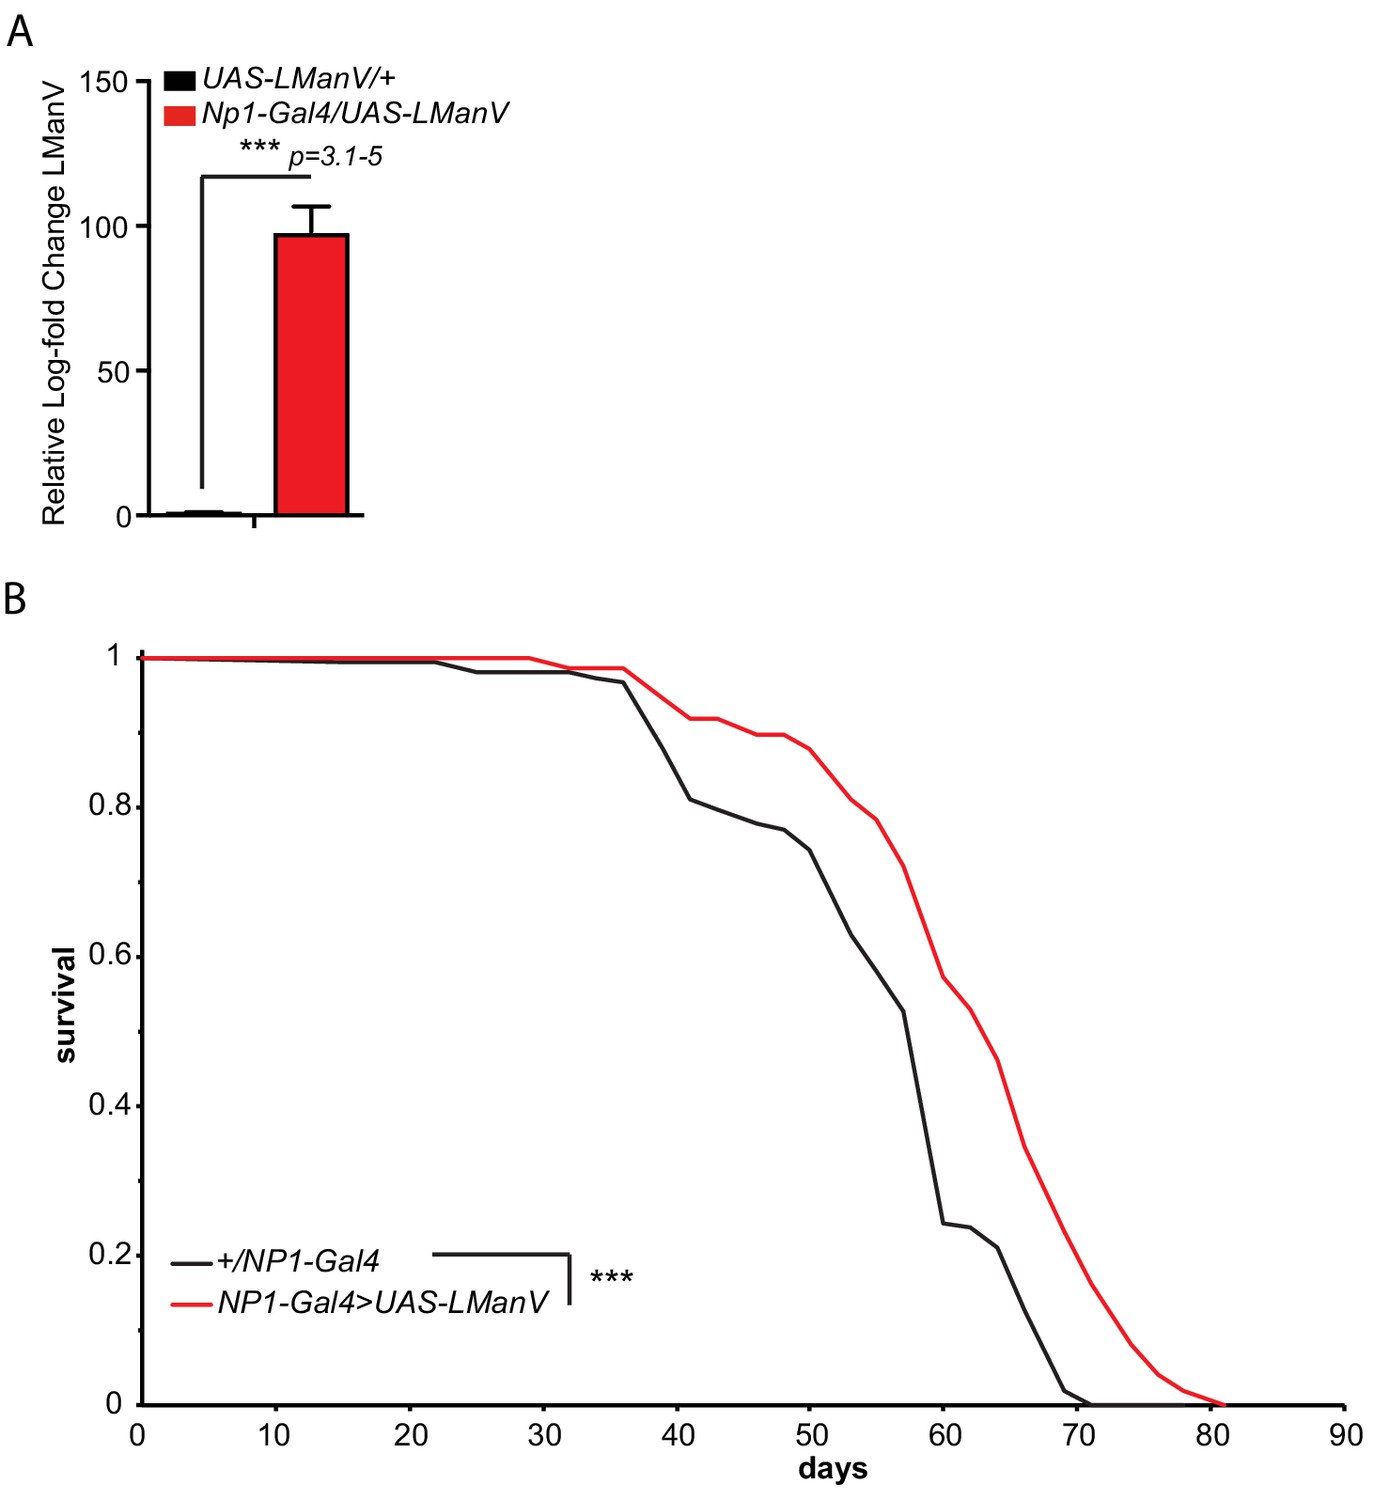
Gut-specific overexpression of LManV increases transcript level.
qRTPCR expression analysis of gut-specific overexpression of LManV in the gut. Gut-specific overexpression of UAS-LManV was driven by NP1-Gal4 (n = 3, ***<0.0001, *<0.05). Significance determined by Student’s t-test. (B) Survival analysis of flies gut-specifically overexpressing LManV (Np1-Gal4;UAS-LManV) compared to Np1-Gal4/+ controls. Statistical significance between survival curves was determined by log-rank test (n = 150). ***<0.001.
Additional files
-
Source data 1
Raw lifespan data.
- https://cdn.elifesciences.org/articles/67275/elife-67275-data1-v2.xlsx
-
Supplementary file 1
Total number of tissue-specific transcripts quantified and all tissue-specific changes in transcript expression between dilp2-3,5 mutants and control (wDah) flies.
Columns listed as: Tissue, Flybase ID, Gene name, base mean (Average transcript expression of the corresponding transcript in the respective tissue), LogFC p-value (Transcript log2(fold-change), dilp2-3,5 vs. wDah), Wolbachia minus adj p-value (Transcript p-value, dilp2-3,5/Wol- vs. wDah/Wol-), Wolbachia minus LogFC (Transcript FDR, dilp2-3,5/Wol- vs. wDah/Wol-). Wol+/- denotes the presence (+) or absence (-) of Wolbachia in formulae.
- https://cdn.elifesciences.org/articles/67275/elife-67275-supp1-v2.xlsb
-
Supplementary file 2
Total number of tissue-specific proteins quantified and all tissue-specific changes in protein expression between dilp2-3,5 mutants and control (wDah) flies.
Columns listed as: Tissue (Thorax, gut, brain or fat body), Uniprot ID, Flybase ID, Symbol (Gene), Entrez ID, Protein Wolbachia dependent expression (True/False), Protein Wolbachia independent expression (True/False), protein average expression (Label-free quantification intensity), protein dilp logFC (dilp2-3,5 v. wDah), protein dilp p-value (dilp2-3,5 v. wDah), protein dilp FDR (dilp2-3,5 v. wDah), Protein interaction p-value, Protein interaction FDR, RNA interaction p-value, protein TOST. Genotypes denoted as wDah and dilp (2-3,5) with Wolbachia and wDahT and dilpT (2-3,5) without Wolbachia.
- https://cdn.elifesciences.org/articles/67275/elife-67275-supp2-v2.xlsx
-
Supplementary file 3
Significant differentially expressed (dilp2-3,5 vs wDah) transcript/protein pairs from fat, gut, brain, or thorax, in one of four quadrants shown in Figure 1 in the presence of Wolbachia and Appendix 2 in the absence of Wolbachia.
Columns listed as: Tissue, Quadrant (Quadrants by direction of log2(fold-change): I (protein+;transcript+), II (protein−;transcript+), III (protein−;transcript−), and IV (protein+;transcript−)), Protein flybase ID, protein symbol (Gene name), protein entrez ID, protein avg expr (Average LFQ intensity of this protein in all samples in the respective tissue), RNA avg expr (Average transcript expression of the corresponding transcript in the respective tissue), protein p-value (dilp2-3,5 v. wDah), RNA p-value (dilp2-3,5 v. wDah), Protein adj p-value (dilp2-3,5 v. wDah FDR), Protein logFC (dilp2-3,5 v. wDah), RNA LogFC (dilp2-3,5 v. wDah), opposite (Are protein and transcript changed in opposite direction?), Wolbachia dependence (Does the protein change in dilp2-3,5 vs wDah depend on Wolbachia status?), wolbachia independence (Is the protein change in dilp2-3,5 vs wDah independent of Wolbachia status?), RNA Wolbachia dependence (Does the transcript change in dilp2-3,5 vs wDah depend on Wolbachia status?), interaction p-value (Protein p-value, interaction term (dilp2-3,5 vs. wDah ~ Wol+ vs. Wol-)), interaction adj p-value (Protein FDR, interaction term (dilp2-3,5 vs. wDah ~ Wol+ vs. Wol-)), dilpT p-value (Protein p-value, dilp2-3,5/Wol- vs. wDah/Wol-), dilpT adj p-value (Protein FDR, dilp2-3,5/Wol- vs. wDah/Wol-), protein LogFC (Protein log2(fold-change), dilp2-3,5/Wol- vs. wDah/Wol-), TOST p-value (Protein p-value, two-one-sided-t-test of equivalence, interaction term (dilp2-3,5 vs. wDah ~ Wol+ vs. Wol-)), TOST adj p-value (Protein p-value, two-one-sided-t-test of equivalence, interaction term (dilp2-3,5 vs. wDah ~ Wol+ vs. Wol-)). Wol+/- denotes the presence (+) or absence (-) of Wolbachia in formulae. Genotypes denoted as wDah and dilp (2-3,5) with Wolbachia and wDahT and dilpT (2-3,5) without Wolbachia.
- https://cdn.elifesciences.org/articles/67275/elife-67275-supp3-v2.xlsx
-
Supplementary file 4
Significant differentially expressed (dilp2-3,5 vs wDah) protein/transcript pairs from fat, gut, brain, or thorax, in one of four quadrants shown in Figure 1 in the presence of Wolbachia and Appendix 2 in the absence of Wolbachia.
Columns listed as: Tissue, Quadrant (Quadrants by direction of log2(fold-change): I (protein+;transcript+), II (protein−;transcript+), III (protein−;transcript−), and IV (protein+;transcript−)), Protein flybase ID, protein symbol (Gene name), protein entrez ID, protein avg expr (Average LFQ intensity of this protein in all samples in the respective tissue), RNA avg expr (Average transcript expression of the corresponding transcript in the respective tissue), protein p-value (dilp2-3,5 v. wDah), RNA p-value (dilp2-3,5 v. wDah), Protein adj p-value (dilp2-3,5 v. wDah FDR), Protein logFC (dilp2-3,5 v. wDah), RNA LogFC (dilp2-3,5 v. wDah), opposite (Are protein and transcript changed in opposite direction?), Wolbachia dependence (Does the protein change in dilp2-3,5 vs wDah depend on Wolbachia status?), Wolbachia independence (Is the protein change in dilp2-3,5 vs wDah independent of Wolbachia status?), RNA Wolbachia dependence (Does the transcript change in dilp2-3,5 vs wDah depend on Wolbachia status?), interaction p-value (Protein p-value, interaction term (dilp2-3,5 vs. wDah ~ Wol+ vs. Wol-)), interaction adj p-value (Protein FDR, interaction term (dilp2-3,5 vs. wDah ~ Wol+ vs. Wol-)), dilpT p-value (Protein p-value, dilp2-3,5/Wol- vs. wDah/Wol-), dilpT adj p-value (Protein FDR, dilp2-3,5/Wol- vs. wDah/Wol-), protein LogFC (Protein log2(fold-change), dilp2-3,5/Wol- vs. wDah/Wol-), TOST P-value (Protein p-value, two-one-sided-t-test of equivalence, interaction term (dilp2-3,5 vs. wDah ~ Wol+ vs. Wol-)), TOST adj p-value (Protein p-value, two-one-sided-t-test of equivalence, interaction term (dilp2-3,5 vs. wDah ~ Wol+ vs. Wol-)). Wol+/- denotes the presence (+) or absence (-) of Wolbachia in formulae. Genotypes denoted as wDah and dilp (2-3,5) with Wolbachia and wDahT and dilpT (2-3,5) without Wolbachia.
- https://cdn.elifesciences.org/articles/67275/elife-67275-supp4-v2.xlsx
-
Supplementary file 5
GO enrichment analysis of significant differentially expressed (dilp2-3,5 vs wDah) protein/transcript pairs from fat, gut, brain, or thorax, in one of four quadrants shown in Figure 1 in the presence of Wolbachia.
Columns listed as: Tissue, Quadrant (Quadrants by direction of log2(fold-change): I (protein+;transcript+), II (protein−;transcript+), III (protein−;transcript−), and IV (protein+;transcript−)), Protein flybase ID, protein symbol (Gene name), protein entrez ID, protein avg expr (Average LFQ intensity of this protein in all samples in the respective tissue), RNA avg expr (Average transcript expression of the corresponding transcript in the respective tissue), protein p-value (dilp2-3,5 v. wDah), RNA p-value (dilp2-3,5 v. wDah), Protein adj p-value (dilp2-3,5 v. wDah FDR), Protein logFC (dilp2-3,5 v. wDah), RNA LogFC (dilp2-3,5 v. wDah), opposite (Are protein and transcript changed in opposite direction?), Wolbachia dependence (Does the protein change in dilp2-3,5 vs wDah depend on Wolbachia status?), Wolbachia independence (Is the protein change in dilp2-3,5 vs wDah independent of Wolbachia status?), RNA Wolbachia dependence (Does the transcript change in dilp2-3,5 vs wDah depend on Wolbachia status?), interaction p-value (Protein p-value, interaction term (dilp2-3,5 vs. wDah ~ Wol+ vs. Wol-)), interaction adj p-value (Protein FDR, interaction term (dilp2-3,5 vs. wDah ~ Wol+ vs. Wol-)), dilpT p-value (Protein p-value, dilp2-3,5/Wol- vs. wDah/Wol-), dilpT adj p-value (Protein FDR, dilp2-3,5/Wol- vs. wDah/Wol-), protein LogFC (Protein log2(fold-change), dilp2-3,5/Wol- vs. wDah/Wol-), TOST p-value (Protein P-value, two-one-sided-t-test of equivalence, interaction term (dilp2-3,5 vs. wDah ~ Wol+ vs. Wol-)), TOST adj p-value (Protein p-value, two-one-sided-t-test of equivalence, interaction term (dilp2-3,5 vs. wDah ~ Wol+ vs. Wol-)). Wol+/- denotes the presence (+) or absence (-) of Wolbachia in formulae. Genotypes denoted as wDah and dilp (2-3,5) with Wolbachia and wDahT and dilpT (2-3,5) without Wolbachia.
- https://cdn.elifesciences.org/articles/67275/elife-67275-supp5-v2.xlsx
-
Supplementary file 6
GO enrichment analysis of significant differentially expressed (dilp2-3,5 vs wDah Wolbachia-dependent changes) proteins and transcripts.
Each sheet shows tissue-specific (fat, gut, brain, or thorax) enrichments.
- https://cdn.elifesciences.org/articles/67275/elife-67275-supp6-v2.xlsx
-
Supplementary file 7
Network propagation scores and cluster assignments (Figure 2).
Columns listed as: Flybase ID, Symbol (Gene), Cluster (related to Figure 2), abl (regulated in the mNSC-ablation model [Tain et al., 2017]), dilp (regulated in dilp2-3,5 v wDah), int (integrated responses between regulation in mNSC-ablation and dilp2-3,5 models).
- https://cdn.elifesciences.org/articles/67275/elife-67275-supp7-v2.xlsx
-
Supplementary file 8
GO enrichment analysis results of network propagation clusters (Figure 2).
Columns listed as: Cluster (Relates to Figure 2), Terms in Cluster (GO Terms significantly Enriched in a specific cluster), GO ID, Term, Ontology (BP, MF, CC), Annoatated (#genes annotated with the term in the tissue-specific background), Significant (#genes significant annotated with the term in the tissue-specific background), Expected (expected # of significant genes with the term in the tissue-specific background), Enrichment (Enrichment of the observed over the expected number of significant genes), Log2 of Enrichment, Fisher (p-value of enrichment), Primary Fisher adj (adjusted p-value of enrichment), Genes (Names of significant genes annotated with the term), Genes in secondary.
- https://cdn.elifesciences.org/articles/67275/elife-67275-supp8-v2.xlsx
-
Supplementary file 9
Log-fold changes of significant differentially expressed (dilp2-3,5 vs wDah) protein associated with the regulation of DNA replication, DNA damage/ repair responses and related functions.
LogFC, p-value, Fisher adj (adjusted P-value), Flybase ID, and Gene symbol (Name) are shown.
- https://cdn.elifesciences.org/articles/67275/elife-67275-supp9-v2.xlsx
-
Supplementary file 10
Analysis of transposon differential expression in dilp2-3,5 flies (with/without Wolbachia) vs. wDah.
Columns listed in summary tab.
- https://cdn.elifesciences.org/articles/67275/elife-67275-supp10-v2.xlsx
-
Transparent reporting form
- https://cdn.elifesciences.org/articles/67275/elife-67275-transrepform-v2.docx
Download links
A two-part list of links to download the article, or parts of the article, in various formats.
Downloads (link to download the article as PDF)
Open citations (links to open the citations from this article in various online reference manager services)
Cite this article (links to download the citations from this article in formats compatible with various reference manager tools)
Tissue-specific modulation of gene expression in response to lowered insulin signalling in Drosophila
eLife 10:e67275.
https://doi.org/10.7554/eLife.67275


