Drosophila STING protein has a role in lipid metabolism
- Department of Biochemistry and Molecular Genetics, University of Alabama at Birmingham, School of Medicine, United States
Figures
Figure 1 with 3 supplements

Drosophila STING mutants are susceptible to starvation and oxidative stress but have normal life span.
(A) Generation of the Drosophila STING deletion mutant. dSTING deletion mutant was generated by imprecise excision of P-element P{EPgy2}STINGEY06491. dSTINGΔ allele contains a deletion of 589 base pairs including start codon, first exon, and part of the second exon of dSTING. Exons are shown as pink-colored rectangles. The position of the P-element insertion is indicated by the red triangle. (B) Starvation stress resistance of males and females. Five-day-old flies were kept on PBS only and percentages of surviving flies were counted every 12 hr. (C) Oxidative stress resistance of males and females. Five-day-old flies were kept on food supplemented with 5% hydrogen peroxide and percentages of surviving flies were counted every 12 hr. (D) Lifespan of males and females. Flies were kept on regular food and percentages of surviving flies were counted. (B–D) Genotypes used were: control flies – w1118, flies with dSTING deletion – dSTINGΔ, genetic rescue – dSTINGΔ;GFP-dSTING. Percentages of surviving flies at each time point are shown. The number of flies analyzed is shown in chart legend for each genotype. Log-rank test yielded p<0.001 for all pairwise comparisons except for (C): w1118 vs dSTINGΔ;GFP-dSTING females under oxidative stress showed no statistical significance (p=0.121).
-
Figure 1—source data 1
Source file for survival curves.
- https://cdn.elifesciences.org/articles/67358/elife-67358-fig1-data1-v3.xlsx
Figure 1—figure supplement 1
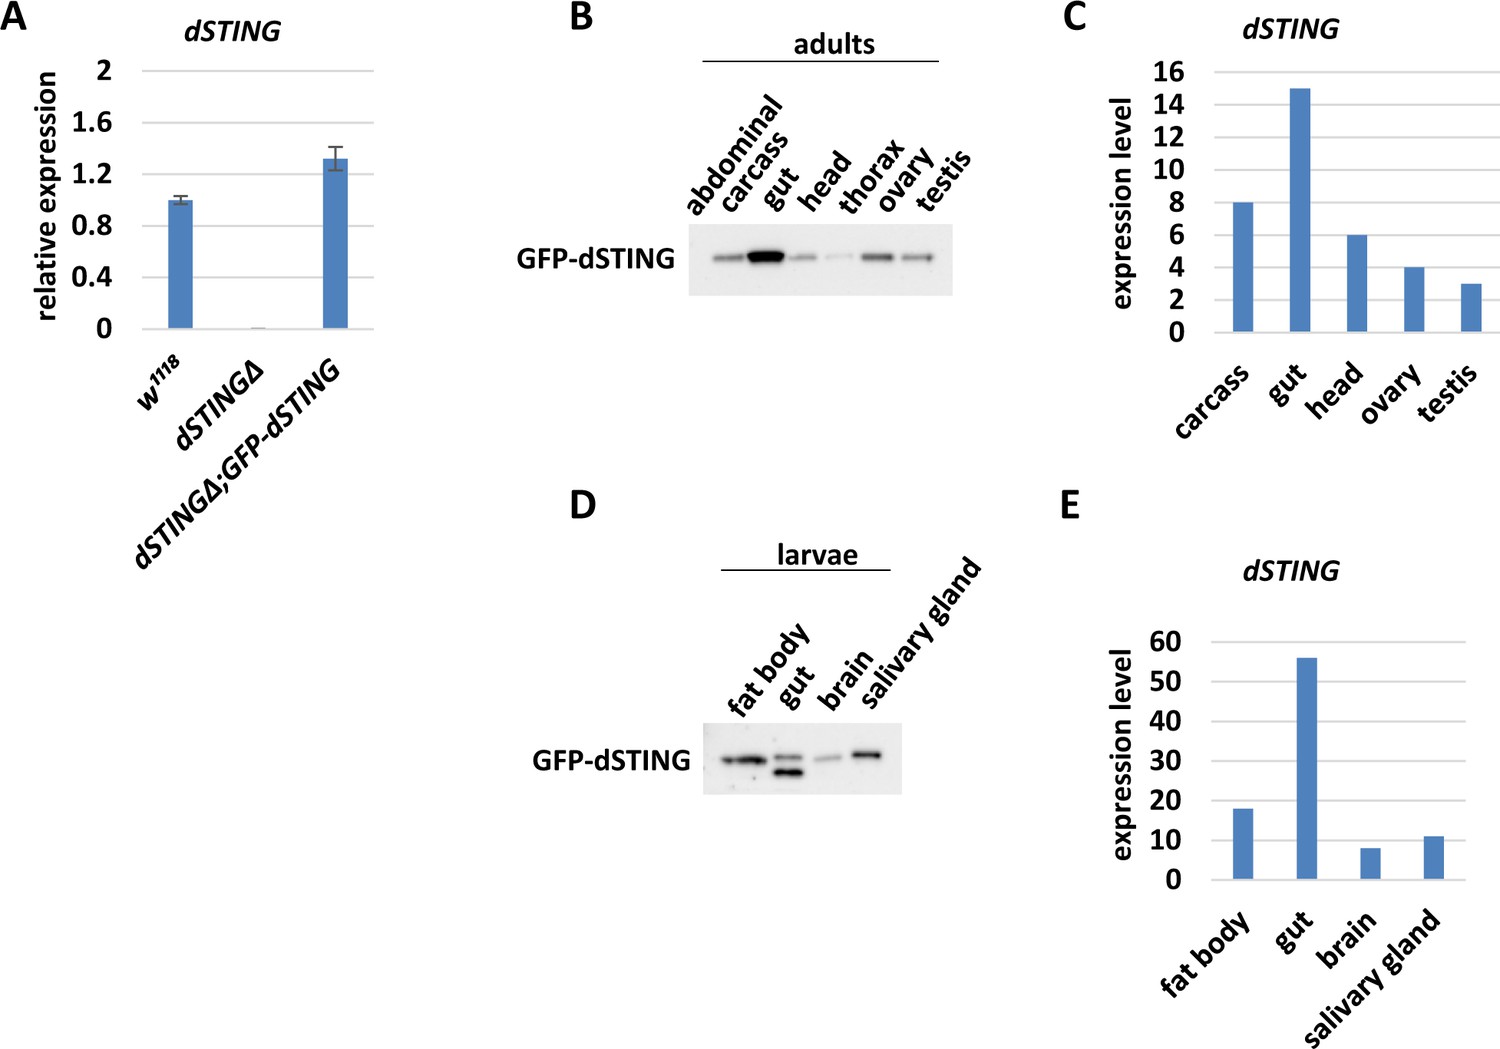
GFP-tagged Drosophila STING expression in different tissues.
(A) Transcription of dSTING in wild type (w1118), mutant (dSTINGΔ), or ‘rescued’ (dSTINGΔ;GFP-dSTING) flies was measured by RT-qPCR. The bars indicate dSTING relative expression levels. Values were normalized to the wild type (w1118). (B) Expression of GFP-tagged Drosophila STING (under the native dSTING promoter) in 5 days old adult organs and tissues of dSTINGΔ;GFP-dSTING flies. Ten micrograms of extract was loaded per well. GFP-dSTING was detected using anti-GFP antibody. (C) modENCODE tissue expression data for adult tissues (Brown et al., 2014). (D) Expression of GFP-tagged Drosophila STING (under the native dSTING promoter) in dSTINGΔ;GFP-dSTING third-instar larvae organs and tissues. Ten micrograms of extract was loaded per well. GFP-dSTING was detected using anti-GFP antibody. In gut samples, GFP-dSTING was detected as a double band, probably reflecting the proteolysis by gut enzymes. (E) modENCODE tissue expression data for larval tissues (Brown et al., 2014).
-
Figure 1—figure supplement 1—source data 1
Source file for GFP-dSTING expression.
- https://cdn.elifesciences.org/articles/67358/elife-67358-fig1-figsupp1-data1-v3.pdf
-
Figure 1—figure supplement 1—source data 2
Source file for GFP-dSTING expression (adult tissues).
- https://cdn.elifesciences.org/articles/67358/elife-67358-fig1-figsupp1-data2-v3.tif
-
Figure 1—figure supplement 1—source data 3
Source file for GFP-dSTING expression (larval tissues).
- https://cdn.elifesciences.org/articles/67358/elife-67358-fig1-figsupp1-data3-v3.tif
Figure 1—figure supplement 2
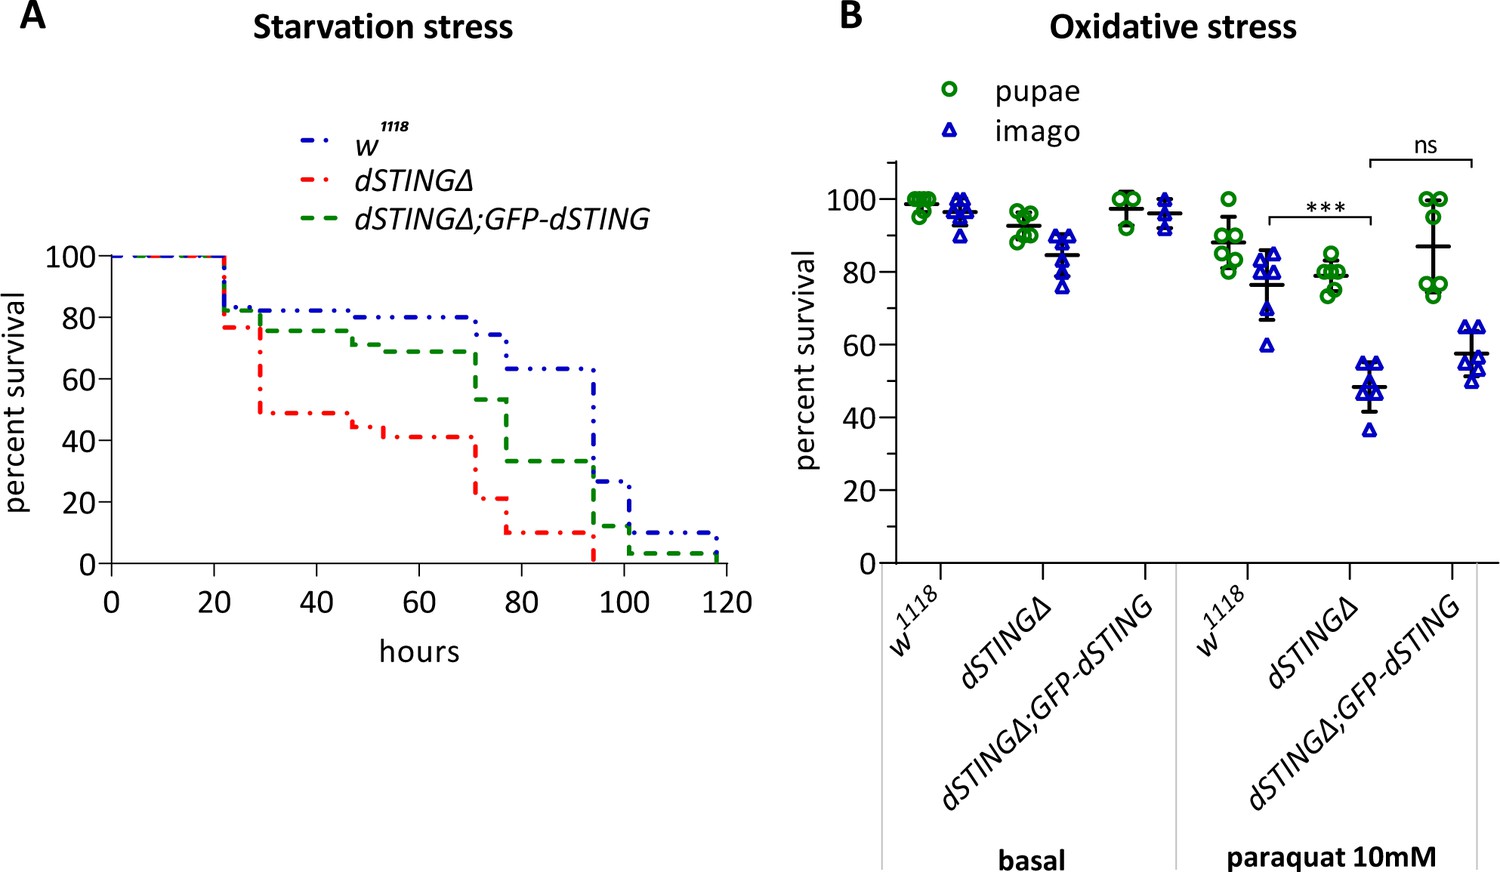
Drosophila STING mutant larvae are susceptible to starvation and oxidative stress.
(A) Starvation stress resistance. Late second-instar larvae were transferred to media containing 1% agarose in water and surviving larvae were counted. Total of 90 larvae were analyzed for each genotype. Log-rank test yielded p<0.01 for all paired comparisons. (B) Oxidative stress resistance. Early third-instar larvae were transferred to the media containing regular food only or regular food supplemented with 10 mM paraquat. Percentages of pupae formed and imago eclosed are shown on the graph. Less imago eclosed in dSTINGΔ mutants as compared to the control (w1118) under oxidative stress conditions. One-way ANOVA with Tukey’s post-hoc test. ***p<0.001, ns indicates statistically non-significant. Genotypes used were: control flies – w1118, flies with dSTING deletion – dSTINGΔ, genetic rescue – dSTINGΔ;GFP-dSTING.
Figure 1—figure supplement 3
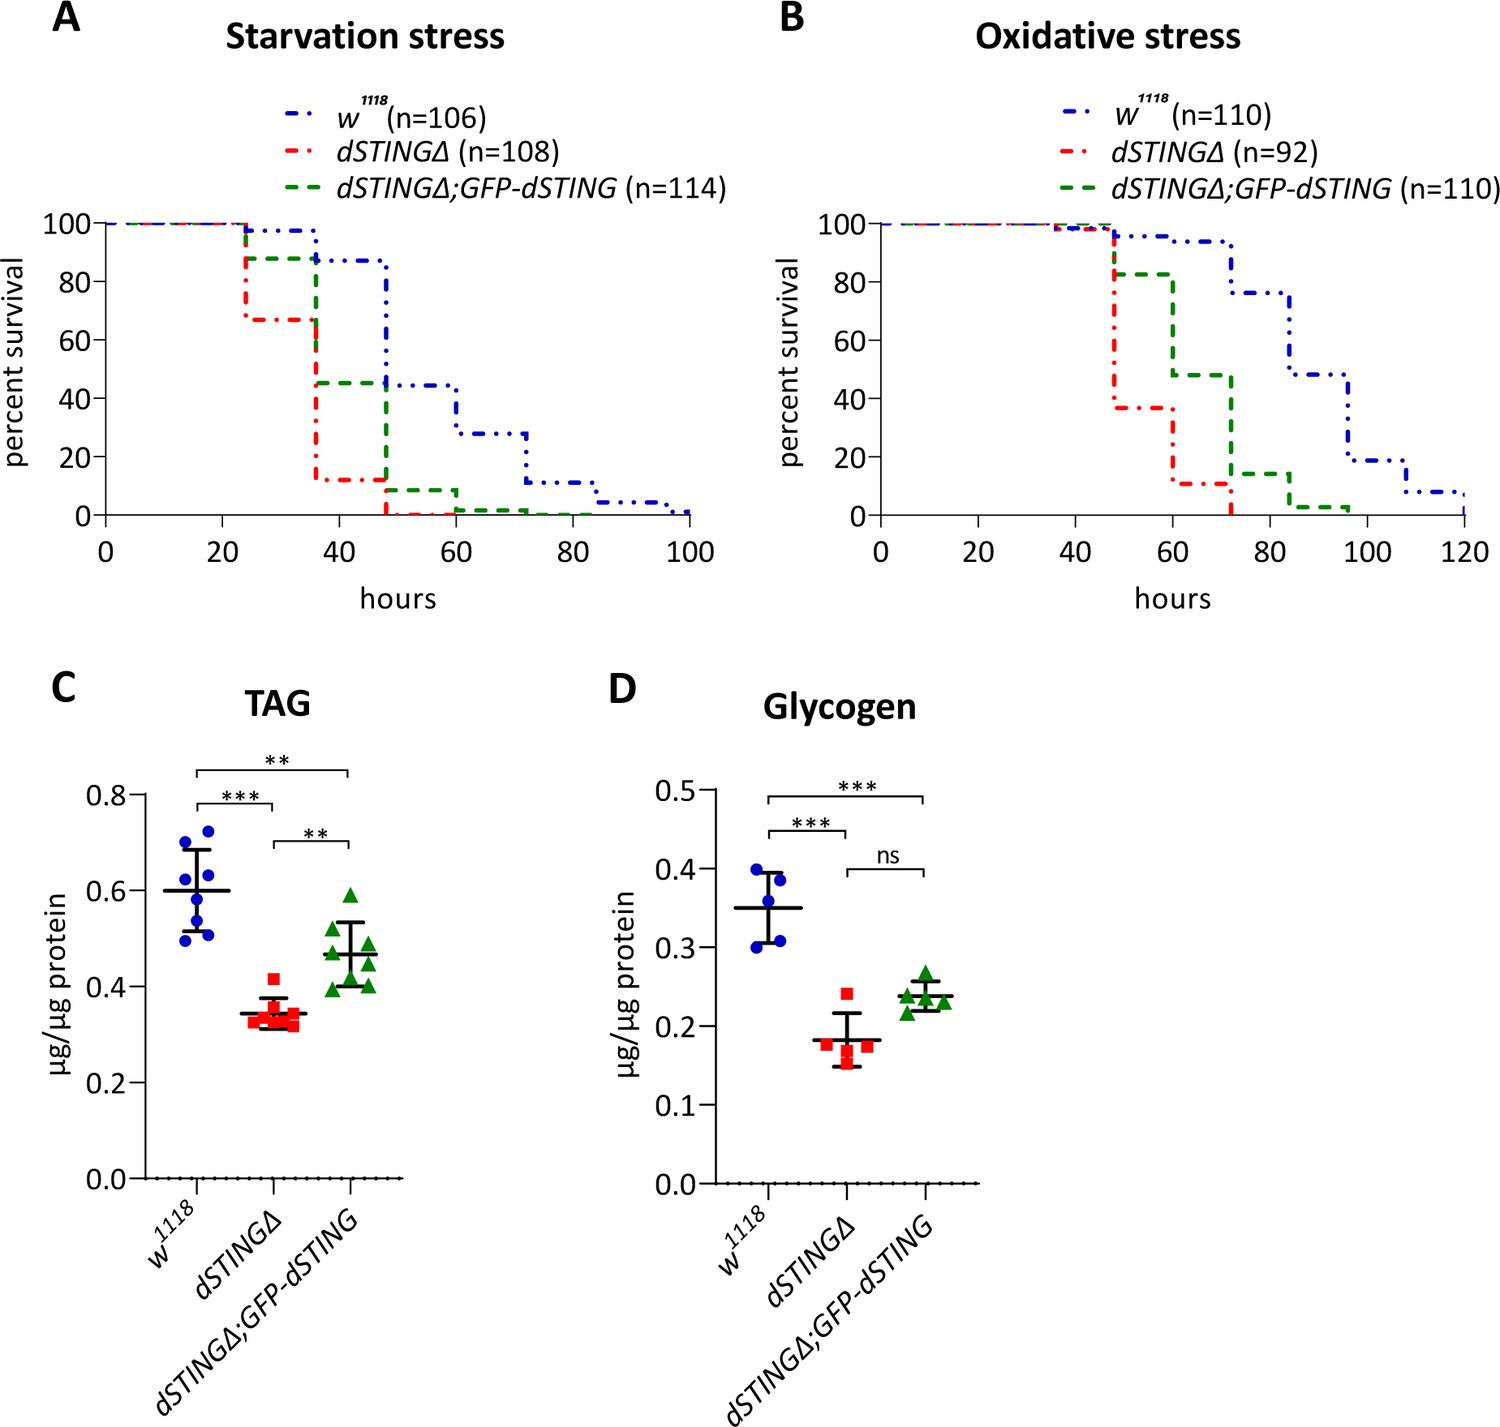
Drosophila STING mutants are susceptible to starvation and oxidative stress and have decreased TAG and glycogen levels under axenic condition.
(A) Starvation stress resistance of axenic males. Five-day-old male flies were kept on PBS only and surviving flies were counted every 12 hr. (B) Oxidative stress resistance of axenic males. Five-day-old male flies were kept on food supplemented with 5% hydrogen peroxide and surviving flies were counted every 12 hr. Percentages of surviving flies at each time point are shown. The number of flies analyzed is shown in chart legend for each genotype. Log-rank test yielded p<0.001 for all pairwise comparisons. (C) TAG and (D) glycogen levels were measured in the total body of fed 5-day-old axenic males. Levels of metabolites are shown per µg of total protein. The number of experiments for each genotype is indicated. Data are represented as mean ± SD. One-way ANOVA with Tukey’s post hoc test. **p<0.01, ***p<0.001, ns indicates statistically non-significant. Genotypes used were: control flies – w1118, flies with dSTING deletion – dSTINGΔ, genetic rescue – dSTINGΔ;GFP-dSTING.
Figure 2 with 3 supplements

Storage metabolites are significantly decreased in Drosophila STING mutants.
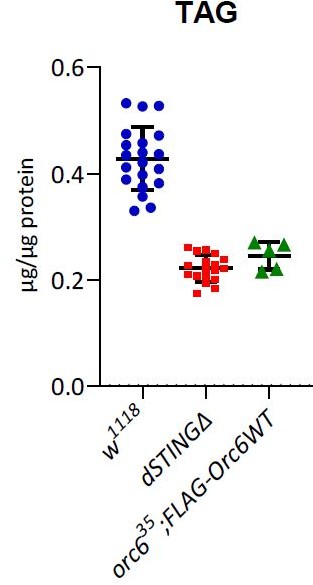
(A–D) Metabolites levels in fed or 24 hr starved 5-day-old males. TAG (A) and glycogen (B) levels were measured in the total body. Trehalose (C) and glucose (D) levels were measured in the hemolymph. Levels of metabolites are shown per µg of total protein. Data are represented as mean ± SD. One-way ANOVA with Tukey’s post hoc test. *p<0.05, **p<0.01, ***p<0.001, ns indicates statistically non-significant. (E, F) Staining of male adult tissues for lipid content. Fat bodies (E) or midguts (F) were stained with Nile Red (red) that labels lipid droplets. Nuclei were stained with DAPI (blue). Scale bar 20 µm. (E’, F’) Quantification of surface area occupied by lipid droplets in fat bodies (E’) and midguts (F’). Values are normalized to the wild type (w1118). Data are represented as mean ± SD. One-way ANOVA with Tukey’s post hoc test. ***p<0.001, ns indicates statistically non-significant. Genotypes used were: control flies – w1118, flies with dSTING deletion – dSTINGΔ, genetic rescue – dSTINGΔ;GFP-dSTING.
-
Figure 2—source data 1
Source file for metabolite levels.
- https://cdn.elifesciences.org/articles/67358/elife-67358-fig2-data1-v3.xlsx
Figure 2—figure supplement 1
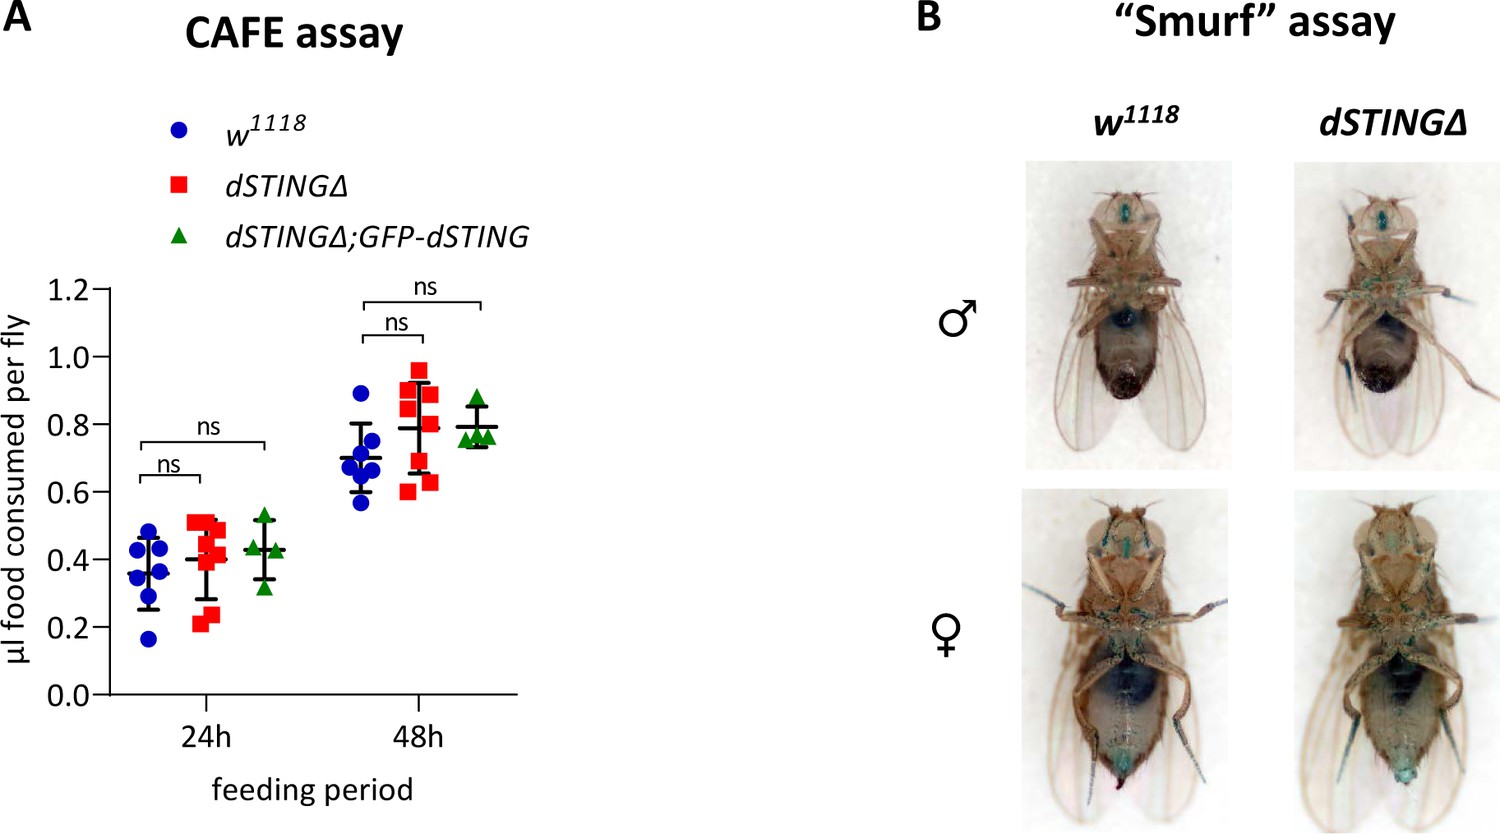
Food ingestion is not compromised in Drosophila STING mutant flies.
(A) Capillary feeder (CAFE) assay. The amount of food consumed by each fly is shown during time period indicated. The number of experiments for each genotype is indicated. Data are represented as mean ± SD. One-way ANOVA with Tukey’s post hoc test. **p<0.01, ***p<0.001, ns indicates statistically non-significant. (B) “Smurf” assay. Flies were kept on food containing blue dye for 12 hr and then checked for the presence of the dye outside of the digestive tract which would mean the loss of gut integrity. In both wild-type and dSTINGΔ mutants, blue dye is observed only in digestive tract suggesting no defects in intestinal permeability. Genotypes used were: control flies – w1118, flies with dSTING deletion – dSTINGΔ, genetic rescue – dSTINGΔ;GFP-dSTING.
Figure 2—figure supplement 2
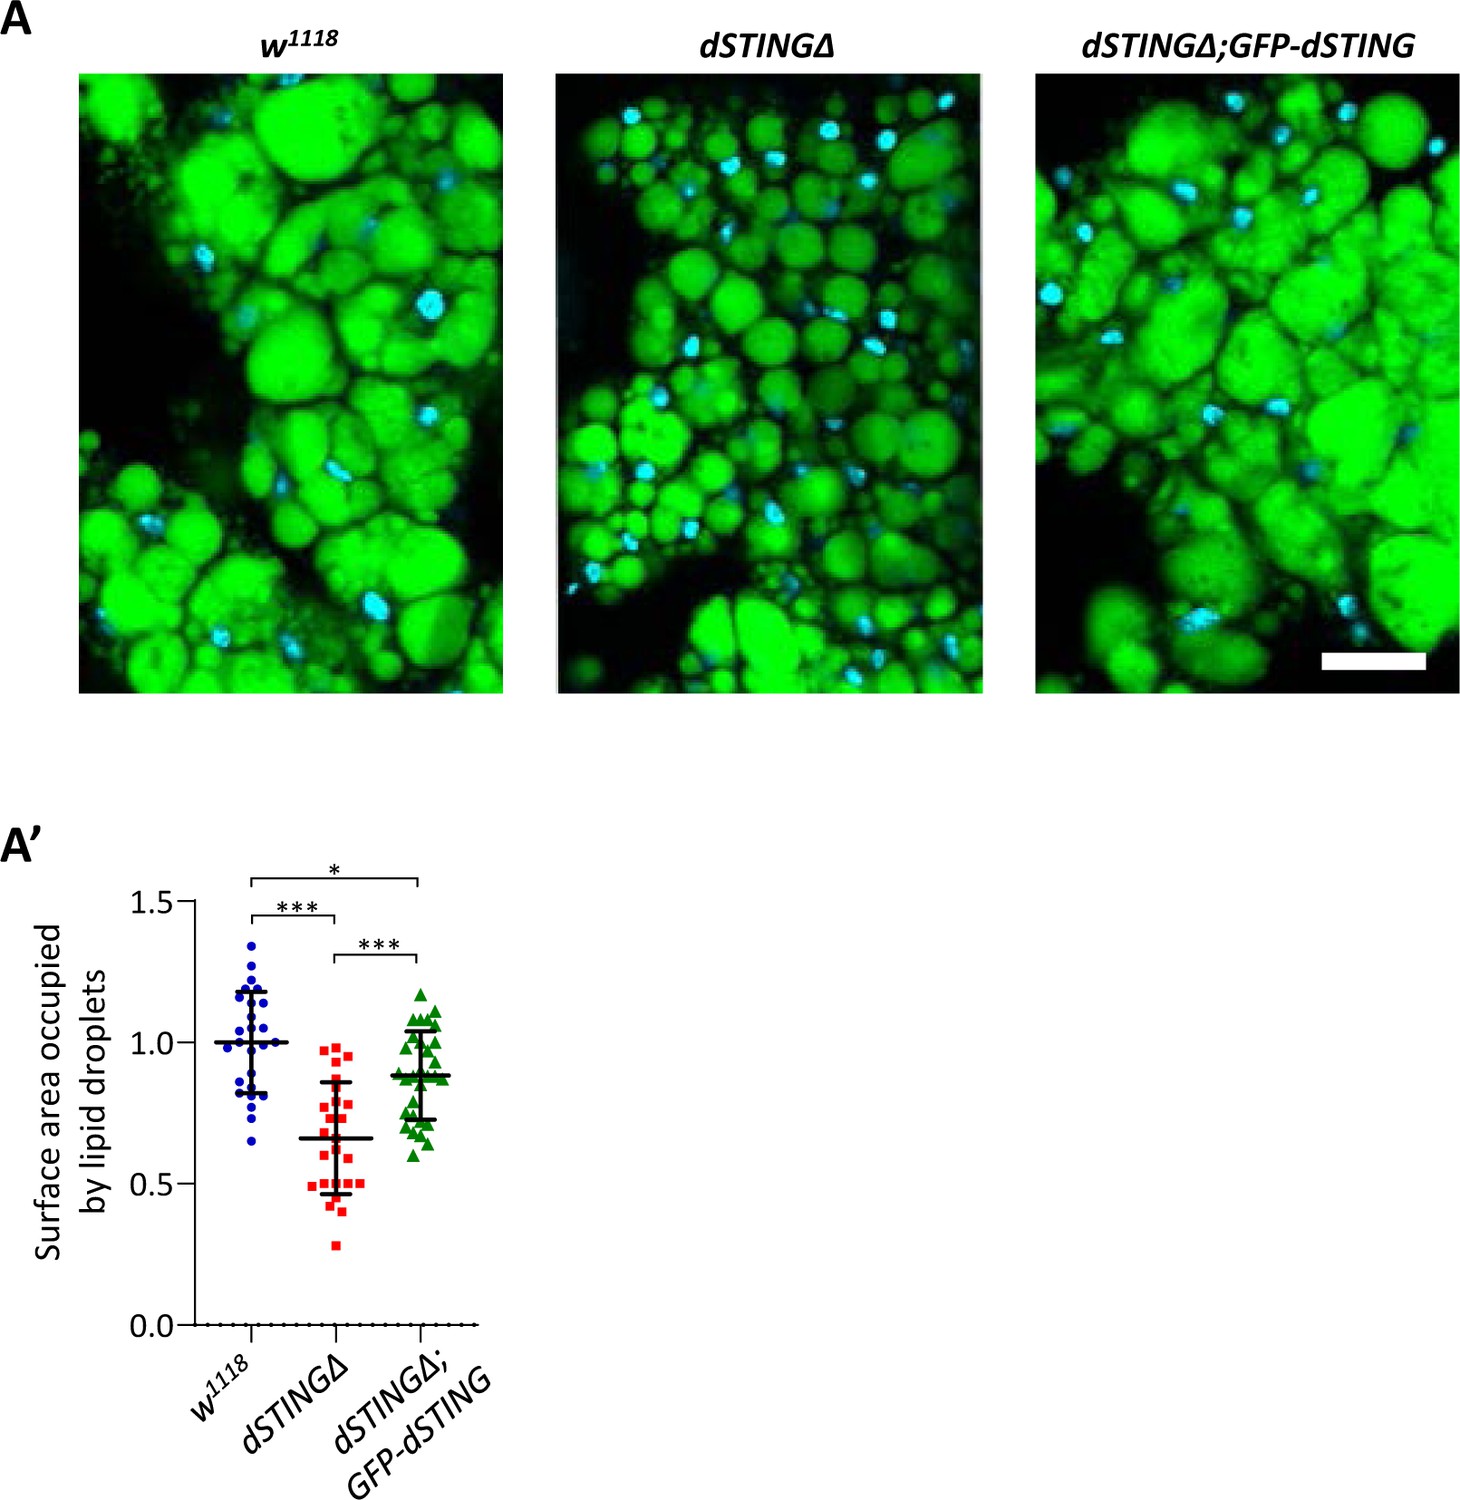
Drosophila STING mutants have reduced TAG storage in fat body.
(A) Fat bodies of fed 5-day-old adults were stained with LipidTox (green) and DAPI (blue). Scale bar 20 µm. (A’) Quantification of lipid droplets area in fat bodies. Values are normalized to wild type (w1118). Data are represented as mean ± SD. Number of samples analyzed is shown for each genotype. One-way ANOVA with Tukey’s post-hoc test. ***p<0.001, *p<0.05. Genotypes used were: control flies – w1118, flies with dSTING deletion – dSTINGΔ, genetic rescue – dSTINGΔ;GFP-dSTING.
Figure 2—figure supplement 3
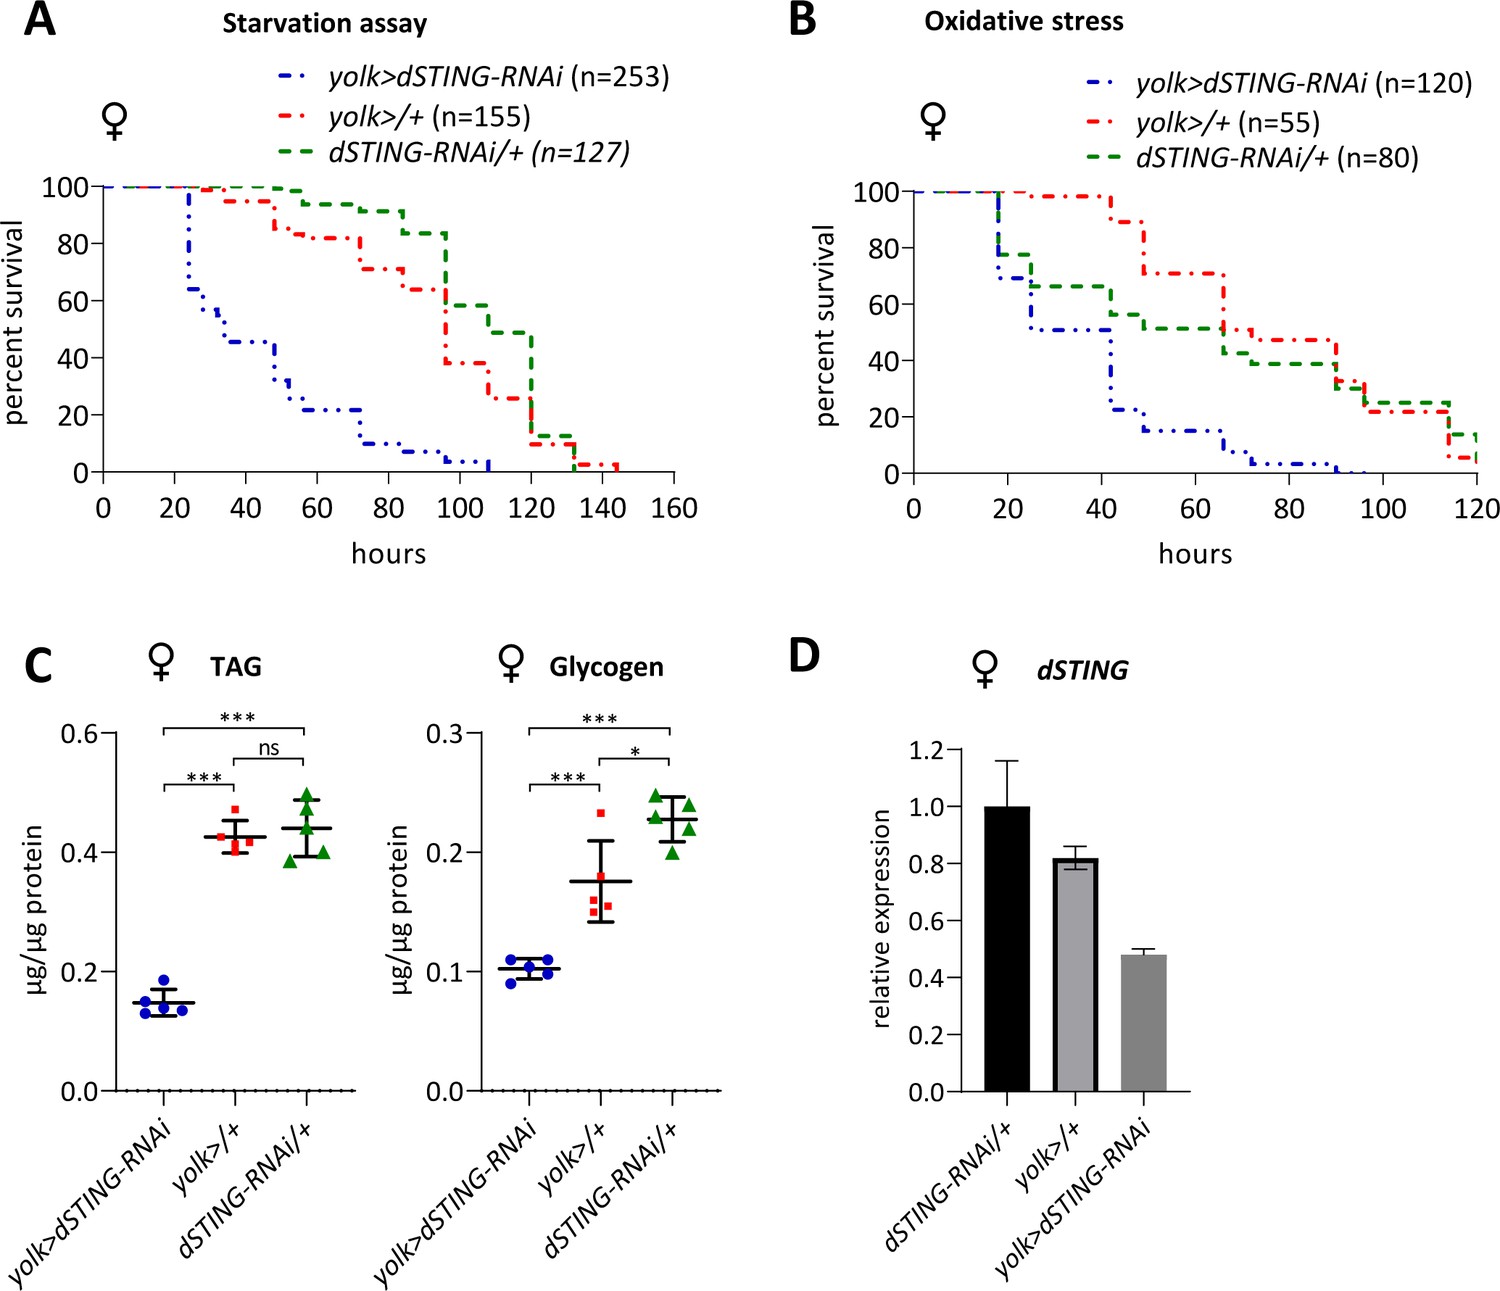
Fat body-specific RNAi of Drosophila STING results in increased sensitivity to starvation and oxidative stress and decreased TAG and glycogen levels.
(A) Starvation stress resistance of females. Five-day-old flies were kept on PBS only and percentages of surviving flies were counted. (B) Oxidative stress resistance of females. Five-day-old flies were kept on food supplemented with 5% hydrogen peroxide and percentages of surviving flies were counted. (C) TAG and glycogen levels in females were measured in the total body. Levels of metabolites are shown per µg of total protein. Data are represented as mean ± SD. One-way ANOVA with Tukey’s post hoc test. *p<0.05, ***p<0.001, ns indicates statistically non-significant. (D) Transcription of dSTING in control flies (yolk>/+ and dSTING-RNAi/+) and flies with RNAi of dSTING specifically in adult fat body (yolk> dSTING RNAi) was measured by RT-qPCR. The bars indicate dSTING relative expression levels. Values were normalized to the RNAi control (dSTING-RNAi/+). Data are represented as mean ± SD, n = 3–4. (A, B) The number of flies analyzed is shown in chart legend for each genotype. Log-rank test yielded p<0.001 for all pairwise comparisons except for (A): yolk>/+ vs dSTING-RNAi/+ under starvation stress p=0.121. yolk-GAL4 expresses only in female fat body; therefore, only females were used for experiments.
Figure 3
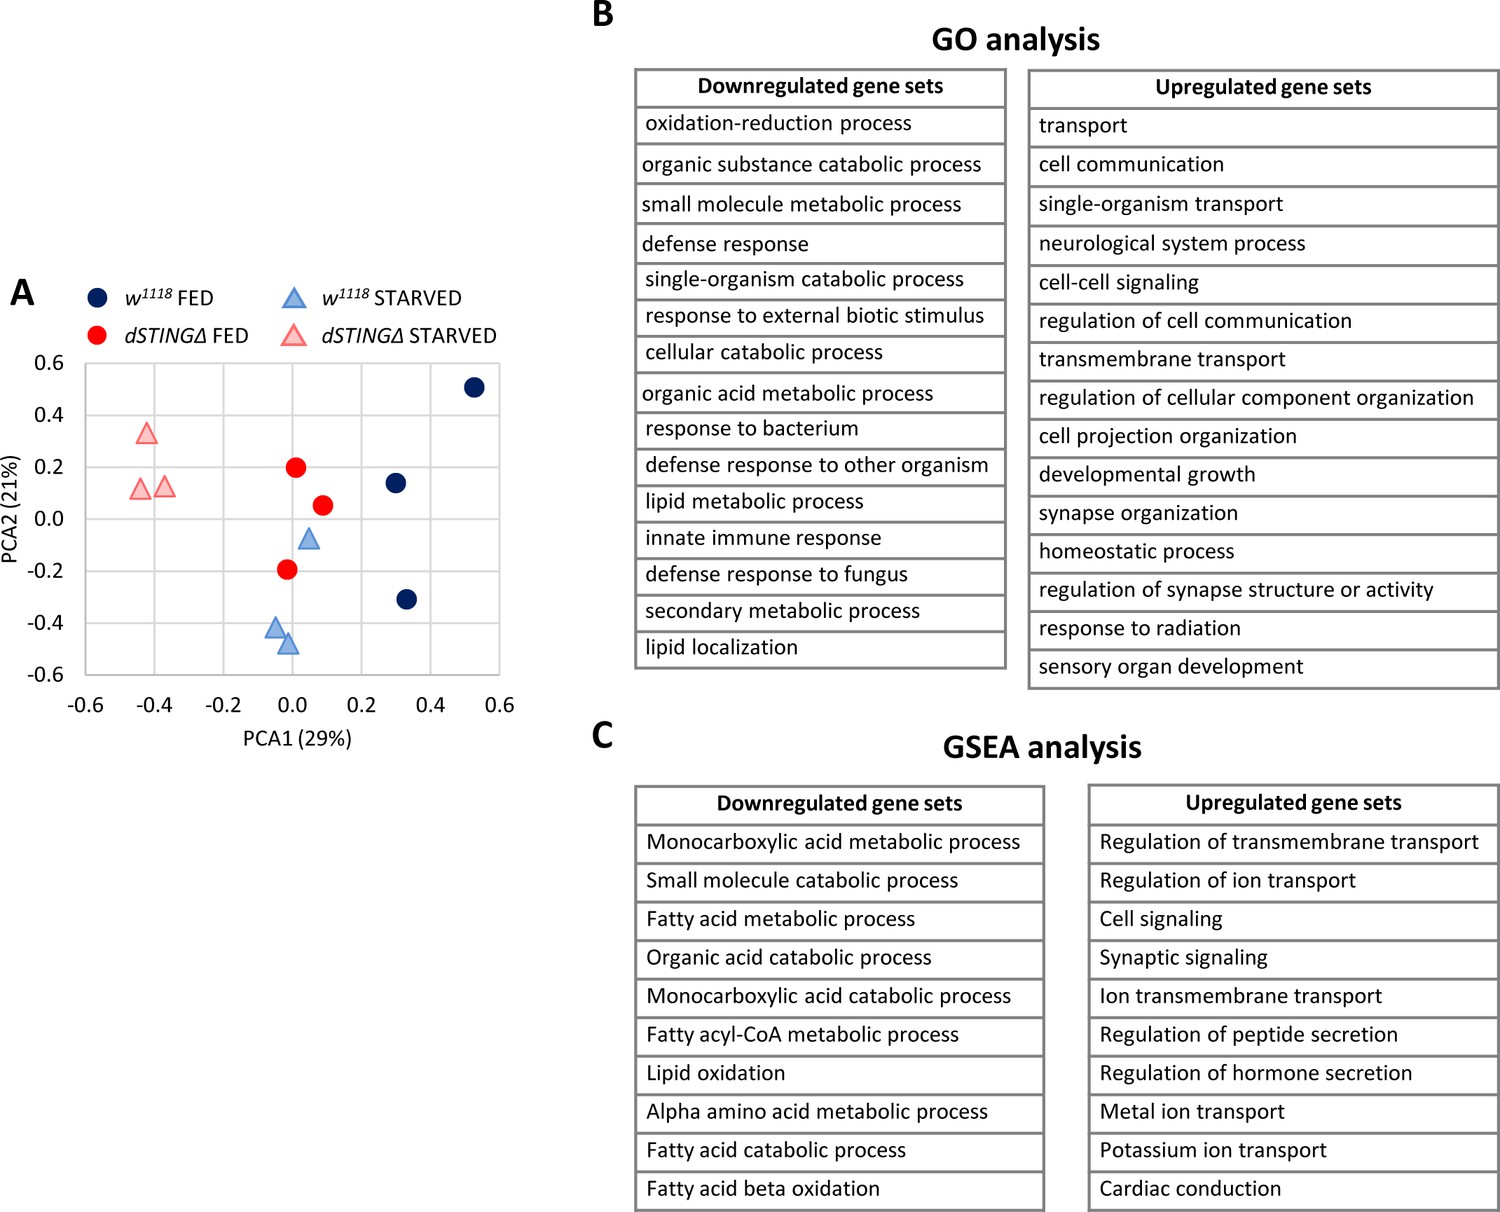
Lipid metabolism genes are downregulated in Drosophila STING mutants.
Fed or 24 hr starved 5-day-old adult males (dSTINGΔ mutants or w1118 as a control) were subjected to microarray analysis. (A) Principal component analysis (PCA) of microarray data. PCA scores plot showing variances in gene expression profiles between groups is shown. Each sample is shown as a single point (n = 3 per genotype). (B) Gene ontology (GO) analysis of microarray data. dSTINGΔ mutants and control w1118 under fed conditions were compared. Downregulated and upregulated top scoring gene sets are shown. (C) Gene Set Enrichment Analysis (GSEA) of microarray data. dSTINGΔ mutants and control w1118 under fed conditions were compared. Downregulated and upregulated top scoring gene sets are shown.
Figure 4
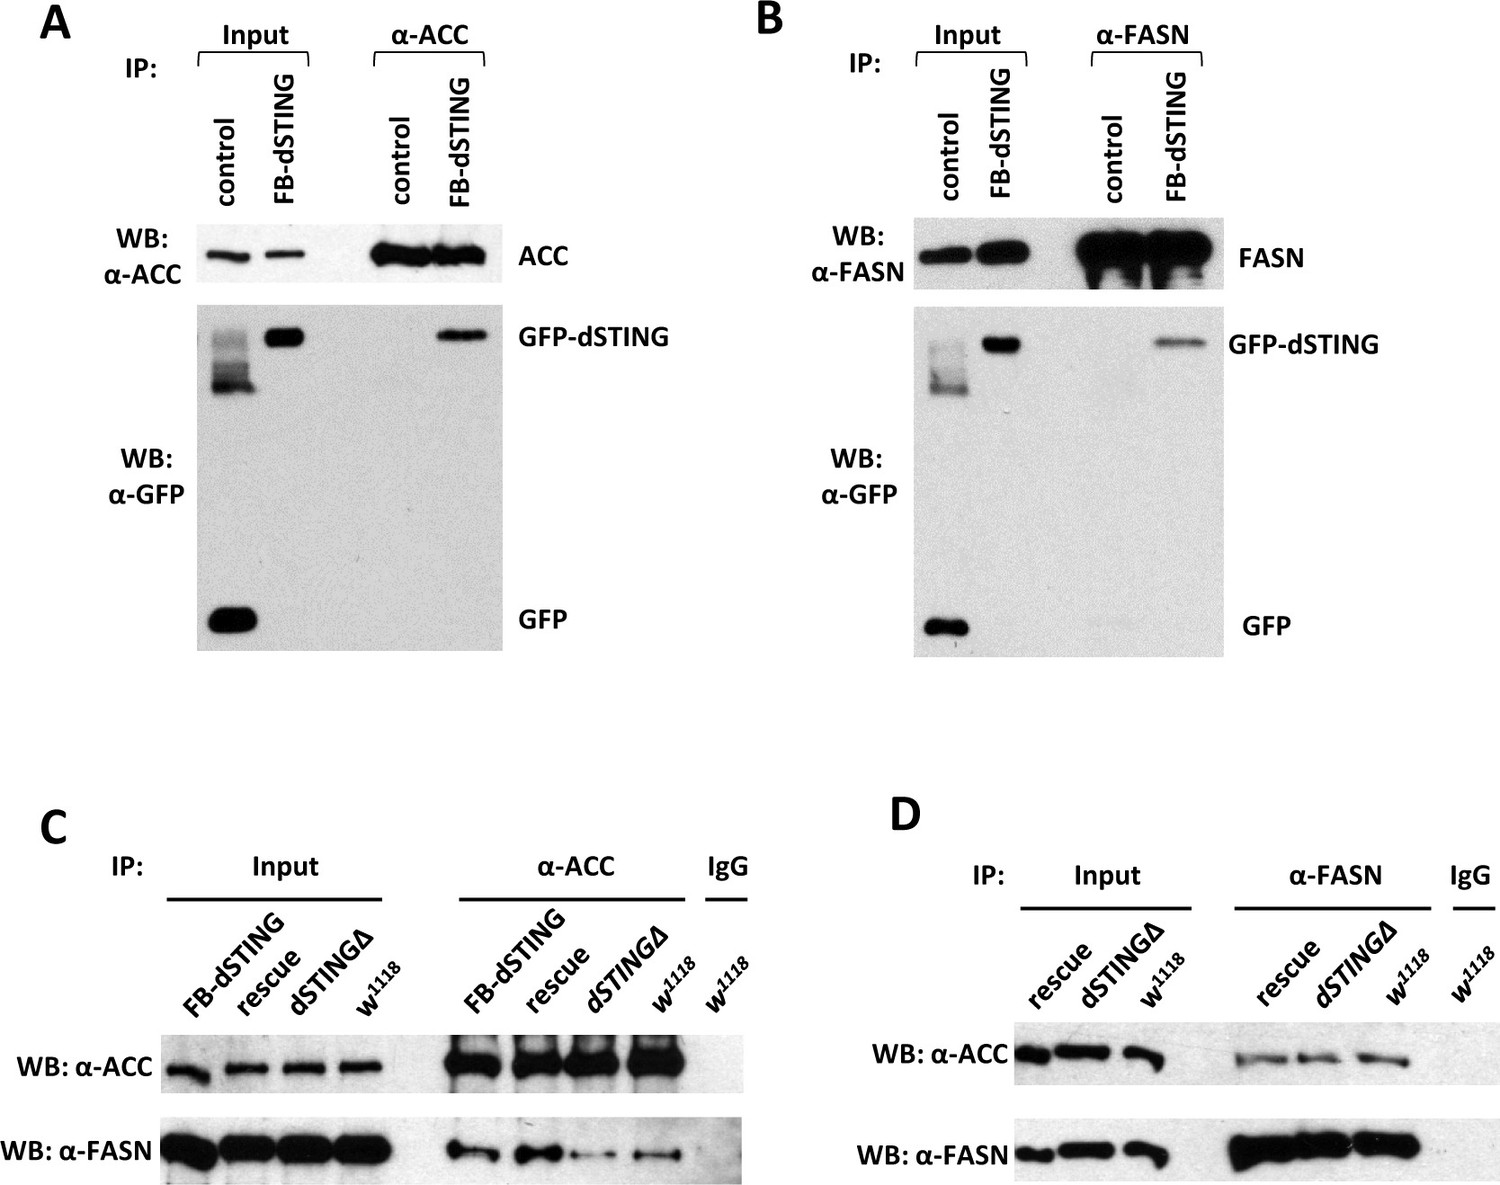
Drosophila STING protein interacts with acetyl-CoA carboxylase (ACC) and fatty acid synthase (FASN).
(A, B) dSTING interacts with ACC and FASN. ACC (A) or FASN (B) were immunoprecipitated from abdomens of adult flies using corresponding antibody. ’Control’ – w1118, “FB-dSTING” – cg-GAL4/GFP-dSTING (flies expressing GFP-dSTING in fat body). Recombinant GFP was added to the control reaction. (C, D) ACC and FASN interact with each other. ACC (C) or FASN (D) were immunoprecipitated from abdomens of adult flies using corresponding antibody. “Rescue” – dSTINGΔ;GFP-dSTING, “FB-dSTING” – cg-GAL4/GFP-dSTING (flies expressing GFP-dSTING in fat body).
-
Figure 4—source data 1
Source file for ACC, dSTING and FASN IP experiments.
- https://cdn.elifesciences.org/articles/67358/elife-67358-fig4-data1-v3.pdf
-
Figure 4—source data 2
Source file for Figure 4A (ACC and dSTING IP experiment).
- https://cdn.elifesciences.org/articles/67358/elife-67358-fig4-data2-v3.zip
-
Figure 4—source data 3
Source file for Figure 4B (dSTING and FASN IP experiment).
- https://cdn.elifesciences.org/articles/67358/elife-67358-fig4-data3-v3.zip
-
Figure 4—source data 4
Source file for Figure 4C (ACC and FASN IP experiment).
- https://cdn.elifesciences.org/articles/67358/elife-67358-fig4-data4-v3.zip
-
Figure 4—source data 5
Source file for Figure 4D (ACC and FASN IP experiment).
- https://cdn.elifesciences.org/articles/67358/elife-67358-fig4-data5-v3.zip
Figure 5 with 1 supplement
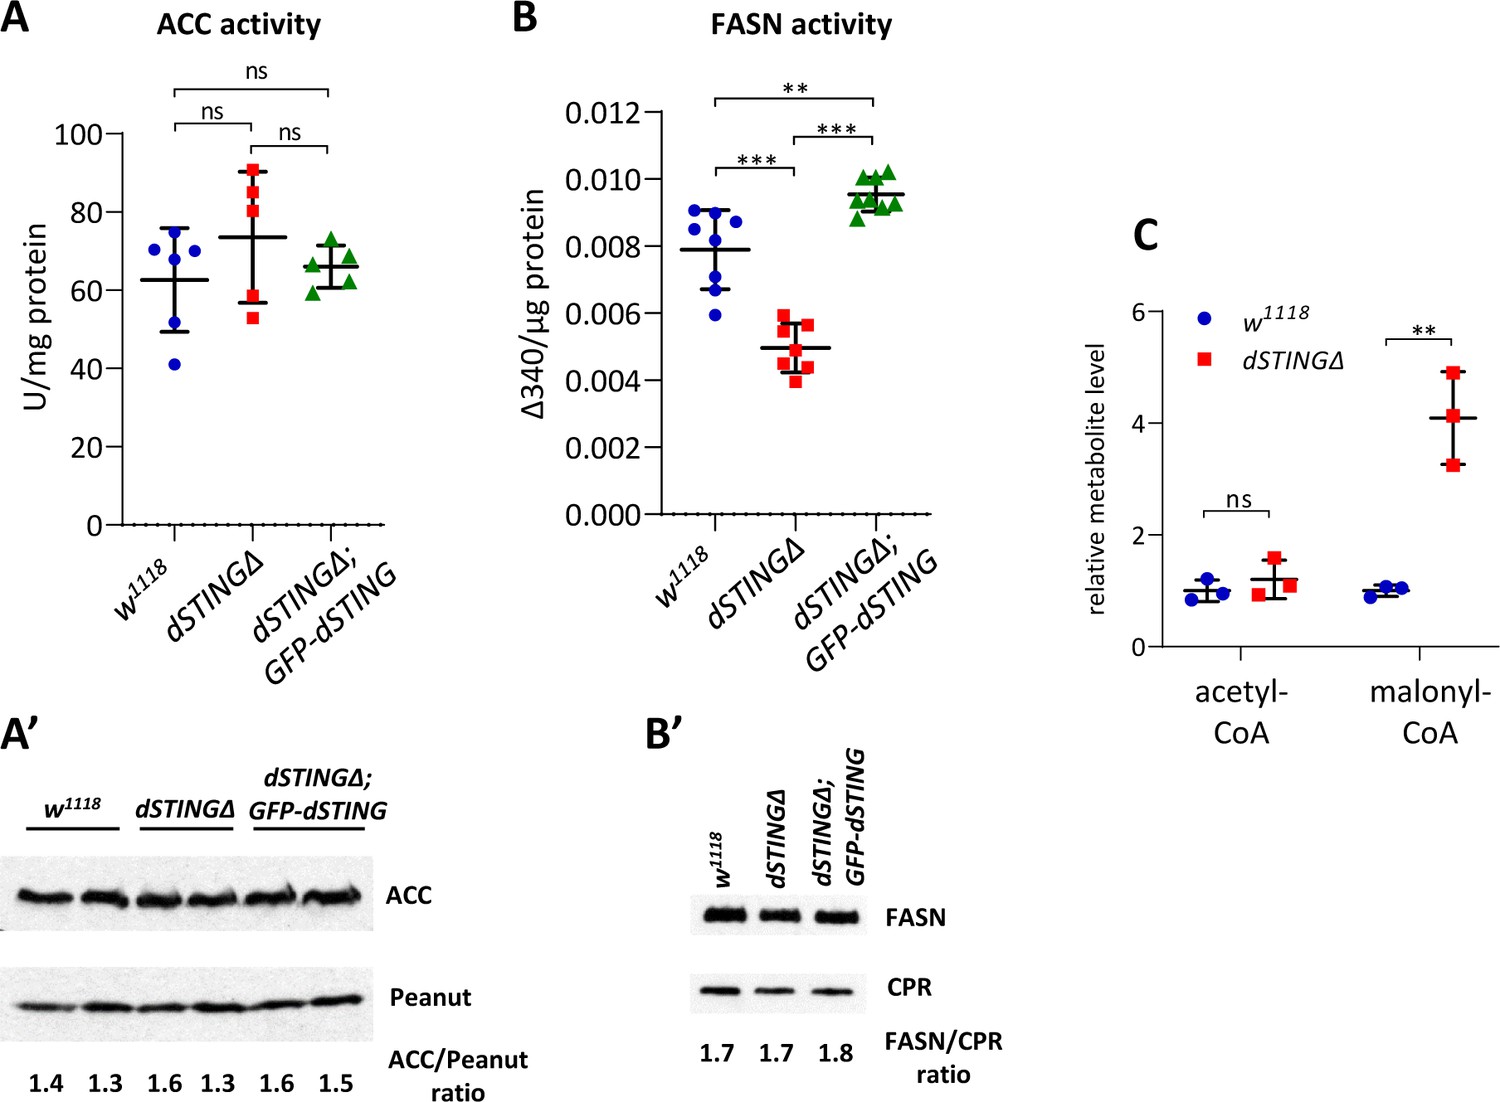
Fatty acid synthase activity is decreased in Drosophila STING mutants.
(A, B) Enzyme activity assays. ACC activity (A) or FASN activity (B) was measured in the total body of adult flies and normalized to protein level. The number of experiments for each genotype is indicated. Data are represented as mean ± SD. One-way ANOVA with Tukey’s post hoc test. **p<0.01, ***p<0.001, ns indicates statistically non-significant. (A’) ACC protein level in total fly extract. Peanut was used as a loading control. (B’) FASN protein level in total fly extract. CPR (NADPH-cytochrome P450 reductase) was used as a loading control. (C) Acetyl-CoA and malonyl-CoA levels in fly total body extracts. Values were normalized to wild type (w1118). Data are represented as mean ± SD. Student’s t-test, **p<0.01, ns indicates statistically non-significant.
-
Figure 5—source data 1
Source file for ACC and FASN protein level experiment.
- https://cdn.elifesciences.org/articles/67358/elife-67358-fig5-data1-v3.pdf
-
Figure 5—source data 2
Source file for Figure 5A’ (ACC protein level).
- https://cdn.elifesciences.org/articles/67358/elife-67358-fig5-data2-v3.zip
-
Figure 5—source data 3
Source file for Figure 5B’ (FASN protein level).
- https://cdn.elifesciences.org/articles/67358/elife-67358-fig5-data3-v3.zip
-
Figure 5—source data 4
Source file for enzyme activity levels.
- https://cdn.elifesciences.org/articles/67358/elife-67358-fig5-data4-v3.xlsx
Figure 5—figure supplement 1
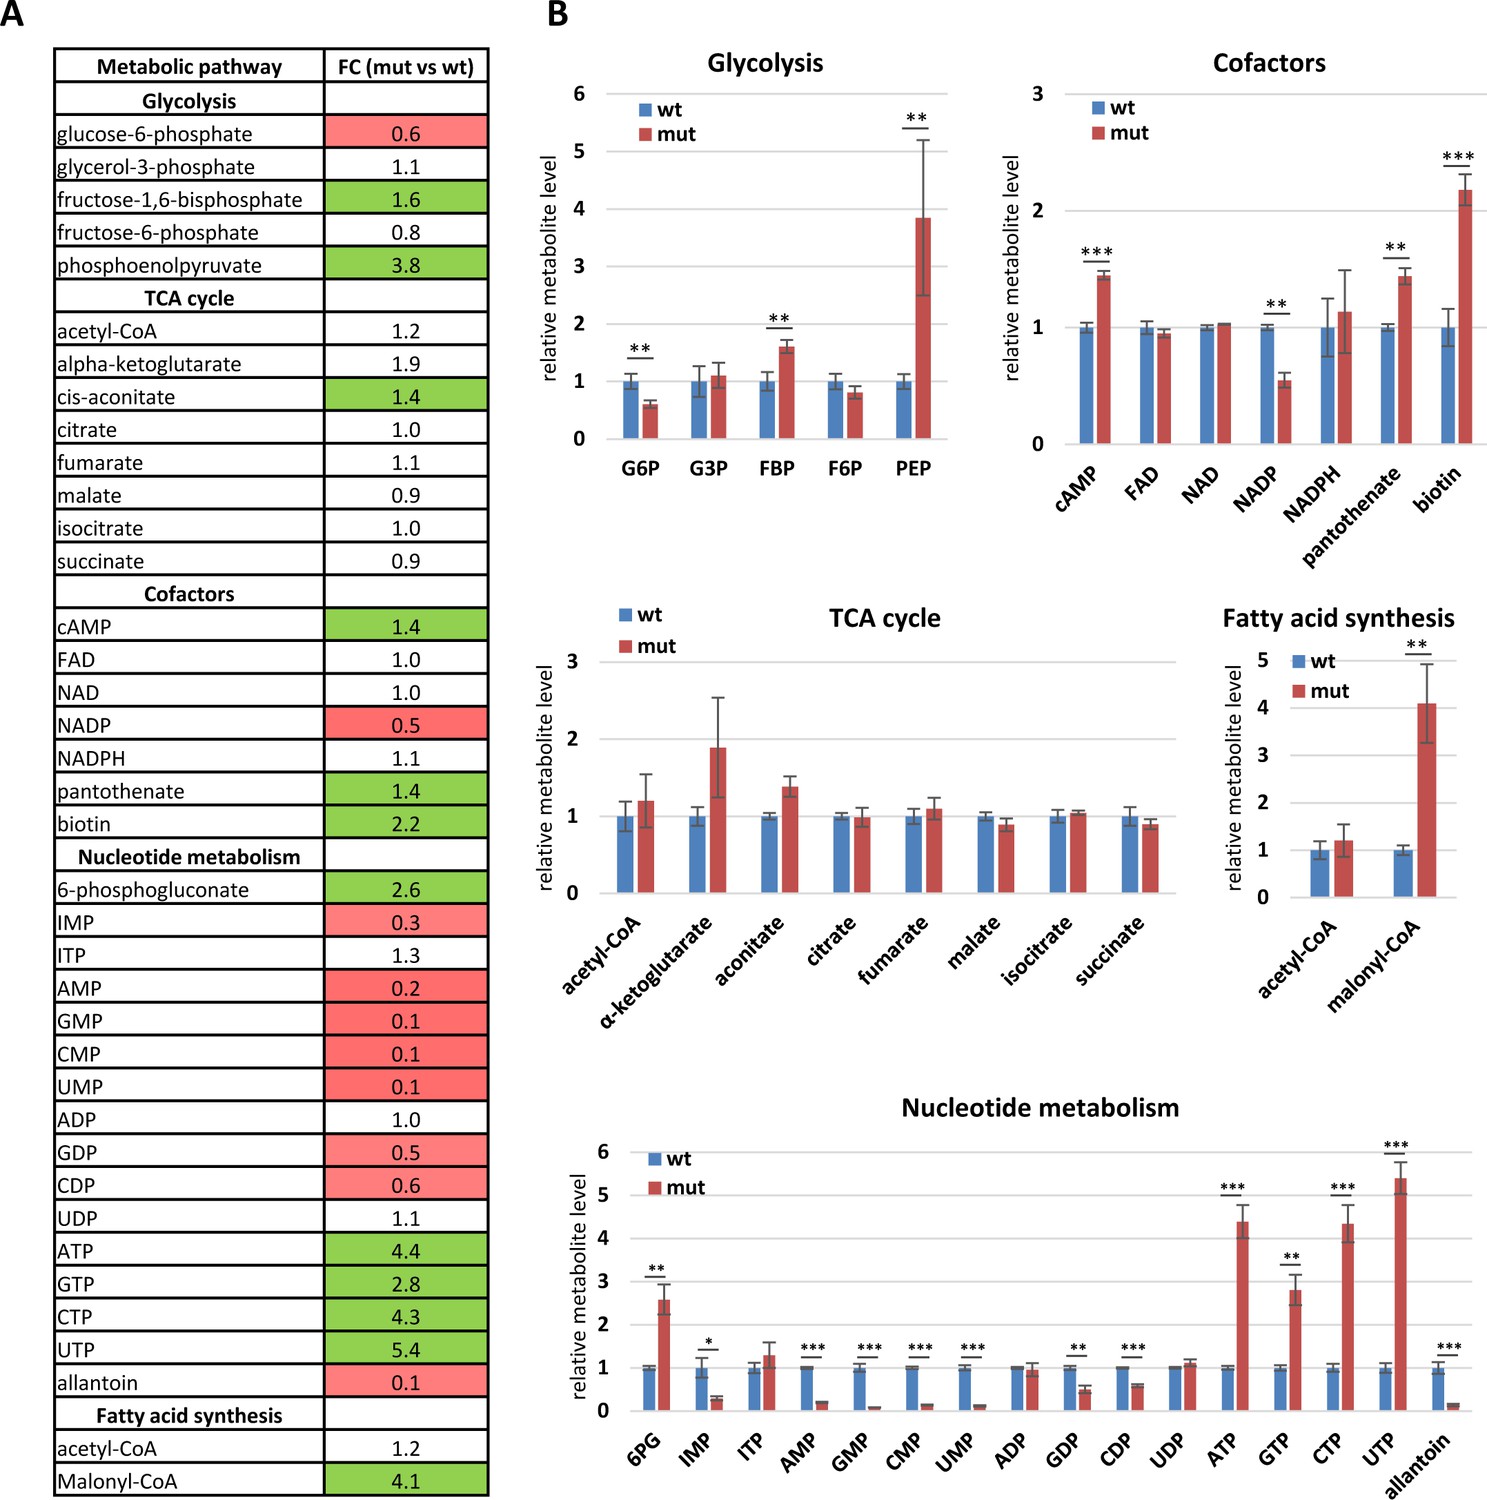
Metabolomics analysis of Drosophila STING mutants.
(A) List of metabolites identified in polar metabolite profiling experiment. Whole bodies of 5-day-old fed males were used in the experiment. Left column shows the names of metabolites and metabolic pathway they relate to. Right column shows fold change (FC) values (mut vs wt, where ‘mut’ corresponds to dSTINGΔ mutant ‘wt’ to w1118, respectively). Colored cells represent statistically significant difference, where red indicates decreased level, green indicates increased level. (B) Charts show changes in metabolite levels in dSTINGΔ mutants (mut, red) relative to control w1118 (wt, blue). Data are represented as mean ± SD, n = 3. Student’s t-test, ***p<0.001, **p<0.01, *p<0.1.
-
Figure 5—figure supplement 1—source data 1
Quantitation of polar metabolites in 5-days old adult males.
- https://cdn.elifesciences.org/articles/67358/elife-67358-fig5-figsupp1-data1-v3.xlsx
Figure 6 with 1 supplement
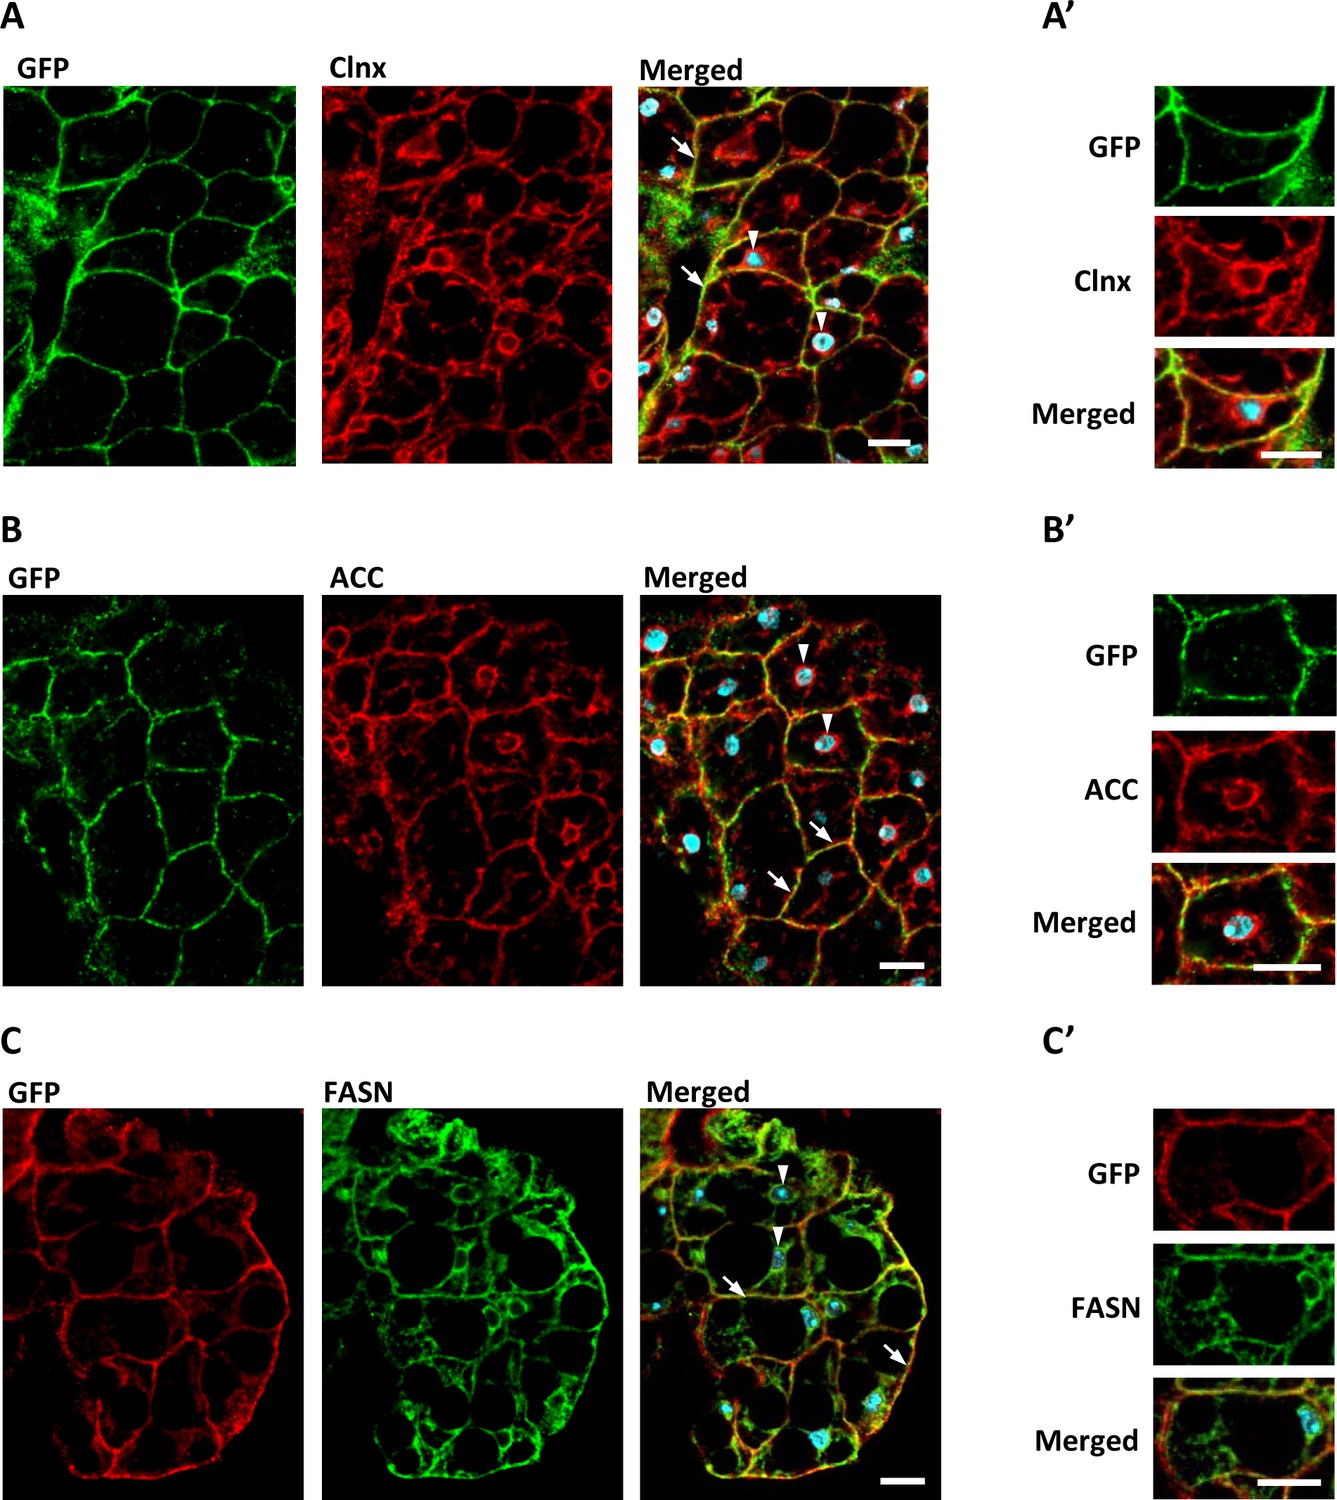
dSTING, ACC, and FASN co-localize in Drosophila fat body cells.
Fat body of adult flies expressing GFP-tagged dSTING (genotype dSTINGΔ;GFP-dSTING) were stained for: (A, A’) GFP (green) and Calnexin (Clnx, red); (B, B’) GFP (green) and ACC (red); (C, C’) GFP (red) and FASN (green). Nuclei were stained with DAPI (blue). Arrows mark cortical region, arrowheads mark perinuclear region of fat body cells. Scale bar 10 µm. Higher magnification is shown at (A’, B’, C’).
Figure 6—figure supplement 1
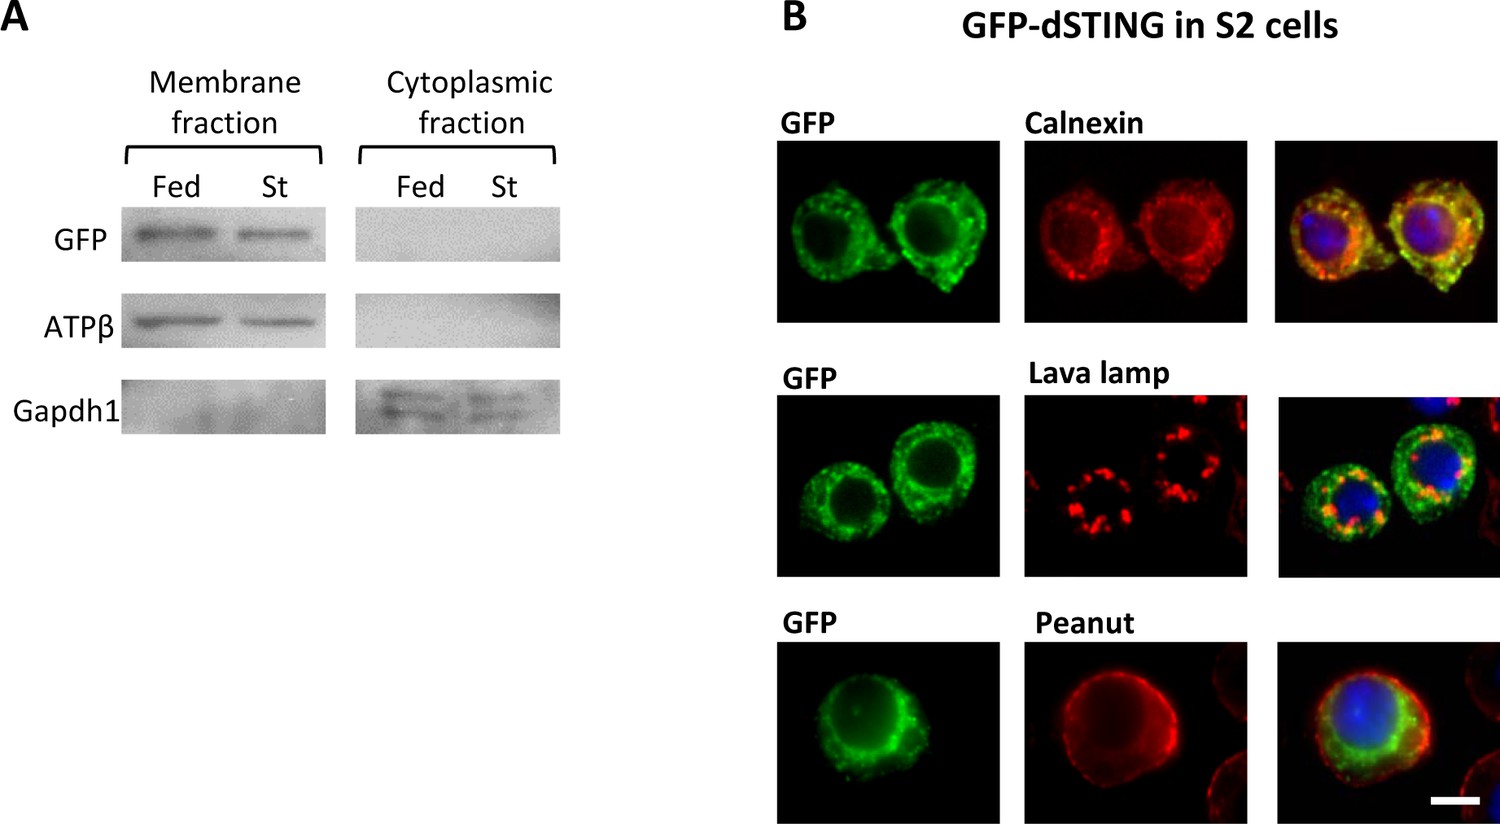
Drosophila STING localizes at the endoplasmic reticulum (ER) membrane.
(A) GFP-dSTING is associated with membrane fraction. Membrane and cytoplasmic fractions were extracted from abdomens of five days old males (of genotype dSTINGΔ;GFP-dSTING) and subjected to Western blotting. Flies were either fed or starved for 24 hr. ATPβ and Gapdh1 were used as markers for membrane and cytoplasmic fractions, respectively. (B) GFP-dSTING is mainly localized at the ER. Drosophila S2 tissue culture cells expressing GFP-dSTING were immunostained with following antibodies: GFP, Calnexin (ER marker), Lava lamp (Golgi marker), Peanut (cellular membrane marker). Nuclei were stained with DAPI. Scale bar 5 µm.
-
Figure 6—figure supplement 1—source data 1
Source file for membrane fractionation experiment.
- https://cdn.elifesciences.org/articles/67358/elife-67358-fig6-figsupp1-data1-v3.pdf
-
Figure 6—figure supplement 1—source data 2
Source file for membrane fractionation experiment.
- https://cdn.elifesciences.org/articles/67358/elife-67358-fig6-figsupp1-data2-v3.zip
Figure 7
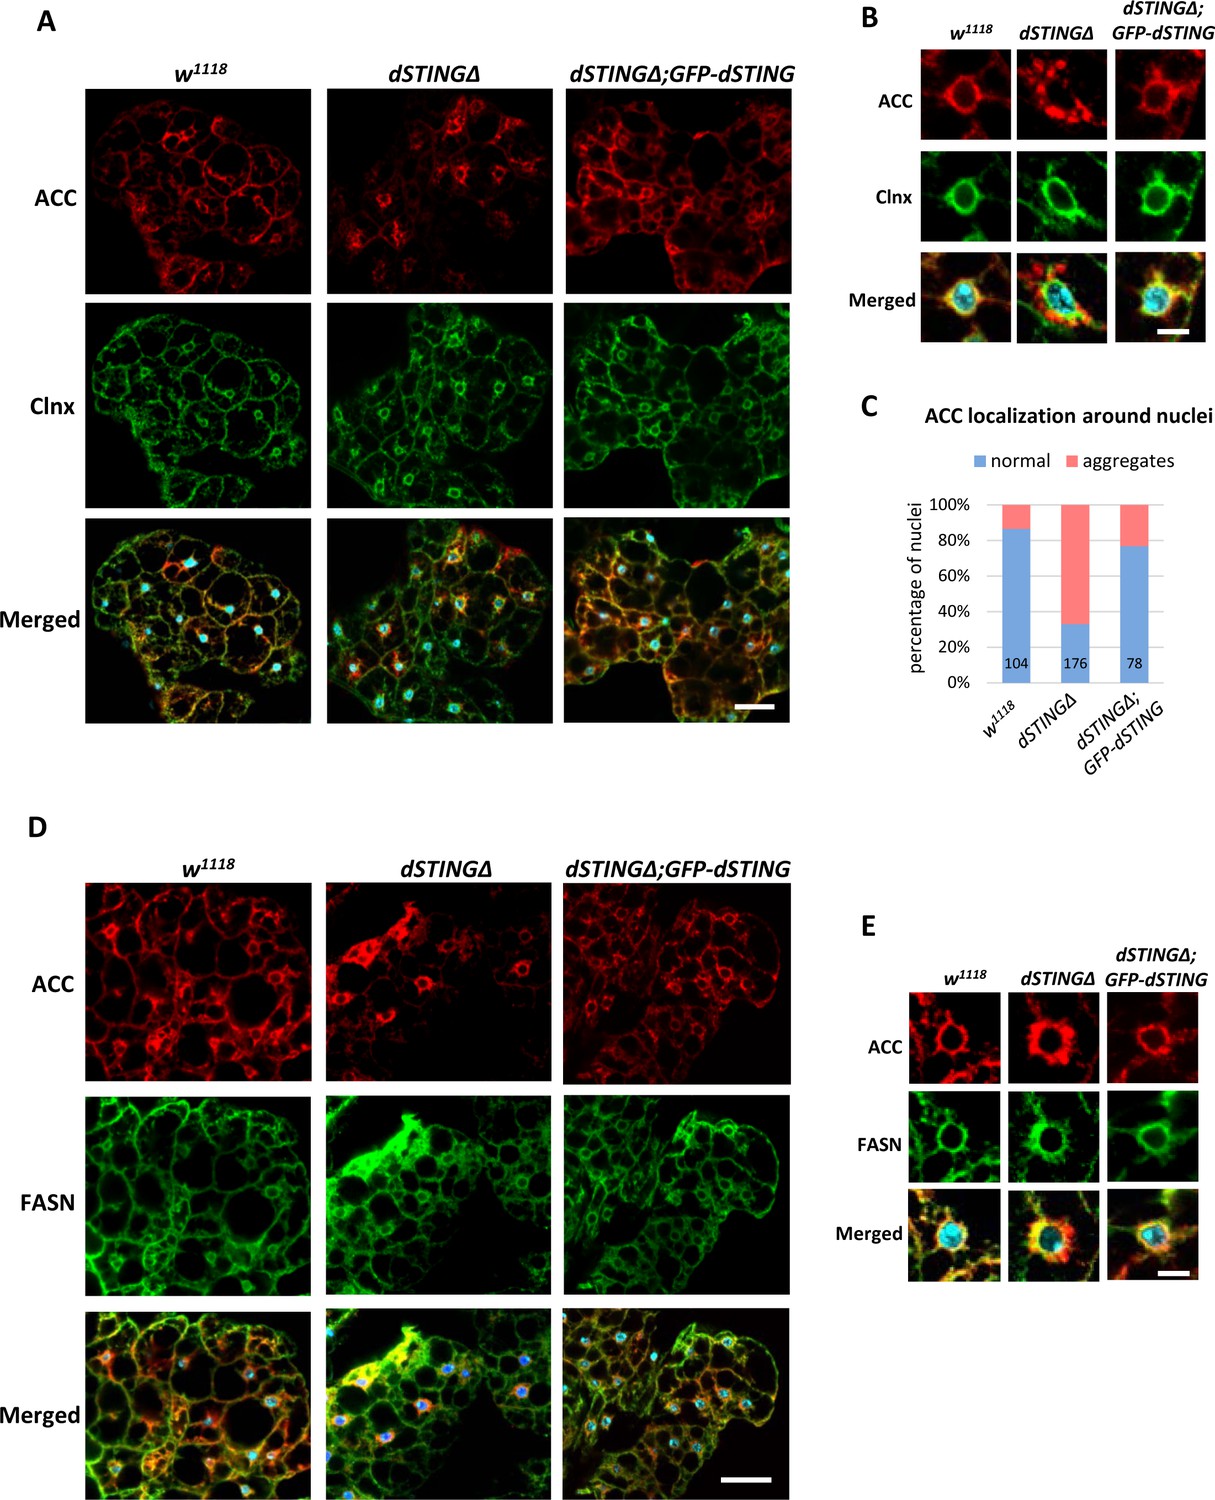
ACC localization is perturbed in Drosophila STING mutant fat body.
(A–C) Adult fat bodies were stained with ACC (red), Calnexin (Clnx, green), and DAPI (blue). (A) ACC has decreased cortical localization in dSTINGΔ mutant fat body as compared to control (w1118) and ‘rescue’ (dSTINGΔ;GFP-dSTING) fly strains. Scale bar 20 µm. (B) ACC localization in the perinuclear region of fat body cells. Scale bar 5 µm. (C) Quantification of perinuclear ACC localization pattern. Numbers of nuclei analyzed are shown for each genotype. (D–E) Adult fat bodies were stained with ACC (red), FASN (green), and DAPI (blue). (D) FASN localization is not changed in dSTINGΔ mutant fat body as compared to control (w1118) and “rescue” (dSTINGΔ;GFP-dSTING) fly strains. Scale bar 20 µm. (E) FASN and ACC localization in the perinuclear region of fat body cells. Scale bar 5 µm.
Figure 8

Model of dSTING deletion effect on Drosophila metabolism.
Based on our data, dSTING interacts with lipid synthesizing enzymes acetyl-CoA carboxylase (ACC) and fatty acid synthase (FASN). In the absence of dSTING, the activity of FASN is reduced which results in decreased de novo fatty acid synthesis and triglyceride (TAG) synthesis. Low TAG level in turn lead to sensitivity to starvation and oxidative stress. Reduced FASN activity in dSTING mutants also results in ACC product malonyl-CoA build-up in the cells leading to the inhibition of the fatty acid oxidation in mitochondria. Reduced fatty acid oxidation shifts cells to the increased reliance on glucose as a source of energy resulting in reduced glycogen and trehalose levels in dSTING mutants. Palmitic acid synthesized by FASN might participate in the regulation of dSTING via palmitoylation possibly providing a feedback loop.
Author response image 1
Tables
Key resources table
| Reagent type (species) or resource | Designation | Source or reference | Identifiers | Additional information |
|---|---|---|---|---|
| Gene (Drosophila melanogaster) | dSTING | GenBank | FLYB: FBgn0033453 | |
| Genetic reagent (D. melanogaster) | StingEY06491 | Bloomington Drosophila Stock Center | BDSC: 16,729RRID:BDSC_16729 | |
| Genetic reagent (D. melanogaster) | yolk-Gal4 | Bloomington Drosophila Stock Center | BDSC: 58,814RRID:BDSC_58814 | |
| Genetic reagent (D. melanogaster) | cg-GAL4 | Bloomington Drosophila Stock Center | BDSC: 7,011RRID:BDSC_7011 | |
| Genetic reagent (D. melanogaster) | tub-GAL4 | Bloomington Drosophila Stock Center | BDSC: 5,138RRID:BDSC_5138 | |
| Genetic reagent (D. melanogaster) | dSTING-RNAi | NIG-Fly, National Institute of Genetics, Japan | HMJ23183 | |
| Genetic reagent (D. melanogaster) | dSTINGΔ;GFP-dSTING-WT | This paper | ||
| Antibody | Anti-ACC(rabbit polyclonal) | Cell Signaling | Cat# 3,676RRID:AB_2219397 | IF(1:200),WB(1:1000) |
| Antibody | anti-FASN (guinea pig polyclonal) | Moraru et al., 2018 | A gift from A.TelemanIF(1:150), WB(1:2000) | |
| Antibody | anti-Calnexin (mouse monoclonal) | DHSB | Cat# Cnx99A 6-2-1RRID:AB_2722011 | IF (1:30) |
| Antibody | anti-GFP(rabbit polyclonal) | Proteintech | Cat# 50430–2-APRRID:AB_11042881 | IF (1:100) |
| Sequence-based reagent | CG1667-F | This paper | PCR primers | ATGGCAATCGCTAGCAACGT |
| Sequence-based reagent | CG1667-R | This paper | PCR primers | TGGCTACAATGCGAATAGAGGT |
| Commercial assay or kit | Acetyl-CoA Carboxylase assay kit | MyBioSource | Cat# MBS8303295 | |
| Chemical compound, drug | Nile Red | Thermo Fisher Scientific | Cat# N1142 | |
| Chemical compound, drug | HCS LipidTox Green | ThermoFisher Scientific | Cat# H34475 | |
| Chemical compound, drug | Blue dye no. 1 | MilliporeSigma | Cat# 3844-45-9 | |
| Software, algorithm | GraphPad Prism | GraphPad Software | RRID:SCR_002798 |
Additional files
-
Supplementary file 1
Microarray analysis of Drosophila STING mutant flies.
- https://cdn.elifesciences.org/articles/67358/elife-67358-supp1-v3.xlsx
-
Supplementary file 2
Mass spectrometry analysis of GFP-dSTING-interacting proteins.
- https://cdn.elifesciences.org/articles/67358/elife-67358-supp2-v3.xlsx
-
Transparent reporting form
- https://cdn.elifesciences.org/articles/67358/elife-67358-transrepform1-v3.docx
Download links
A two-part list of links to download the article, or parts of the article, in various formats.
Downloads (link to download the article as PDF)
Open citations (links to open the citations from this article in various online reference manager services)
Cite this article (links to download the citations from this article in formats compatible with various reference manager tools)
Drosophila STING protein has a role in lipid metabolism
eLife 10:e67358.
https://doi.org/10.7554/eLife.67358


