Permeant fluorescent probes visualize the activation of SARM1 and uncover an anti-neurodegenerative drug candidate
- State Key Laboratory of Chemical Oncogenomics, Key Laboratory of Chemical Genomics, Peking University Shenzhen Graduate School, China
- Ciechanover Institute of Precision and Regenerative Medicine, School of Life and Health Sciences, The Chinese University of Hong Kong, China
- Department of Chemistry, Hong Kong Baptist University, Kowloon Tong, China
- Department of Biology, Southern University of Science and Technology, China
- Kobilka Institute of Innovative Drug Discovery, School of Life and Health Sciences, The Chinese University of Hong Kong, China
- Shenzhen-Hong Kong Institute of Brain Science-Shenzhen Fundamental Research Institutions, China
Figures
Figure 1 with 13 supplements
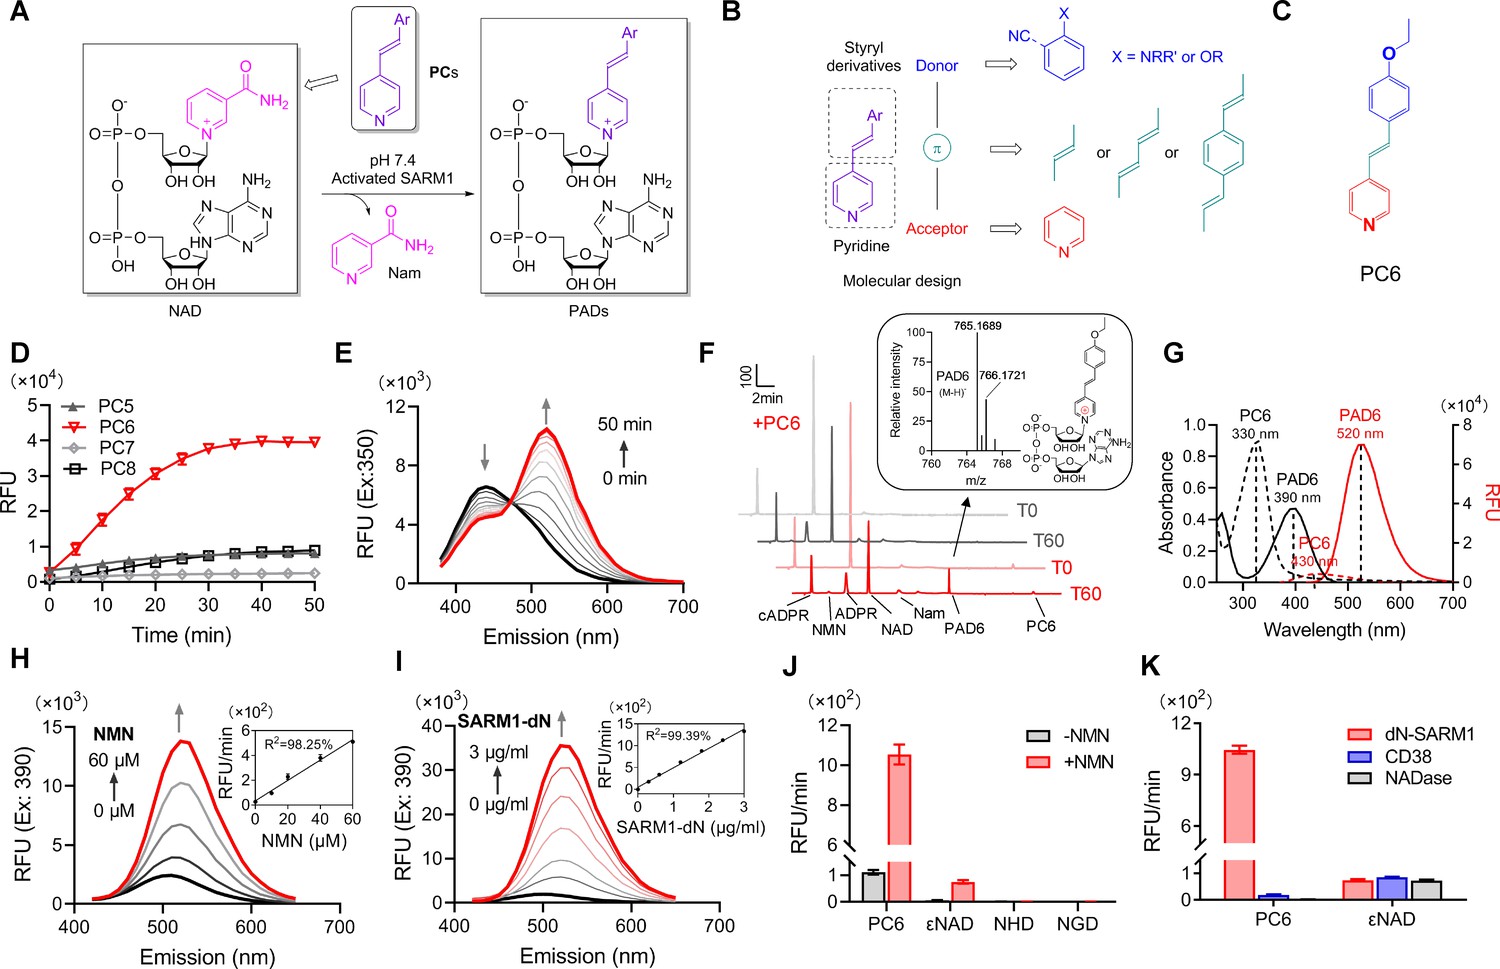
Design and characterization of PC probes.
(A) Strategy of fluorescent imaging of the activated SARM1. (B) Designing based on pyridine and styryl derivatives with a donor-π-acceptor framework. (C) Structure of PC6. (D) The kinetics of the fluorescence increase at the maximal absorbance wavelengths catalyzed by SARM1-dN, in the presence of 100 μM NMN, 100 μM NAD, and 50 μM PCs. (E) Time-dependent changes of the emission spectra at the isosbestic point (350 nm). (F) HPLC analysis of PC6 reaction. Red line: in the presence of PC6, NMN, and NAD; Gray line: without PC6. Insert: MS analysis and structure of PAD6. (G) Absorbance and fluorescence spectra of 25 μM PC6/PAD6. (H) Emission spectra with dose of NMN (10, 20, 40, 60 μM) in the presence of NAD, PC6, and SARM1-dN. Inset: the initial rates plotted to NMN concentrations. (I) Emission spectra with doses of SARM1-dN in the presence of NMN, NAD, and PC6; Inset: the initial rate plotted to SARM1 concentrations. (J) The reaction rates of 10 μM PC6, in the presence of 100 μM NMN and 100 μM NAD, compared with NAD analogss (100 μM) catalyzed by SARM1. (K) The reaction rates of 10 μM PC6 catalyzed by SARM1, NADase, and CD38. PC = pyridine conjugate, NMN = nicotinamide mononucleotide.
-
Figure 1—source data 1
Source data in excel for Figure 1D-K.
- https://cdn.elifesciences.org/articles/67381/elife-67381-fig1-data1-v2.xlsx
-
Figure 1—source data 2
Source data in excel for Figure 1—figure supplements 11C, 12 and Figure 1—figure supplement 13.
- https://cdn.elifesciences.org/articles/67381/elife-67381-fig1-data2-v2.xlsx
Figure 1—figure supplement 1
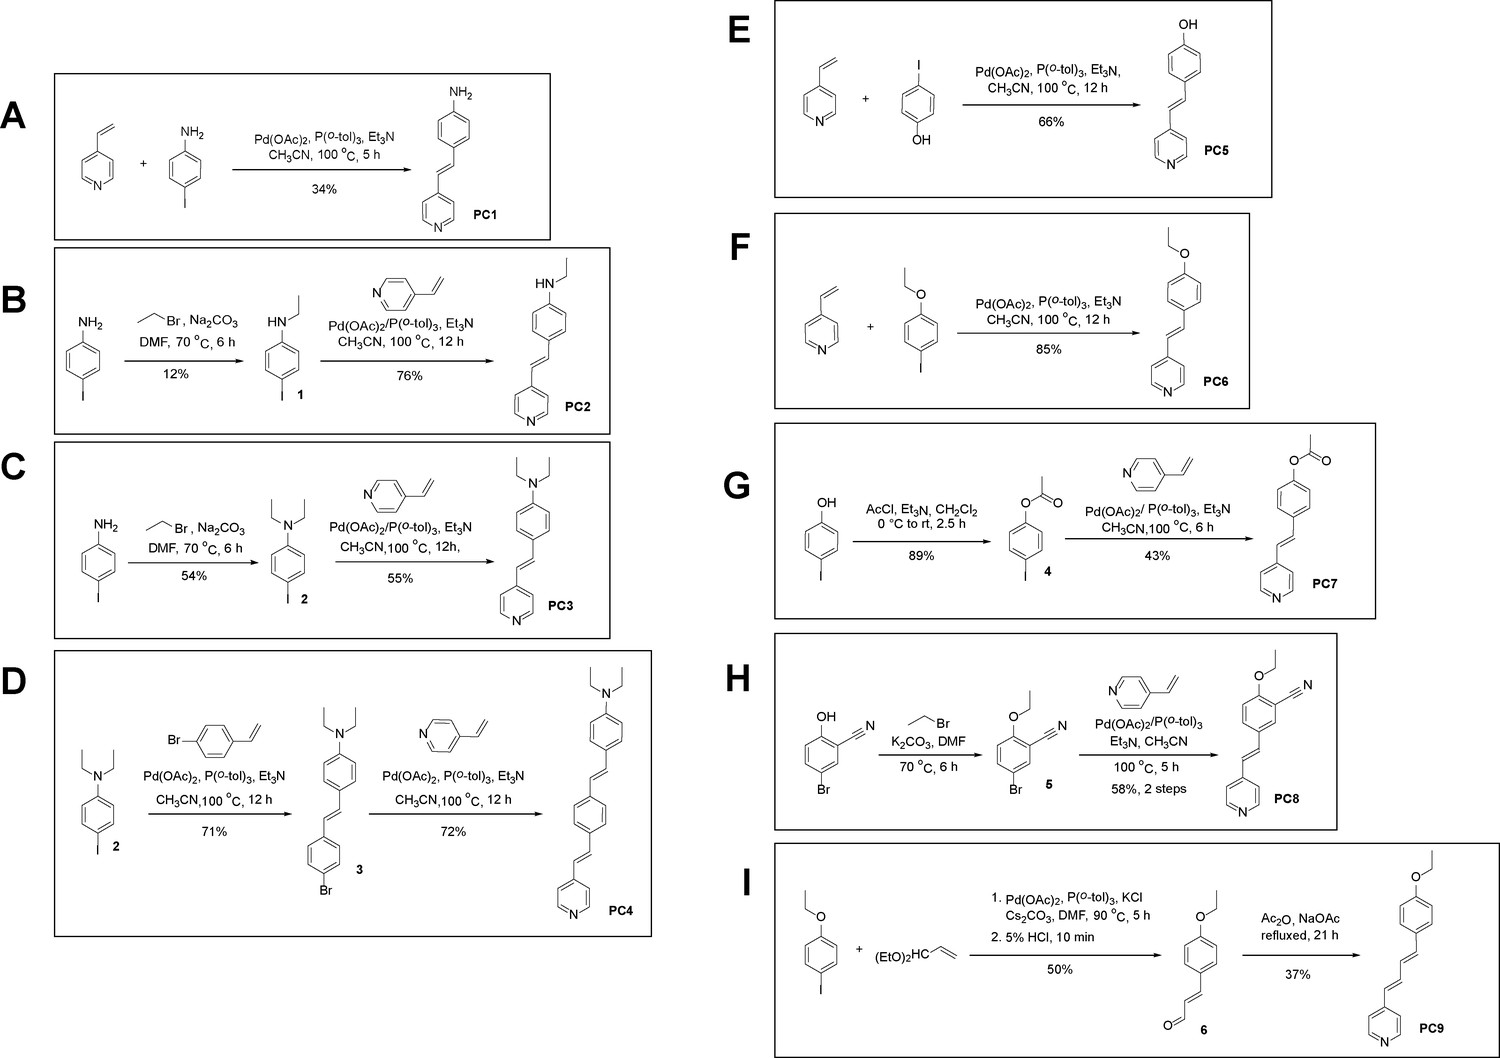
Synthetic scheme of PC1–PC9. PC = pyridine conjugate.
Figure 1—figure supplement 2
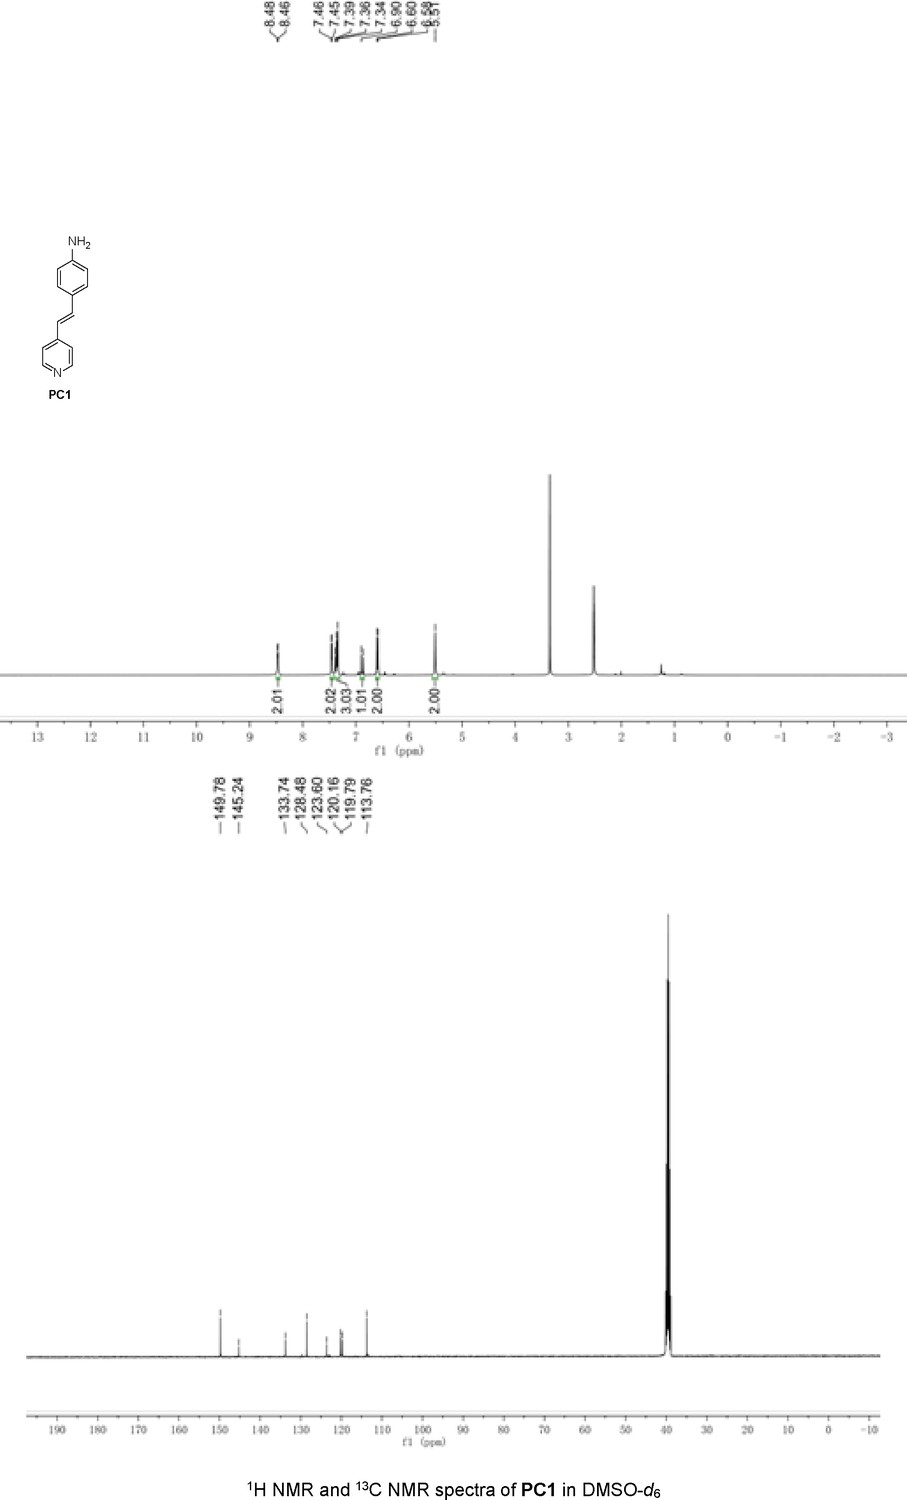
1H NMR and 13C NMR spectra of PC1 in DMSO-d6.
Figure 1—figure supplement 3

1H NMR and 13C NMR spectra of PC2 in CDCl3.
Figure 1—figure supplement 4

1H NMR and 13C NMR spectra of PC3 in CDCl3.
Figure 1—figure supplement 5

1H NMR and 13C NMR spectra of PC4 in CDCl3.
Figure 1—figure supplement 6
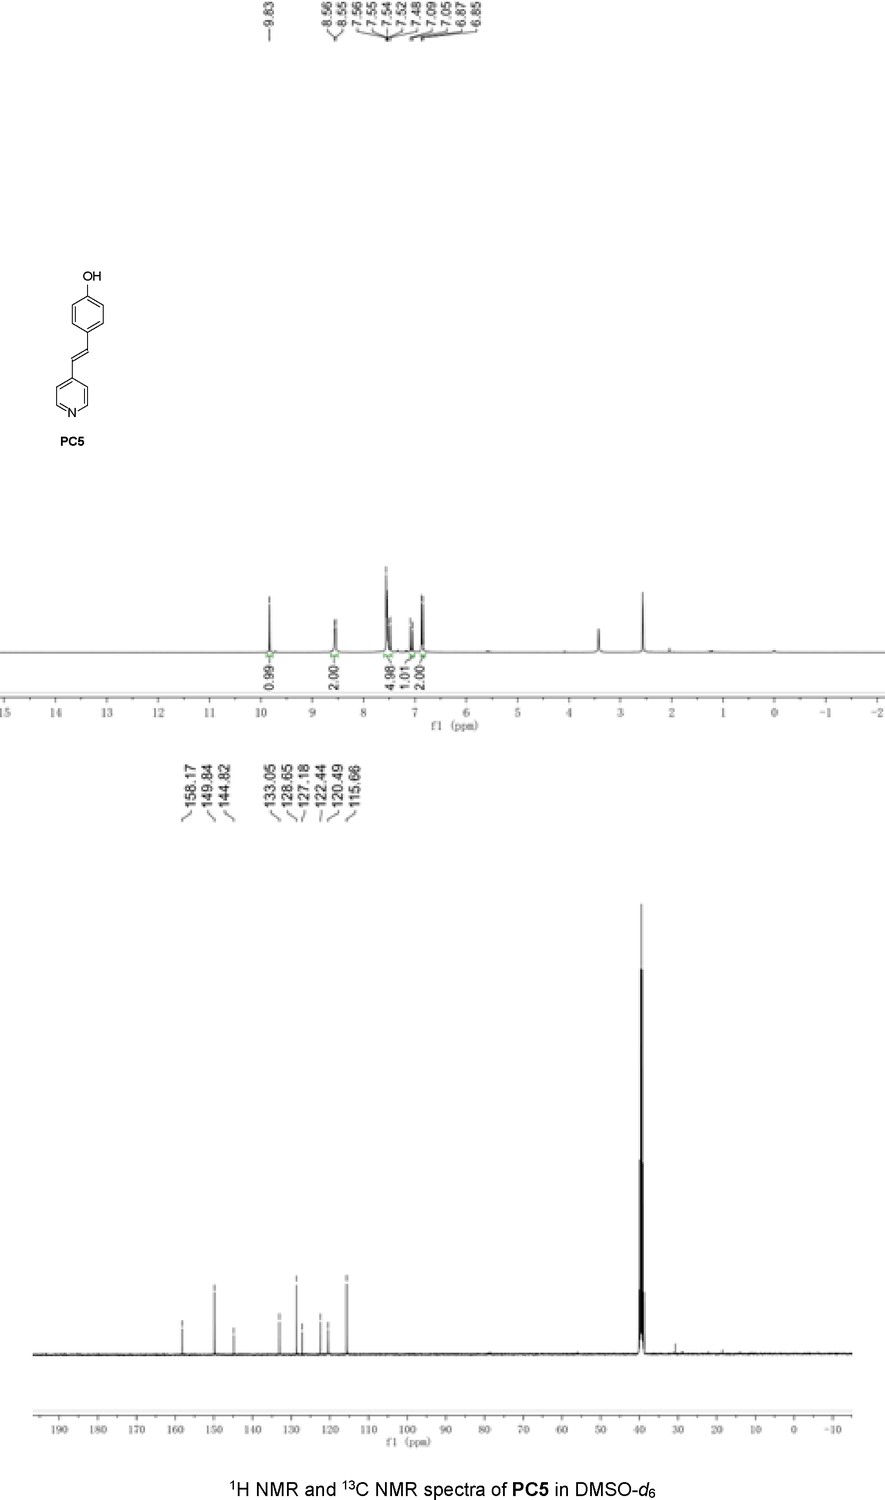
1H NMR and 13C NMR spectra of PC5 in DMSO-d6.
Figure 1—figure supplement 7
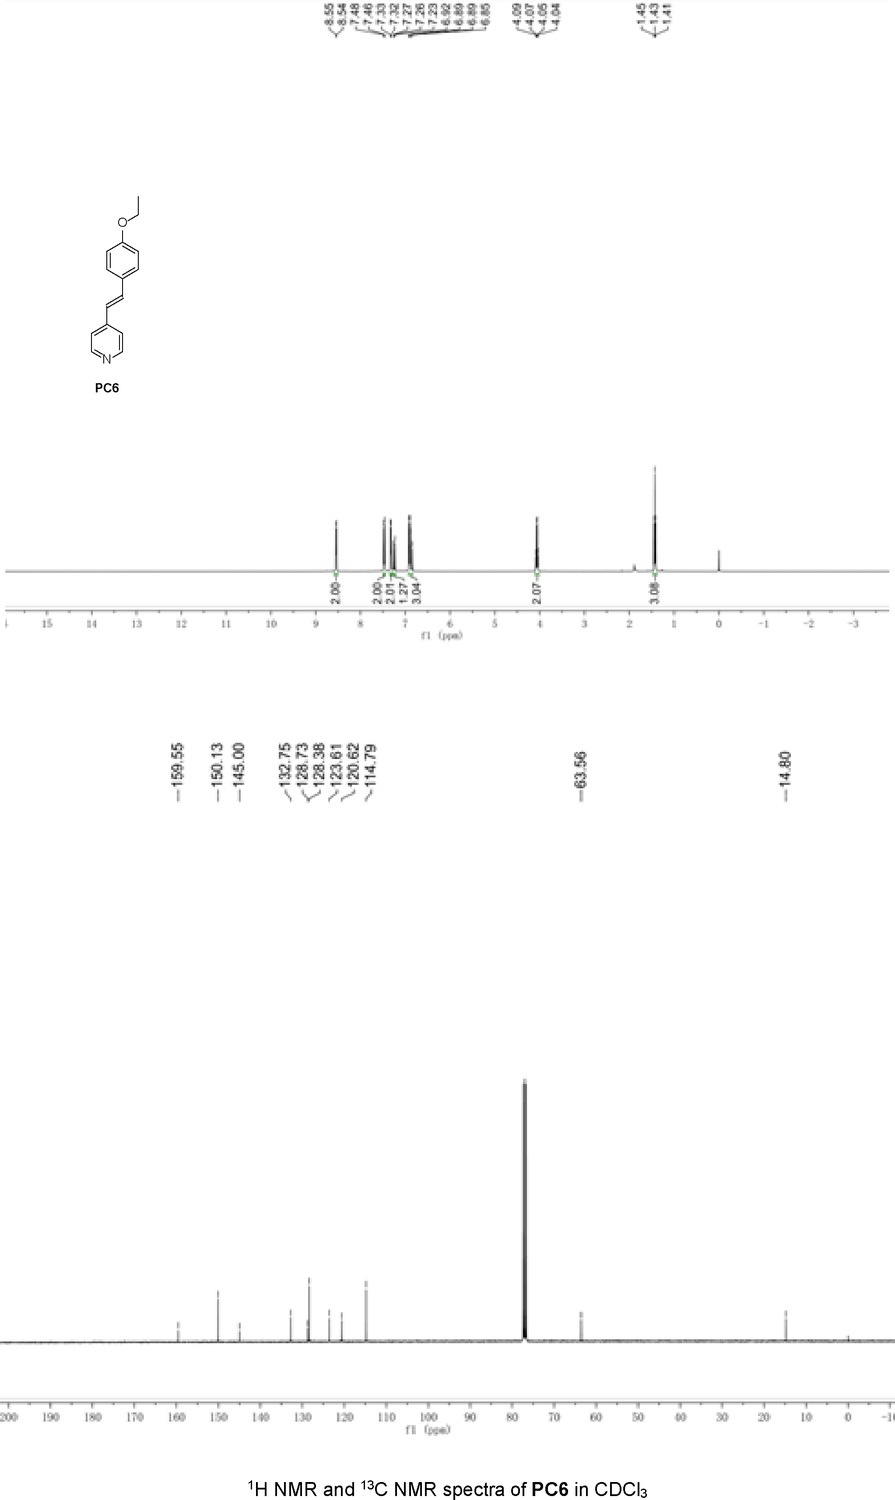
1H NMR and 13C NMR spectra of PC6 in CDCl3.
Figure 1—figure supplement 8
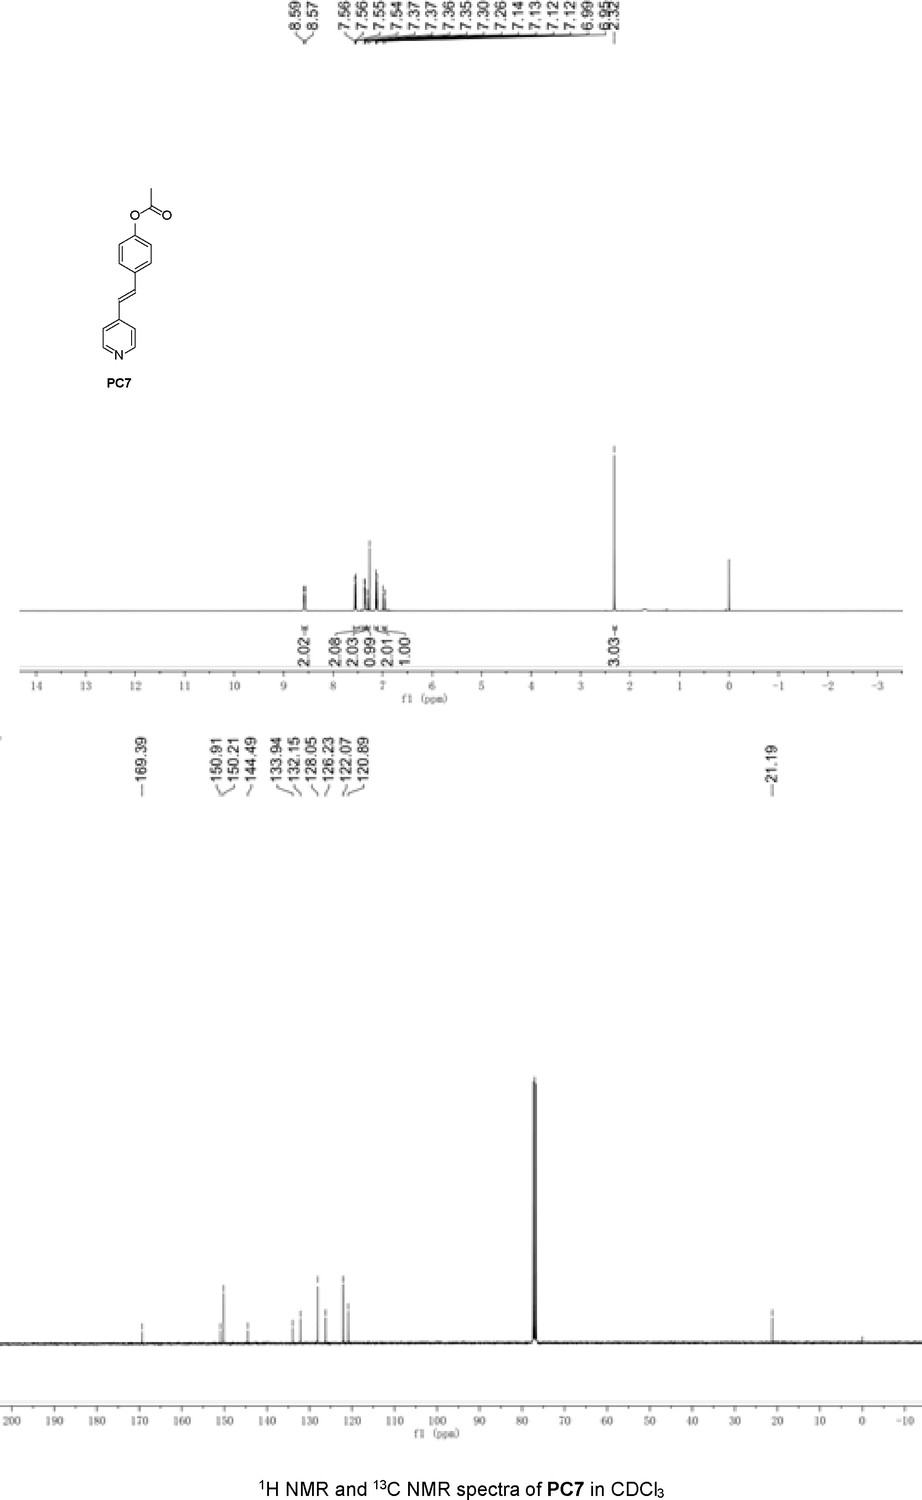
1H NMR and 13C NMR spectra of PC7 in CDCl3.
Figure 1—figure supplement 9
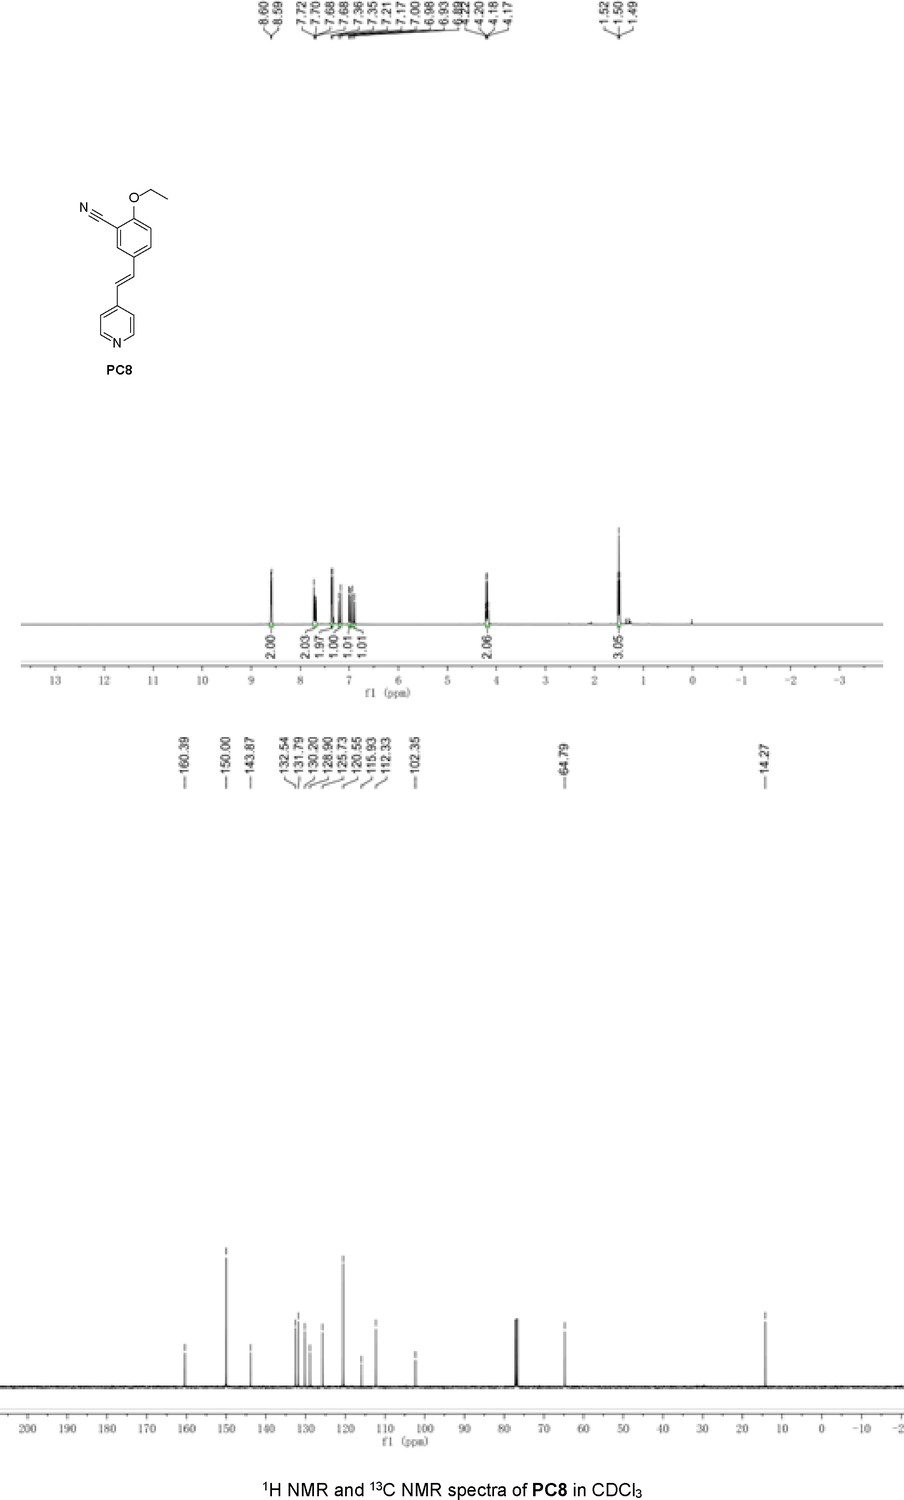
1H NMR and 13C NMR spectra of PC8 in CDCl3.
Figure 1—figure supplement 10
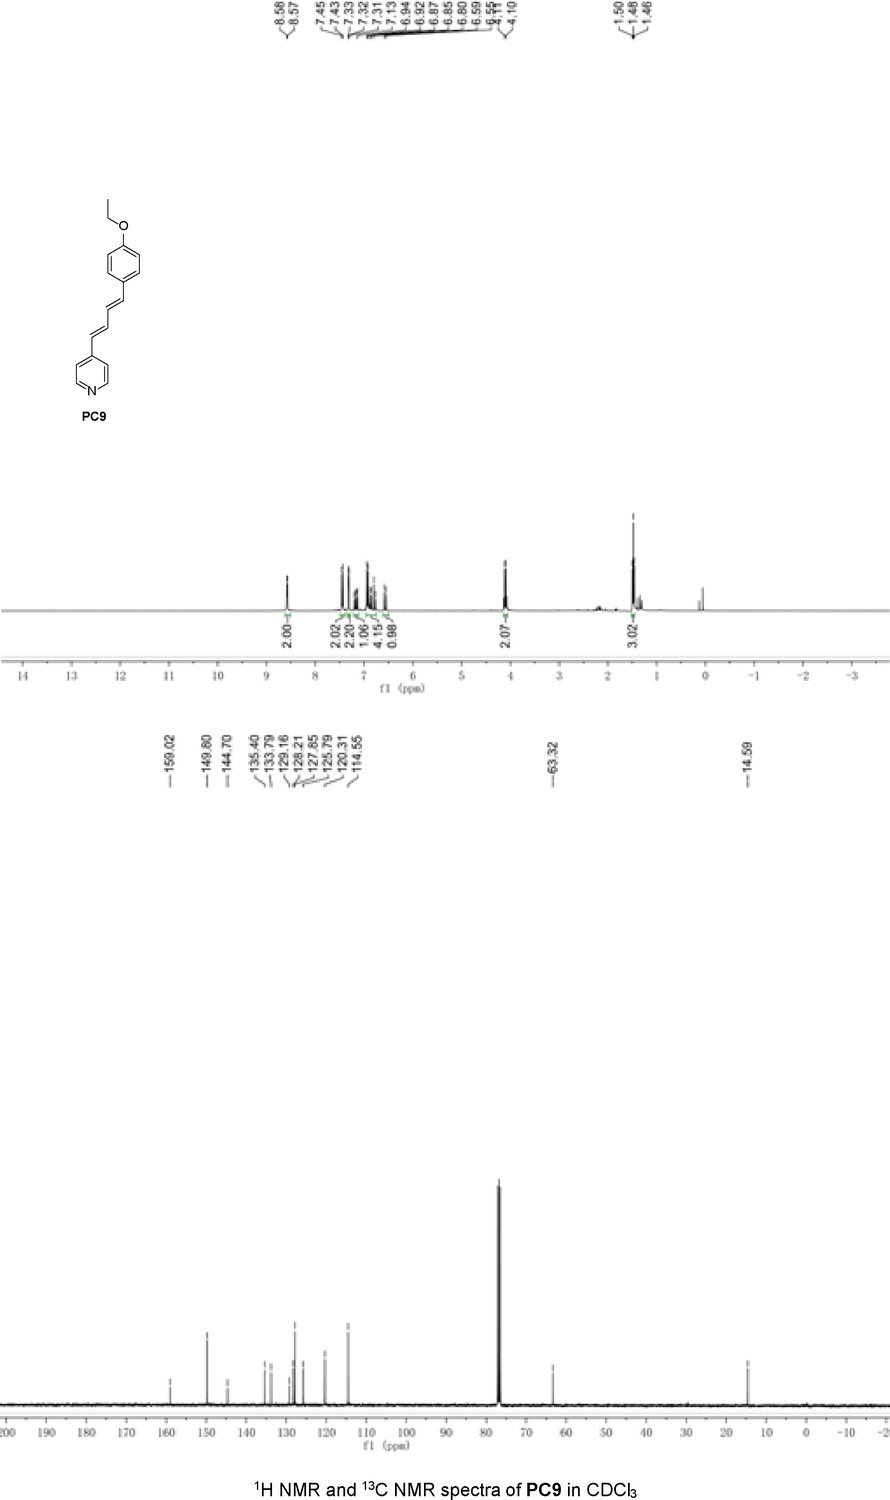
1H NMR and 13C NMR spectra of PC9 in CDCl3.
Figure 1—figure supplement 11
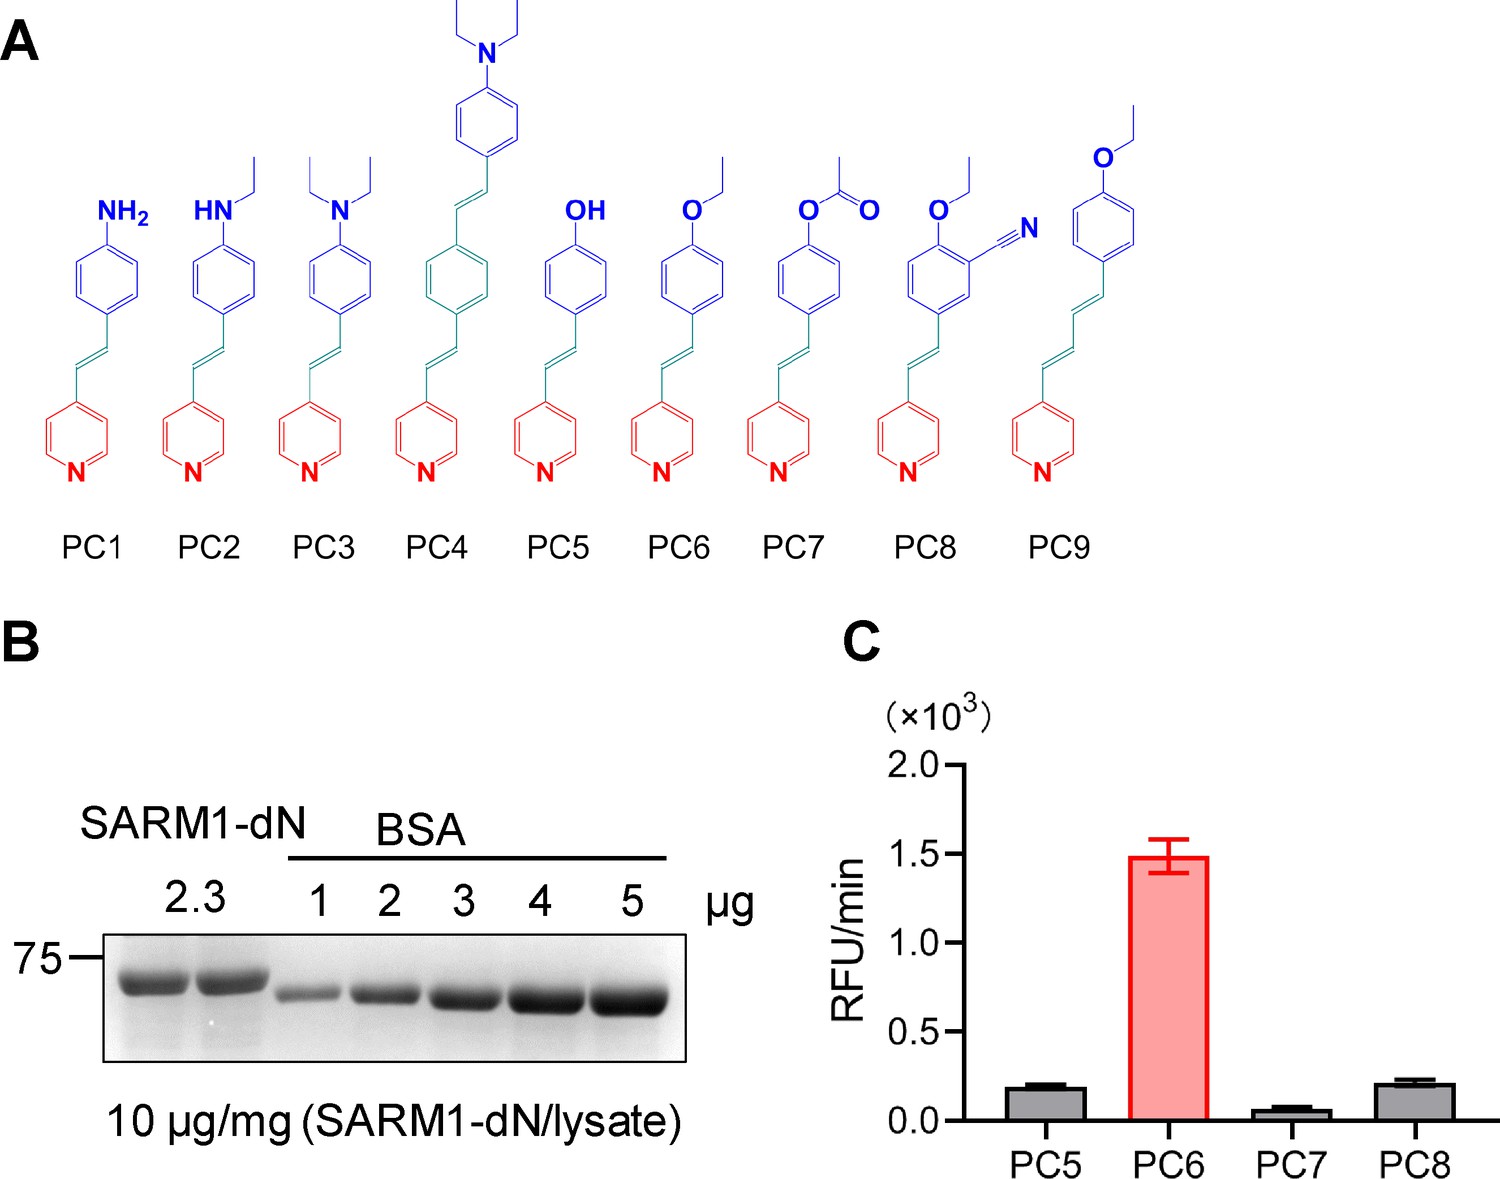
Structures of PC1–9 and activity screening.
(A) Chemical structures of PC1–9. (B) Quantification of SARM1-dN. SARM1-dN was pulled down by the BC2 nanobody (Zhao et al., 2019) conjugated beads, which efficiency was close to 100%. The purified SARM1-dN proteins were supplied to SDS-PAGE and Coomassie blue staining. The protein contents of SARM1-dN were calculated with a standard curve of BSA after intensity scanning. (C) The initial rates of the fluorescence increase at the maximal absorbance/emission wavelengths (PC5: 400 nm/530 nm; PC6: 390 nm/520 nm; PC7: 340 nm/445 nm; PC8: 375 nm/490 nm) catalyzed by SARM1-dN, in the presence of NMN, NAD, and PCs. PC = pyridine conjugate, NMN = nicotinamide mononucleotide.
Figure 1—figure supplement 12
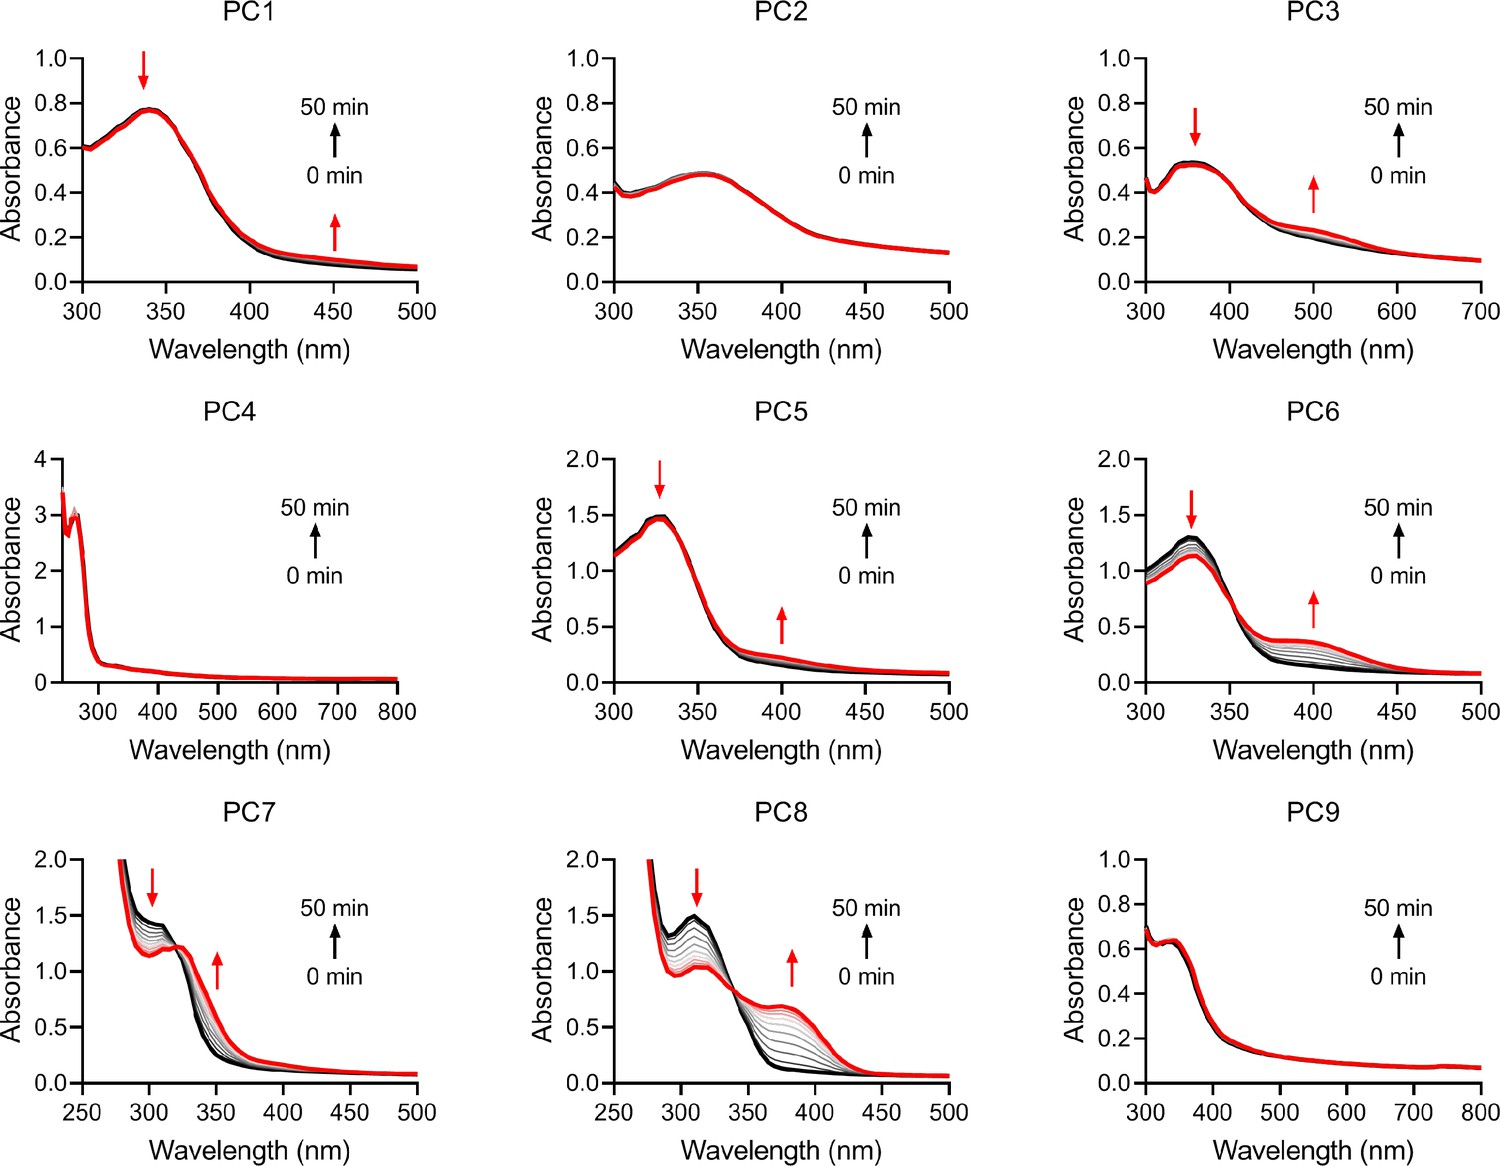
UV-vis absorption spectra scanning of the reactants.
The reactants of 50 μM PCs and 100 μM NAD during the 50 min reactions catalyzed by the activated SARM1.
Figure 1—figure supplement 13
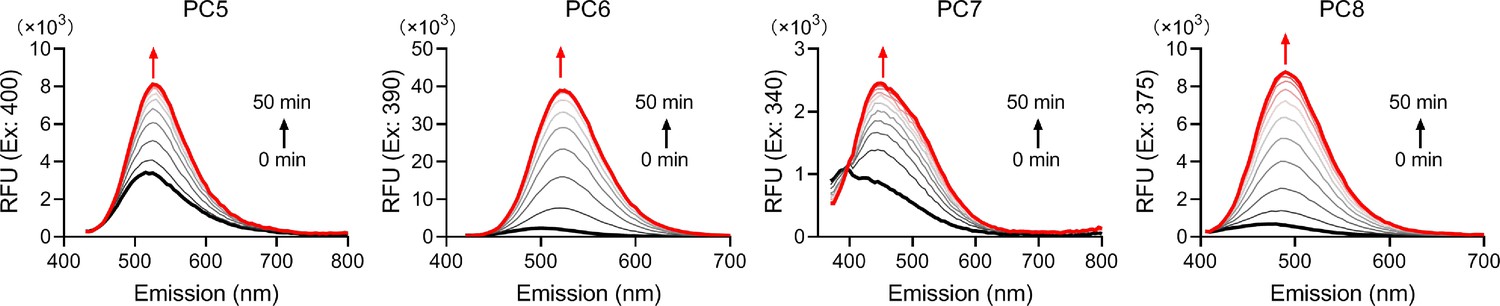
Fluorescence spectra of the reactants.
The reactants of 50 μM PCs and 100 μM NAD during the 50 min reactions catalyzed by the activated SARM1.
Figure 2 with 1 supplement
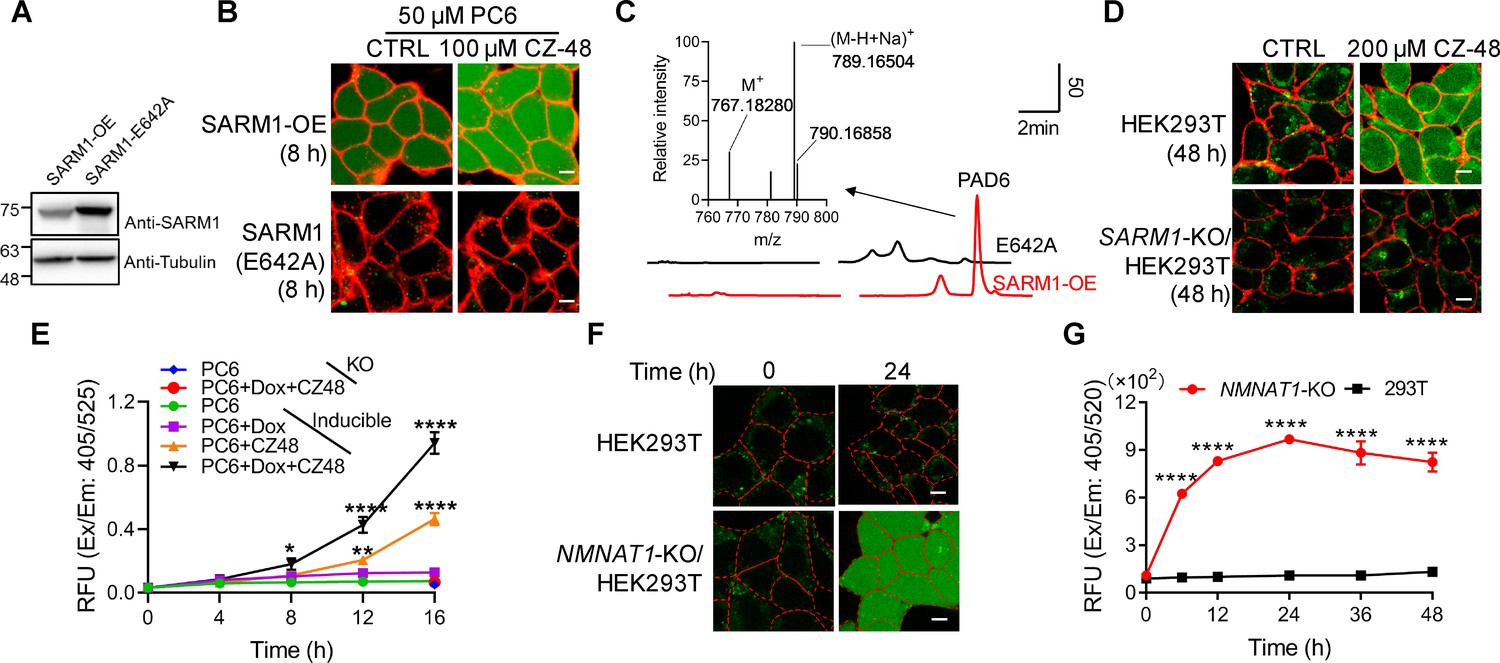
Live-cell imaging of SARM1 activation.
(A) Western blot of the overexpression of SARM1 and inactive mutant, E642A in HEK293 cells. (B) Confocal fluorescence images of cells in (A) after incubation with PC6 in presence or absence of CZ-48. Green: PAD6; red: ConA-Alex-647; (C) HPLC and MS analysis of PAD6 from SARM1-OE cells. The metabolites were extracted by 0.6 M PCA from the cells in (A) after treating with 50 μM PC6 for 24 hr. Inset: MS analysis. (D) Confocal images of wildtype, or SARM1-KO HEK293T cells with PC6 in presence or absence of CZ-48. (E) The HEK293 cells carrying the inducible SARM1 were incubated with 50 μM PC6 in presence or absence of 0.5 mg/mL Dox and/or 100 μM CZ-48. The PAD6 fluorescence was analyzed by flow cytometry. (F) Confocal images of NMNAT1-KO/HEK293 T cells, incubated with PC6. Cell edges were marked according to the bright-field images. (G) Quantification of the cell fluorescence in (F). All the above experiments were repeated at least three times (means ± SDs; n = 3; Student’s t-test, *p<0.05; **p<0.01, ****p<0.0001). Scale bar 10 μm.
-
Figure 2—source data 1
Source data in excel for Figure 2E and G.
- https://cdn.elifesciences.org/articles/67381/elife-67381-fig2-data1-v2.xlsx
Figure 2—figure supplement 1
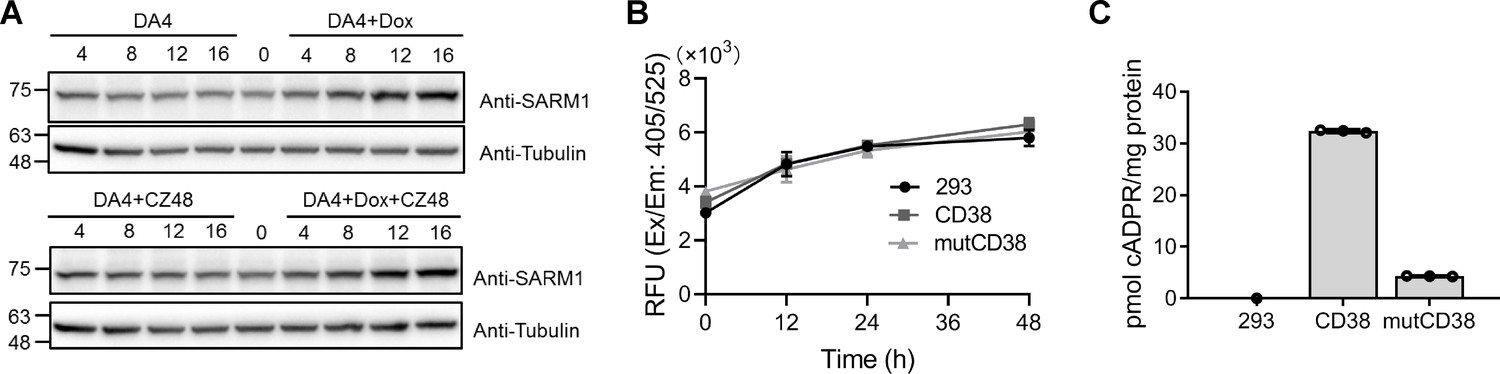
Expression level of SARM1 for Figure 2E and the activities of CD38.
(A) Western blots analysis of the expression of SARM1 in the inducible cell lines with or without treatment of 0.5 μg/mL Dox and 100 μM CZ-48 for the indicated time. (B) The HEK293T cells overexpressing wildtype and Type III mutant CD38 (mutCD38) (Liu et al., 2017; Zhao et al., 2012) were incubated with 50 μM PC6 for the indicated time and the fluorescence of PAD6 was analyzed in the flow cytometry. (C) The cellular cADPR levels in the cells (A) were measured by the cycling assay (Graeff and Lee, 2002). PC = pyridine conjugate, cADPR = cyclic ADP-ribose.
-
Figure 2—figure supplement 1—source data 1
Source data in excel for Figure 2—figure supplement 1B and C.
- https://cdn.elifesciences.org/articles/67381/elife-67381-fig2-figsupp1-data1-v2.xlsx
Figure 3 with 1 supplement
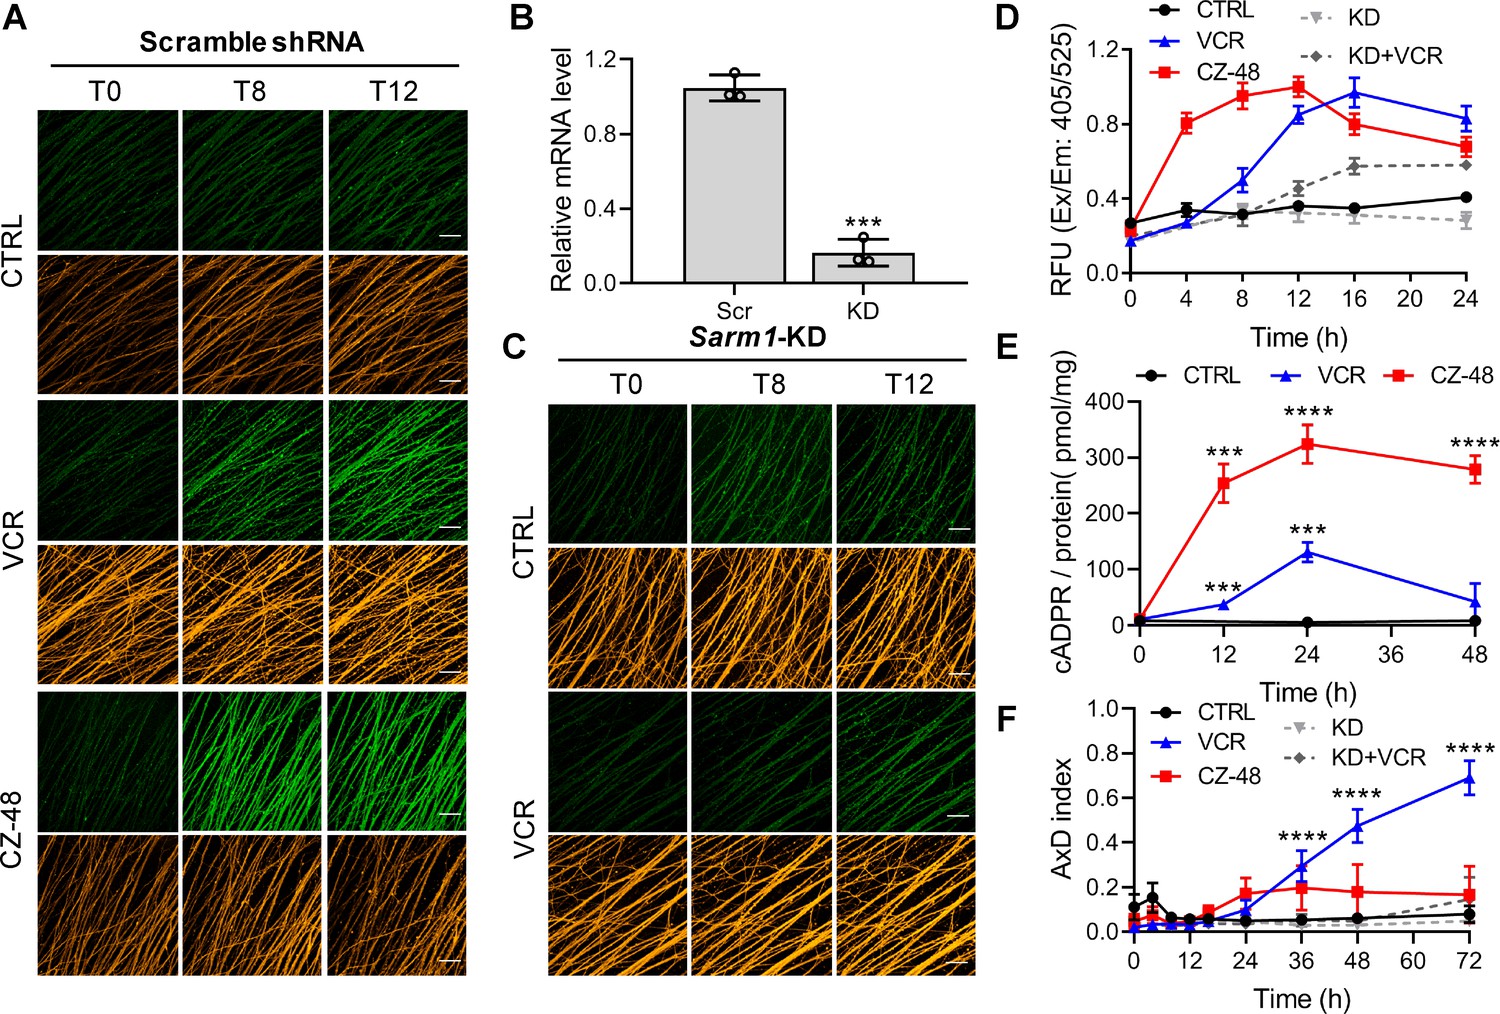
SARM1 activation in mouse DRG upon vincristine treatment.
(A, C) Confocal imaging of SARM1 activation in DRG neuronal axons. The neurons were infected with virus expressing TdTomato to provide easy imaging of the axons. Cells were additionally transfected with either scramble (A) or Sarm1-specific (C) shRNAs and treated with 50 μM PC6, 200 μM CZ-48, or 50 nM Vincristine and imaged in the indicated time points. Green: PAD6; orange: TdTomato; scale bar 50 μm. (B) Knockdown efficiency of Sarm1. Scr, scramble shRNA; KD, Sarm1-specific shRNA. (D) Quantification of the fluorescence intensity of PAD6 in DRGs. (E) Intracellular cADPR contents. (F) Indices of AxD. All the above experiments were repeated at least three times (means ± SDs; n = 3; Student’s t-test, ***p<0.001; ****p<0.0001). AxD = axon degeneration, cADPR = cyclic ADP-ribose, PC = pyridine conjugate, VCR = Vincristine.
-
Figure 3—source data 1
Source data in excel for Figure 3B, D-F.
- https://cdn.elifesciences.org/articles/67381/elife-67381-fig3-data1-v2.xlsx
Figure 3—figure supplement 1
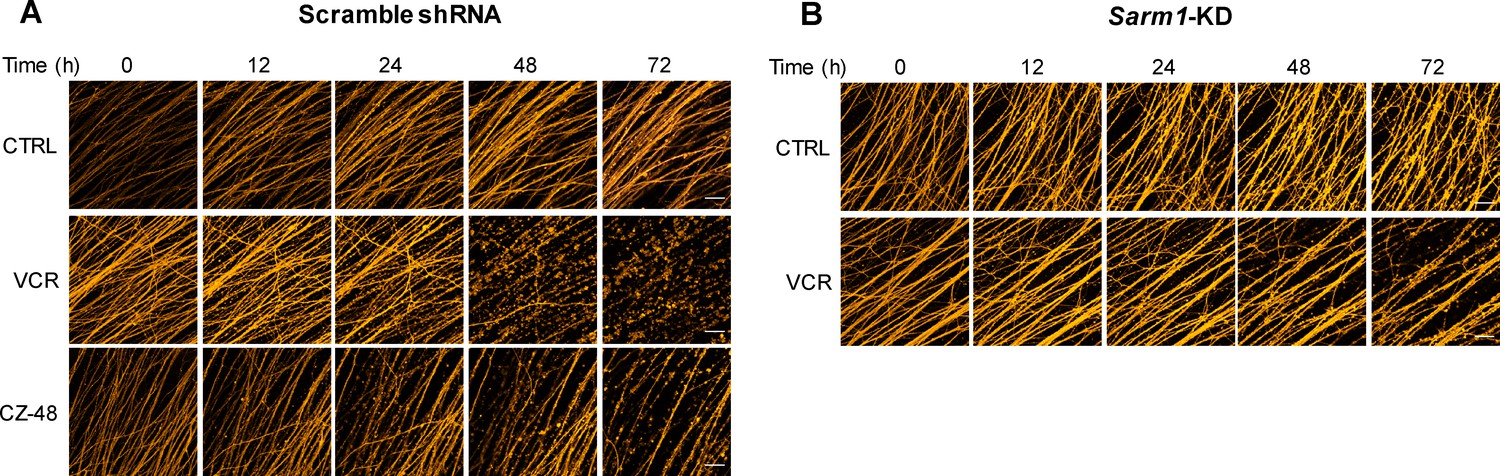
Integrity of axons visualized by the TdTomato fluorescence.
The DRG neurons, on div6, were infected with the lentivirus expressing TdTomato and scramble shRNA (A) or Sarm1-specific shRNA (B) and three days later, incubated with 50 nM VCR or 200 μM CZ-48 with 50 μM PC6. The photos of axons with TdTomato fluorescence were captured under the confocal microscope (Nikon, A1). Scale bar 50 μm. VCR = Vincristine.
Figure 4 with 1 supplement
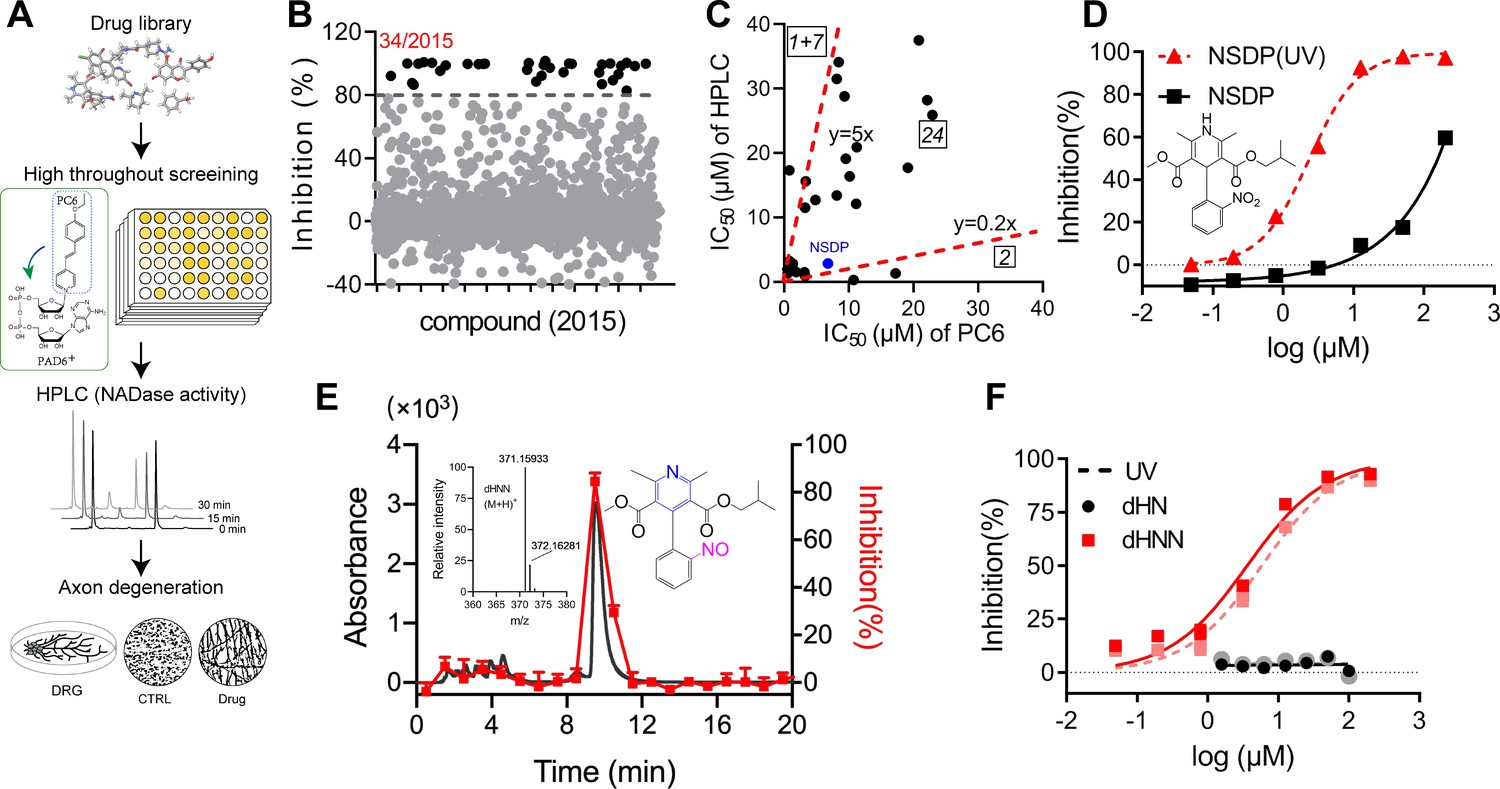
Identification of dHNN as an inhibitor of SARM1.
(A) Flowchart of the PC6-based high-throughput screening. (B) Inhibitory effects of the 2015 compounds (50 μM) from an approval drug library. The activity of drug-treated SARM1-dN was determined with PC6 assay. The detail procedure and statistical analysis are referred to the 'Materials and methods' section. (C) Plot of IC50s of the 27 most potent inhibitory compounds from high-throughput screening, determined by PC6 (x axis) versus by HPLC (y axis, NADase activity) assays. See 'Materials and methods' section. (D) Inhibition curves of NSDP before (black) and after (NSDP[UV], red) UV at 254 nm for 30 min. (E) HPLC elution profile of dHNN. NSDP after 30 min UV treatment was analyzed using a C-18 column with a gradient of 0.1% TFA and ACN in 0.1% TFA. Fractions were assayed for inhibition of SARM1-dN by PC6 assay. The derivative in the elution peak was identified by MS. Black line: absorbance at 275 nm; red dots: inhibition activity. Insets: MS of the peak fraction showing its mass was the same as dHNN and the chemical structure of dHNN. (F) Concentration-inhibition curves of dHN (black solid line), UV-treated dHN (black dotted line), dHNN (red solid line) and UV-treated dHNN (red dotted line), measured by PC6 assay. PC = pyridine conjugate, NSDP = nisoldipine .
-
Figure 4—source data 1
Source data in excel for Figure 4B-F.
- https://cdn.elifesciences.org/articles/67381/elife-67381-fig4-data1-v2.xlsx
Figure 4—figure supplement 1

Inhibitory mechanism of dHNN against SARM1.
(A) The inhibition curves of nicotinamide to SARM1-dN measured with PC6-based reaction. (B) HPLC analysis of NSDP after treating by UV at 275 nm for 20 min. Black: standard of NSDP; purple: NSDP after UV; red: standard of dHN; green: standard of dHNN. (C) The irreversibility of the inhibition of dHNN. SARM1-dN was pre-incubated with 20 μM dHNN or 5 mM Nam at rt for 20 min and washed using Centricon filter. Activity was analyzed afterward with PC6 assay. (D) Time-dependent inhibition of SARM1-dN by dHNN. SARM1-dN was incubated with 10 μM dHNN or 300 μM Nam for the indicated time and the activity was analyzed with PC6 assay. (E) Western blots of the cysteine-to-alanine mutants of SARM1. C215A and C226A show much lower protein expression, indicating the mutations seem to affect the stability, although the IC50s decreased to 30 μM and 11 μM, respectively, comparing to that of wildtype SARM1 (6 μM). Nam = nicotinamide, PC = pyridine conjugate, NSDP = nisoldipine.
-
Figure 4—figure supplement 1—source data 1
Source data in excel for Figure 4—figure supplement 1A-D.
- https://cdn.elifesciences.org/articles/67381/elife-67381-fig4-figsupp1-data1-v2.xlsx
Figure 5 with 4 supplements
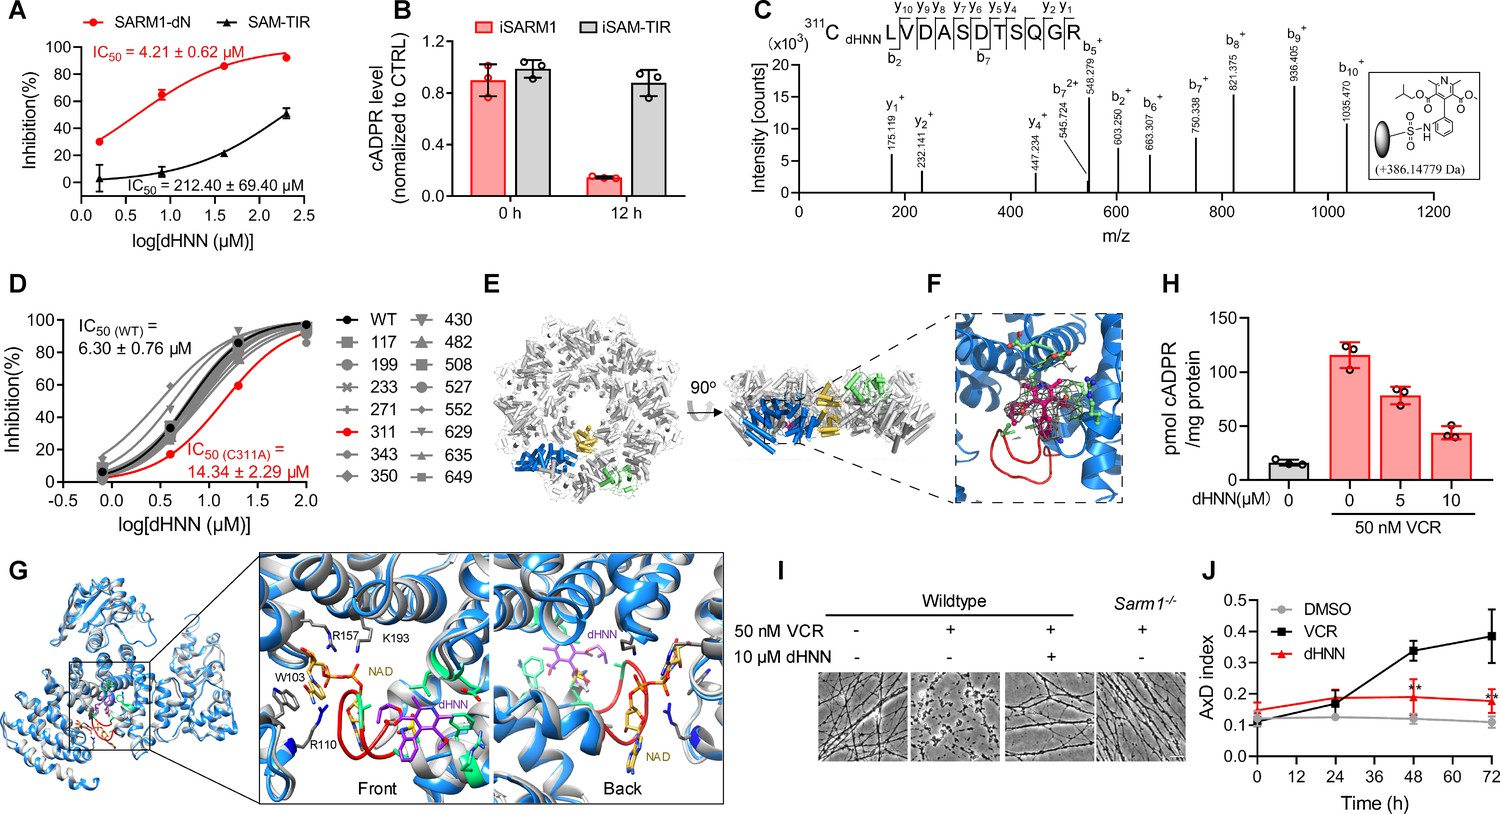
dHNN reduces AxD by inhibiting SARM1 through covalent modification of the cysteines.
(A) Inhibition of SARM1-dN and SAM-TIR by dHNN in vitro. See 'Materials and methods'. (B) Inhibition of SARM1-dN and SAM-TIR by dHNN in cellulo. See 'Materials and methods'. (C) MS of SARM1-dN modification by dHNN. Peptide spectrum match shows that Cys311 was modified by dHNN, increasing its mass to 386.14779 Da. (D) Each cysteine in SARM1-dN was mutated to alanine. The dHNN-IC50s were measured by PC6 assay. (E) Top (left) and side (right) view of the SARM1 octamer. α-helices are shown as cylinders. dHNN modifications are shown as sticks. One protomer is colored in blue for ARM, gold for SAM, and green for TIR. The other protomers are colored in grey. (F) Zoom-in view of the dHNN-modified pocket. dHNN: purple stick; the electron density corresponding to dHNN: grey mesh; interacting residues: green; loop: red. (G) Superposition of SARM1-dHNN onto SARM1-NAD (PDB: 7mc6). SARM1-dHNN and SARM1-NAD were shown as blue and grey cartoon, respectively. The insertion loop in SARM1-dHNN was shown in red. NAD was shown as stick models and colored with gold carbons. Residues interacting with NAD, W103, R110 and R157, were shown as stick models with grey carbons. dHNN and residues interacting with dHNN were shown as in (F). (H) DRG neurons were treated with dHNN for 16 hr in the presence of VCR. The cellular cADPR contents were measured. (I) Micrographs of AxD of DRG neurons after treatment of VCR in presence of dHNN for 72 hr. (J) Quantification of AxD indices after 0, 24, 48, 72 hr treatment with VCR as in (I). AxD = axon degeneration. VCR = Vincristine.
-
Figure 5—source data 1
Source data in excel for Figure 5A, B, D, H and J.
- https://cdn.elifesciences.org/articles/67381/elife-67381-fig5-data1-v2.xlsx
Figure 5—figure supplement 1
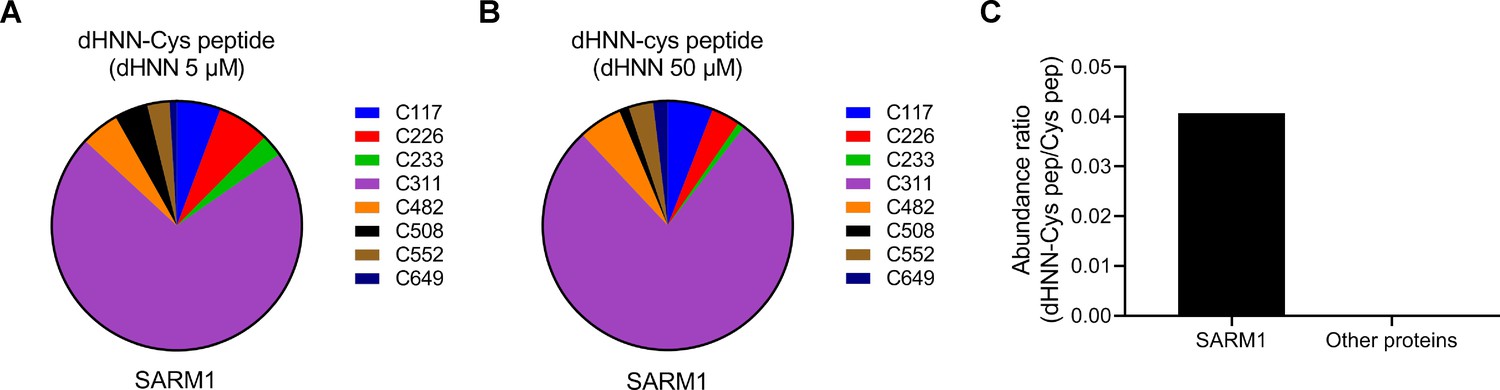
dHNN modifications on the peptides of SARM1 or nonspecific proteins analyzed by LC-MS/MS.
(A-B) Quantification of the intensity of the dHNN-modified peptides covering the indicated cysteine residues of SARM1 by LC-MS/MS following the treatment by 5 μM (A) and 50 μM (B) dHNN, and normalized with the intensity of the corresponding peptides. (C) The abundance ratio of dHNN-modified peptides to the total cysteine-containing peptides identified in SARM1 and other proteins by LC-MS/MS.
-
Figure 5—figure supplement 1—source data 1
Source data in excel of Figure 5—figure supplement 1A–C.
- https://cdn.elifesciences.org/articles/67381/elife-67381-fig5-figsupp1-data1-v2.xlsx
Figure 5—figure supplement 2
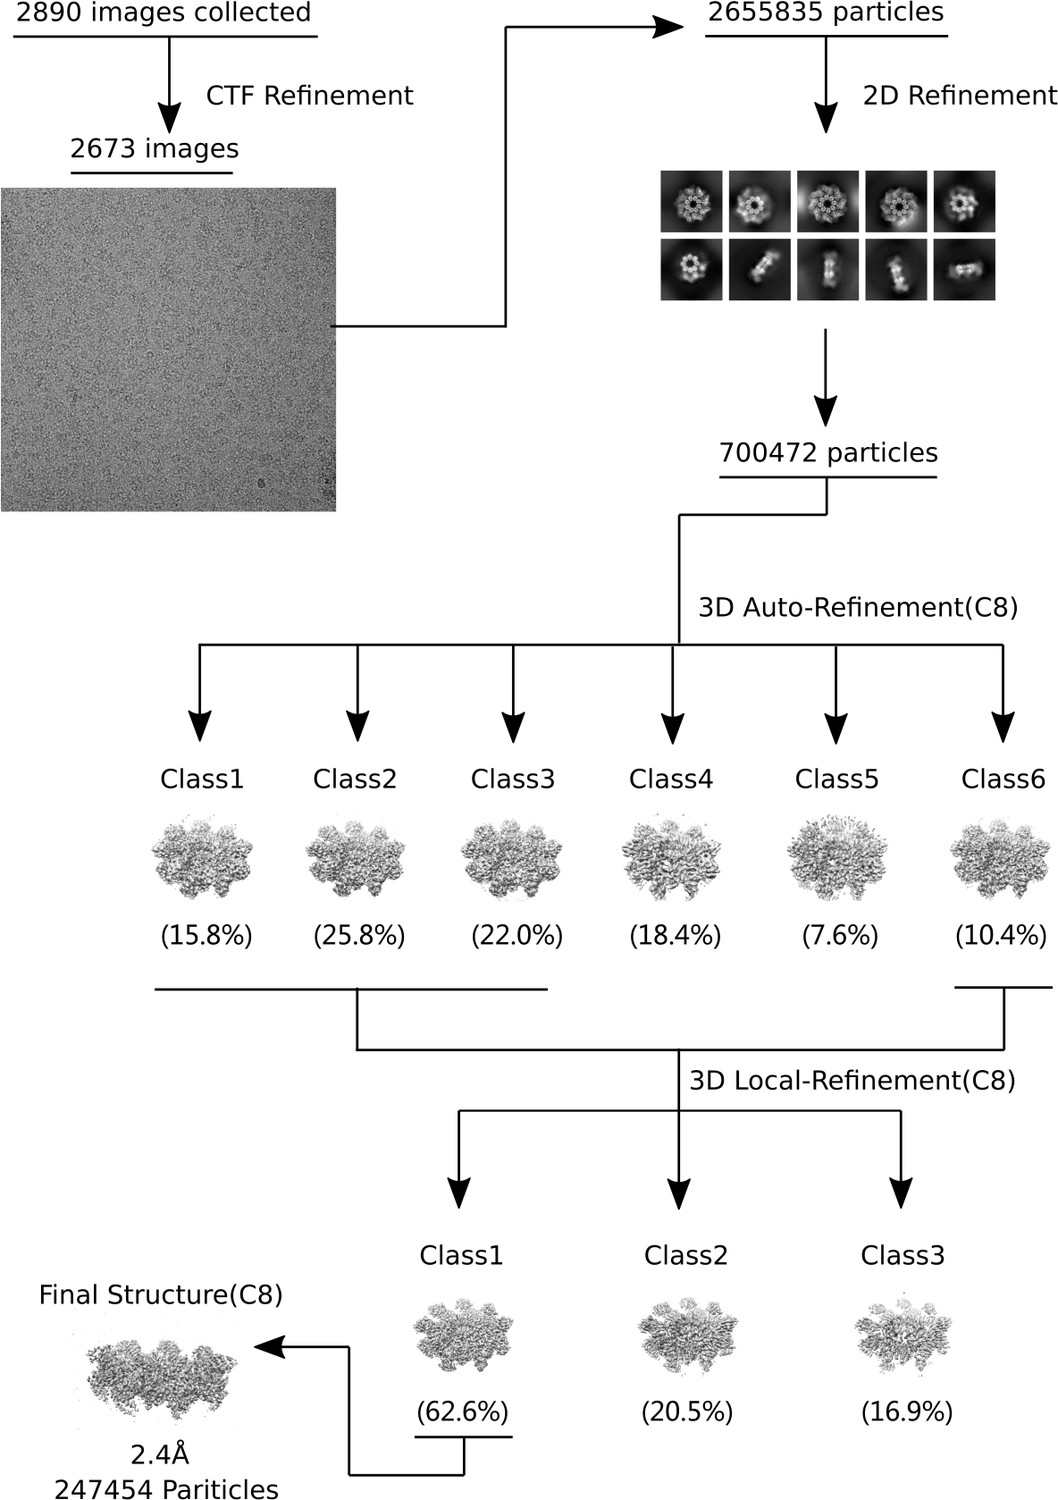
Data processing procedure for the SARM1-dHNN structure.
Figure 5—figure supplement 3

Structure of SARM1 was stabled in inactive form after dHNN treatment.
(A-B) Representative 2D class averages of SARM1-dN in the absence (A) or presence (B) of 50 μM dHNN in 100 mM Tris, 150 mM NaCl, and 1 mM EDTA at pH 8.0. (C) Local resolution estimation calculated by RELION for the 3D reconstruction of SARM1-dHNN. Left, top view; middle, bottom view; right, side view. (D) Density fit to the 3D reconstruction. (E) Superimposition of SARM1-dHNN onto SARM1-NAD (PBD codes 7cm6 and 7cm7) shows no obvious structural deviation. Left: octamer, blue for SARM1-dHNN, green for 7cm6, and grey for 7cm7; right, stereo view for the superimposition of one protomer in SARM1-dHNN and SARM-NAD (7cm6).
Figure 5—figure supplement 4
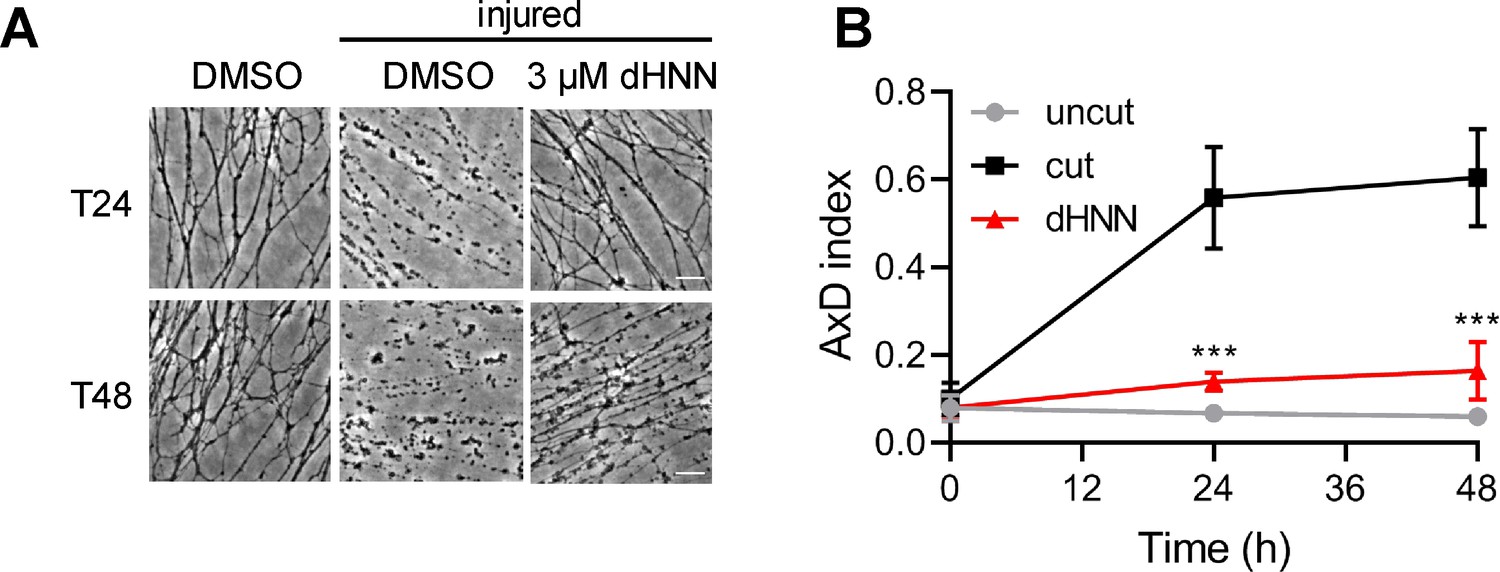
dHNN attenuated the axotomy-induced AxD.
DRG neurons were pre-treated with 3 μM dHNN for 0.5 hr and axotomy performed to induce AxD. Images were captured at 0, 24, 48 hr (A) and the AxD index was analyzed by ImageJ (B). AxD = axon degeneration.
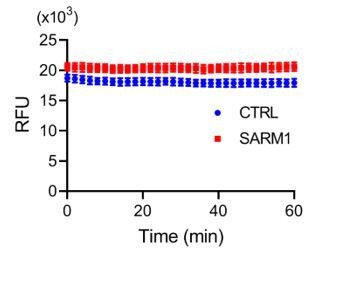
Author response image 1
Additional files
-
Supplementary file 1
Refinement statistics for the SAMR1-dHNN structure.
- https://cdn.elifesciences.org/articles/67381/elife-67381-supp1-v2.xlsx
-
Transparent reporting form
- https://cdn.elifesciences.org/articles/67381/elife-67381-transrepform-v2.docx
Download links
A two-part list of links to download the article, or parts of the article, in various formats.
Downloads (link to download the article as PDF)
Open citations (links to open the citations from this article in various online reference manager services)
Cite this article (links to download the citations from this article in formats compatible with various reference manager tools)
Permeant fluorescent probes visualize the activation of SARM1 and uncover an anti-neurodegenerative drug candidate
eLife 10:e67381.
https://doi.org/10.7554/eLife.67381


