β2-subunit alternative splicing stabilizes Cav2.3 Ca2+ channel activity during continuous midbrain dopamine neuron-like activity
- Department of Pharmacology and Toxicology, Institute of Pharmacy, Center for Molecular Biosciences Innsbruck, University of Innsbruck, Austria
- Department of Drug Science, NIS Centre, University of Torino, Italy
- Institute of Applied Physiology, University of Ulm, Ulm, Germany, Germany
- Institute for Zoology, Biocenter, University of Cologne, Germany
- Institute of Neurophysiology, University of Cologne, Germany
- Linacre College & New College, University of Oxford, United Kingdom
Figures
Figure 1 with 2 supplements
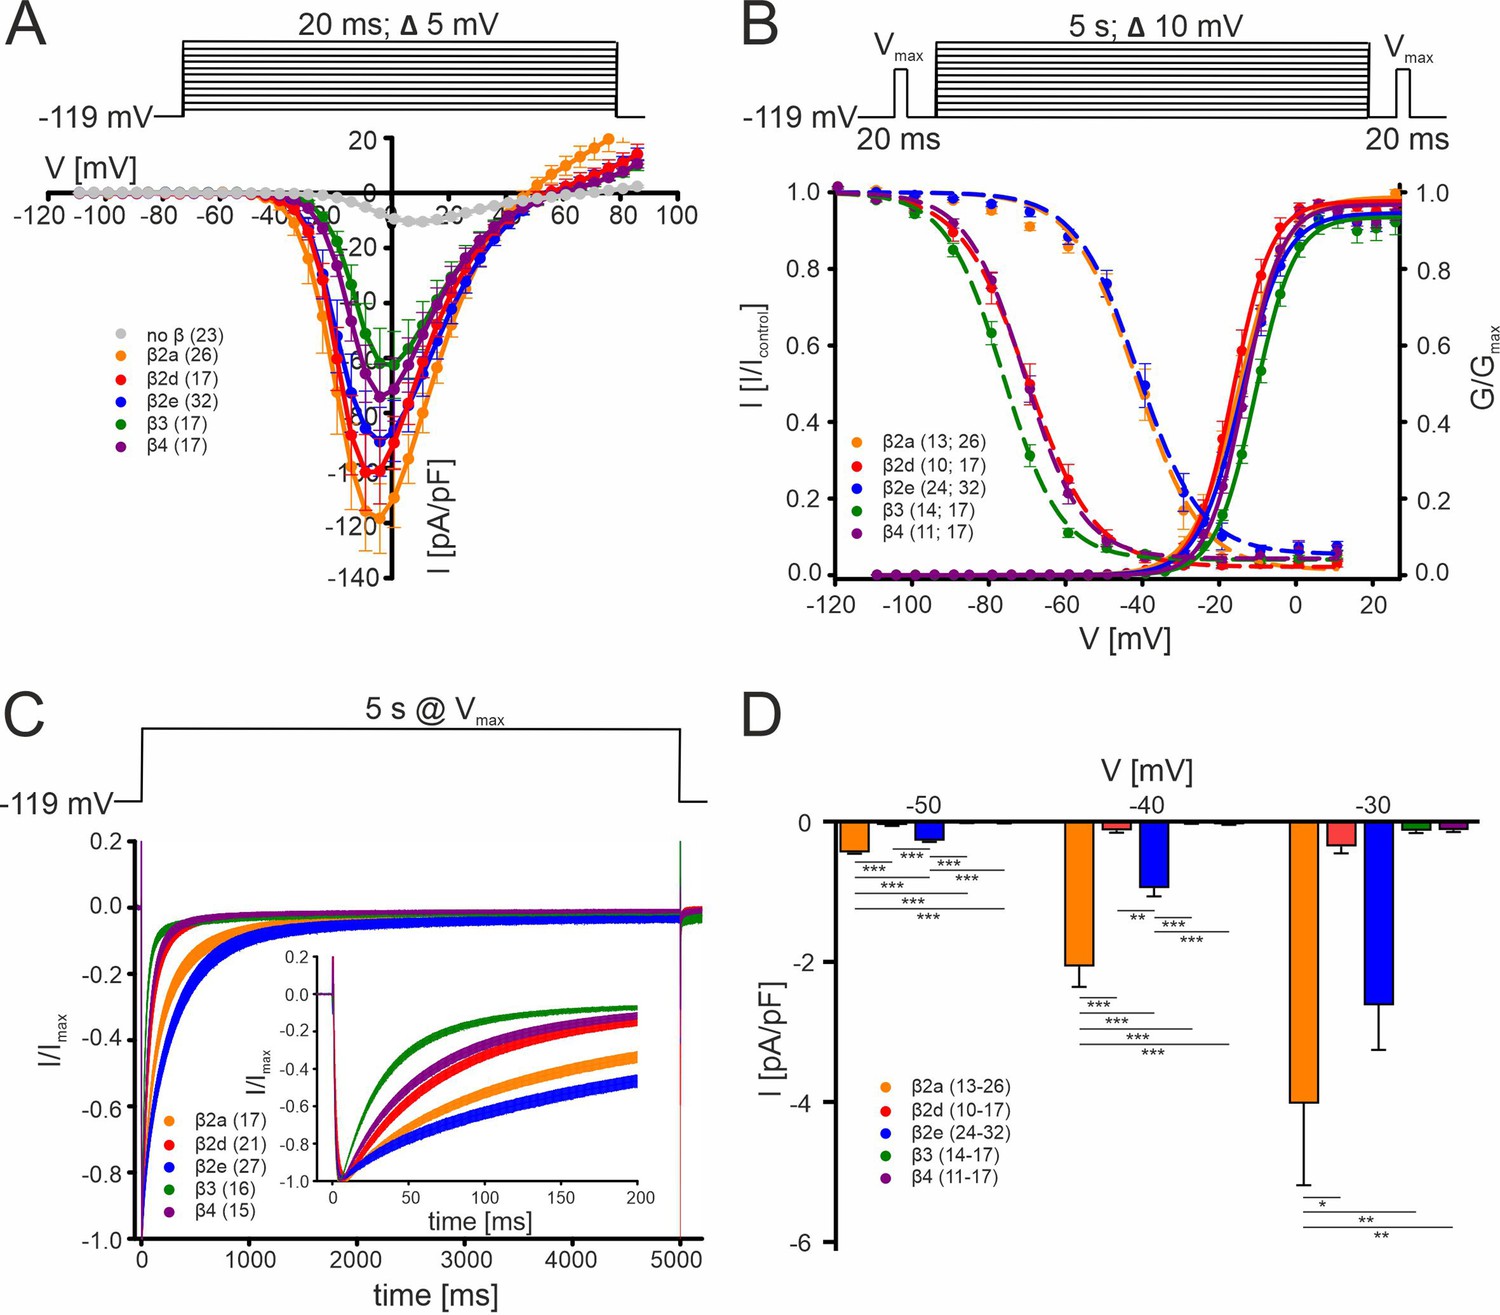
Biophysical properties of Cav2.3 channels co-transfected with different β-subunits (and α2δ1) in tsA-201 cells.
(A) Current densities (pA/pF) with or without (gray) co-transfection of indicated β-subunits. Color code and n-numbers are given in the graphs. (B) Voltage-dependence of steady-state activation (normalized conductance G, right axis, solid lines) and inactivation (normalized ICa of test pulses, left axis, dashed lines, left n-numbers in parentheses). (C) Inactivation time course during 5 s depolarizing pulses to Vmax starting from a holding potential of –119 mV. Inset shows the first 200 ms of the 5 s pulse. Respective stimulation protocols are shown above each graph. The curves represent the means ± SEM for the indicated number of experiments (N = β2a: 5; β2d, β2e: 2; β3, β4, no β: 3). For statistics see Table 1. Vmax, voltage of maximal inward current. (D) Window currents measured in the presence of the indicated β-subunits were calculated by multiplying mean current densities (pA/pF) of I-V-relationships by the fractional current inactivation from steady-state inactivation curves at the indicated voltages. Data represent the means ± SEM for the indicated number of experiments (N = β2a: 5; β2d, β2e: 2; β3, β4: 3). Statistical significance was determined using one-way ANOVA with Bonferroni post-hoc test and is indicated: *** p<0.001; ** p<0.01; * p<0.05. Source data provided in Figure 1—source data 1.
-
Figure 1—source data 1
Source data for data shown in Figure 1.
- https://cdn.elifesciences.org/articles/67464/elife-67464-fig1-data1-v4.xlsx
Figure 1—figure supplement 1
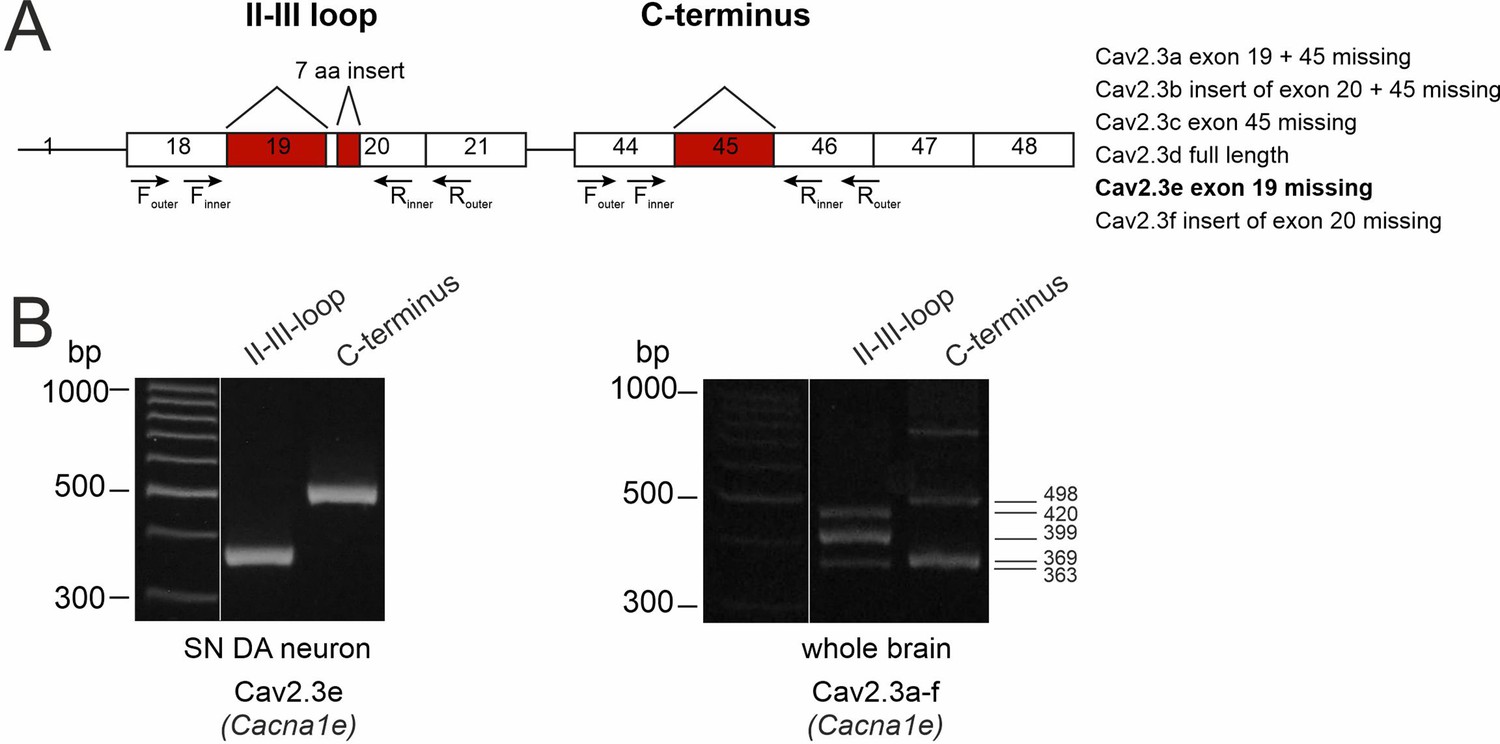
Determination of the expressed Cav2.3 splice variants in SN DA neurons.
(A) Cartoon of the exon structure of all Cav2.3 splice variants. The murine Cacna1e gene, coding for the Cav2.3 α1-subunits contains 48 exons with six major alternative splice variants (right panel). The splicing events include the variable use of exon 19, 21 nucleotides of exon 20 and exon 45. The outer and inner primer pairs chosen for identification of the different splice variants are located in the II-III loop and the C-terminus, covering the three described splicing sites. Expressed exons are shown as white boxes and splicing sites are indicated in red. (B). Agarose gel electrophoresis image showing two PCR products (363 bp II-III loop nested PCR fragment and 498 bp C-terminus nested PCR fragment) coding for the Cav2.3e splice variant of Cav2.3 (Cacna1e) found in mouse laser-dissected SN DA neuron derived cDNA (n=40, left). In contrast, all five PCR products (363 bp, 399 bp, and 420 bp in the II-III loop and 369 bp and 498 bp in the C-terminus nested PCR fragments) coding for all six major splice variants were found in whole brain tissue-derived cDNA (as positive control, right panel).
Figure 1—figure supplement 2
Effect of β2a palmitoylation on the biophysical properties of Cav2.3 and Cav1.3 Ca2+ channels in tsA-201 cells.
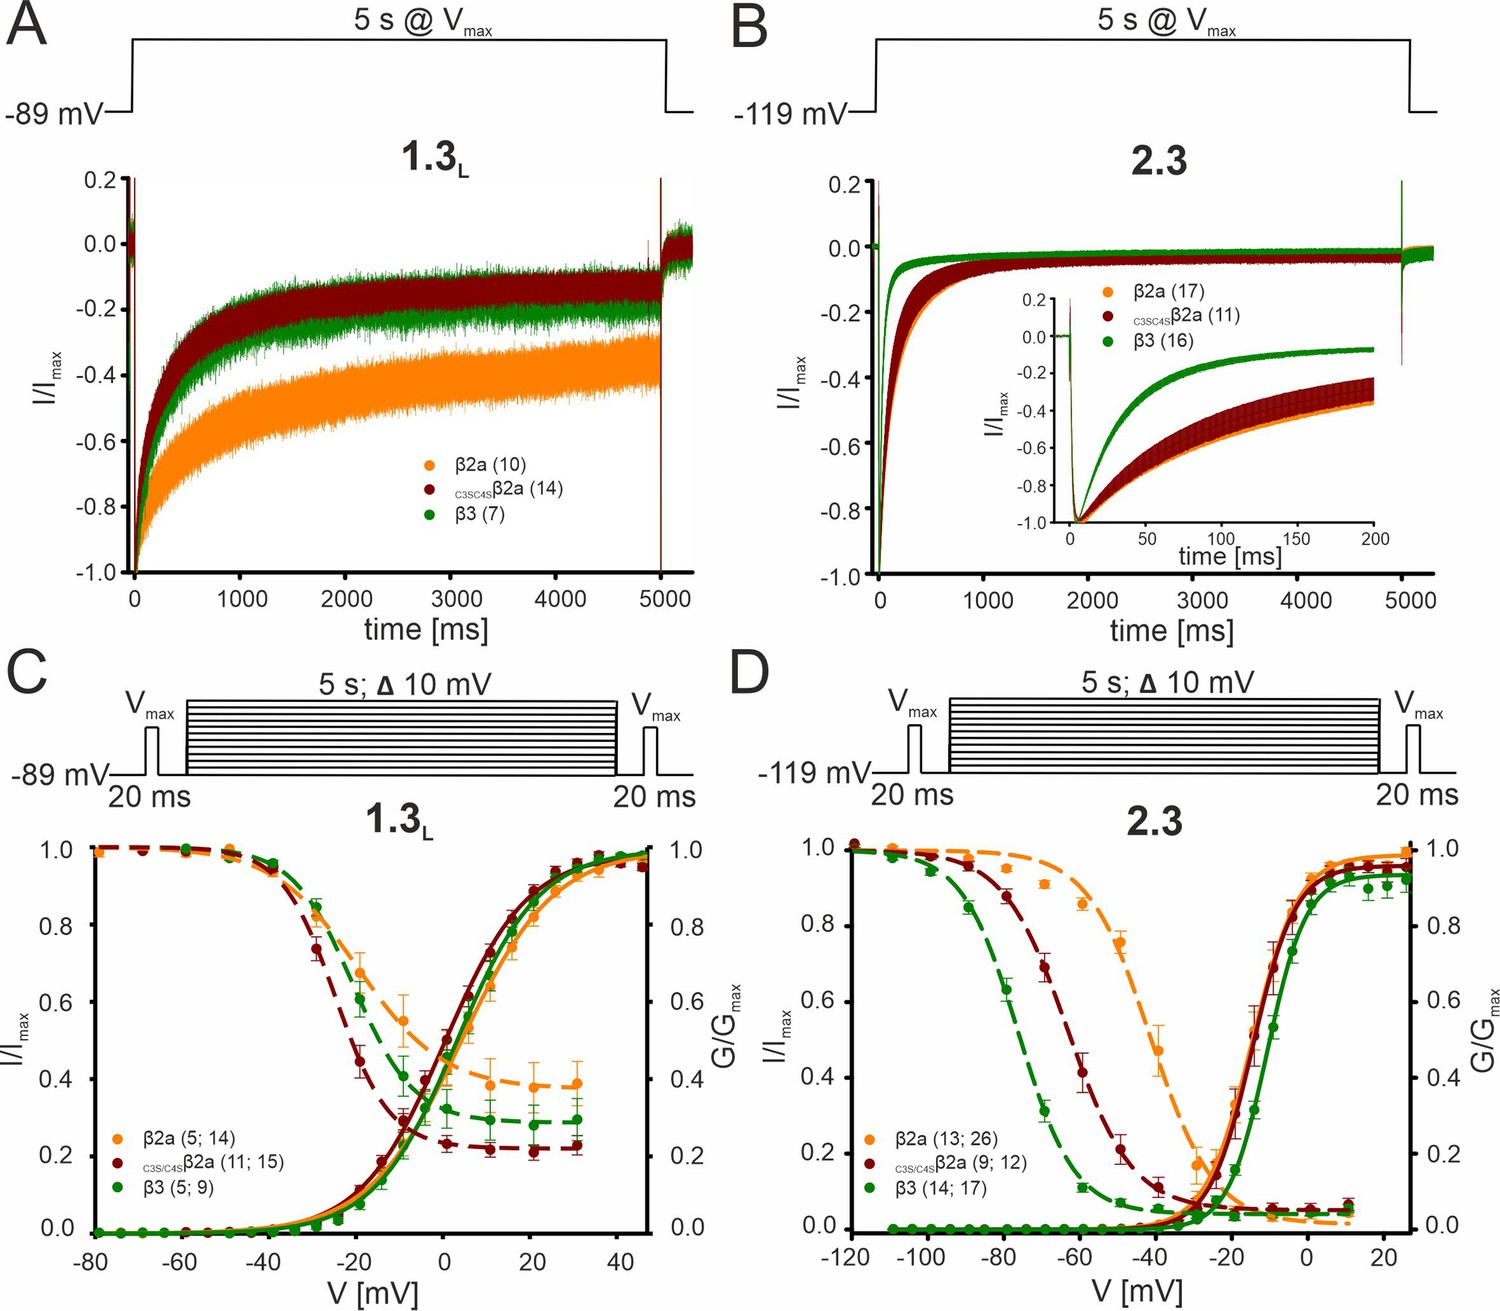
Since palmitoylation is reversible and regulated in an activity-dependent localized manner (Bijlmakers and Marsh, 2003; Matt et al., 2019), we also investigated the contribution of palmitoylation of β2a for Cav2.3e modulation under our experimental conditions. To mimic the de-palmitoylated form, we replaced the two N-terminal cysteines to serines (C3S/C4Sβ2a) which prevents plasma membrane anchoring of β2a (Gebhart et al., 2010; Qin et al., 1998). Data are shown for Cav1.3 (C-terminally long splice variant, Bock et al., 2011) or Cav2.3 α1-subunits co-expressed with α2δ1 and β2a (orange), C3S/C4Sβ2a (red) or β3 (green). Respective command voltages are given in each panel. To disrupt palmitoylation-mediated membrane anchoring, the two N-terminal cysteines of β2a (see Figure 2—figure supplement 1) were replaced by serines in C3S/C4Sβ2a. (A, B) Inactivation kinetics during a 5 s long depolarizing step to Vmax for Cav1.3L (A), 15 mM Ca2+, holding potential –89 mV or Cav2.3 (B), 2 mM Ca2+, holding potential –119 mV. Curves represent means ± SEM for the indicated number of experiments. For statistics see Table 1 and Supplementary file 6. (C, D) Voltage-dependence of activation (solid lines, normalized conductance G) and inactivation (dashed lines, normalized ICa of 20-ms test pulses) for Cav1.3L (C) 15 mM Ca2+, holding potential –89 mV or Cav2.3 (D), 2 mM Ca2+, holding potential –119 mV. Means ± SEM. For statistics see Table 1 and Supplementary file 6. C3S/C4Sβ2a significantly shifted V0.5,inact of Cav2.3 to more positive voltages as compared to β3 but to a much smaller extent (<14 mV) than β2a (+35 mV) (Table 1). Due to this prominent role of palmitoylation on the V0.5,inact of Cav2.3 channels, the palmitoylation state of β2a should allow further fine-tuning of non-inactivating current components of Cav2.3 channels in SN DA neurons. The effects of β2a palmitoylation on the inactivation kinetics and inactivation voltage of Cav1.3 L-type channels (A, C) were different from Cav2.3, suggesting that palmitoylation/depalmitoylation events would regulate Ca2+ channel function in a subtype-selective manner. Unlike β2a, C3S/C4Sβ2a was unable to slow the inactivation time course of Cav1.3, thus stabilizing faster inactivation similar to β3 (Supplementary file 6, Gebhart et al., 2010). In contrast, preventing palmitoylation of β2a did not affect the inactivation time course of Cav2.3e (Table 1). Moreover, unlike observed for Cav2.3, steady-state inactivation was not significantly different for Cav1.3 co-transfected with β2a, β3, or C3S/C4Sβ2a (Supplementary file 6). Source data provided in Figure 1—figure supplement 2—source data 1.
-
Figure 1—figure supplement 2—source data 1
Source data for data shown in Figure 1—figure supplement 2.
- https://cdn.elifesciences.org/articles/67464/elife-67464-fig1-figsupp2-data1-v4.xlsx
Figure 2 with 2 supplements
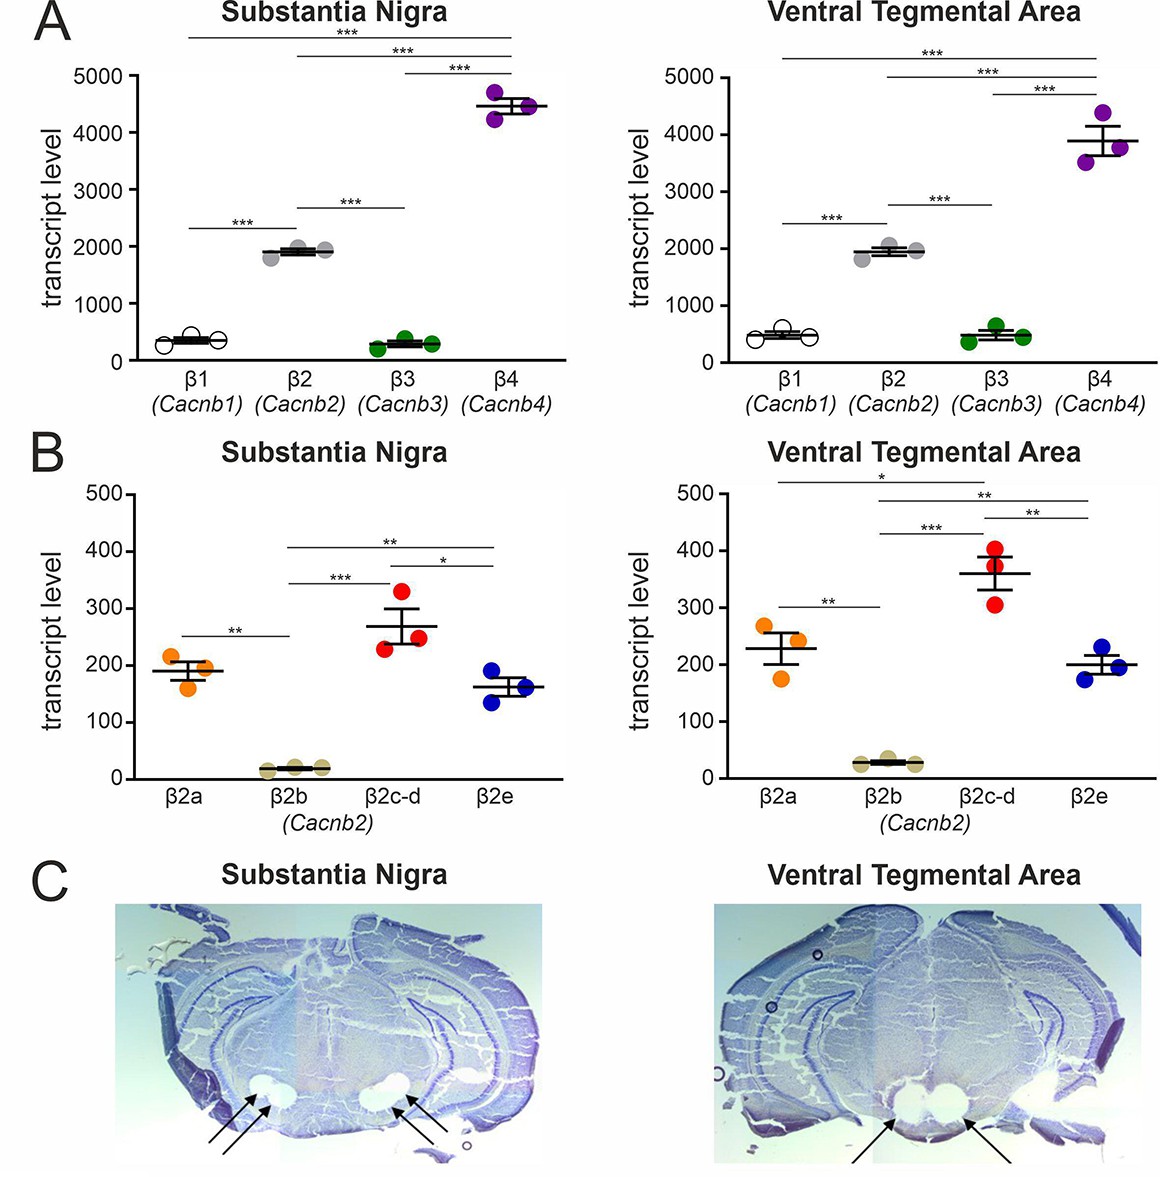
Transcript expression of various β-subunits and β2-subunit splice variants in mouse SN and VTA tissue.
(A) Expression of β1-β4 subunit transcripts in SN (n=3, N=3) (left) and VTA (n=3, N=3) (right) determined by RT-qPCR as described in Methods. (B) Expression of β2a-β2e subunit transcripts in SN (n=3, N=3) (left) and VTA (n=3, N=3) (right). Data are shown as the mean ± SEM. Statistical significance was determined using one-way ANOVA followed by Bonferroni post-hoc test: *** p<0.001; *p P<0.01; * p<0.05. Data was normalized to Gapdh and Tfrc determined by geNorm. (C) Example for four SN (left) and two VTA (right) tissue punches obtained for cDNA preparation with diameters of 0.5 mm each (left) or 0.8 mm each (right) from 7 to 8 successive 100-μm-sections between Bregma –3.00 mm and –3.80 mm, stained with Cresyl violet. Source data provided in Figure 2—source data 1.
-
Figure 2—source data 1
Source data for data shown in Figure 2.
- https://cdn.elifesciences.org/articles/67464/elife-67464-fig2-data1-v4.xlsx
Figure 2—figure supplement 1
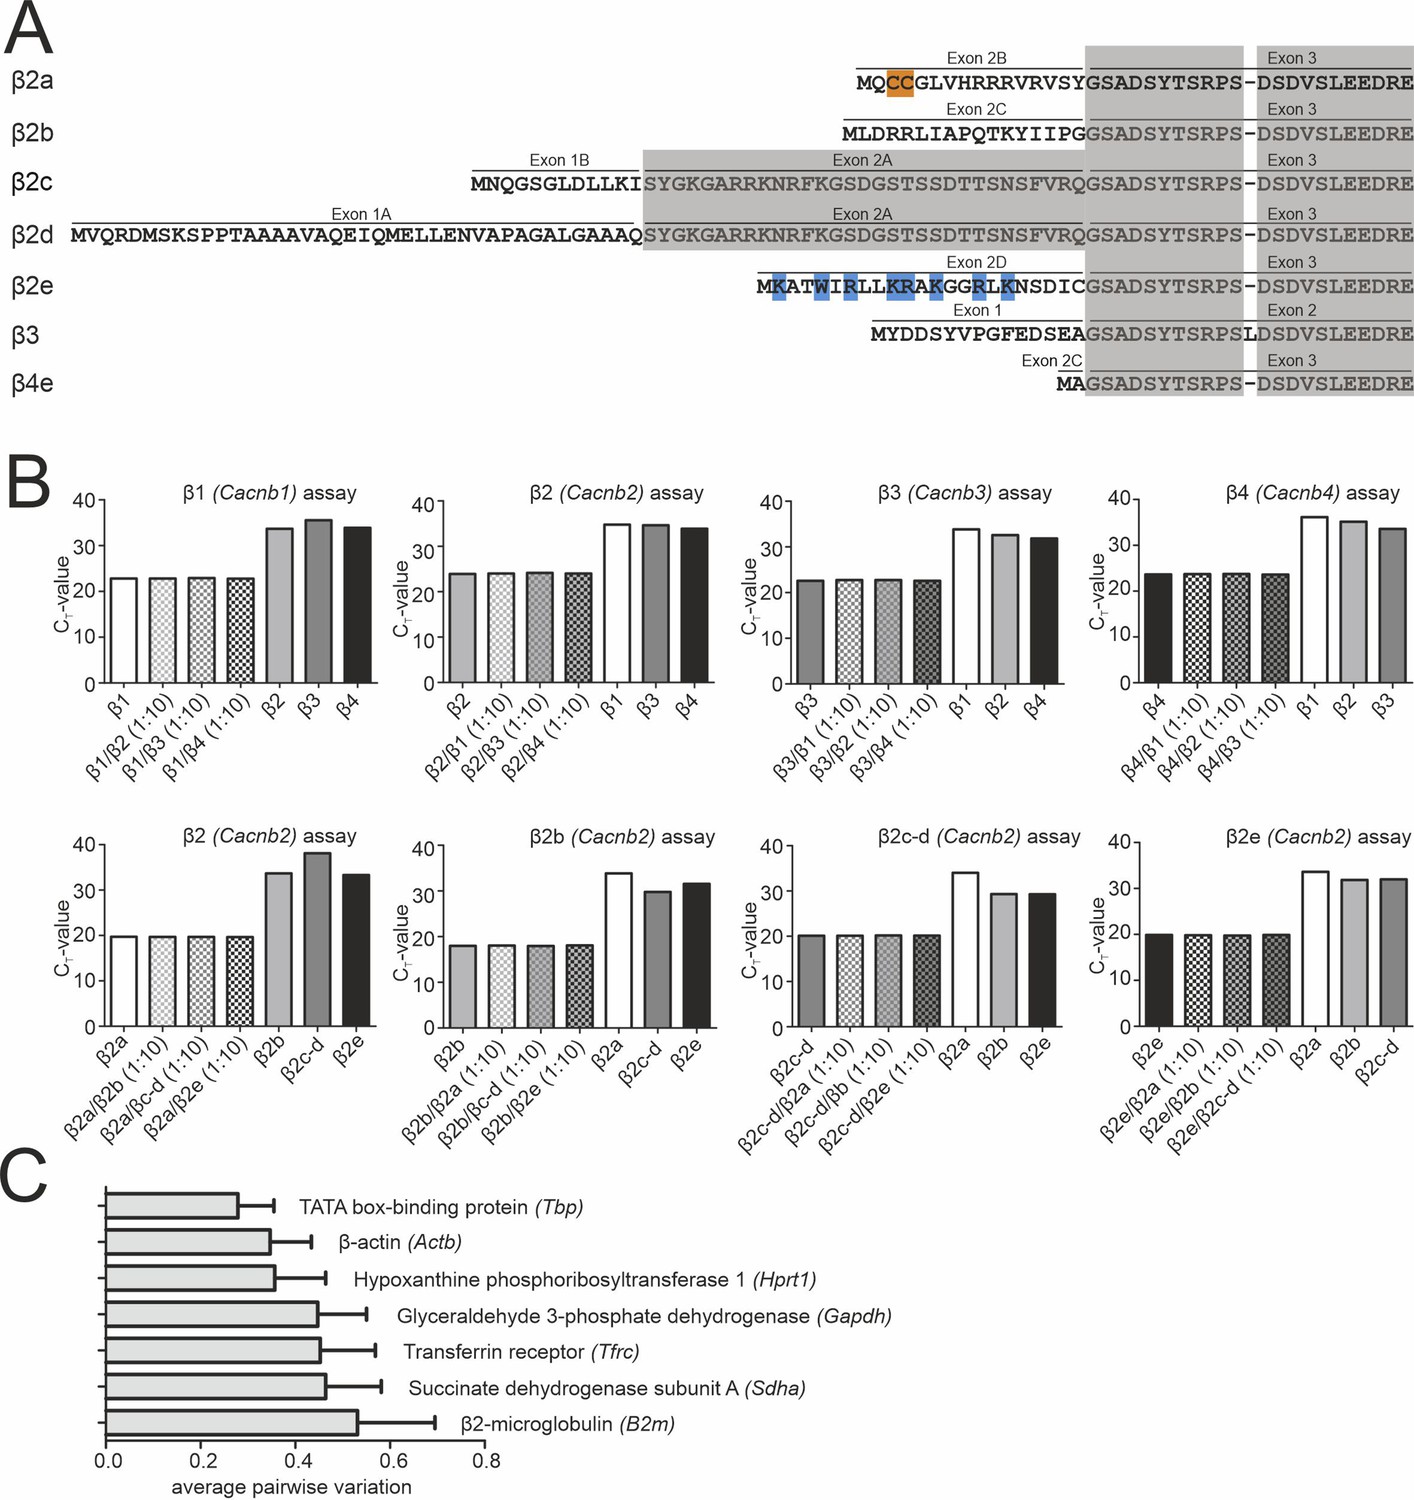
Binding specificity of β1-β4 and β2a-β2e TaqMan assays and expression stability of endogenous control genes.
(A) Alignment of the N-terminal amino acid sequence of the investigated β-subunits (β2a, β2d, β2e, β3, or β4). Residues responsible for membrane anchoring of β2a (palmitoylated cysteine residues are highlighted in orange) and β2e (positively charged amino acids forming a lipid binding motif are highlighted in blue) are indicated. Homologous exons are shaded in gray. Sequence accession numbers (human CACNB2 (β2) splice variants): β2a (NP_000715.2), β2d (NP_963887.2), β2e (NP_963864.1), β3 (NP_000716.2), β4e (NP_001307651.1). (B) The indicated β-subunit isoforms (β1-β4; n=3; gene names in parenthesis) and β2 splice variants (n=3) were recognized with high specificity (low CT value) by the corresponding RT-qPCR assay even in the presence of a 10-fold higher concentration of the mismatching DNA fragments corresponding to other isoforms/splice variants (β1–4: n=1; β2 splice variants: n=1). High binding specificity was confirmed by inefficient detection (high CT value) of all non-matching DNA fragments. We additionally performed experiments with a mixture of the specific with mismatching β-subunit DNA at ratios of 1:1, 1:2, and 1:5, and only the 1:10 mix is shown (similar CT values for all combinations). (C) Average expression stability of endogenous control genes in SN and VTA tissue. All reference genes maintained comparable cDNA concentrations throughout the experiments. Data were normalized to the expression of Glyceraldehyde 3-phosphate dehydrogenase (Gapdh) and Transferrin receptor (Tfrc) determined by geNorm. Data are given as means ± SEM (n=6, N=6). Source data provided in Figure 2—figure supplement 1—source data 1.
-
Figure 2—figure supplement 1—source data 1
Source data for data shown in Figure 2—figure supplement 1B and C.
- https://cdn.elifesciences.org/articles/67464/elife-67464-fig2-figsupp1-data1-v4.xlsx
Figure 2—figure supplement 2

Expression of β2-subunit splice variants in UV-LMD SN DA neurons.
(A) Left: Overview of a cresyl violet (CV) stained coronal midbrain section of a juvenile wildtype mouse after UV-LMD of 10 SN DA neurons (scale bar: 250 μm, upper). Image of one CV stained SN DA neuron of a juvenile wildtype mouse before and after UV-LMD (scale bar: 10 μm, lower). Middle: β2-subunit transcript relative mRNA quantification by reverse transcription quantitative PCR-based in UV-LMD mouse SN DA neurons (n=10). Right: Capillary gel electrophoresis image illustrating PCR products of β2-subunit (Cacnb2) splice variants amplified from a UV-LMD cDNA template corresponding to 2.9 cells. (B) Left: Representative images showing β2a and β2e (red) or tyrosine hydroxylase (TH (Th), green) RNAscope fluorescence signals (combined with nuclear DAPI staining, blue) of individual SN DA neurons from an adult wildtype mouse. Scale bar: 5 μm. Right: Absolute mRNA transcript numbers per cell for β2 (Cacnb2) - variants β2a or β2e in adult SN DA and VTA DA neurons of adult wildtype mice (N=6, each), as indicated. Tukey’s boxplots are shown. Significances are indicated by asterisks: *** p<0.001, **** p<0.0001. For statistics see details in Supplementary file 4. Source data provided in Figure 2—figure supplement 2—source data 1.
-
Figure 2—figure supplement 2—source data 1
Source data for data shown in Figure 2—figure supplement 2A and B.
- https://cdn.elifesciences.org/articles/67464/elife-67464-fig2-figsupp2-data1-v4.xlsx
Figure 3
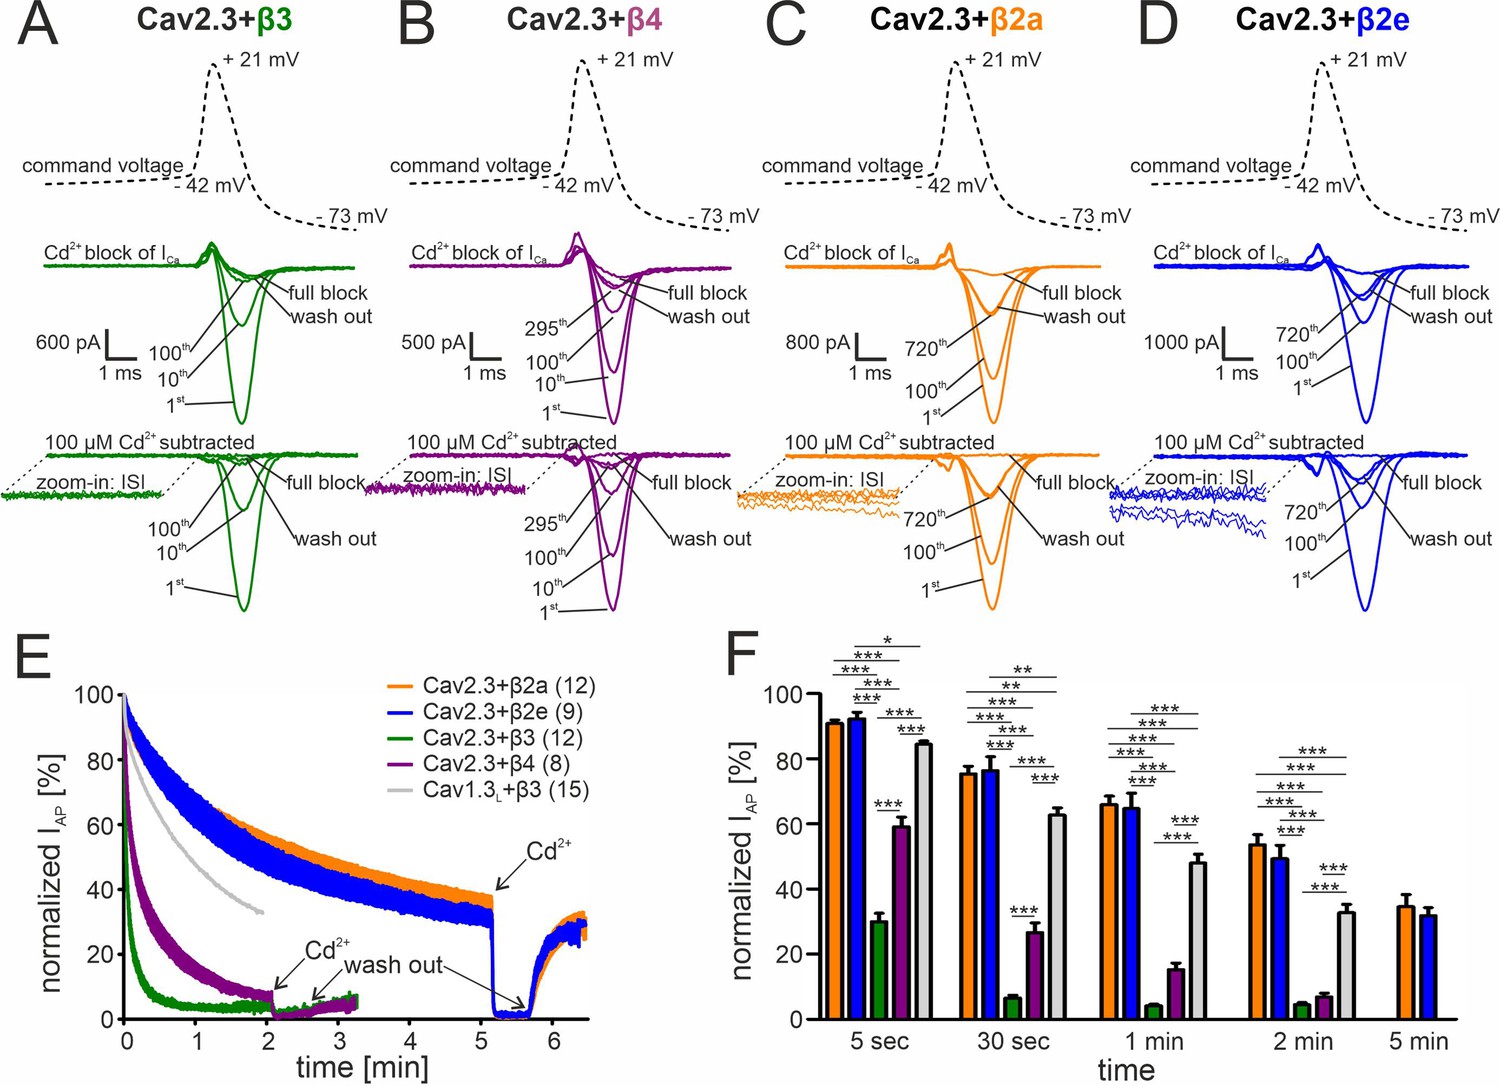
Activity-dependent inactivation of Cav2.3 channels co-transfected with different β subunits (and α2δ1) during simulated SN DA neuron regular pacemaking activity in tsA-201 cells.
(A–D) Top panel: The SN DA neuron-derived command voltage was applied with a frequency of 2.5 Hz (only a time interval around the AP-spike is shown). Middle panel: Corresponding representative Ca2+ current traces (2 mM charge carrier) for Cav2.3 channels co-expressed with α2δ1 and β3 (A, green), β4 (B, purple), β2a (C, orange), or β2e (D, blue) are shown for the indicated sweep number (1st, 10th, 100th, 295th, 720th). Cav2.3 currents were completely blocked by 100 μM Cadmium (Cd2+), and remaining Cd2+-insensitive current components were subtracted off-line (bottom panel). ISI, interspike interval. (E) Current decay during simulated 2.5 Hz SN DA neuron pacemaking. Normalized peak inward current during APs (IAP) is plotted against time as mean ± SEM for the indicated number of experiments. IAP amplitudes were normalized to the IAP amplitude of the first AP after holding the cell at –89 mV. Cav1.3L co-expressed with α2δ1 and β3 (gray, mean only) is shown for comparison (data taken from Ortner et al., 2017). The IAP decay was fitted to a bi-exponential function (Cav2.3 β3: Aslow = 39.4% ± 0.65 %, τslow = 22.2 ± 0.15 min, Afast = 54.2 ± 0.76 %, τfast = 2.86 ± 0.07 min, non-inactivating=4.47% ± 0.13%; β4: Aslow = 48.5 ± 0.26 %, τslow = 90.3 ± 1.07 min, Afast = 41.8 ± 0.40 %, τfast = 8.39 ± 0.16 min, non-inactivating=5.12% ± 0.12%; β2a: Aslow = 52.6 ± 0.47 %, τslow = 299.3 ± 10.2 min, Afast = 13.4 ± 0.53 %, τfast = 18.2 ± 1.47 min, non-inactivating=32.3% ± 0.77%; β2e: Aslow = 67.7 ± 0.11 %, τslow = 294.1 ± 1.77 min, Afast = 7.10.0±0.27 %, τfast = 16.6 ± 1.24 min, non-inactivating=25.0% ± 0.12%). Curves represent the means ± SEM for the indicated number of experiments (independent transfections, N=Cav2.3/β3: 4; Cav2.3/β4: 2; Cav2.3/β2a: 4; Cav2.3/β2e: 2; Cav1.3L/β3: 6). (F) Normalized IAP decay after predefined time points for Cav2.3 with β3, β4, β2a or β2e, and Cav1.3L (with β3). Color-code and n-numbers as in panel E. Statistical significance was determined using one-way ANOVA followed by Bonferroni post-hoc test: *** p<0.001; ** p<0.01; * p<0.05. Source data provided in Figure 3—source data 1.
-
Figure 3—source data 1
Source data for data shown in Figure 3.
- https://cdn.elifesciences.org/articles/67464/elife-67464-fig3-data1-v4.xlsx
Figure 4
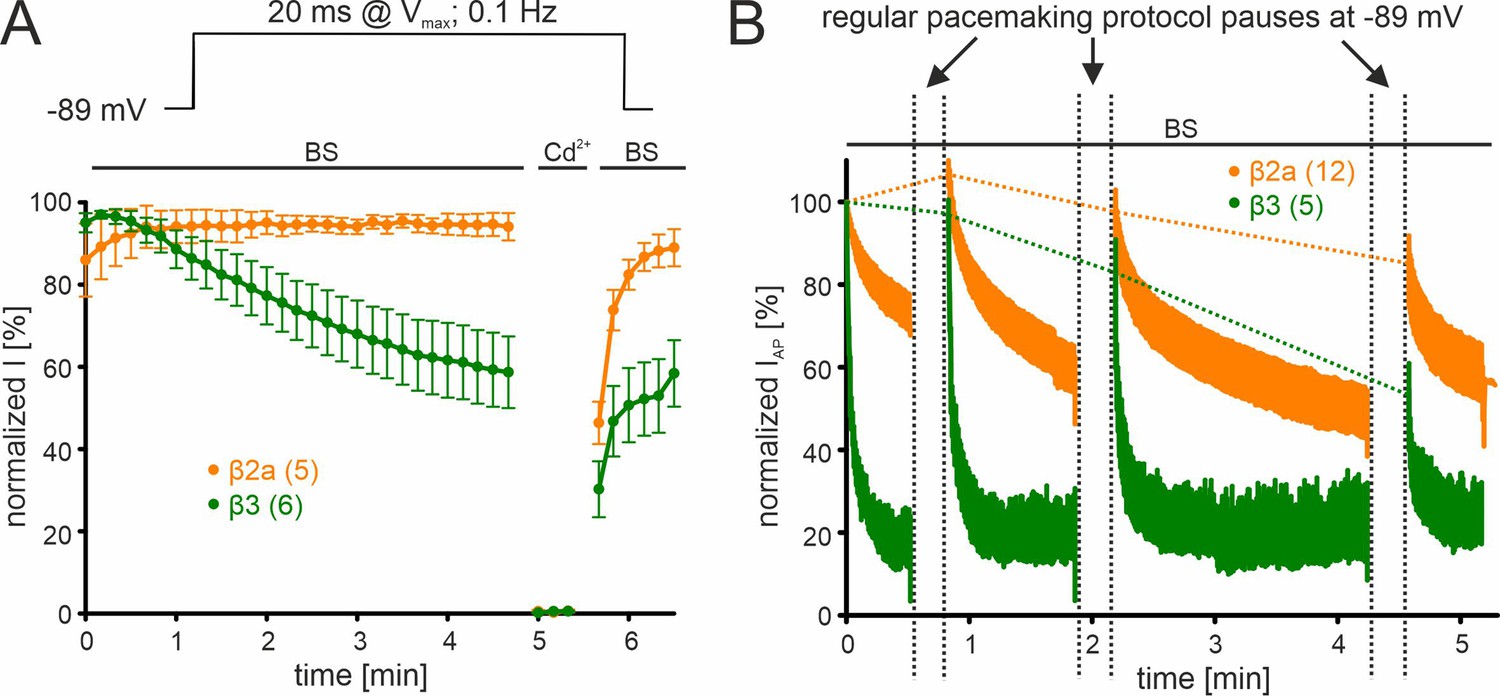
β-subunit-dependent run-down of Cav2.3 channel Ca2+ current in tsA-201 cells.
Data for Cav2.3 co-expressed with α2δ1 and β2a (orange) or β3 (green) are shown. (A). Run-down during a 0.1 Hz square pulse protocol (20 ms to Vmax, holding potential –89 mV). Currents were normalized to the ICa of the sweep with the maximal peak inward current observed during the recording. After a full block with 100 µM Cd2+ currents recovered to the amplitude preceding the Cd2+ application. (B) Cells were held at –89 mV and then stimulated using the regular SN DA neuron pacemaking protocol for 30 s, 1 min, and 2 min each followed by 20 s long pauses (vertical dashed lines) at hyperpolarized potentials (–89 mV) to allow channel recovery from inactivation. IAP of individual APs was normalized to the inward current of the first AP. The current run-down component can be estimated from the non-recovering current component (horizontal dashed lines). Traces represent means ± SEM from the indicated number of experiments (N=2). BS, bath solution.
Figure 5
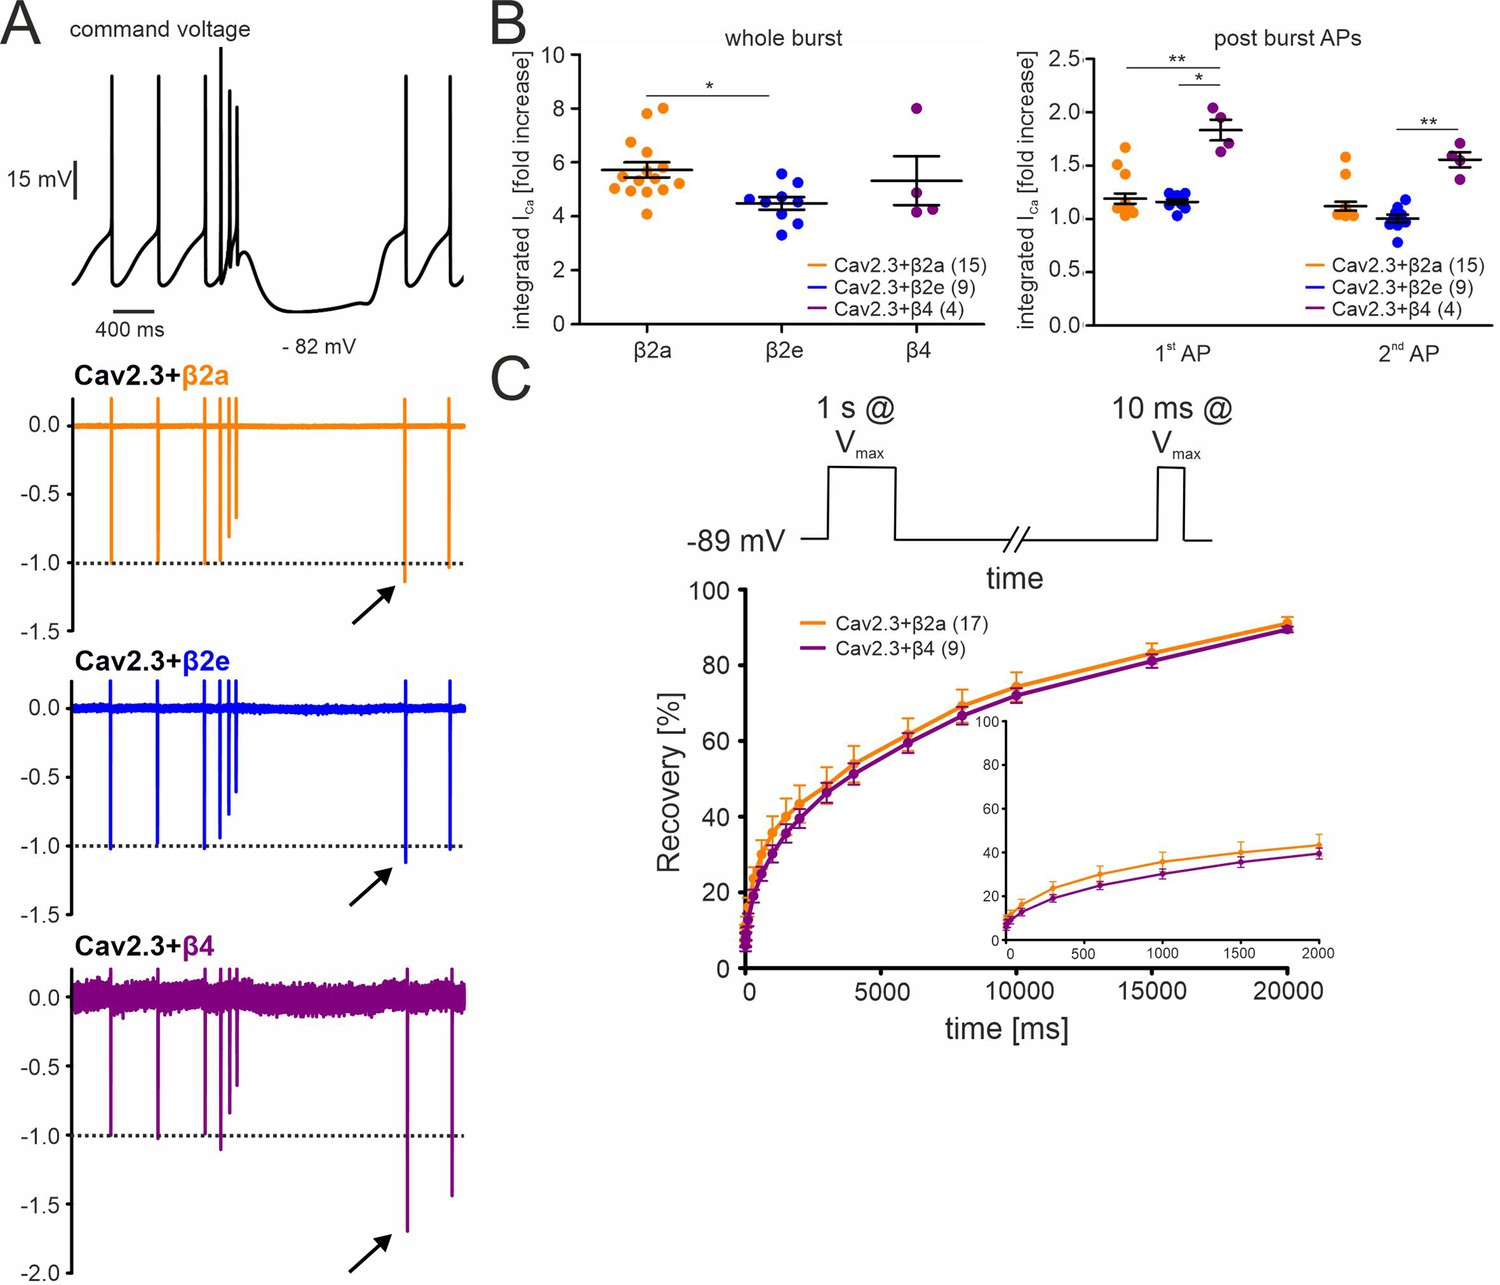
Effects of different β-subunits on Cav2.3 currents during a simulated SN DA neuron three-spike burst and post-burst APs in tsA-201 cells.
The burst command voltage was elicited after ~5–6 min (β2a, β2e) or ~1–2 min (β4) of regular pacemaking to reach steady-state IAP (β2a and β2e:~30% of the initial IAP, β4:~6% of the initial IAP, see Figure 3). (A) Normalized current responses of Cav2.3 channels co-expressed with β2a, β2e or β4 subunits (and α2δ1) induced by a command voltage (top panel) simulating a typical three-spike burst followed by a hyperpolarization phase at hyperpolarized potentials (lowest voltage: –82 mV) for 1.5 seconds. Remaining Cd2+-insensitive current components (100 µM Cd2+) were subtracted off-line to extract pure Cav2.3 mediated ICa. One of at least four experiments with similar results is shown. (B) The integrated ICa during a single AP before the burst (obtained as the mean of the three preceding APs) was set to 100% and compared with ICa during the three-spike burst integrated over the time period equivalent to one AP (left) or the first APs after the pause (right). All investigated β-subunits resulted in increased integrated ICa during the burst. Data represent the means ± SEM for the indicated number of experiments (N = β2a: 4; β2e: 2; β4: 2). Statistical significance was determined using one-way ANOVA followed by Bonferroni post-test (whole burst) or Kruskal-Wallis followed by Dunn’s multiple comparison test (post-burst APs): *** p<0.001; ** p<0.01; * p<0.05. (C) Square-pulse protocol (top) used to determine recovery from inactivation after the indicated time intervals for β2a and β4-associated Cav2.3 channels (see Materials and methods for details). Data represent the means ± SEM for the indicated number of experiments (N=3). For statistics see Table 2. Source data provided in Figure 5—source data 1.
-
Figure 5—source data 1
Source data for data shown in Figure 5.
- https://cdn.elifesciences.org/articles/67464/elife-67464-fig5-data1-v4.xlsx
Figure 6 with 1 supplement
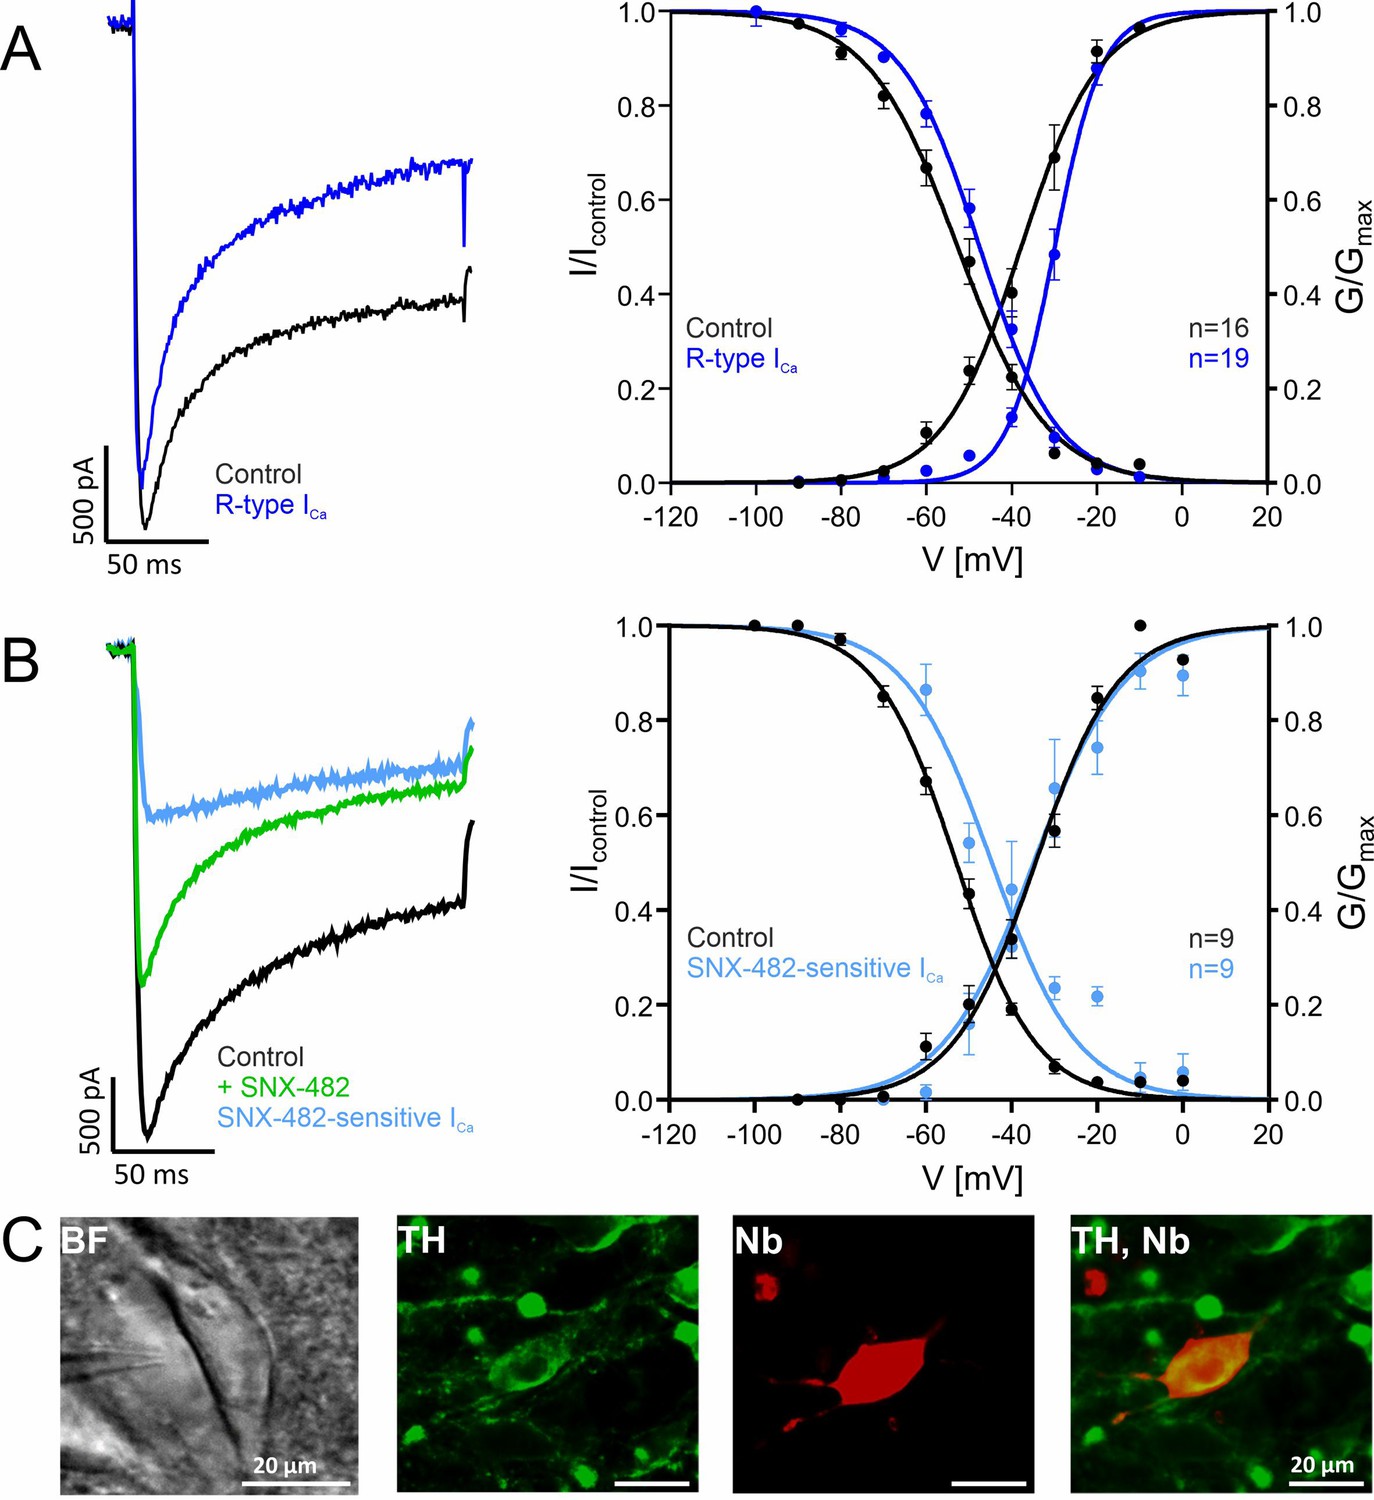
Voltage-dependence of gating of R-type currents in mouse SN DA neurons recorded in brain slices.
(A) ICa recorded in SN DA neurons without (Control, black, n=16) or after preincubation ("R-type", blue, n=19) of slices with a Cav channel blocker cocktail to inhibit Cav3 (10 µM Z941), Cav1 (1 µM I), Cav2.1 and Cav2.2 (1 µM ω-conotoxin-MVIIC) (see Methods). Left panel: representative current traces of recordings at –20 mV test potentials (holding potential –100 mV); notice that similar amplitudes of control and R-type current were chosen to facilitate comparison of current kinetics. Right panel: voltage-dependence of steady-state activation and inactivation, curve fits to a Boltzman equation of all individual data points are shown. Data are means ± SEM. For parameters and statistics see Table 3. (B). SNX-482-sensitive currents (light blue) were obtained by subtracting current measured in the presence of SNX-482 (green) from the respective control ICa before addition of SNX-482 (black) (n=9). Left panel: Representative recording of a SNX-482 sensitive current component compared to the respective control (holding potential –100 mV, –10 mV test potential). Steady-state activation and inactivation of control and SNX-482-sensitive current. Test protocols: holding potential –100 mV; voltage-dependence of activation: 150 ms test potentials to indicated voltages; voltage-dependence of inactivation: 5 s conditioning pulses to indicated voltages preceded (Icontrol) and followed by 20 ms test pulses to Vmax. (C) Exemplary neuron as seen under the patch-clamp microscope with patch pipette next to it (left; BF, brightfield) and a neuron after histochemical staining for tyrosine hydroxylase (TH, green) and neurobiotin (Nb, red). Detailed parameters and statistics are given in Table 3. Source data provided in Figure 6—source data 1.
-
Figure 6—source data 1
Source data for data shown in Figure 6.
- https://cdn.elifesciences.org/articles/67464/elife-67464-fig6-data1-v4.xlsx
Figure 6—figure supplement 1
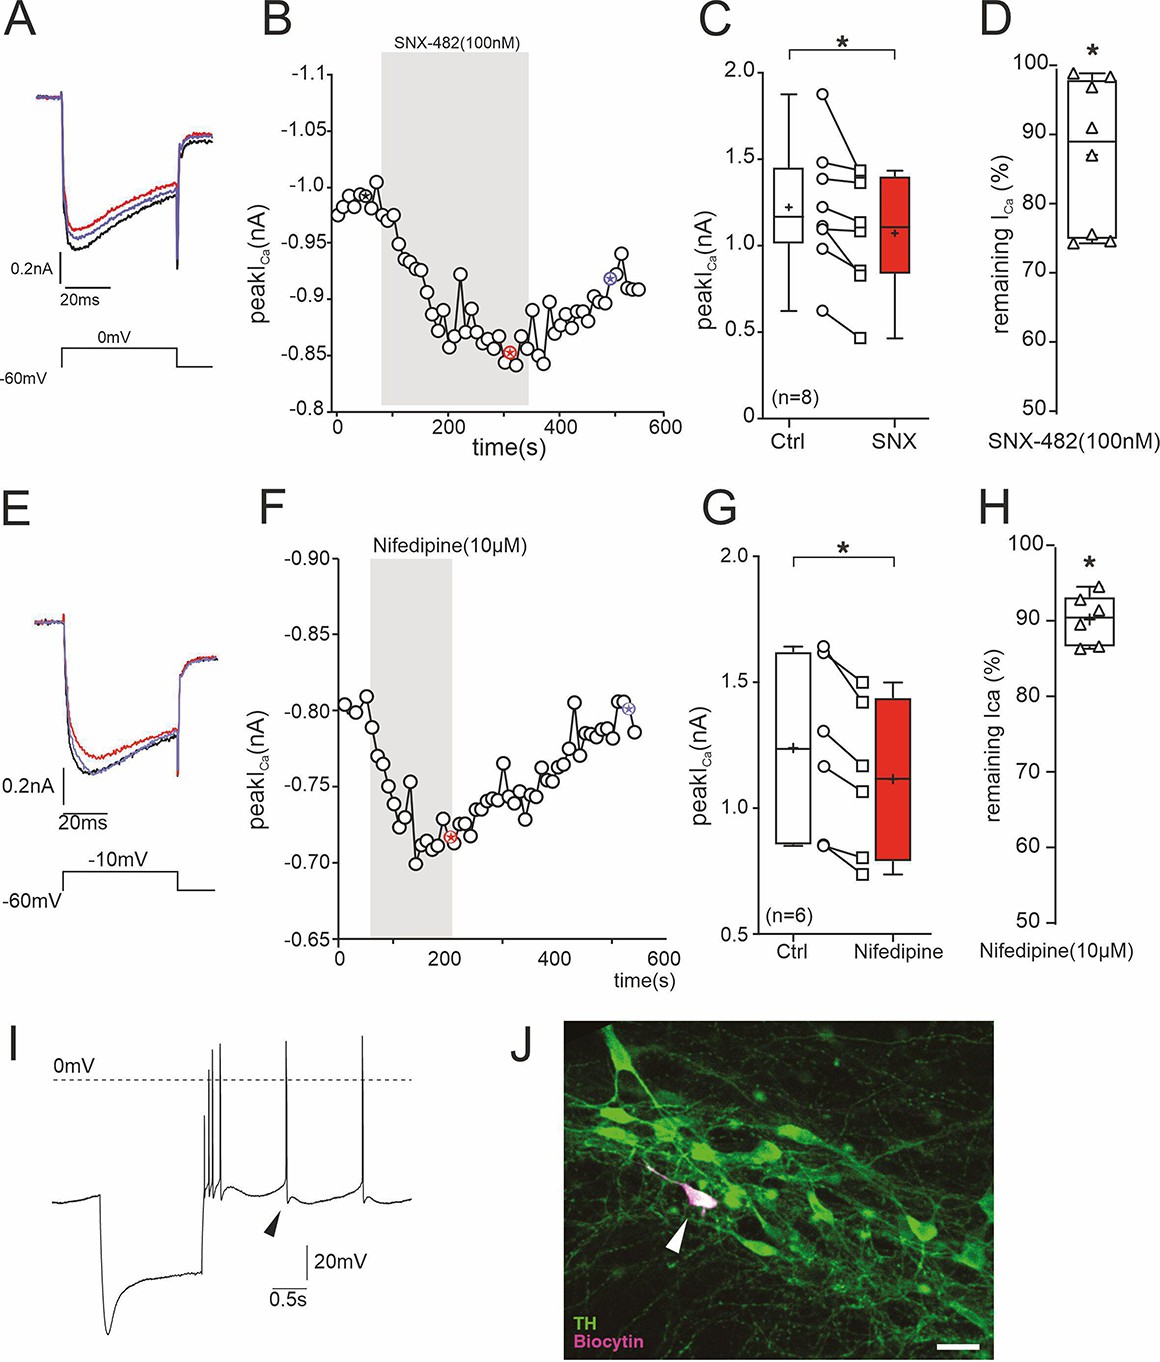
Inhibition of ICa in SN DA neurons of adult (12 weeks) mice by 100 nM SNX-482.
To further prove the presence of SNX-482-sensitive R-type currents in SN DA neurons, we performed perforated-patch recordings. These allow stable recordings over a long period of time and to test for reversibility of channel block by 100 nM SNX-482. Recordings were performed with the pulse protocol shown in A (holding potential –60 mV) after blocking IA K+-currents known to be present in these cells to exclude block of IA by SNX-482 (Kimm and Bean, 2014) as described previously (Benkert et al., 2019). 100 nM SNX-482 significantly reduced current to 87% ± 4% of control ICa (n=8, p=0.012, one-sample t-test, for statistics see Supplementary file 7) and this inhibition was slowly reversible. (A) ICa before (black), during (red) and after (blue) SNX-482 application. (B) Example of peak ICa plotted over time during SNX-482 application. The asterisks mark the time points of the recordings shown on the left. Single depolarizing voltage steps to 0 mV were applied from a holding potential of –60 mV every 10 s. (C) Mean effect of SNX-482 on peak ICa. *, p<0.05 (n=8; two-tailed paired t-test). (D) Remaining peak ICa after SNX-482 inhibition. *, p<0.05 (two-tailed one sample t-test). Box plots: Whiskers indicate minimal and maximal values, ‘+’-sign: mean, horizontal line: median. No complete concentration-response curves were generated since higher concentrations of SNX-482 are known to also inhibit other Cav channels (Bourinet et al., 2001; Newcomb et al., 1998). Therefore, our experiments may underestimate the overall contribution of Cav2.3 channel to total ICa, also because a fraction of channels must already be inactivated at the selected holding potential (–60 mV) of these experiments. (E–H) Under identical experimental conditions, nifedipine reduced ICa to 90% ± 1.4% of control (p=0.031, Wilcoxon-test, for statistics see Supplementary file 7), and this inhibition was fully reversible. (E) Perforated patch-clamp recording of ICa before (black), during (red) and after (blue) nifedipine application. (F) Example of peak ICa plotted over time during nifedipine application. The asterisks mark the time points of the recordings shown on the left. Single depolarizing voltage steps to –10 mV were applied from a holding potential of –60 mV every 10 s. (G) Mean effect of nifedipine on peak ICa. *, p<0.05 (n=6; two-tailed paired t-test). (H) Remaining peak ICa under nifedipine. p<0.05 (two-tailed Wilcoxon signed-rank test). Box plots: Whiskers indicate minimal and maximal values, ‘+’-sign: mean, horizontal line: median. For statistics see Supplementary file 7. (I) Current clamp recording of a DA neuron in the SN pars compacta to demonstrate the pre-identifying electrophysiological properties including sag potential during hyperpolarization, broad action potentials, and regular pacemaking. Arrowhead: largely reduced slow afterhyperpolarization due to partial block of K+ channels by Cs+ diffusion into the neuron during the perforation process. (J) Post-recording analysis shows co-localization of biocytin (recorded neuron; magenta) and tyrosine hydroxylase (TH, green). Source data provided in Figure 6—figure supplement 1—source data 1.
-
Figure 6—figure supplement 1—source data 1
Source data for data shown in Figure 6—figure supplement 1, panels C, D and G, H.
- https://cdn.elifesciences.org/articles/67464/elife-67464-fig6-figsupp1-data1-v4.xlsx
Figure 7 with 1 supplement
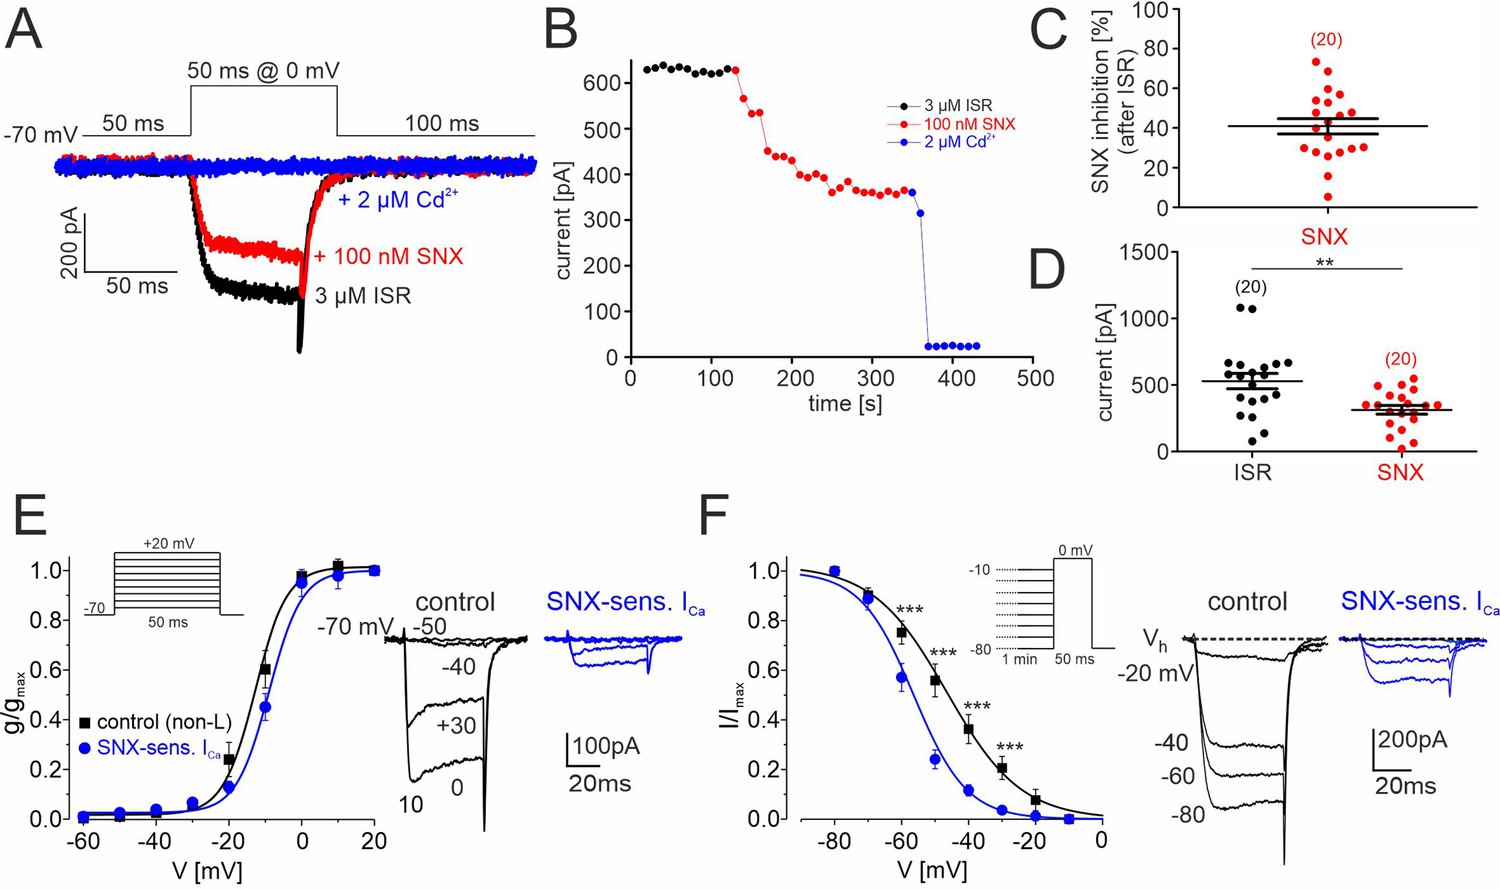
SNX-482–sensitive R-type currents in cultured mouse midbrain DA neurons.
(A) Representative traces illustrating the inhibition of non-L-type ICa by 100 nM SNX-482 (red). Cells were initially perfused with a bath solution containing 3 μM isradipine (black). Full block was obtained using 2 μM Cd2+ (blue). Square pulses (50 ms) were applied to 0 mV from a holding potential of –70 mV (top) (B) Current amplitude values plotted as a function of time. After stabilization of ICa with ISR (black circles), 100 nM SNX-482 was applied. The remaining currents was blocked by 2 μM Cd2+. Current run-down in the absence of drugs during 150 s was less than 1% (0.48 ± 0.18%; n=4 cells). (C) SNX-482 inhibition expressed as % of control ICa after LTCC block using 3 μM ISR. (D) Mean current amplitude at the end of ISR application and at the end of SNX-482 application. Absolute current amplitude decreased from 529±57 pA (95% CI: 409–649) to 313±33 pA (95% CI: 245–381, n=20, p<0.01, paired Students t-test). Data represent the means ± SEM for the indicated number of experiments (N=4). Statistical significance was determined using paired Student’s t-test: *** p<0.001; **p<0.01; *p<0.05. (E) Left: Depolarizations of 50 ms were repeated every 10 s to the indicated potentials from a holding potential of –70 mV (inset). The voltage dependence of the conductance, g(V), was calculated with the equation g(V)=ICa/(V− ECa) with ECa=+65 mV for the currents recorded in the presence of 3 µM ISR (control; black squares; n=9–14 per voltage) and after subtraction of the currents insensitive to 100 nM SNX-482 (n=4–7) to yield (SNX-sensitive R-type; blue circles). Data were fitted to a Boltzman function. At each test potential (V) ICa was estimated at the peak of the current trace. Right: representative current traces recorded during pulses to −50, –40, –30 and 0 mV. (F). Left: To determine the voltage-dependence of steady-state inactivation, test pulses of 50 ms to 0 mV were preceded by 1 min prepulses to voltages from –80 to –10 mV. This stimulation protocol (inset) was better tolerated by cultured DA midbrain neurons than the classical protocol used previously with other cells (Calorio et al., 2019; Pinggera et al., 2015). SNX-sensitive R-type currents (blue) were obtained after subtraction of the currents insensitive to 100 nM SNX-482 (n=3–8 per voltage) from non-L control current (black, n=8–15). Right: representative traces recorded at 0 mV from a holding potential of −20,–40, –60, and –80 mV. Inactivation curves could be best fit to Boltzman functions with the following parameters: R-type: V0.5,inact = -58.1±0.6 mV, k=–7.1 ± 1.2 mV; control: V0.5,inact = -48.0±0.9 mV, k=-11.1 ± 1.2 mV. The R-type currents (E, F) appear smaller than expected from the data in panels B and C (30–40% of non-L-type currents). This is due to a run-down of SNX-sensitive current during the repeated depolarizations used to determine the voltage-dependence of gating. This has only minimal effects on gating parameters. When accounting for a linear run-down of 40%, the V0.5,act would shift only from –58 to –56 mV. Source data provided in Figure 7—source data 1.
-
Figure 7—source data 1
Source data for data shown in Figure 7.
- https://cdn.elifesciences.org/articles/67464/elife-67464-fig7-data1-v4.xlsx
Figure 7—figure supplement 1
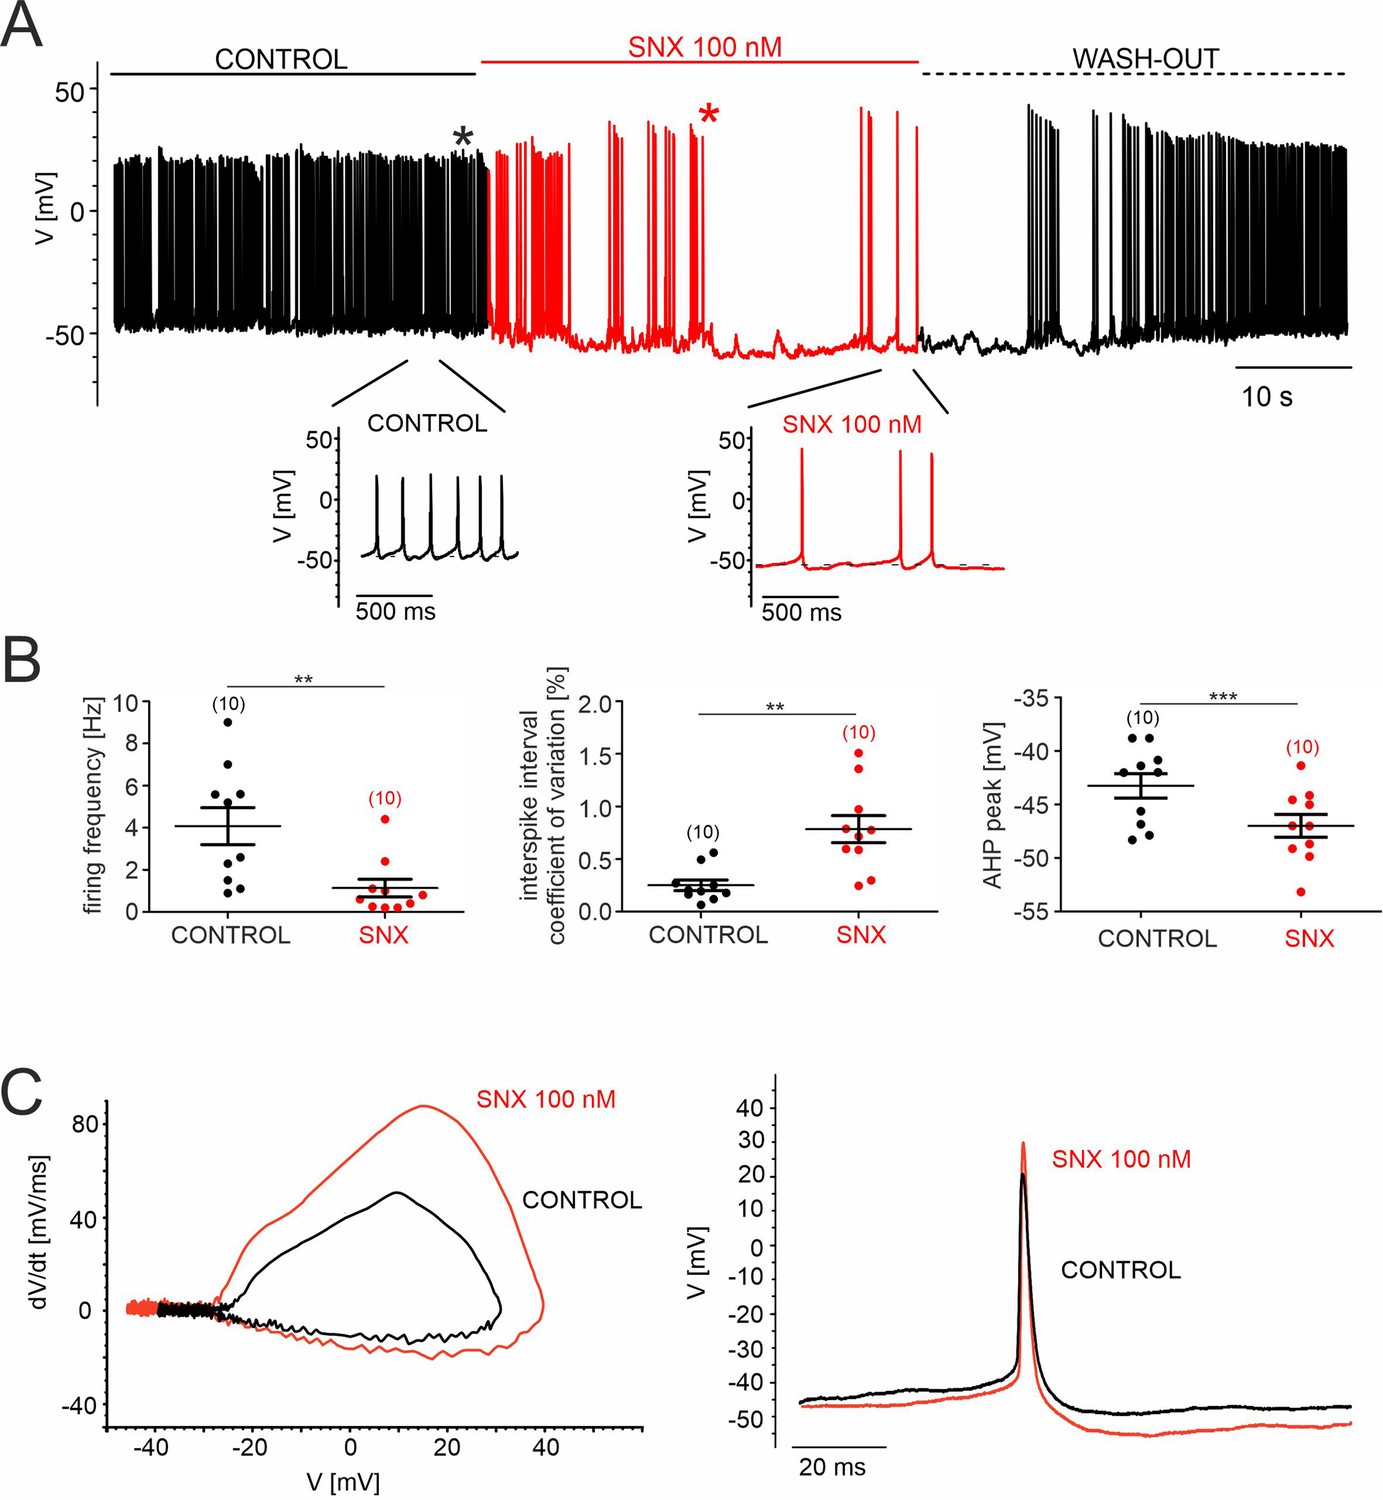
SNX-482 effects on pacemaking of cultured mouse midbrain DA neurons.
(A) Representative recording of spontaneous firing activity of cultured midbrain dopaminergic neurons before, during and after the application (wash-out) of 100 nM SNX-482. Below, enlargements of action potentials within the highlighted regions are shown. (B) Firing frequency [Hz], coefficient of variation of the interspike interval [%], and AHP peak [mV] before (control) and during the application of 100 nM SNX-482. Data represent the means ± SEM for the indicated number of experiments. Statistical significance was determined using paired Student’s t-test.: *** p<0.001; ** p<0.01; * p<0.05. (C) Left panel: Phase-plane plot analysis (time derivative of voltage (dV/dt) vs. voltage (V)) before (control) and during the application of 100 nM SNX-482. Right panel: corresponding AP trace in control and in the presence of SNX-482 (obtained from trace in panel A, as indicated by the asterisks). SNX-482 significantly reduced the spontaneous firing frequency from 4.1±0.8 Hz (control, n=10, N=3; 95% CI: 2.1–6.1) to 1.1±0.2 Hz (SNX-482, n=10, 95% CI: 0.2–2.1, p=0.0036, paired Student’s t-test) and decreased the regularity of pacemaking coefficient of variation of the mean interspike interval increased from 0.25±0.06 (control, 95% CI: 0.15–0.39) to 0.78±0.13 (SNX-482, 95% CI: 0.49–1.09, p=0.0032, paired Student’s t-test). Slowing of firing was associated with hyperpolarization of the most negative voltage reached during the afterhyperpolarization (AHP) immediately after the spike (AHP peak), which decreased from –43.2±1.3 mV (control, 95% CI: –45.8––40.7) to –47.0±1.2 mV (SNX-482, 95% CI: –49.4 to –44.6, p=0.0005, paired Student’s t-test). Other changes in the AP waveform, which could represent indirect effects from the slowing of AP frequency or result from inhibition of Cav2.3 channels, were also noted: a reduced mean AP half-width (control: 5.1±0.3ms, 95% CI: 4.4–5.8; SNX-482: 4.2±0.3ms, 95% CI: 3.7–4.8; p=0.0050, paired Student’s t-test), and a trend toward increased maximum time-derivative of voltage (control: 45.3±4.9 mV/ms, 95% CI: 34.4–56.3; SNX-482: 74.3±13.5 mV/ms, 95% CI: 47.0–101.5, p=0.0625, paired Student’s t-test, estimated from the phase-plane plot of in C). The latter is likely due to the recruitment of more voltage-gated Na+-channels during the AP onset from the more hyperpolarized interspike membrane potential (Guarina et al., 2018; Tomagra et al., 2019). Source data provided in Figure 7—figure supplement 1—source data 1.
-
Figure 7—figure supplement 1—source data 1
Source data for data shown in Figure 7—figure supplement 1, panel B.
- https://cdn.elifesciences.org/articles/67464/elife-67464-fig7-figsupp1-data1-v4.xlsx
Author response image 1
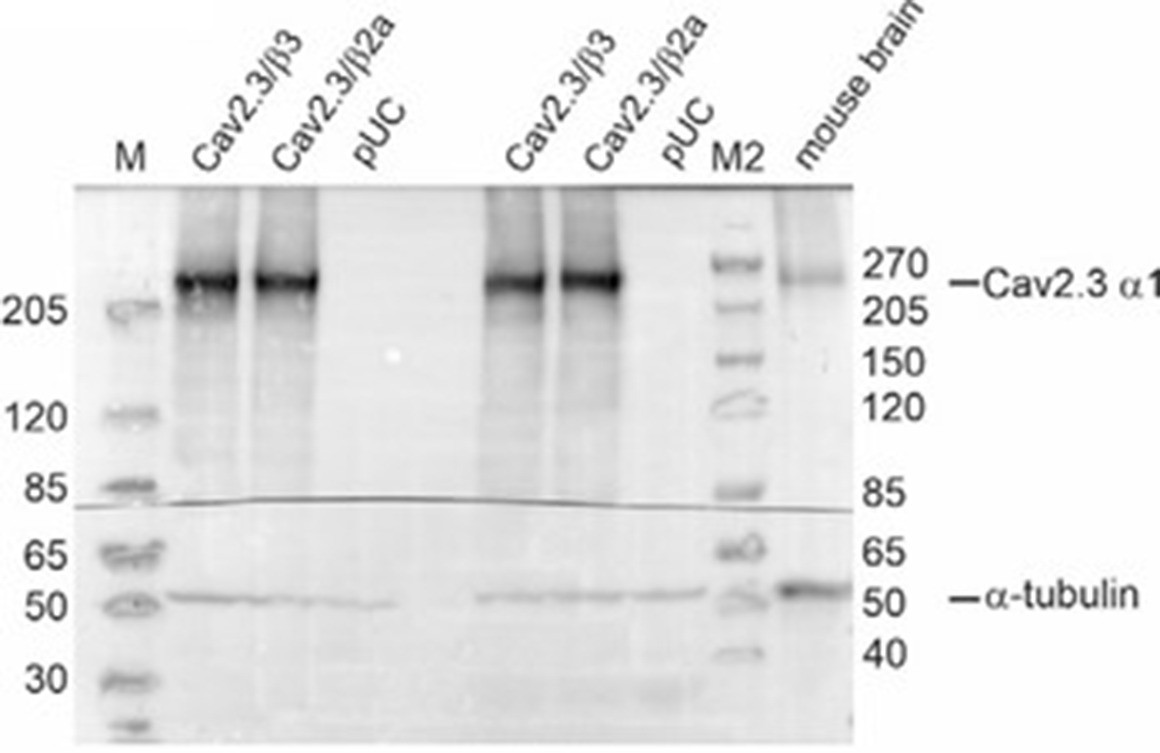
Western blot using membrane preparations from tsA201 cells transiently transfected with Cav2.3e α1, β3/β2a and α2δ1 or an empty vector (pUC) and mouse whole brain protein preparations were used as described by us previously (14, 15).
Tris‐acetate gel: Primary antibodies: rabbit anti‐Cav2.3 (1:15,000; Proteintech, Cat# 27225‐1‐AP) and mouse anti‐tubulin (1:30,000; Sigma‐Aldrich, Cat# CP06). Secondary antibodies: goat anti‐rabbit IgG (1:40,000; Sigma, Cat# A6545) and goat anti‐mouse IgG (1:8,000; Invitrogen, Cat# 31430). M: Marker PageRuler Plus Prestained Protein Ladder (ThermoScientific, Cat# 26619); M2: Marker Spectra Multicolor High Range Protein Ladder (Thermo Scientific, Cat# 26625).
Author response image 2
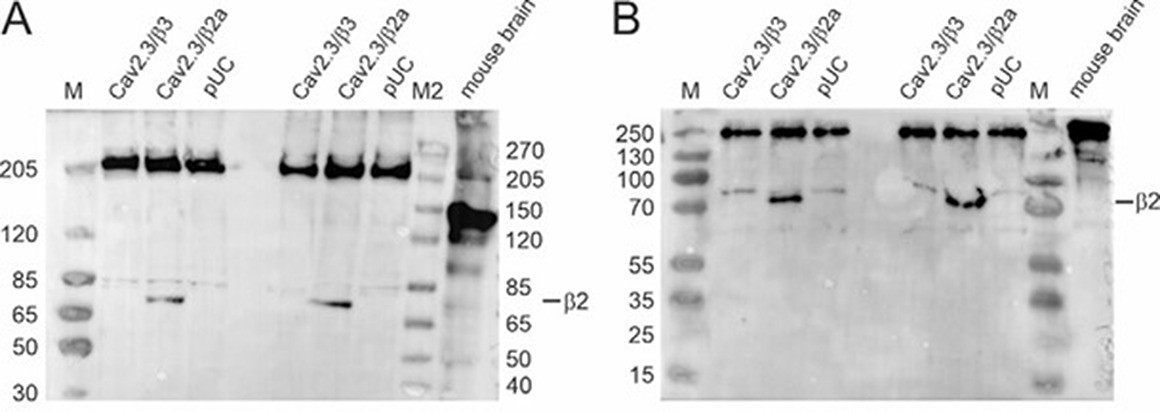
Western blot (A: Tris‐acetate gel; B: Tris‐glycine gel) using membrane preparations from tsA201 cells transiently transfected with Cav2.3e α1, β3/β2a and α2δ1 or an empty vector (pUC) and mouse whole brain protein preparationsas described by us previously (1, 2).
Primary antibody: mouse anti‐β2 (A: 1:1,000; B: 1:800; Antibodies Inc, Cat# 75‐065), secondary antibody: goat anti‐mouse IgG (A: 1:5,000; B: 1:3,000; Invitrogen, Cat# 31430). M: Marker PageRuler Plus Prestained Protein Ladder (Thermo Scientific, Cat# 26619); M2: Marker Spectra Multicolor High Range Protein Ladder (Thermo Scientific, Cat# 26625).
Author response image 3

Western blot using membrane preparations from tsA201 cells transiently transfected with Cav2.3e α1, β3/β2a and α2δ1 or an empty vector (pUC) and mouse whole brain protein preparations as described by us previously (1, 2).
Tris‐acetate gel: Primary antibody: mouse anti‐β2 (1:800; Santa Cruz, Cat# sc‐81890), secondary antibody: goat anti‐mouse IgG (1:8,000; Invitrogen, Cat# 31430). M: Marker PageRuler Plus Prestained Protein Ladder (Thermo Scientific, Cat# 26619).
Tables
Table 1
Voltage-dependence of activation and inactivation, and time course of inactivation of Cav2.3 co-transfected with α2δ1 and different β subunits in tsA-201 cells.
| β-subunit | Cav2.3 - Activation 2 mM Ca2+ | Cav2.3 - Inactivation 2 mM Ca2+ | ||||||||
|---|---|---|---|---|---|---|---|---|---|---|
| V0.5[mV] | k[mV] | Vrev[mV] | act thresh[mV] | current density[pA/pF] | n | V0.5, inact[mV] | kinact[mV] | plateau[%] | n | |
| no β | –10.7±1.1 | 23 | ||||||||
| β2a | –14.8±1.2 | 4.8±0.2 | 37.1±0.9 | –32.0±0.9 | –130.0+++±15.2 | 26 | –40.6±1.6 | 7.3±0.5 | 0.4±1.1 | 13 |
| C3S/C4Sβ2a | –13.9±1.7 | 4.7±0.3 | 38.2±1.1 | –30.9±0.7 | –105.7+++±21.4 | 12 | –62.6***/###/§§§±1.6 | 8.3##±0.4 | 3.8±1.6 | 9 |
| β2d | –15.9§±1.1 | 4.6±0.2 | 37.2±1.1 | –32.1§±0.7 | –107.7+++±13.4 | 17 | –69.9***/###±2.0 | 8.2##±0.2 | 2.0±0.7 | 10 |
| β2e | –14.1±0.9 | 4.8±0.2 | 40.3*±0.6 | –31.5±0.7 | –96.8+++±14.3 | 32 | –39.9±1.9 | 6.5±0.3 | 3.8±1.2 | 24 |
| β3 | –10.5±0.7 | 5.2±0.2 | 39.8±0.9 | –29.2±0.7 | –64.6++±12.8 | 17 | –76.2***/###±1.0 | 7.0±0.1 | 4.1±0.7 | 14 |
| β4 | –13.1±0.7 | 5.0±0.2 | 38.5±0.5 | –31.0±0.5 | –74.8+++±11.9 | 17 | –70.3***/###±1.2 | 7.5±0.1 | 2.4±0.4 | 11 |
| Cav2.3–5 s Inactivation time course 2 mM Ca2+ | ||||||||||
| β-subunit | r50 [%] | r100 [%] | r250 [%] | r500 [%] | r1000 [%] | r5000 [%] | n | |||
| β2a | 71.3±2.1 | 52.4±2.8 | 27.8±2.9 | 14.3±2.3 | 6.5±1.2 | 1.3±0.3 | 17 | |||
| C3S/C4Sβ2a | 67.4§§§/%±5.2 | 47.3#/§§§/%%±6.4 | 23.4§±5.3 | 11.6±3.3 | 6.2±1.7 | 3.4±1.1 | 11 | |||
| β2d | 57.4*/###/§§§±2.8 | 32.6***/###/§§±2.4 | 11.3*/###±1.7 | 4.4**/###±0.9 | 2.4**/###±0.6 | 1.7±0.5 | 21 | |||
| β2e | 77.5±2.9 | 64.2±3.3 | 41.1±3.2 | 22.3±2.8 | 10.1±2.0 | 3.3±0.8 | 27 | |||
| β3 | 32.9***/###±2.9 | 14.2***/###±1.5 | 6.1***/###±1.0 | 4.4**/###±0.7 | 2.9#±0.5 | 1.6±0.3 | 16 | |||
| β4 | 50.3***/###/§§±2.7 | 27.1***/###±2.5 | 8.6**/###±1.4 | 3.7**/###±0.8 | 2.0**/###±0.5 | 1.0±0.2 | 15 | |||
-
Table 1—source data 1
Source data for data shown in Table 1.
- https://cdn.elifesciences.org/articles/67464/elife-67464-table1-data1-v4.xlsx
Table 2
Recovery from inactivation of Cav2.3 channels co-transfected with either β2a or β4 in combination with α2δ1 in tsA-201 cells.
| Cav2.3 - recovery from inactivation 2 mM Ca2+ | |||||
|---|---|---|---|---|---|
| β-subunit | r100 [%] | r1500 [%] | r4000 [%] | r10000 [%] | n |
| β2a | 15.7±2.4 | 39.3±4.6 | 53.4 ±4.5 | 74.2±3.6 | 17 |
| β4 | 12.7±1.7 | 35.6±2.4 | 51.3 ±2.8 | 72.0±1.9 | 9 |
-
Table 2—source data 1
Source data for data shown in Table 2.
- https://cdn.elifesciences.org/articles/67464/elife-67464-table2-data1-v4.xlsx
Table 3
Voltage-dependence of activation and inactivation of Ca2+-currents in SN DA neurons.
| Activation | Inactivation | |||||
|---|---|---|---|---|---|---|
| V0.5,act (95% CI) [mV] | kact (95% CI) [mV] | n/N | V0.5, inact (95% CI) [mV] | kinact (95% CI) [mV] | n/N | |
| Control A (without Cav-blocker cocktail) | –37.8 (−39.3,–36.3) | 9.17 (7.90, 10.6) | 16/8 | –52.7 (−53.9,–51.5) | 10.5 (−11.6,–9.48) | 16/8 |
| +Cav blocker cocktail ("R-type") | –29.9 (−30.8,–29.1)*** | 5.49 (4.73, 6.30)*** | 19/5 | –47.5 (−48.7,–46.4)*** | 9.15 (−10.2,–8.16) | 19/5 |
| Control B (before SNX-482) | –34.4 (−35.7,–33.2) | 9.68 (8.59, 10.8) | 9/6 | –52.9 (−53.7,–52.1) | 9.30 (−10.9,–8.61) | 9/6 |
| SNX-482 - sensitive current | –34.9 (−37.7,–32.0) | 10.6 (8.26, 13.3) | 9/6 | –44.6 (−46.9,–42.2)+++ | 10.1 (−12.1,–8.24) | 9/6 |
-
Table 3—source data 1
Source data for data shown in Table 3.
- https://cdn.elifesciences.org/articles/67464/elife-67464-table3-data1-v4.xlsx
Key resources table
| Reagent type (species) or resource | Designation | Source or reference | Identifiers | Additional information |
|---|---|---|---|---|
| Mouse strain:C57Bl/6N, C57Bl/6J | C57Bl/6N, C57Bl/6J | Charles River | C57Bl/6N, C57Bl/6J | |
| Mouse strain:C57Bl/6-TH-GFP mice | C57Bl/6-TH-GFP | Matsushita et al., 2002; Sawamoto et al., 2001 | GFP-expression under TH-promotor | |
| Transfected construct | Human Cav1.3L α1-subunit (C-terminally long Cav1.3 splice variant) | Koschak et al., 2001 | GenBank accession number EU363339 | Cloned into proprietary vector lacking GFP ("GFPminus"), described in Grabner et al., 1998 |
| Transfected construct | Human Cav2.3 α1-subunit | Pereverzev et al., 2002 | Cloned into pcDNA3 vector | |
| Transfected construct | Rat β3-subunit | Koschak et al., 2001 | GenBank: NM_012828, | Cloned into pCMV6 vector |
| Transfected construct | Rat β2a-subunit | Koschak et al., 2001 | GenBank: M80545 | Cloned into pCMV6 vector |
| Transfected construct | Mouse β2d-subunit | β2aN1, Link et al., 2009 | GenBank: FM872408.1 | Cloned into pCAGGS vector |
| Transfected construct | Mouse β2e-subunit | β2aN5, Link et al., 2009 | GenBank: FM872407 | Cloned into pCAGGS vector |
| Transfected construct | C3S/C4Sβ2a | Cysteine residues in position 3 and 4 of β2a replaced by serines, Gebhart et al., 2010 | Cloned into pCMV6 vector | |
| Transfected construct | Rat β4-subunit (splice variant β4e) | Etemad et al., 2014 | Cloned into pβA vector | |
| Cell line (Homo sapiens) | TsA-201 cells | European Collection of Authenticated Cell Cultures | ECACC, catalogue # 96121229, lot # 13D034 | Tested Mycoplasma negative |
| Antibody | Anti-tyrosine hydroxylase (TH; rabbit polyclonal) | Merck Millipore | Cat#: 657012, | 1:1000 |
| Commercial assay or kit | RNeasy Lipid Tissue Mini Kit | Qiagen GmbH, Germany | catalog # 1023539 | |
| Commercial assay or kit | Phenol/guanidine-based Qiazol lysis reagent | Qiagen GmbH, Germany, | catalog # 79,306 | |
| Commercial assay or kit | Maxima H Minus First Strand cDNA synthesis kit | Thermo Fisher Scientific, Waltham, MA, USA | catalog # K1682 | |
| Commercial assay or kit | Quant-IT PicoGreen dsDNA Assay Kit | Thermo Fisher Scientific, Waltham, MA, USA | catalog # P7589 | |
| Commercial assay or kit | Mycoplasma Detection Kit | ATCC | Universal Mycoplasma Detection Kit 30–1012 K | |
| Commercial assay or kit | TaqMan Universal PCR Master Mix | Thermo Fisher Scientific, Waltham, MA, USA | ||
| Commercial assay or kit | RNAscope technology | Advanced Cell Diagnostics (ACD) | RNAscope Fluorescent Multiplex Detection Kit (ACD, Cat# 320851) | |
| Chemical compound | Neurobiotin-labeling reagent: Streptavidin Alexa Fluor conjugate 647 | Thermo Fisher Scientific, Waltham, MA, USA | catalog # S21374 | 1:1000 |
| Chemical compound | SNX-482 | Alomone Labs, Jerusalem, Israel | catalog # RTS-500 | |
| Software, algorithm | Clampfit | Clampfit | Version 10.0 or 10.7, RRID:SCR_011323 | |
| Software, algorithm | QuantStudioTM | Thermo Fisher Scientific, Waltham, MA, USA | Quantstudio 3 Software | |
| Software, algorithm | Fiji | https://imagej.net/Fiji, Schindelin et al., 2012 | ||
| Software, algorithm | GraphPad Prism | GraphPad | GraphPad Prism Ver 5, 7.04 and 8 (RRID:SCR_002798) | |
| Software, algorithm | SigmaPlot | Systat Software, Germany | SigmaPlot Ver 14, RRID:SCR_003210 |
Additional files
-
Supplementary file 1
Names, cellular functions and assay ID’s of endogenous control genes.
For details see methods.
- https://cdn.elifesciences.org/articles/67464/elife-67464-supp1-v4.docx
-
Supplementary file 2
TaqMan assays for β1–4 isoforms and N-terminal β2 splice variants including cDNA specific primer sequences for standard template cloning.
Additional SalI and HindIII restriction enzyme sites (see Methods) are underlined; the reverse (rev) primer used for standard template cloning including the HindIII restriction site was the same for β2a-e subunit variants; rev, reverse; fwd, forward.
- https://cdn.elifesciences.org/articles/67464/elife-67464-supp2-v4.docx
-
Supplementary file 3
Quantitative RT-PCR standard curve parameters.
SE-B, SE-Y, standard error of B and Y-intercept; Y-int., Y-intercept (CT value); R2, squared correlation coefficient; LOD, limit of detection (number of transcripts); LOQ, limit of quantification (number of transcripts); E (%), Efficiency in % (E=10–1/slope-1), 100% efficiency corresponds to a slope of –3.32.
- https://cdn.elifesciences.org/articles/67464/elife-67464-supp3-v4.docx
-
Supplementary file 4
Single cell gene expression data.
Data and statistics of genes as indicated for graphs shown in Figure 2—figure supplement 2A (middle) and B (right). n represents number of analyzed dopaminergic neurons derived from N individual mice. Significances according to two-way ANOVA followed by Tukey’s multiple comparisons test: ***, P<0.001.
- https://cdn.elifesciences.org/articles/67464/elife-67464-supp4-v4.docx
-
Supplementary file 5
Multiplex PCR (outer) and nested PCR (inner) primers for qualitative PCR.
F: forward primer, R: reverse primer
- https://cdn.elifesciences.org/articles/67464/elife-67464-supp5-v4.docx
-
Supplementary file 6
Voltage-dependence of activation and inactivation of Cav1.3 co-transfected with α2δ1 and different β-subunits in tsA-201 cells.
All values are given as mean ± SEM for the indicated number of experiments (n, N=2). Parameters were obtained as described in Materials and Methods from a holding potential of –89 mV using 15 mM Ca2+ as the charge carrier. Voltage-dependence of gating: Parameters are as given in legend to Table 1. Statistical significance was determined using one-way ANOVA with Bonferroni post-hoc test (V0.5, Vrev, act thresh, V0.5,inact, kinact, plateau) or Kruskal-Wallis followed by Dunn’s multiple comparison test (k). Statistical significances of post hoc tests are indicated for comparison vs. β2a (*, **, ***) or vs. β3 (§, §§, §§§): *** P<0.001; ** P<0.01; * P<0.05. Inactivation time course: The r values represent the fraction of ICa remaining after 50, 100, 250, 500, 1,000 or 5000 ms during a 5 s pulse to Vmax. Statistical significance was determined using one-way ANOVA with Bonferroni post-hoc test. Statistical significances of post hoc tests are indicated for comparison vs. β2a: *** P<0.001; ** P<0.01; * P<0.05.
- https://cdn.elifesciences.org/articles/67464/elife-67464-supp6-v4.docx
-
Supplementary file 7
Inhibition of ICa in identified SN DA neurons of adult (12 weeks) mice by 100 nM SNX-482 and 10 µM nifedipine (perforated-patch clamp).
For details see results. Experiments were performed as described in detail in the Methods section and Figure 6—figure supplement 1.
- https://cdn.elifesciences.org/articles/67464/elife-67464-supp7-v4.docx
-
Transparent reporting form
- https://cdn.elifesciences.org/articles/67464/elife-67464-transrepform1-v4.docx
-
Source data 1
Original images.
- https://cdn.elifesciences.org/articles/67464/elife-67464-data1-v4.zip
Download links
A two-part list of links to download the article, or parts of the article, in various formats.
Downloads (link to download the article as PDF)
Open citations (links to open the citations from this article in various online reference manager services)
Cite this article (links to download the citations from this article in formats compatible with various reference manager tools)
β2-subunit alternative splicing stabilizes Cav2.3 Ca2+ channel activity during continuous midbrain dopamine neuron-like activity
eLife 11:e67464.
https://doi.org/10.7554/eLife.67464


