Most cancers carry a substantial deleterious load due to Hill-Robertson interference
- Department of Biology, Stanford University, United States
- Department of Genetics and Genome Sciences, Case Western Reserve University, United States
- Department of Medicine, Division of Oncology, Stanford University School of Medicine, United States
- Department of Genetics, Stanford University School of Medicine, United States
- Stanford Cancer Institute, Stanford University School of Medicine, United States
Figures
Figure 1
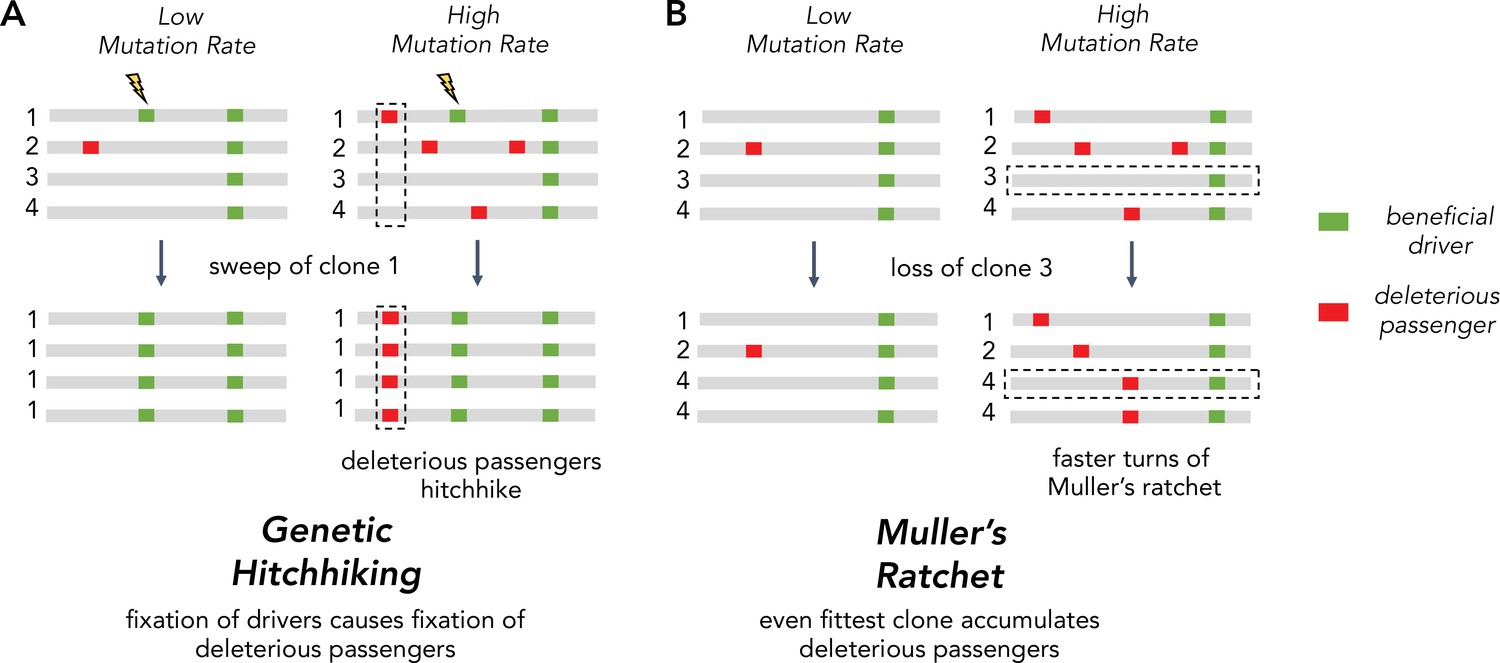
Two Hill-Robertson interference processes that accumulate deleterious mutations at high mutation rates.
(A) Genetic hitchhiking. Each number identifies a different segment of a clone genome within a tumor. De novo beneficial driver mutations that arise in a clone can drive other mutations (passengers) in the clone to high frequencies (black dotted column). If the passenger is deleterious, both beneficial drivers and deleterious passengers can accumulate. (B) Muller’s ratchet. As the mutation rate within a tumor increases, deleterious passengers accumulate on more clones. If the fittest clone within the tumor is lost through genetic drift (black dotted row), the overall fitness of the population will decline.
Figure 2 with 16 supplements

Attenuation of selection and increased protein folding stress in high mutation load tumors.
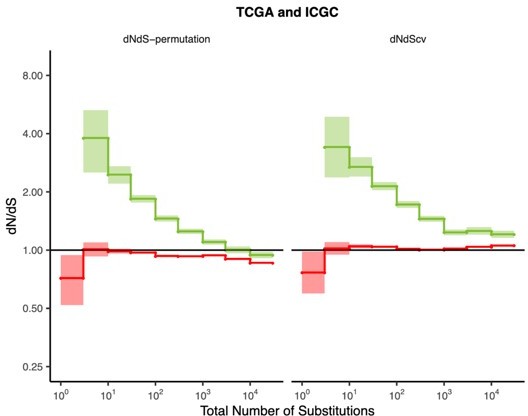
(A) dN/dS of passenger (red) and driver (green) gene sets within 10,288 tumors in TCGA stratified by total number of substitutions present in the tumor (dN(observed)+dS(observed)). dN/dS is calculated with error bars using a permutation-based null model (left) and dNdScv (right). A dN/dS of 1 (solid black line) is expected under neutrality. Solid gray line denotes pan-cancer genome-wide dN/dS. (B) Fraction of pathogenic missense mutations, annotated by PolyPhen2, in the same driver and passenger gene sets also stratified by total number of substitutions. Black line denotes the pathogenic fraction of missense mutations across the entire human genome. (C) Breakpoint frequency of copy number alterations (CNAs) that reside within exonic (dE) to intergenic (dI) regions within putative driver and passenger gene sets (identified by GISTIC 2.0, Materials and methods) in tumors stratified by the total number of CNAs present in each tumor and separated by CNA length. Solid black line of 1 denotes values expected under neutrality. (D) dN/dS of clonal (variant allele frequency [VAF] > 0.2; darker colors) and subclonal (VAF < 0.2; lighter colors) passenger and driver gene sets in tumors stratified by the total number of substitutions. A dN/dS of 1 (solid black line) is expected under neutrality. (A–D) Histogram counts of tumors within mutational burden bins are shown in the top panels. (E) Driver and passenger dN/dS values of the highest and lowest defined mutational burden bin in broad anatomical sub-categories. (F) Same as (E), except for all specific cancer subtypes with ≥500 samples. (G) Z-scores of median gene expression within all genes, HSP90, Chaperonin, and Proteasome gene sets averaged across patients (relative to an average tumor) stratified by the total number of substitutions. All shaded error bars are 95% confidence intervals determined by bootstrap sampling.
Figure 2—figure supplement 1
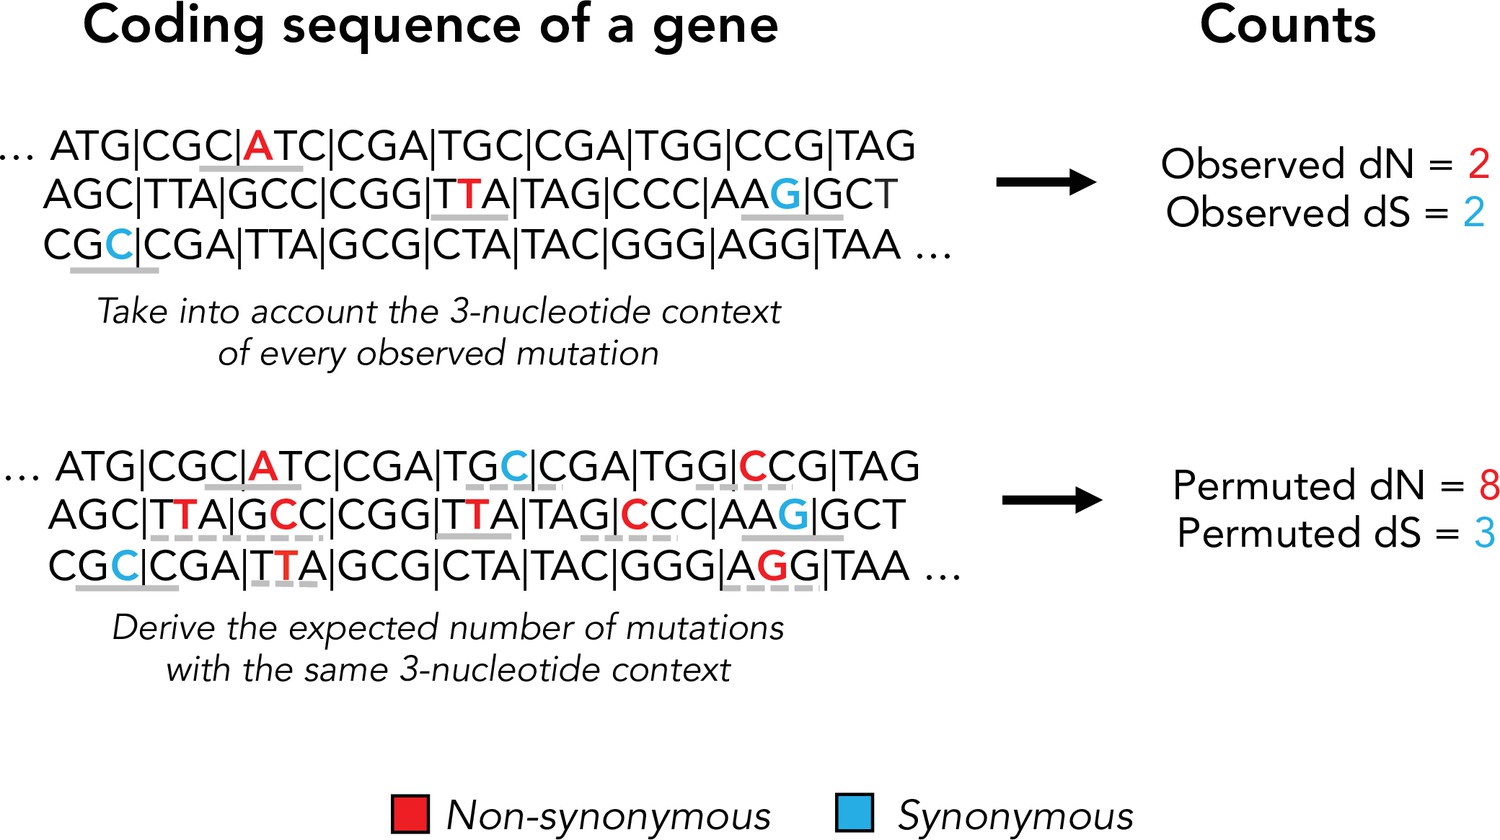
Schematic of our permuted dN and dS calculation.
Permuted synonymous and nonsynonymous counts are used to account for mutational biases in dN/dS calculations. Observed mutations and their tri-nucleotide context is shown in a solid gray bar. Permuted mutations with the same tri-nucleotide context are shown in dashed gray lines. Note that permutations do not preserve the codon position of a mutation and can alter protein coding effect (nonsynonymous vs. synonymous).
Figure 2—figure supplement 2
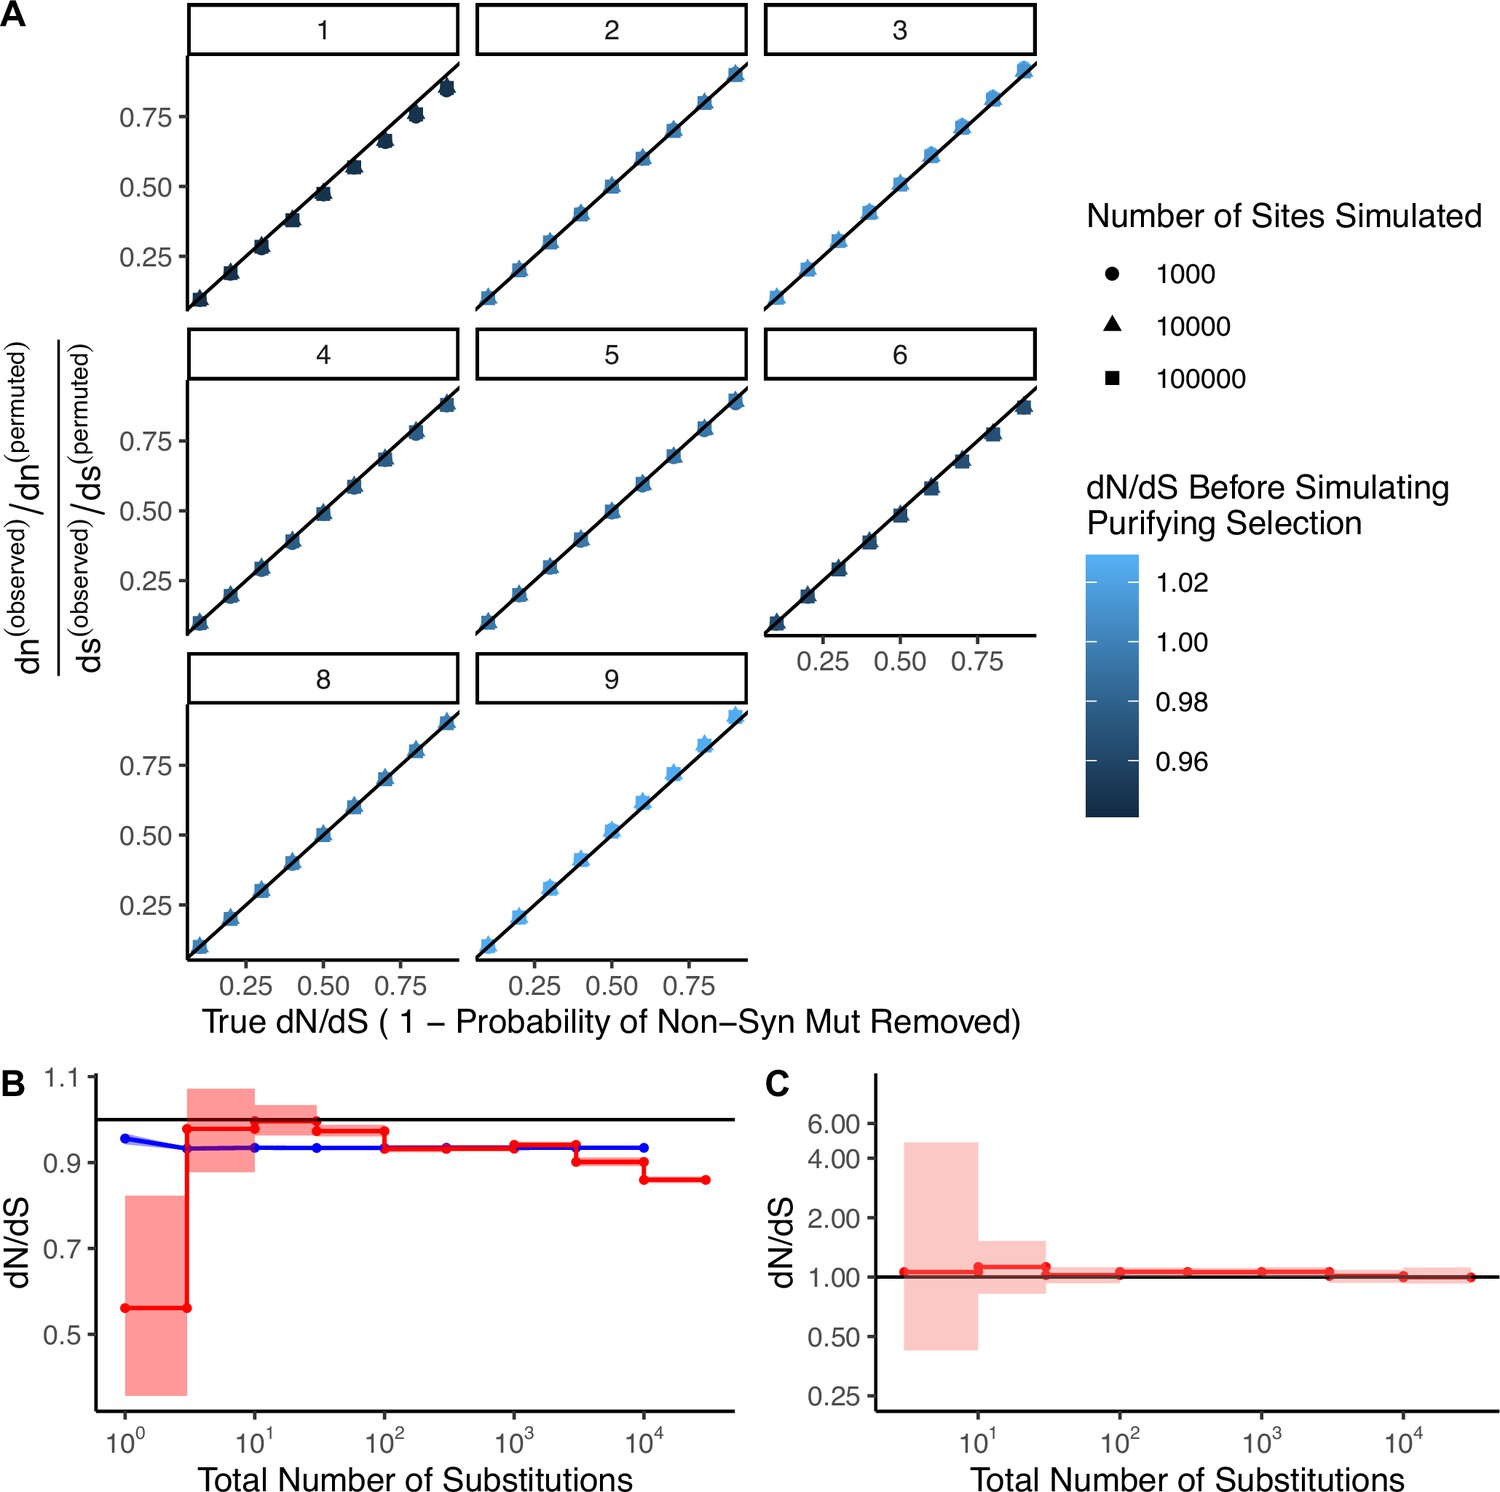
Permutation-based null model of mutagenesis corrects for mutational biases in dN/dS calculations.
(A) Simulations (N=100) of negative selection under extreme mutational bias scenarios where all mutations are generated from a single mutational signature (e.g. APOBEC or smoking, COSMIC signatures 1–9, gray titles). Bias-corrected dN/dS values calculated from these simulations are compared to simulated levels of negative selection. Colors denote bias-corrected dN/dS before negative selection was simulated, which is expected to be neutral (~1). Negative selection is simulated as the probability of randomly removing nonsynonymous mutations, (e.g. a simulated ‘true’ dN/dS of 0.1 defines simulations where each nonsynonymous mutation had a 90% probability of removal). Shapes correspond to different numbers of sites simulated. Black line identifies perfect correspondence between bias-correct dN/dS and simulated (true) dN/dS. (B) 95% confidence intervals of dN/dS in passenger mutations randomly sampled in blue (N=1000) from high mutational burden tumors (>10 substitutions) in the same proportion of sites as binned in Figure 2A. Red line denotes observed dN/dS of passengers in TCGA as depicted in Figure 2A. (C) dN/dS of weakly expressed genes (defined as having <1 TPM across all samples in Genotype-Tissue Expression [GTEx]) in tumors stratified by the total number of substitutions within TCGA. Solid black shows dN/dS values of 1, expected under neutrality. Error bars are shaded 95% confidence intervals determined by bootstrap sampling.
Figure 2—figure supplement 3
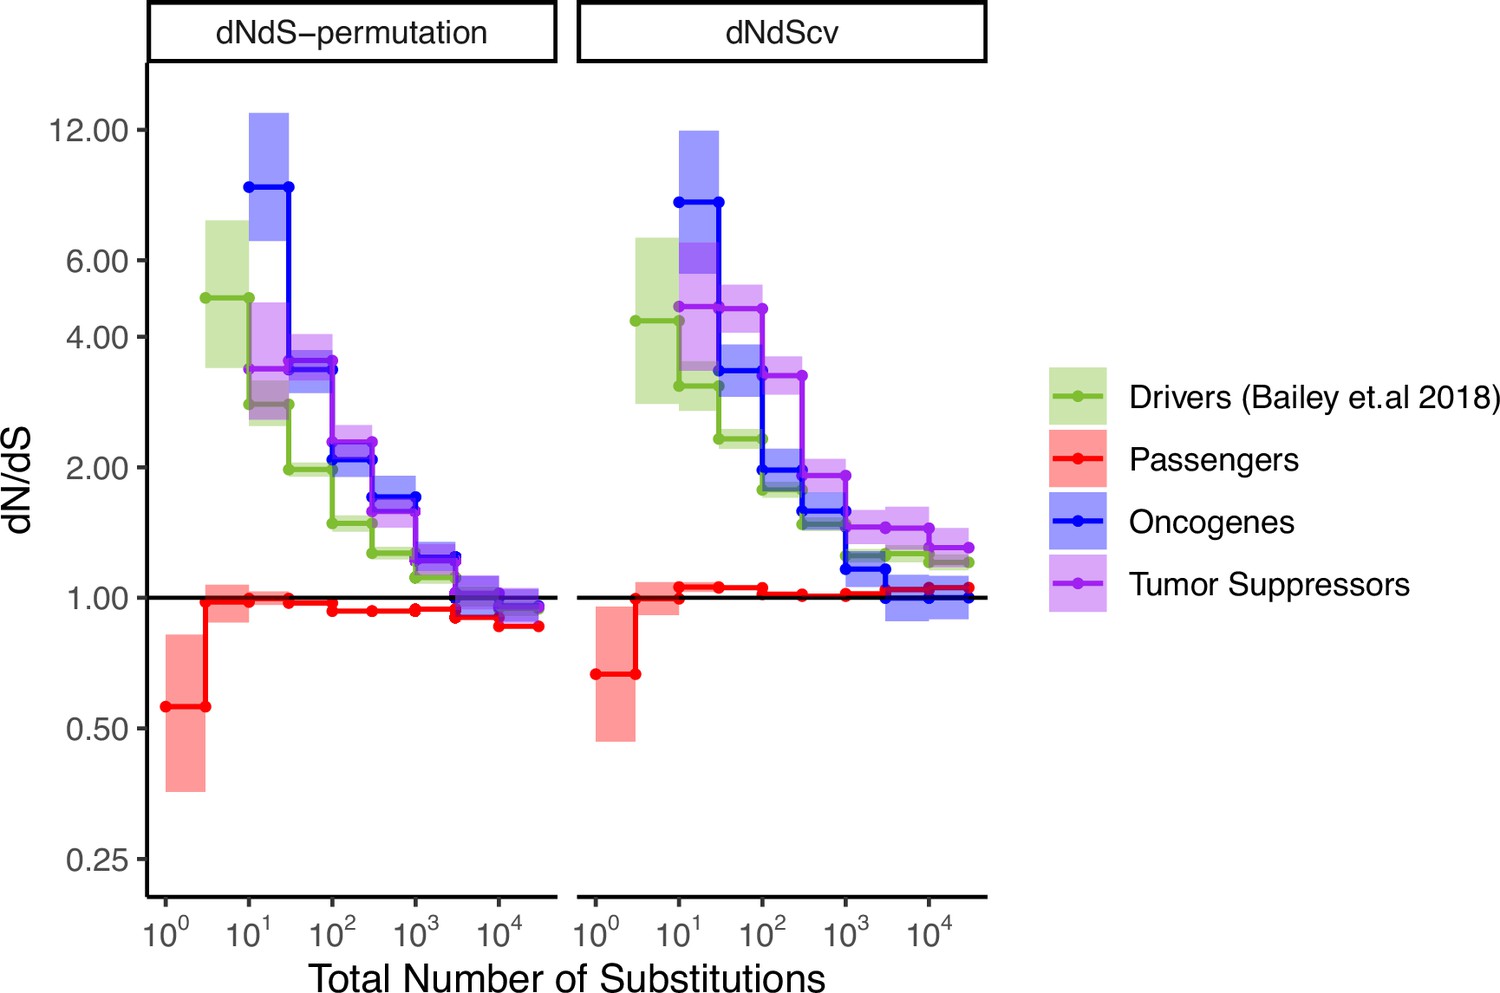
Attenuation of selection with increasing mutational burden in both oncogenes and tumor suppressors.
dN/dS of passenger and driver gene sets (Bailey et al., 2018) within tumors in TCGA stratified by the total number of substitutions present in the tumor (dN+dS). dN/dS is calculated with error bars using a permutation-based null model (left) and dNdScv (right). Tumor suppressors (purple), oncogenes (blue), and pan-cancer driver (green) gene sets are shown. Solid black shows dN/dS values of 1, expected under neutrality. Error bars are 95% confidence intervals determined by bootstrap sampling.
Figure 2—figure supplement 4
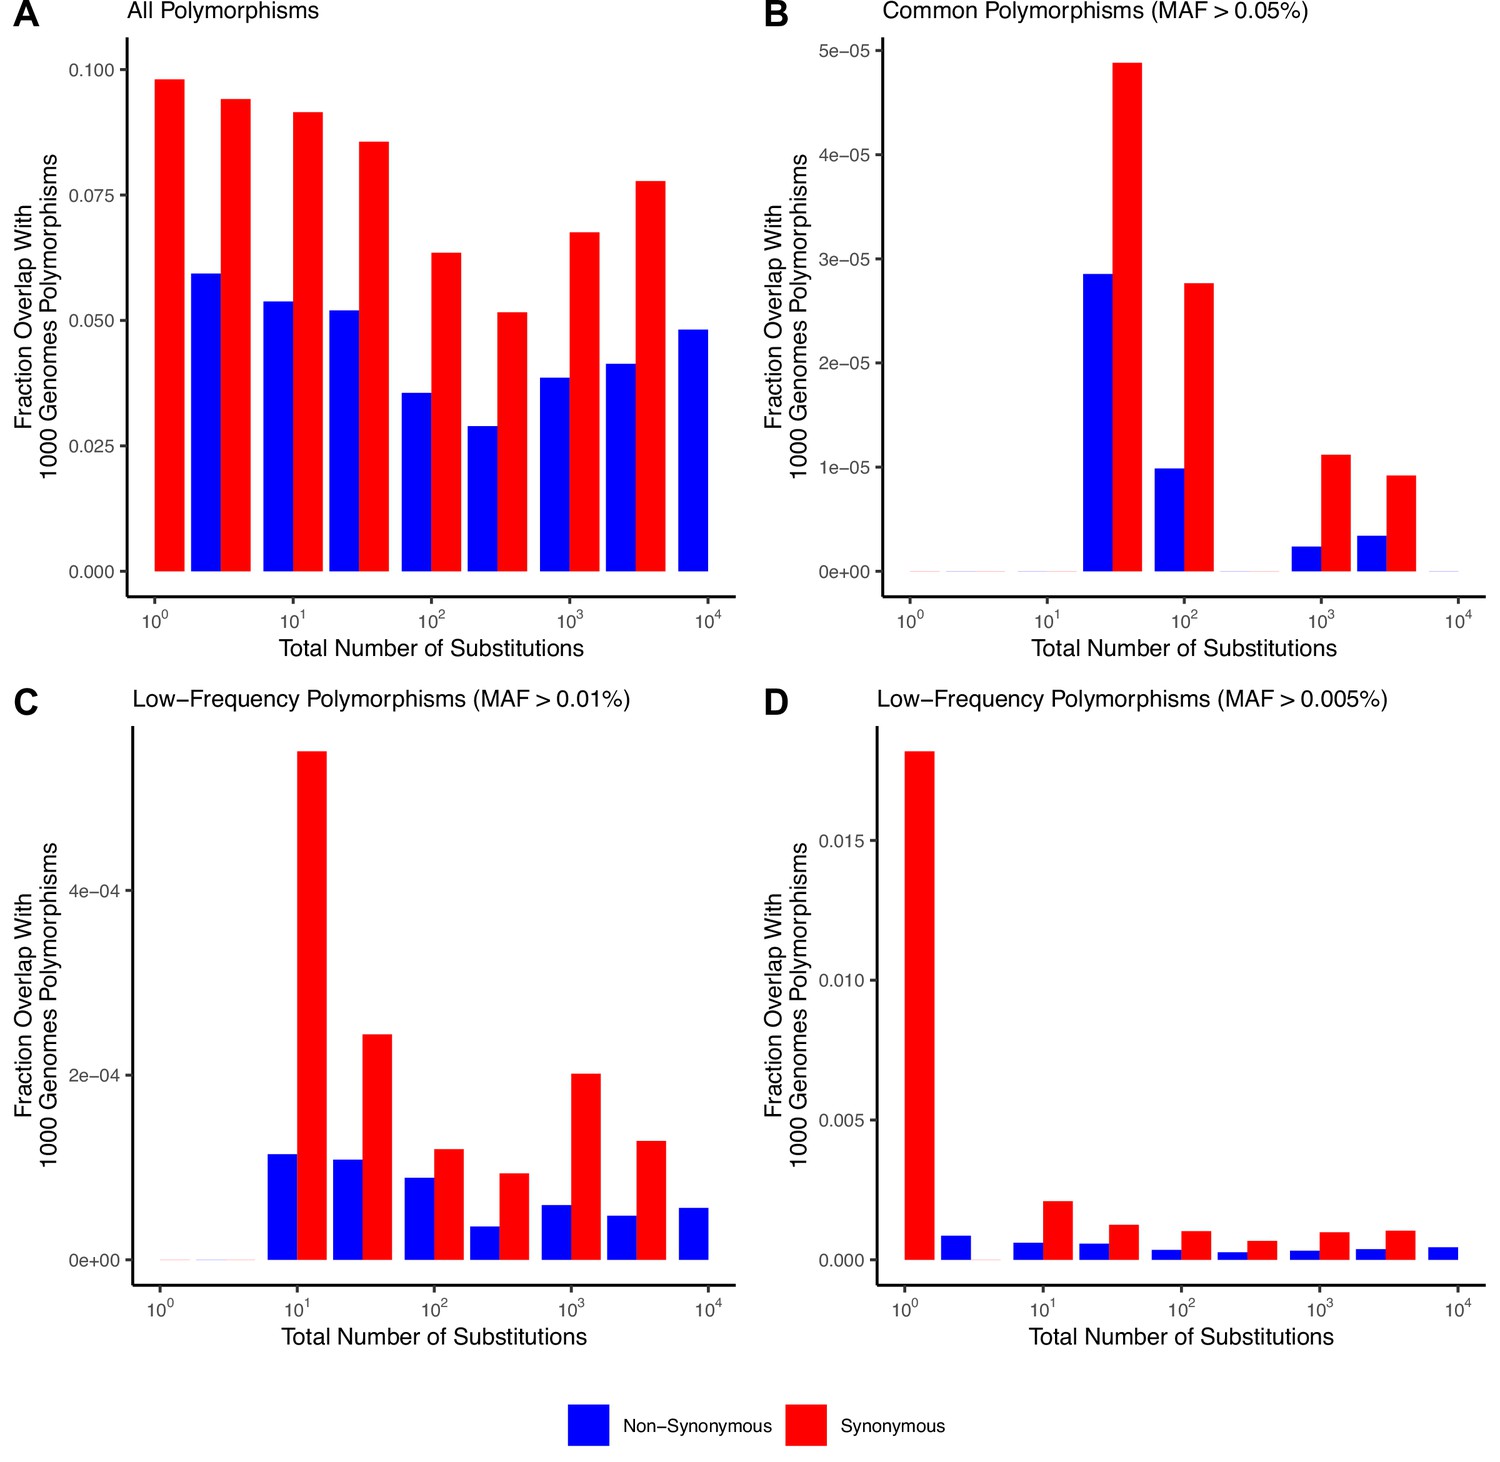
No common germline polymorphisms observed in low mutation rate cancers.
(A) Fraction of mutations that overlap all germline polymorphisms in the 1000 Genomes Project within tumors stratified by the total number of substitutions. (B–D) Fraction of mutations that overlap only common (MAF > 0.05, 0.01, or 0.005) polymorphisms in the 1000 Genomes Project within tumors stratified by the total number of substitutions in TCGA. Colors denote mutations that are synonymous (blue) or nonsynonymous (red). Strong negative germline selection is expected only within common polymorphisms. No mutations within low mutational burden cancers (≤10 substitutions) overlap common polymorphic sites (when MAF > 0.1). Note that there are no synonymous mutations at MAF > 0.05 within low mutational burden cancers that could lower dN/dS rates through germline contamination.
Figure 2—figure supplement 5

Weaker signals of positive selection within cancer-specific drivers.
dN/dS values of passenger and different driver gene sets within tumors in TCGA stratified by the total number of substitutions present in the tumor (dN+dS). dN/dS is calculated with error bars using a permutation-based null model (left) and dNdScv (right). Pan-cancer driver (lime) and cancer-specific (blue) driver gene sets identified by Bailey et al., 2018, are shown. Pan-cancer driver genes identified in this study also exhibited stronger signatures of positive selection than driver genes identified by COSMIC (Futreal et al., 2004) (light green) and Intogen (Gonzalez-Perez et al., 2013) (forest green). Hence, pan-cancer drivers from Bailey et al., 2018, were used throughout this study. Cancer-specific gene sets are defined as the top 100 recurrently mutated genes within the particular cancer type, and used separately for each of the 33 cancer types in TCGA. Solid black shows dN/dS values of 1, expected under neutrality. Error bars are 95% confidence intervals determined by bootstrap sampling.
Figure 2—figure supplement 6
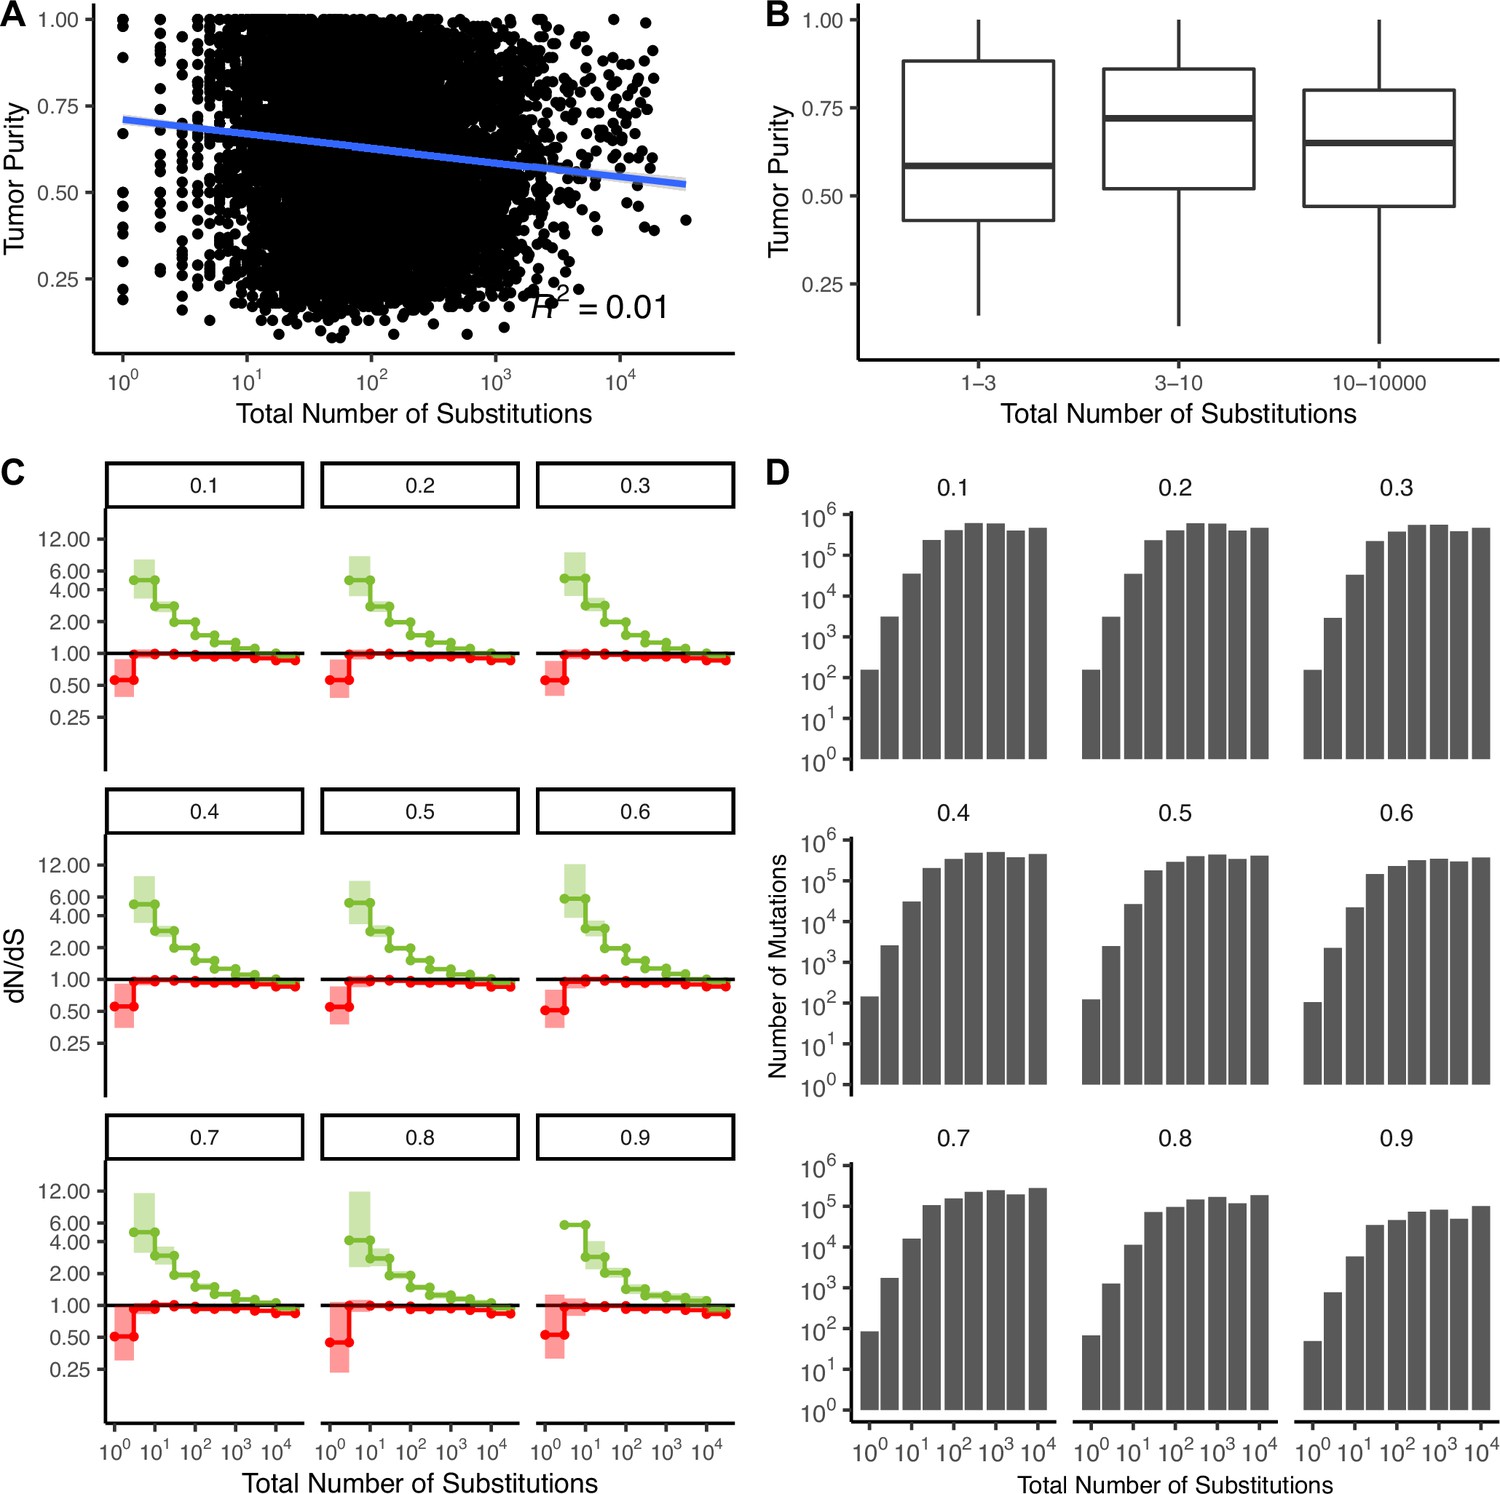
Patterns of attenuated selection persist across tumor purity thresholds.
(A) Correlation between tumor purity (calculated by GDC using the ABSOLUTE [Johnson, 1999] algorithm, Materials and methods) and the total number of substitutions in all TCGA samples (R2 = −0.01). Blue line denotes a linear regression fit and gray colors denote the 95% confidence intervals for the fit of this linear model. (B) Boxplot of tumor purity in TCGA samples stratified into low mutation rate bins (1–3 and 3–10 substitutions) and high mutation rate bins (10–10,000 substitutions). (C) dN/dS in driver (green) and passenger (red) gene sets of tumors in TCGA stratified by the total number of substitutions after removing tumors below various purity thresholds using a permutation-based null model. Values at the top denote the threshold of tumors removed from the analysis (e.g. 0.3 shows dN/dS of tumors with a purity ≥0.3). (D) Number of mutations in each bin within (C) after removing tumors at increasing purity thresholds. Error bars are 95% confidence intervals determined by bootstrap sampling.
Figure 2—figure supplement 7

Comparison of dN/dS to results in Martincorena et al., 2017, for tumors stratified by mutational burden.
(A) dN/dS in driver (green), passenger (red), and all gene sets (gray) of tumors in TCGA stratified by the total number of substitutions using nine bins of equal width (log-scale TMB), as depicted in Figure 2. Left panel uses our non-parametric null model of mutagenesis to calculate dN/dS, while the right panel uses dNdScv (from Martincorena et al., 2017) as a null model of mutagenesis. Error bars are 95% confidence intervals determined by bootstrap sampling. (B) dN/dS of driver (green), passenger (red), and all gene sets (gray) of tumors in TCGA stratified by the total number of substitutions using 20 bins of equal sample sizes, as was done in Figure 5 of Martincorena et al., 2017. The binning scheme and linear axes compress results at low TMB. To replicate Martincorena et al., 2017, three tumor types were also excluded in this analysis: UVM, CHOL, and DLBC. dNdScv was used as a null model of mutagenesis. dN/dS for driver and passenger genes sets was not calculated in Figure 5 of Martincorena et al., 2017. Error bars are 95% confidence intervals derived from dNdScv.
Figure 2—figure supplement 8
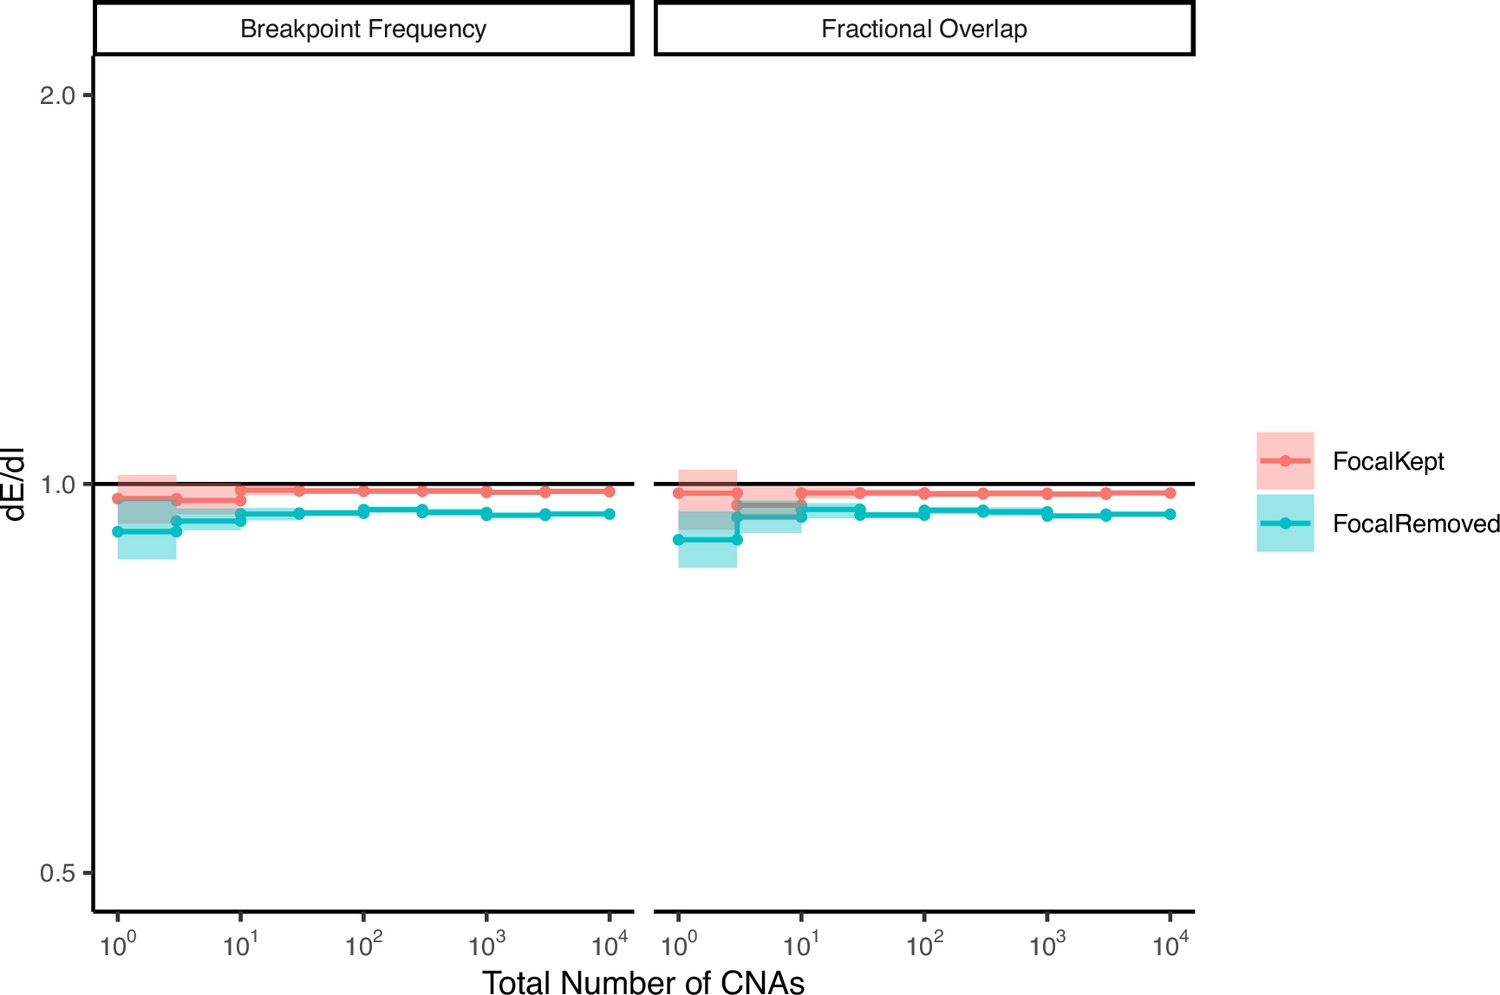
Random permutations of the positions of observed copy number alterations (CNAs) exhibit neutral values of dE/dI.
The stop and start location of each observed CNA was randomly permuted, while preserving its length. dE/dI was calculated for CNAs (with and without non-focal amplifications) using both metrics: breakpoint frequency and fractional overlap. dE/dI values of random permutations are ~1, as expected for CNAs not experiencing selection.
Figure 2—figure supplement 9
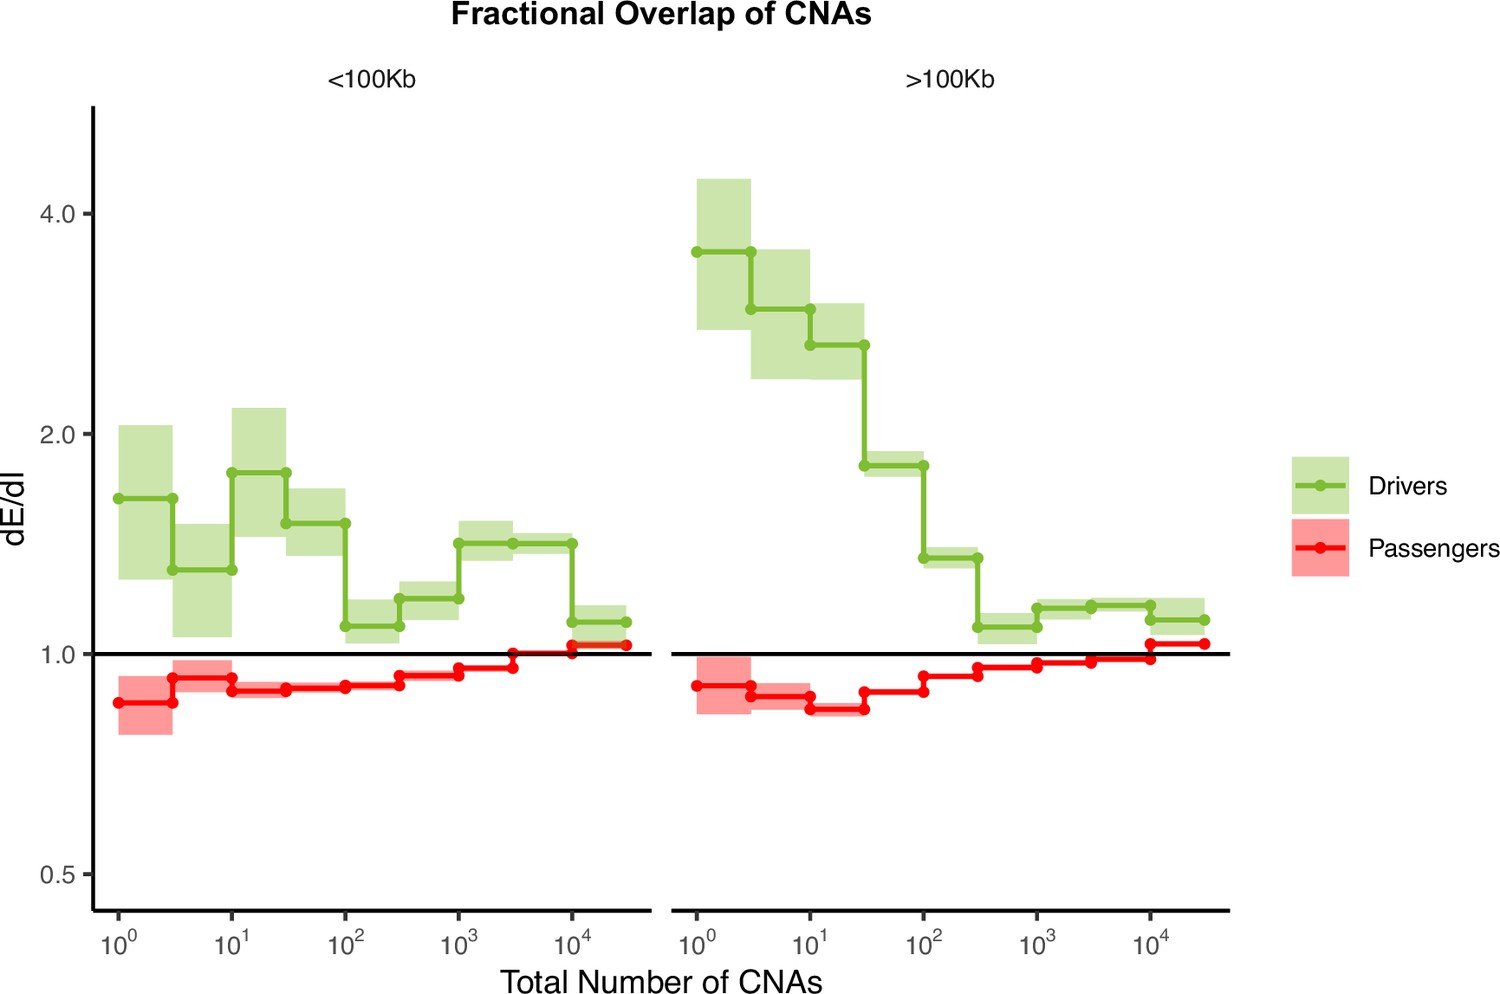
Fractional overlap of copy number alterations (CNAs) within exomic regions (dE) relative to intergenic regions (dI) exhibits similar patterns of selection as fractional overlap.
Calculations of fractional overlap (Zack et al., 2013) of exomic regions (dE) to intergenic (dI) regions within passenger and GISTIC (Mermel et al., 2011) driver gene sets in tumors stratified by the total number of CNAs present. dE/dI is shown separately for CNAs >100 kb in length (right) and smaller than 100 kb in length (left). Solid black line of 1 denotes values expected under neutrality. Error bars are 95% confidence intervals determined by bootstrap sampling.
Figure 2—figure supplement 10
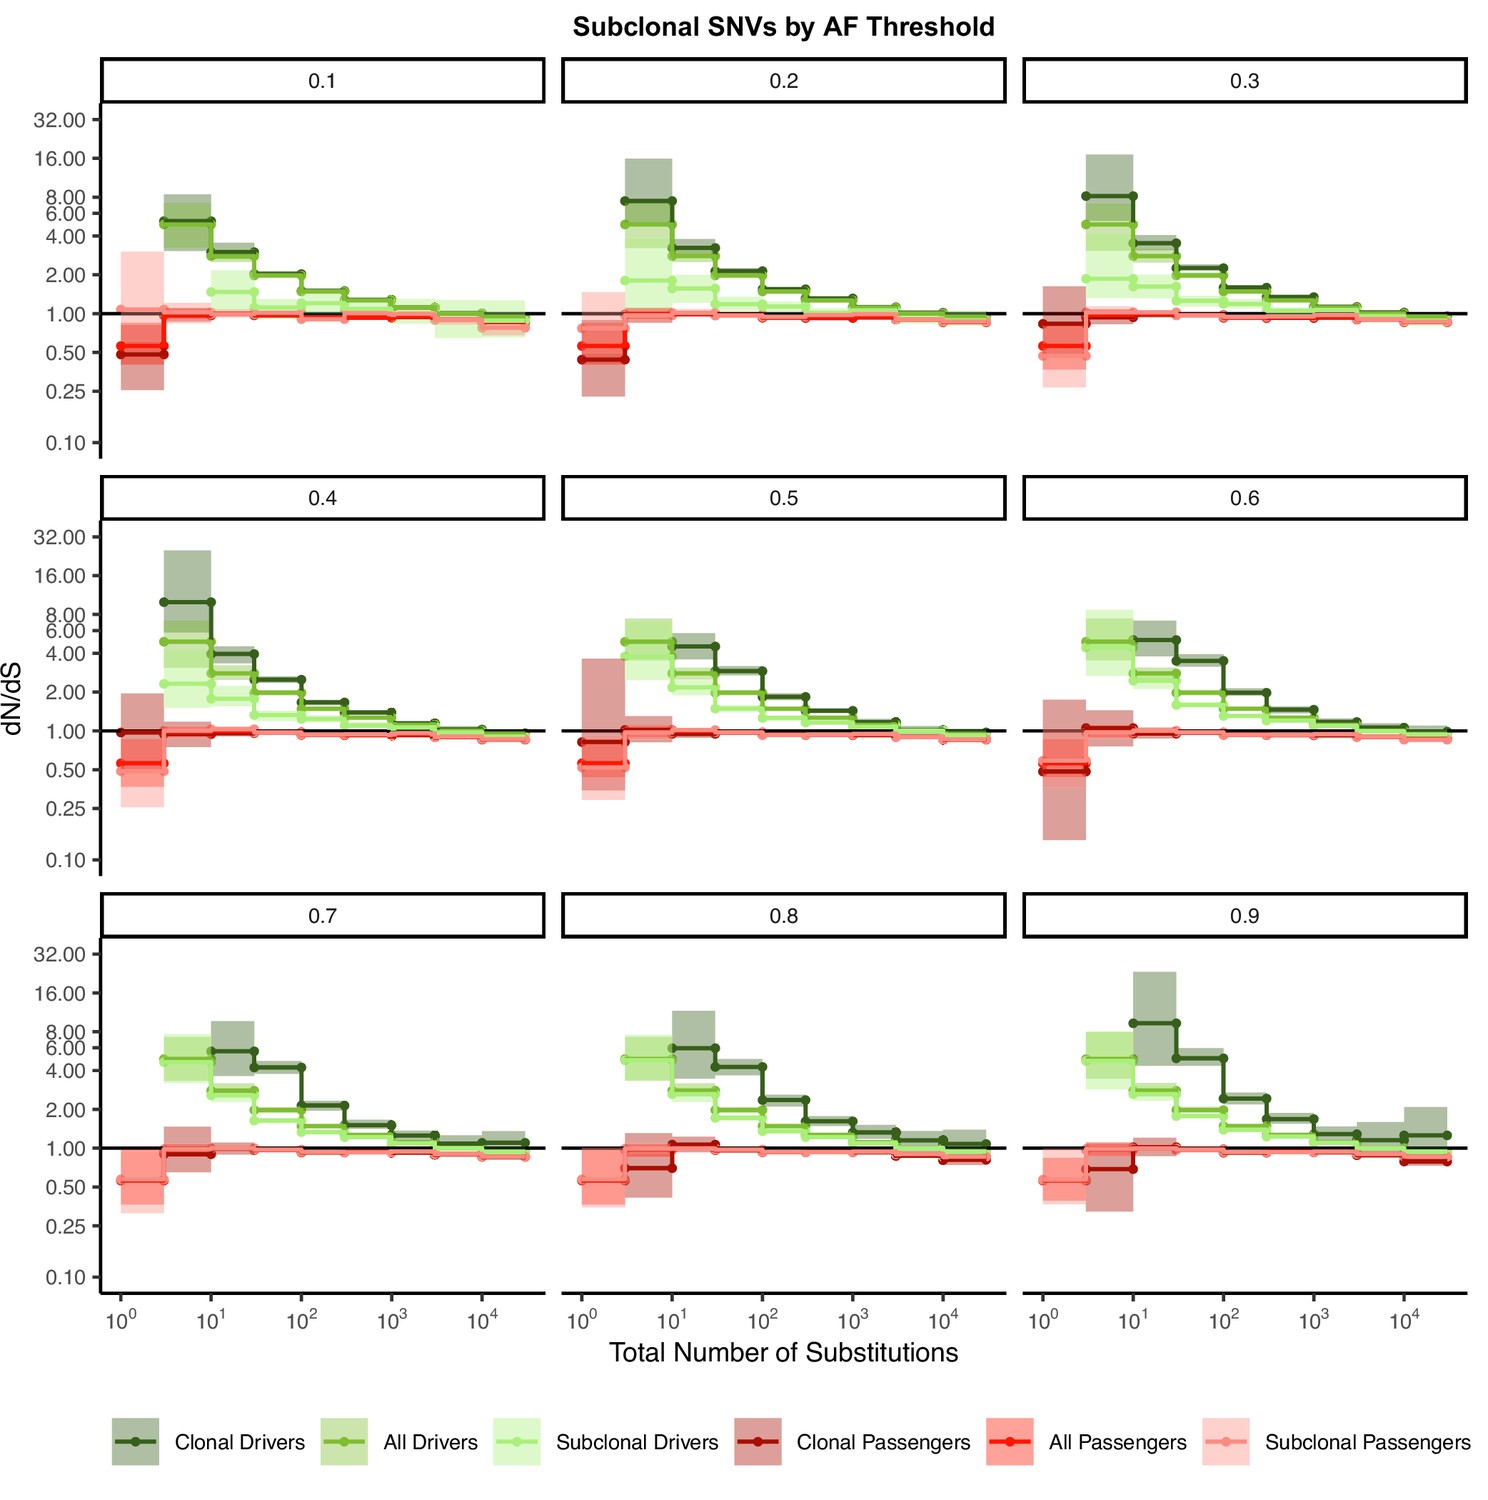
Signal of negative selection in subclonal mutations are robust to variant allele frequency (VAF) threshold.
dN/dS calculations within clonal and subclonal passenger and driver gene sets within tumors in TCGA stratified by the total number of substitutions using a permutation-based null model of mutagenesis. Title of each graph corresponds to increasing VAF threshold value used to define ‘subclonal’ (e.g. mutations with a VAF > 0.2 are clonal; mutations with a VAF < 0.2 are subclonal). Darker colors denote clonal passengers and drivers, while lighter colors denote subclonal passengers and drivers. ‘All Passengers’ and ‘All Drivers’ contain the entire set of all clonal and subclonal passengers or drivers as a reference. Solid line of 1 is shown of dN/dS values expected under neutrality. Error bars are 95% confidence intervals determined by bootstrap sampling.
Figure 2—figure supplement 11
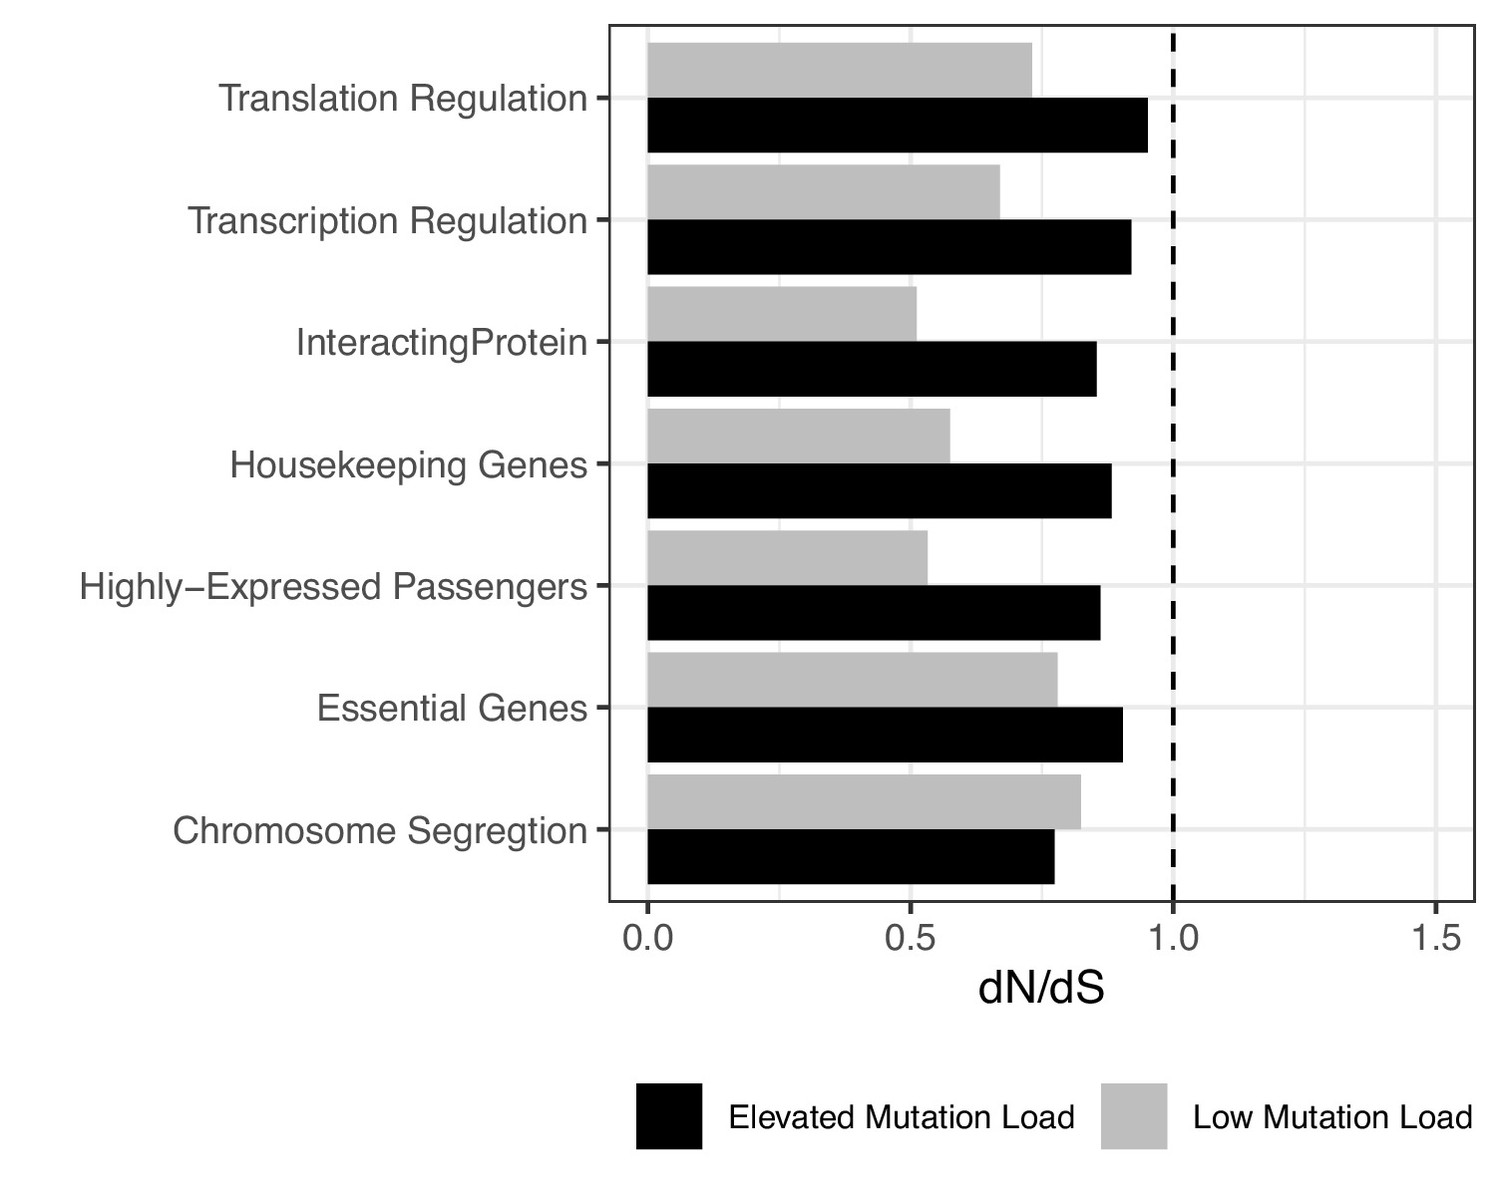
Attenuation of negative selection within different functional gene sets.
dN/dS of passengers within different functional gene sets in the highest (black) and lowest (gray) mutational burden bin across all tumors using a permutation-based null model of mutagenesis. Dotted line denotes genome-wide dN/dS of passengers for all mutation rates. Error bars are 95% confidence intervals determined by bootstrap sampling. Patterns of negative selection are not specific to any functional category shown here. Functional gene sets were chosen based on previous literature that supports these categories as being relevant to protein misfolding (i.e. translation, transcription, highly expressed genes, genes with high degrees of protein-protein interaction) (Drummond and Wilke, 2009) or has been previously reported to be under constraint (e.g. genes related to chromosome segregation and essential or housekeeping genes) (Zhang and Li, 2004; Potapova and Gorbsky, 2017).
Figure 2—figure supplement 12
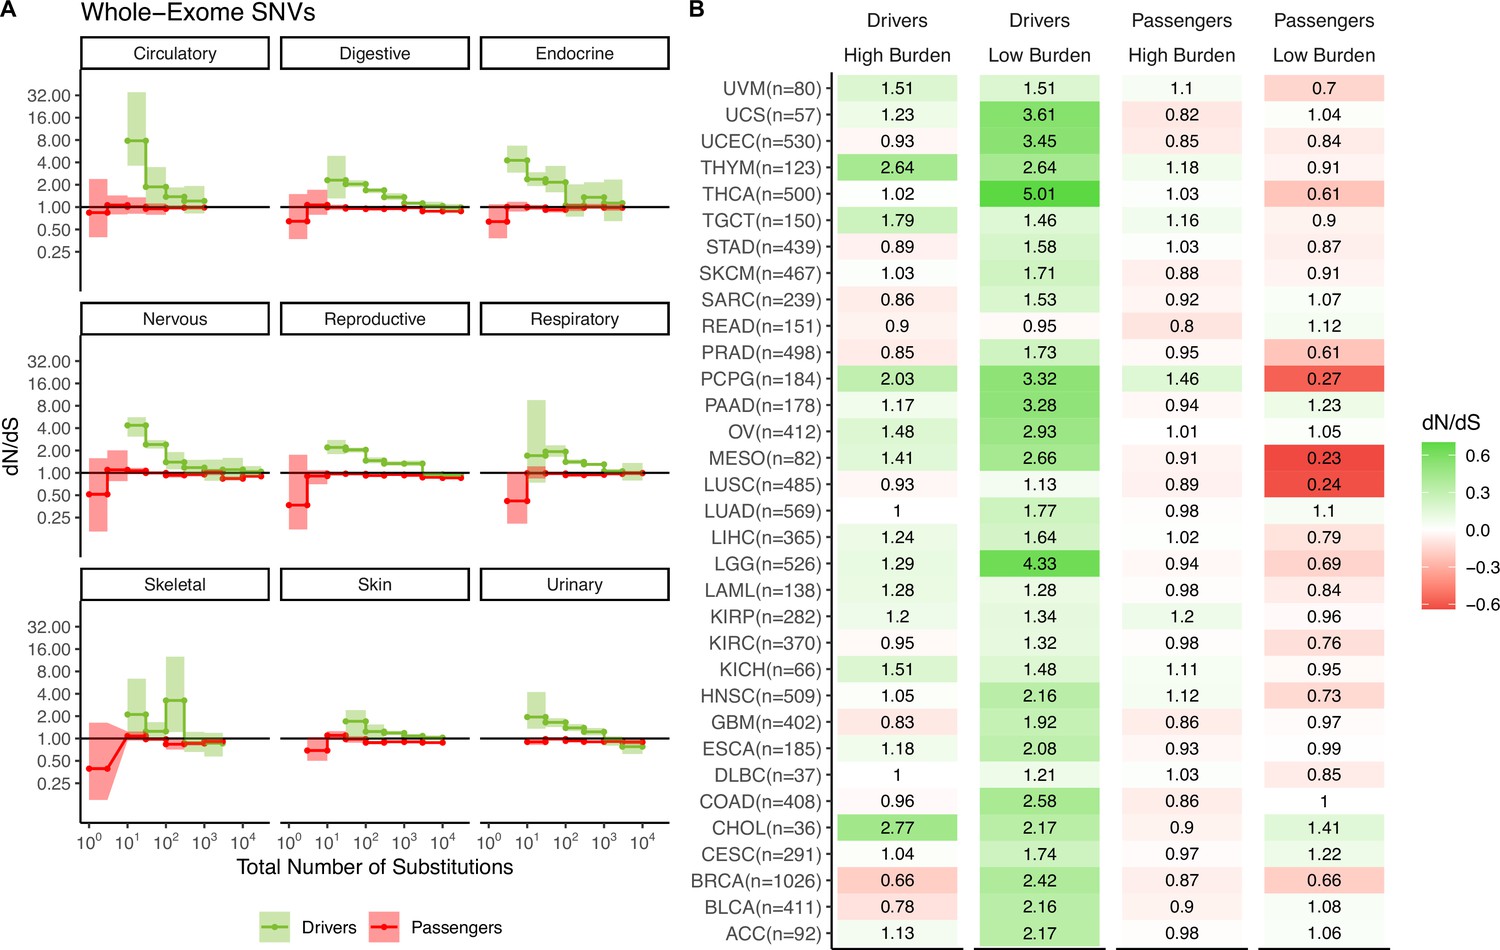
Attenuation of selection in somatic nucleotide variants (SNVs) persists across cancer subtypes and broad cancer group categories.
(A) dN/dS in passenger and driver gene sets within tumors stratified by the total number of substitutions in broad tumor sub-categories. Error bars are 95% confidence intervals determined by bootstrap sampling. (B) Log-scale heatmap of dN/dS values in passenger and driver gene sets of tumors stratified by the total number of substitutions within all 33 cancer subtypes in TCGA. dN/dS of the lowest and highest mutational burden bin and the total number of tumors for each cancer subtype are shown.
Figure 2—figure supplement 13
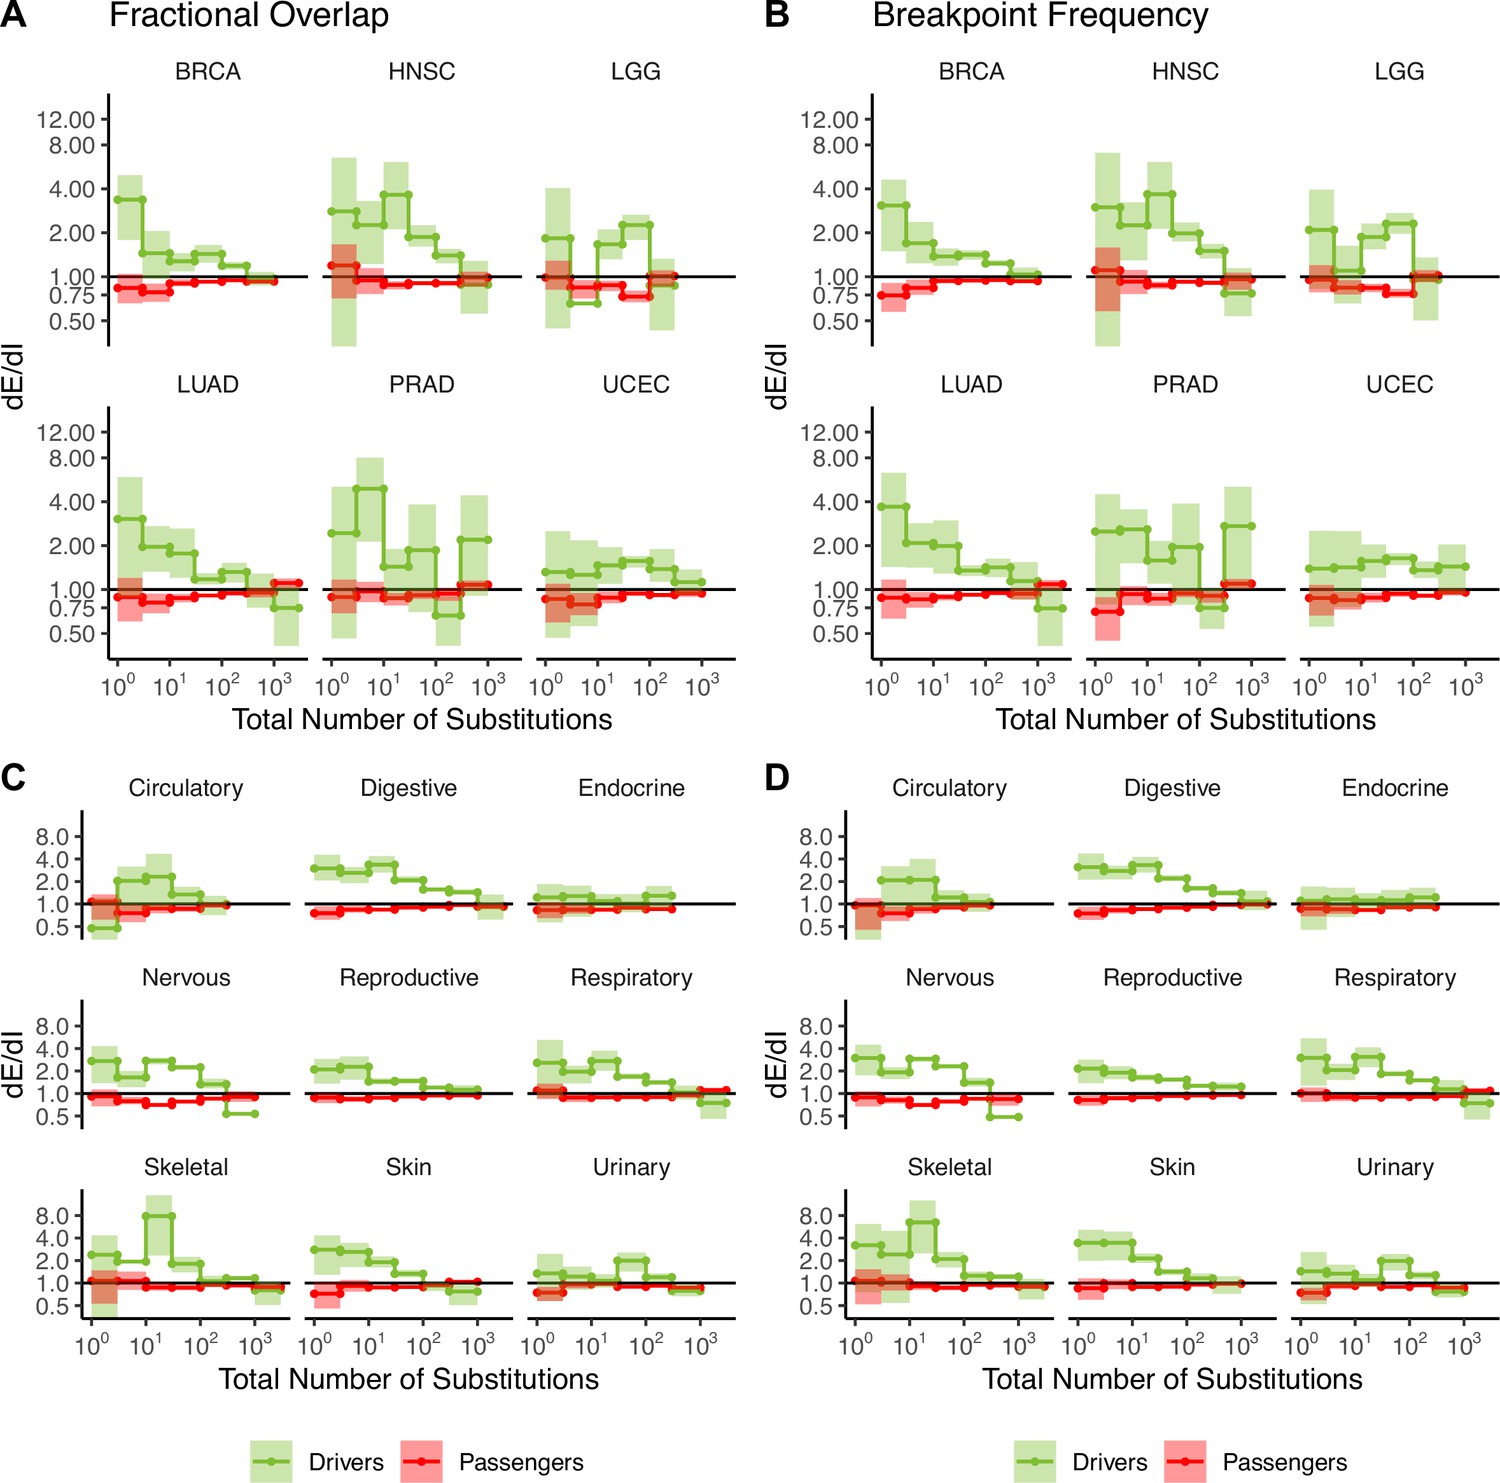
Attenuation of selection in copy number alterations (CNAs) in cancer subtypes and broad cancer group categories.
dE/dI in driver (green) and passenger (red) gene sets in tumors stratified by the total number of CNAs for the six most commonly sequenced cancer subtypes (presented in Figure 2) calculated using (A) normalized fractional overlap and (B) breakpoint frequency. dE/dI in driven and passenger gene sets in tumors stratified into broad cancer groups calculated using (C) normalized fractional overlap and (D) normalized breakpoint frequency. dE/dI > 1 suggests positive selection, while dE/dI < 1 suggests negative selection.
Figure 2—figure supplement 14
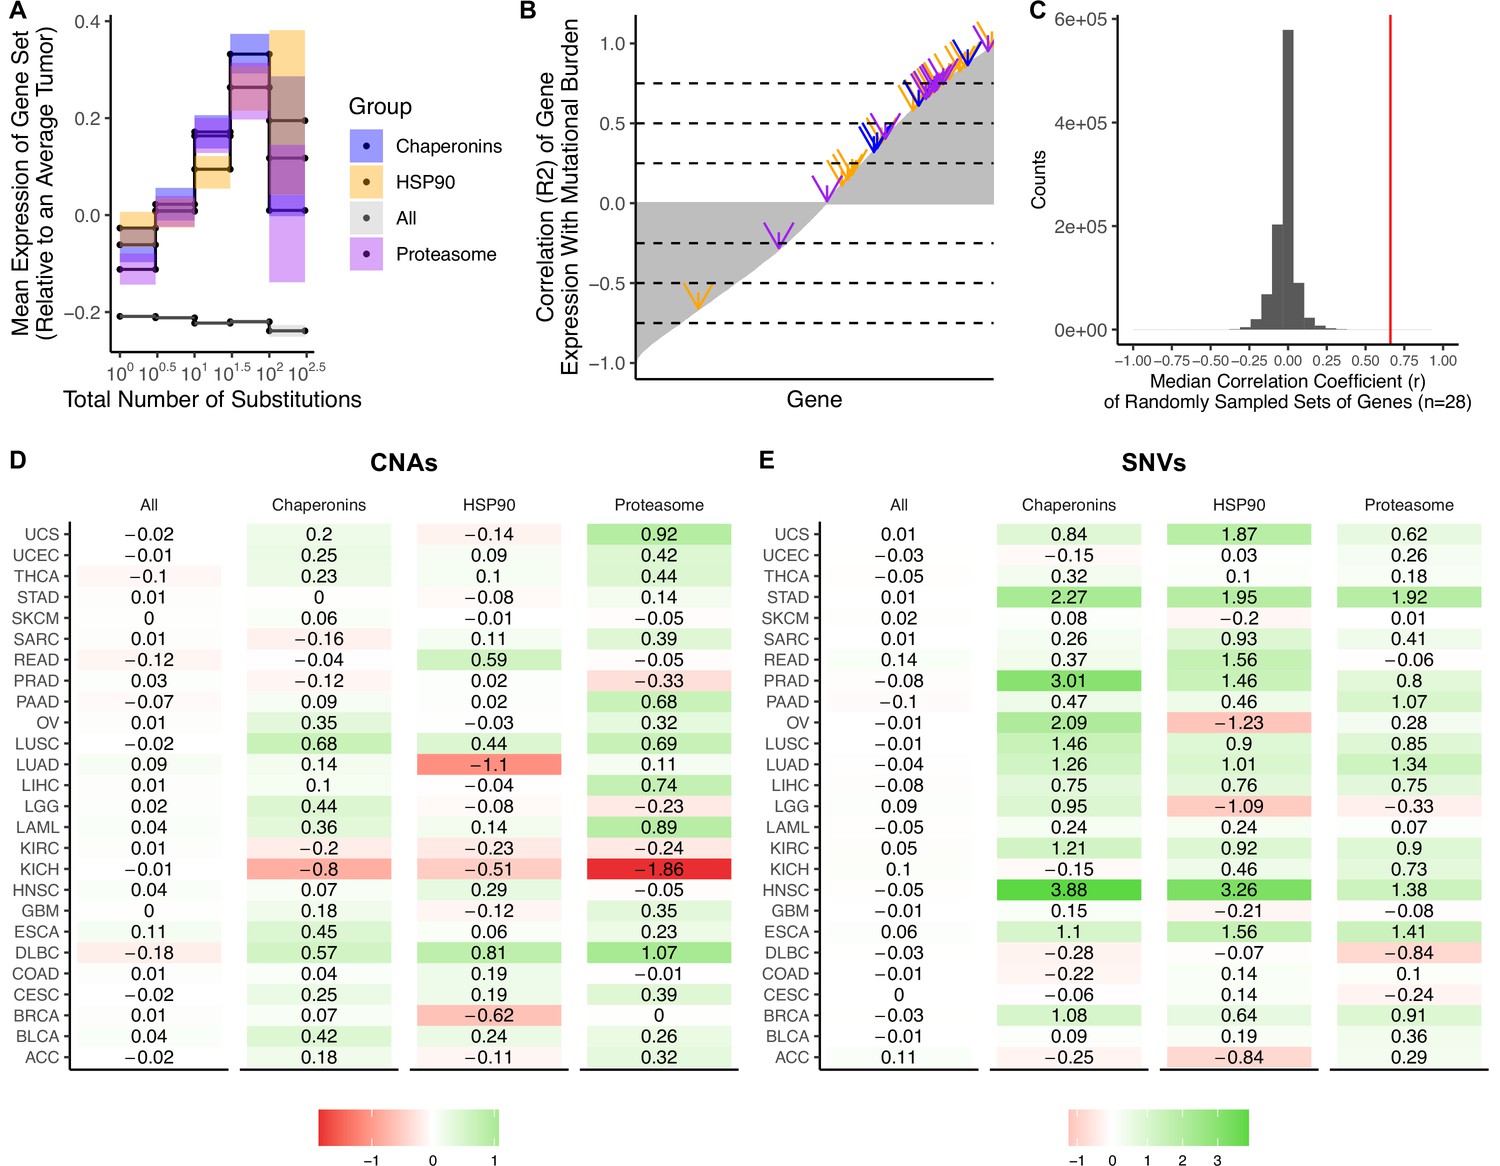
Upregulation of heat shock protein pathways in tumors with elevated mutational burdens.
(A) Z-scores of median gene expression of (i) all genes, (ii) HSP90, (iii) Chaperonins, and (iv) the Proteasome averaged across tumors stratified by the total number of copy number alterations (CNAs). Expression of HSP90, Chaperonins, and Proteasome gene sets increases with the mutational burden of tumors (weighted R2 of 0.81, 0.87, and 0.86, respectively). Error bars are 95% confidence intervals determined by bootstrap sampling. (B) Correlation coefficients (r) of the expression of each gene in the genome (gray) in tumors stratified by the total number of substitutions. Shown in arrows are the correlation coefficients for HSP90 (blue), Chaperonins (orange), and the Proteasome (purple). Dashed lines in intervals of 0.25 are for viewing purposes only. (C) Median correlation coefficients of 10 million randomly sampled gene sets of the same size as HSP90, Chaperonins, and the Proteasome (n=28) in gray. Red line denotes the median correlation coefficients of genes in HSP90, Chaperonins, and the Proteasome (0.66). (D–E) Log-scale heatmap of changes in the Z-scores of median gene expression values of gene sets in for tumors stratified by the total number of substitutions (D) or CNAs (E) for cancer subtypes in TCGA. Changes in the mean gene expression of all genes, HSP90, Chaperonins, and Proteasome gene sets in the lowest and highest mutational burden bin for each cancer subtype are shown. Colors denote whether changes in gene expression from low mutational burden bins to high mutational burden bins are positive (green) or negative (red). Expression of HSP90, Chaperonins, and Proteasome gene sets increases with the mutational burden of tumors across cancer types stratified by the number of somatic nucleotide variants (SNVs) (p<0.05, p<1.3 × 10⁻⁴, p<5.2 × 10⁻⁴, respectively; Wilcoxon signed-rank test) and CNAs (p>0.05, p<9.3 × 10⁻³, p<1.9 × 10⁻² respectively; Wilcoxon signed-rank test).
Figure 2—figure supplement 15
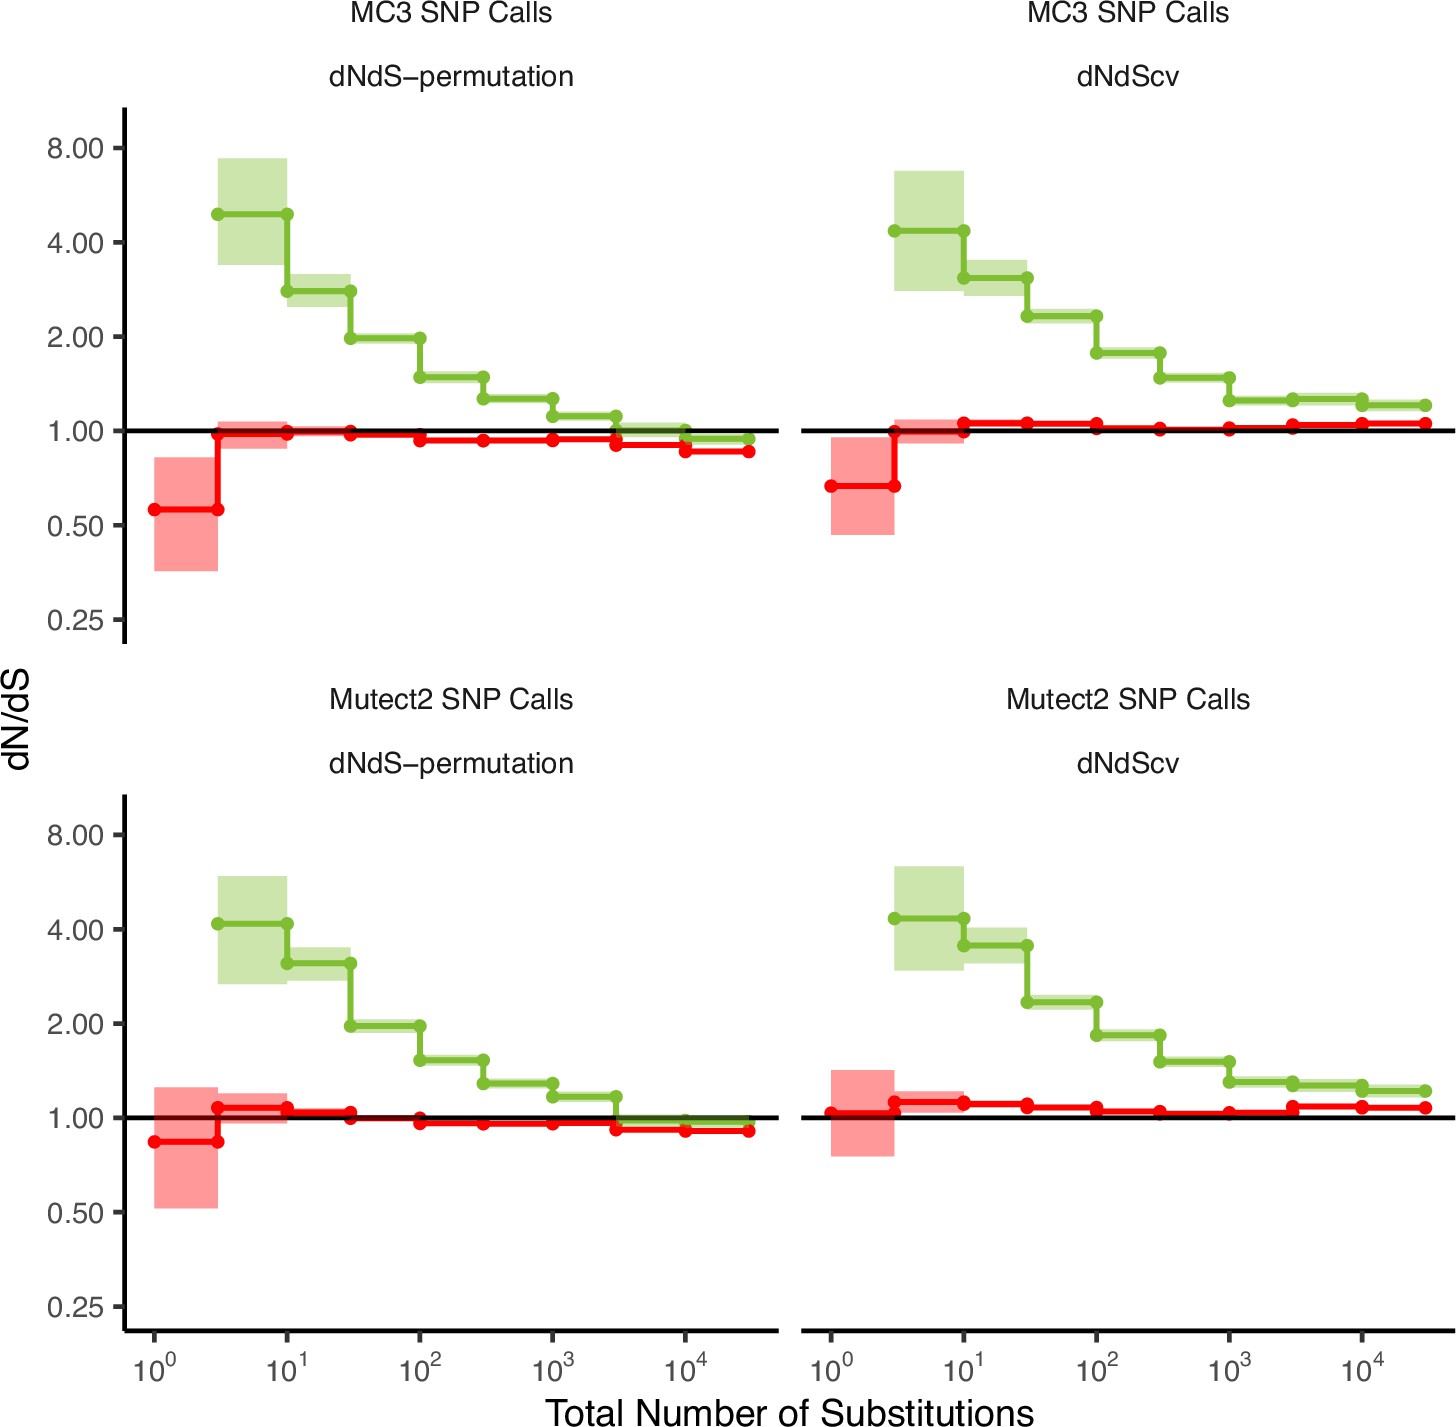
The power to detect signals of selection is dependent on the quality of mutation calls.
dN/dS values in passenger and driver gene sets within tumors in TCGA stratified by the total number of substitutions when using low-quality mutations (bottom panels, ‘Mutect2 SNP Calls’) and high-quality mutations (top panels, ‘MC3 SNP Calls’). ‘MC3 SNP Calls’ are a consensus set of mutations from seven different mutation callers and ‘Mutect2 SNP calls’ are mutations calls from one mutation caller. dN/dS is calculated with error bars using a permutation-based null model (left) and dNdScv (right). A dN/dS of 1 (solid black line) is expected under neutrality. Error bars are 95% confidence intervals determined by bootstrap sampling.
Figure 2—figure supplement 16
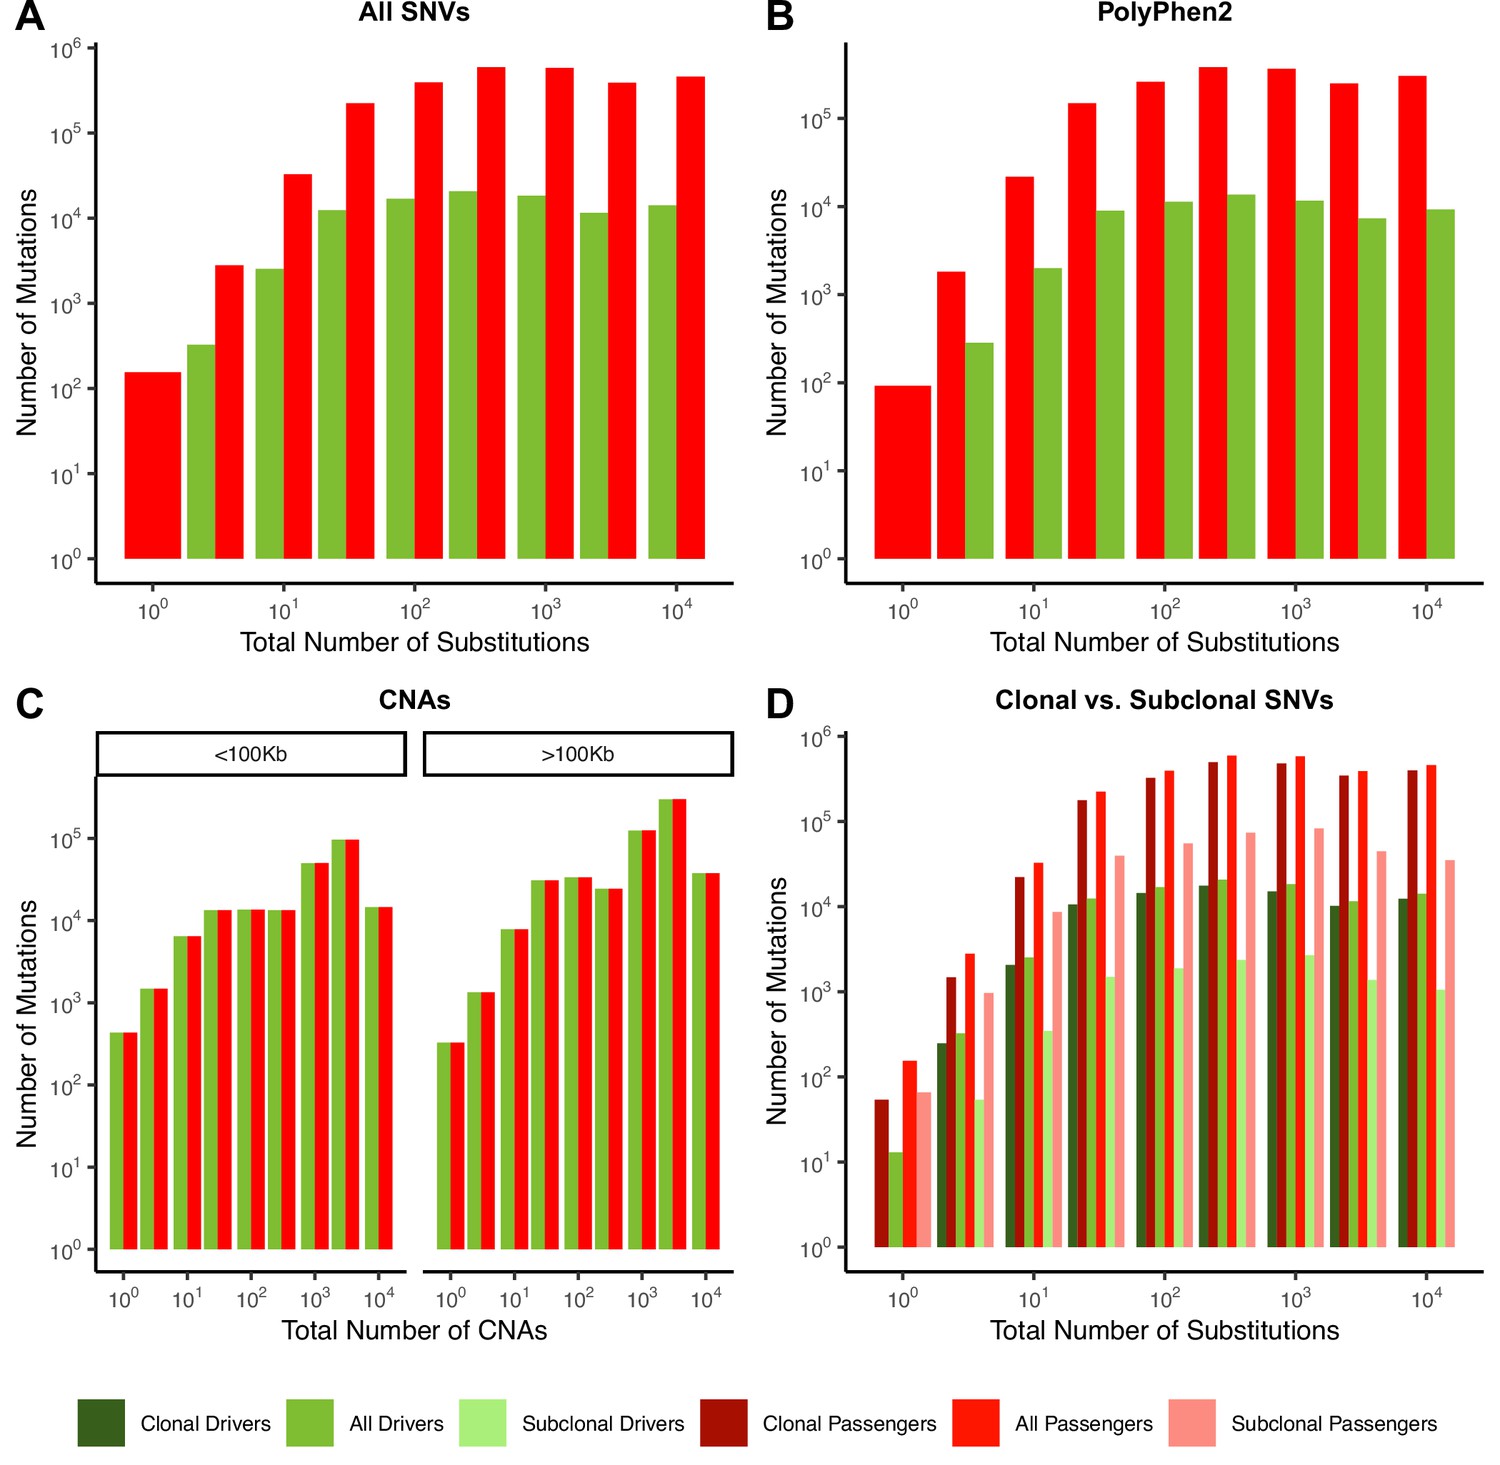
Quantity of mutations within each mutational burden bin for data depicted in Figure 2.
(A–D) all report the total number of samples used in their respective figure pane within Figure 2. (A) Counts of mutations in passenger (red) and driver (green) gene sets within tumors stratified by the total number of substitutions in ICGC and TCGA. (B) Counts of the fraction of pathogenic missense mutations, annotated by PolyPhen2, in the same driver and passenger gene sets also stratified by total number of substitutions. (C) Counts of copy number alterations (CNAs) that reside within putative driver and passenger gene sets (identified by GISTIC 2.0, Materials and methods) in tumors stratified by the total number of CNAs and separated by CNA length. (D) Counts of clonal (VAF > 0.2; darker colors) and subclonal (VAF < 0.2; lighter colors) passenger and driver gene sets in tumors stratified by the total number of substitutions.
Figure 3 with 6 supplements
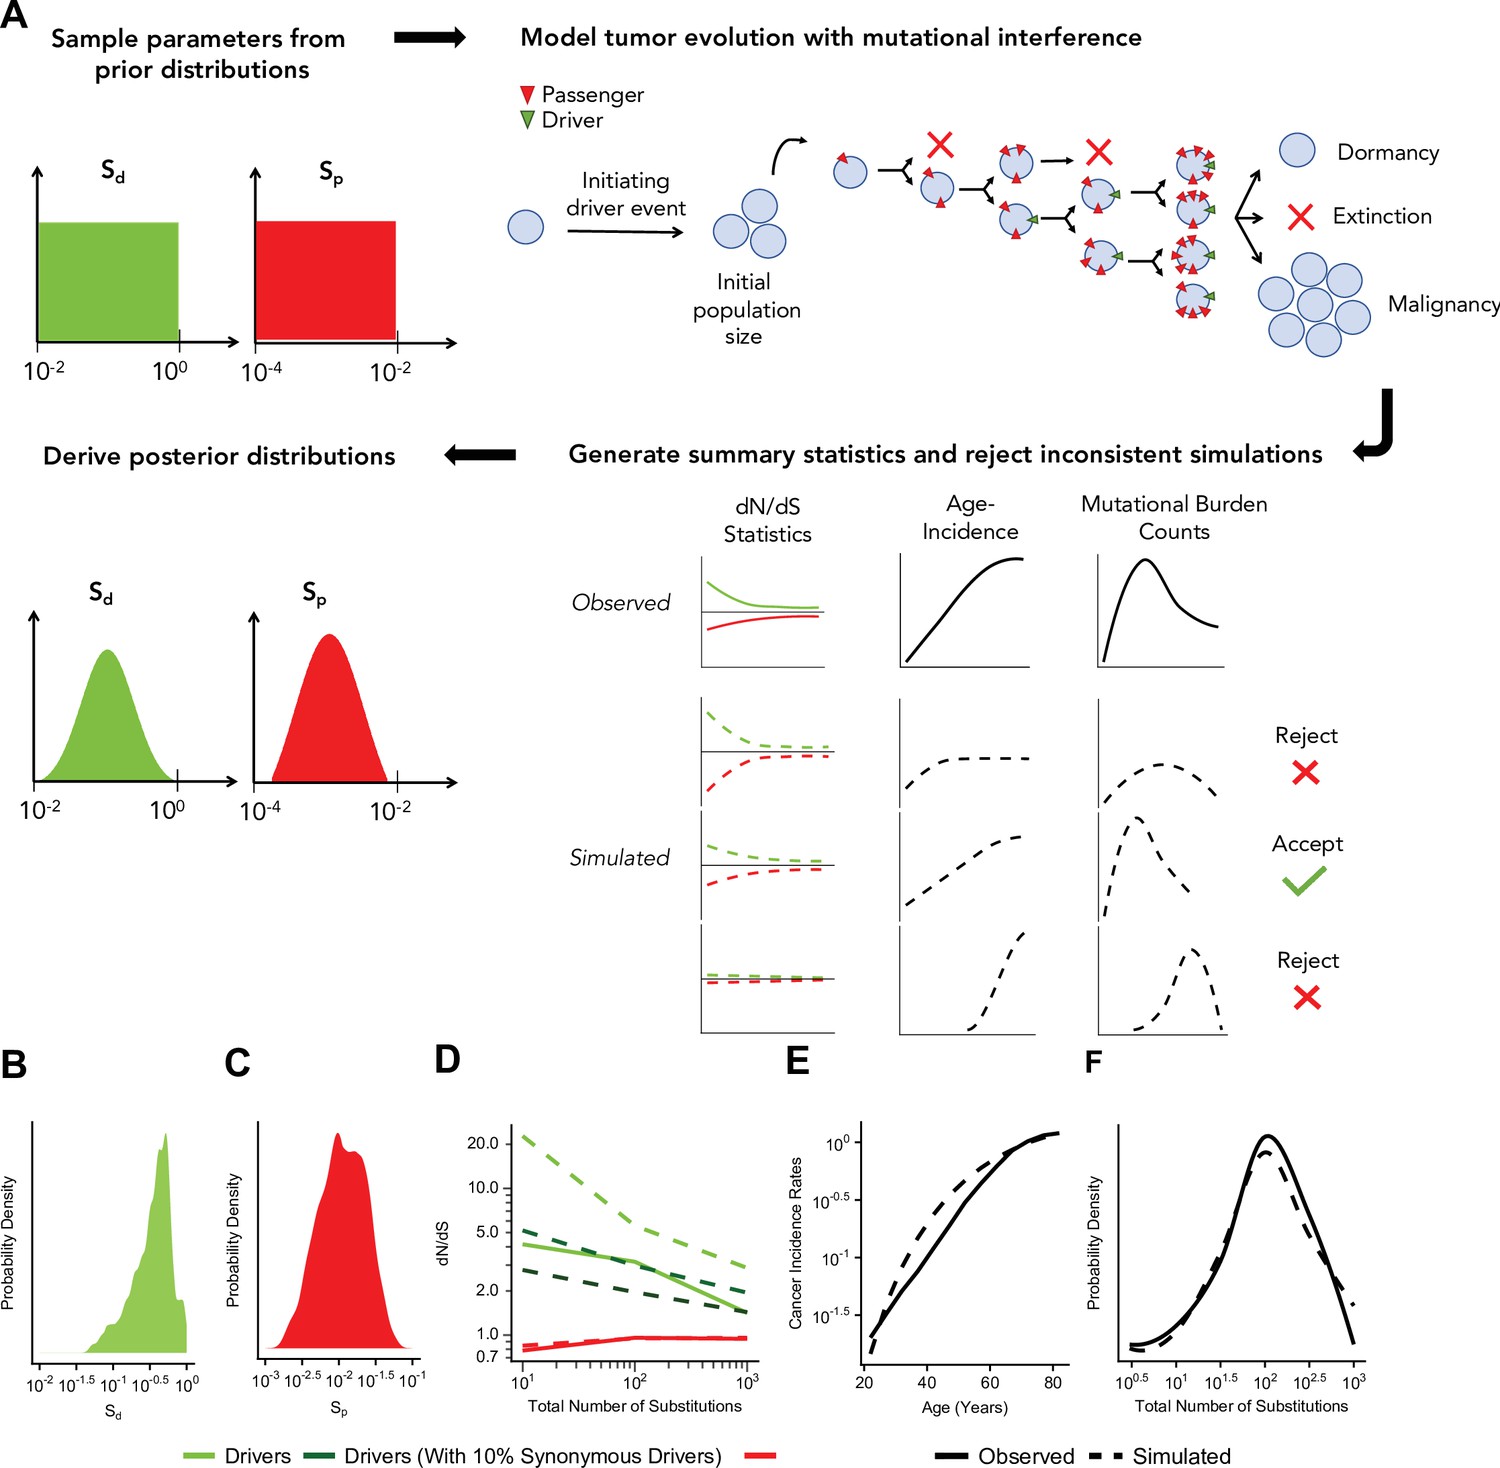
Approximate Bayesian computation (ABC) procedure estimates the strength of selection in passengers and drivers.
(A) Schematic overview of the ABC procedure used. A model of tumor evolution with genome-wide linkage contains two parameters – sdrivers (mean fitness benefit of drivers) and spassengers (mean fitness cost of passengers) – sampled over broad prior distributions of values. Simulations begin with an initiating driver event that establishes the initial population size of the tumor. The birth rate of each individual cell within the tumor is determined by the total accumulated fitness effects of drivers and passengers. If the final population size of the tumor exceeds 1 million cells within a human lifetime (100 years), patient age and accrued mutations are recorded. Summary statistics of four relationships are used to compare simulations to observed data: (i) dN/dS rates of drivers and (ii) passengers across mutational burden, (iii) rates of cancer incidence vs. age, and (iv) the distribution of mutational burdens. Simulations that excessively deviate from observed data are rejected (Materials and methods). (B–C) Inferred posterior probability distributions of sdrivers and spassengers. The maximum likelihood estimate (MLE) of sdrivers is 53.0% (green, 95% CI [16.0, 111.4]), and the MLE of spassengers is 1.03% (green, 95% CI [0.40, 3.98%]). (D–F) Comparison of the summary statistics of the best-fitting simulations (MLE parameters, dashed lines) to observed data (solid lines). (D) dN/dS rates of passengers (red) and drivers (light green) for simulated and observed data vs. mutational burden. A model where 6% of synonymous mutations within drivers experience positive selection (dark green) was also considered. (E) Cancer incidence rates for patients above 20 years of age. (F) Distribution of the mutational burdens of tumors.
Figure 3—figure supplement 1
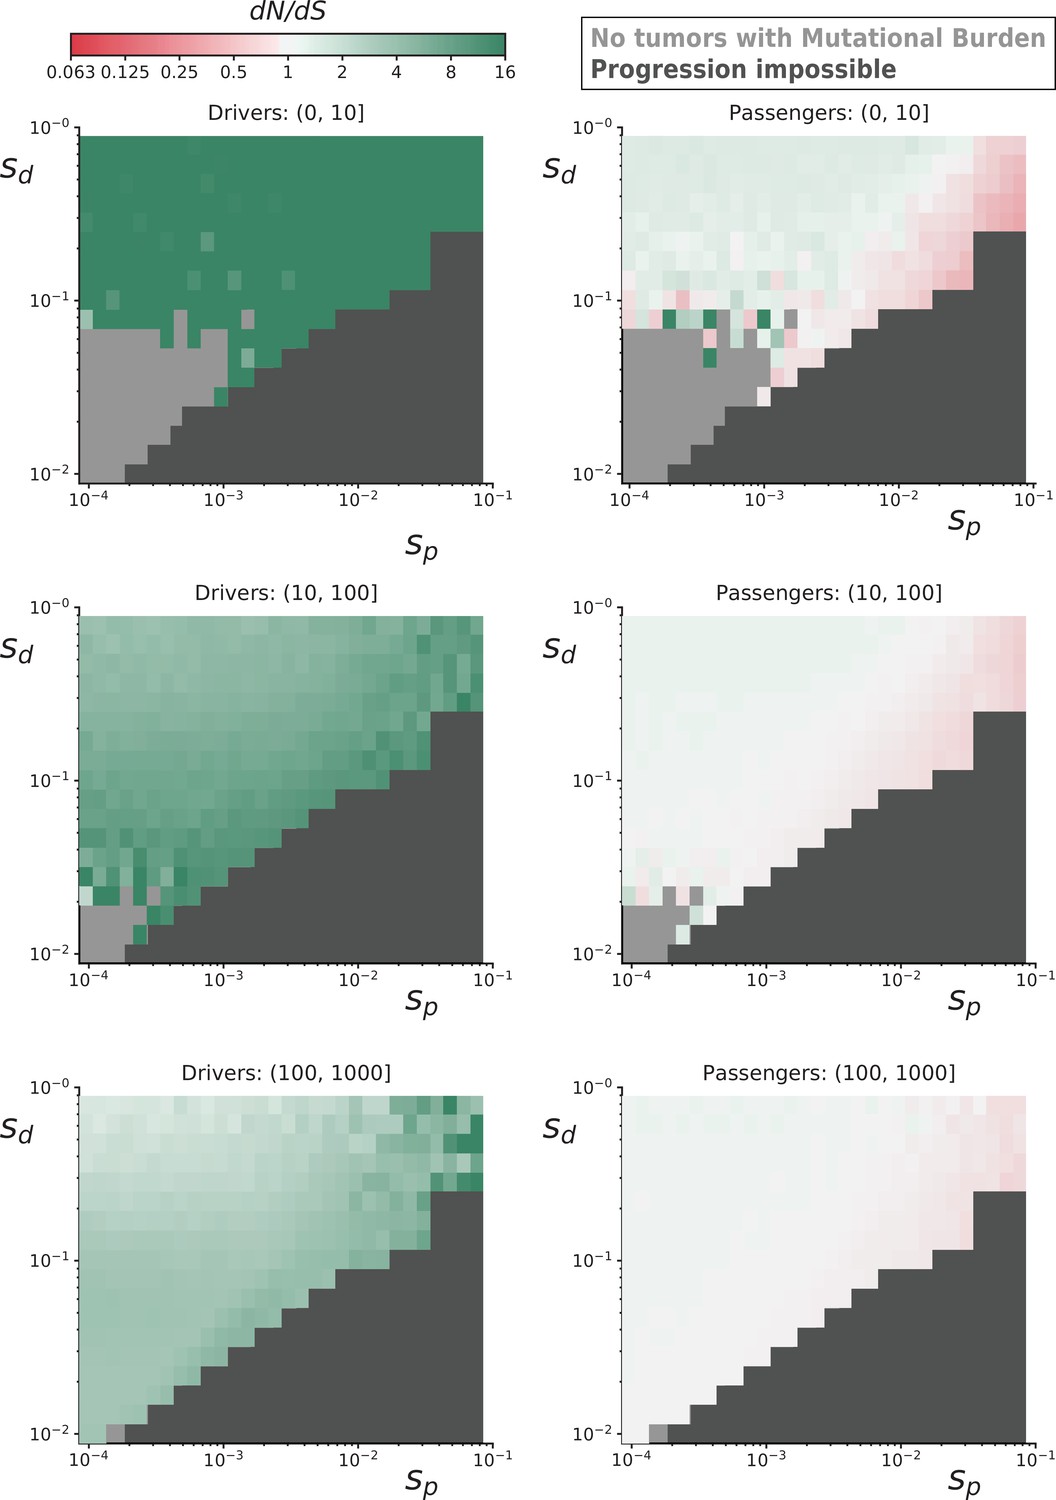
dN/dS rates of drivers and passengers in simulated cancers with various fitness coefficients.
Ten-thousand simulated tumors were generated for various combinations of mean driver fitness benefits (sdrivers) and mean passenger fitness costs (spassengers, Materials and methods). For some parameter combinations, the combined fitness cost of passengers overwhelmed the fitness benefit of drivers and prevented cancer progression within 100 years (dark gray). dN/dS values of simulated mutations were calculated for drivers (left) and passengers (right) at various mutational burden (total number of nonsynonymous and synonymous mutations). Top row is a mutational burden of 1–10; middle row is 11–100, and bottom row is 100–1000. Some parameter combinations did not produce any tumors with low mutational burdens (light gray). Across all parameters, positive selection on drivers and negative selection against passengers attenuates with mutational burden. Passengers exhibit minimal negative selection in general, despite a collective burden that often prevented tumor progression, because of strong Hill-Roberston interference in asexual populations.
Figure 3—figure supplement 2
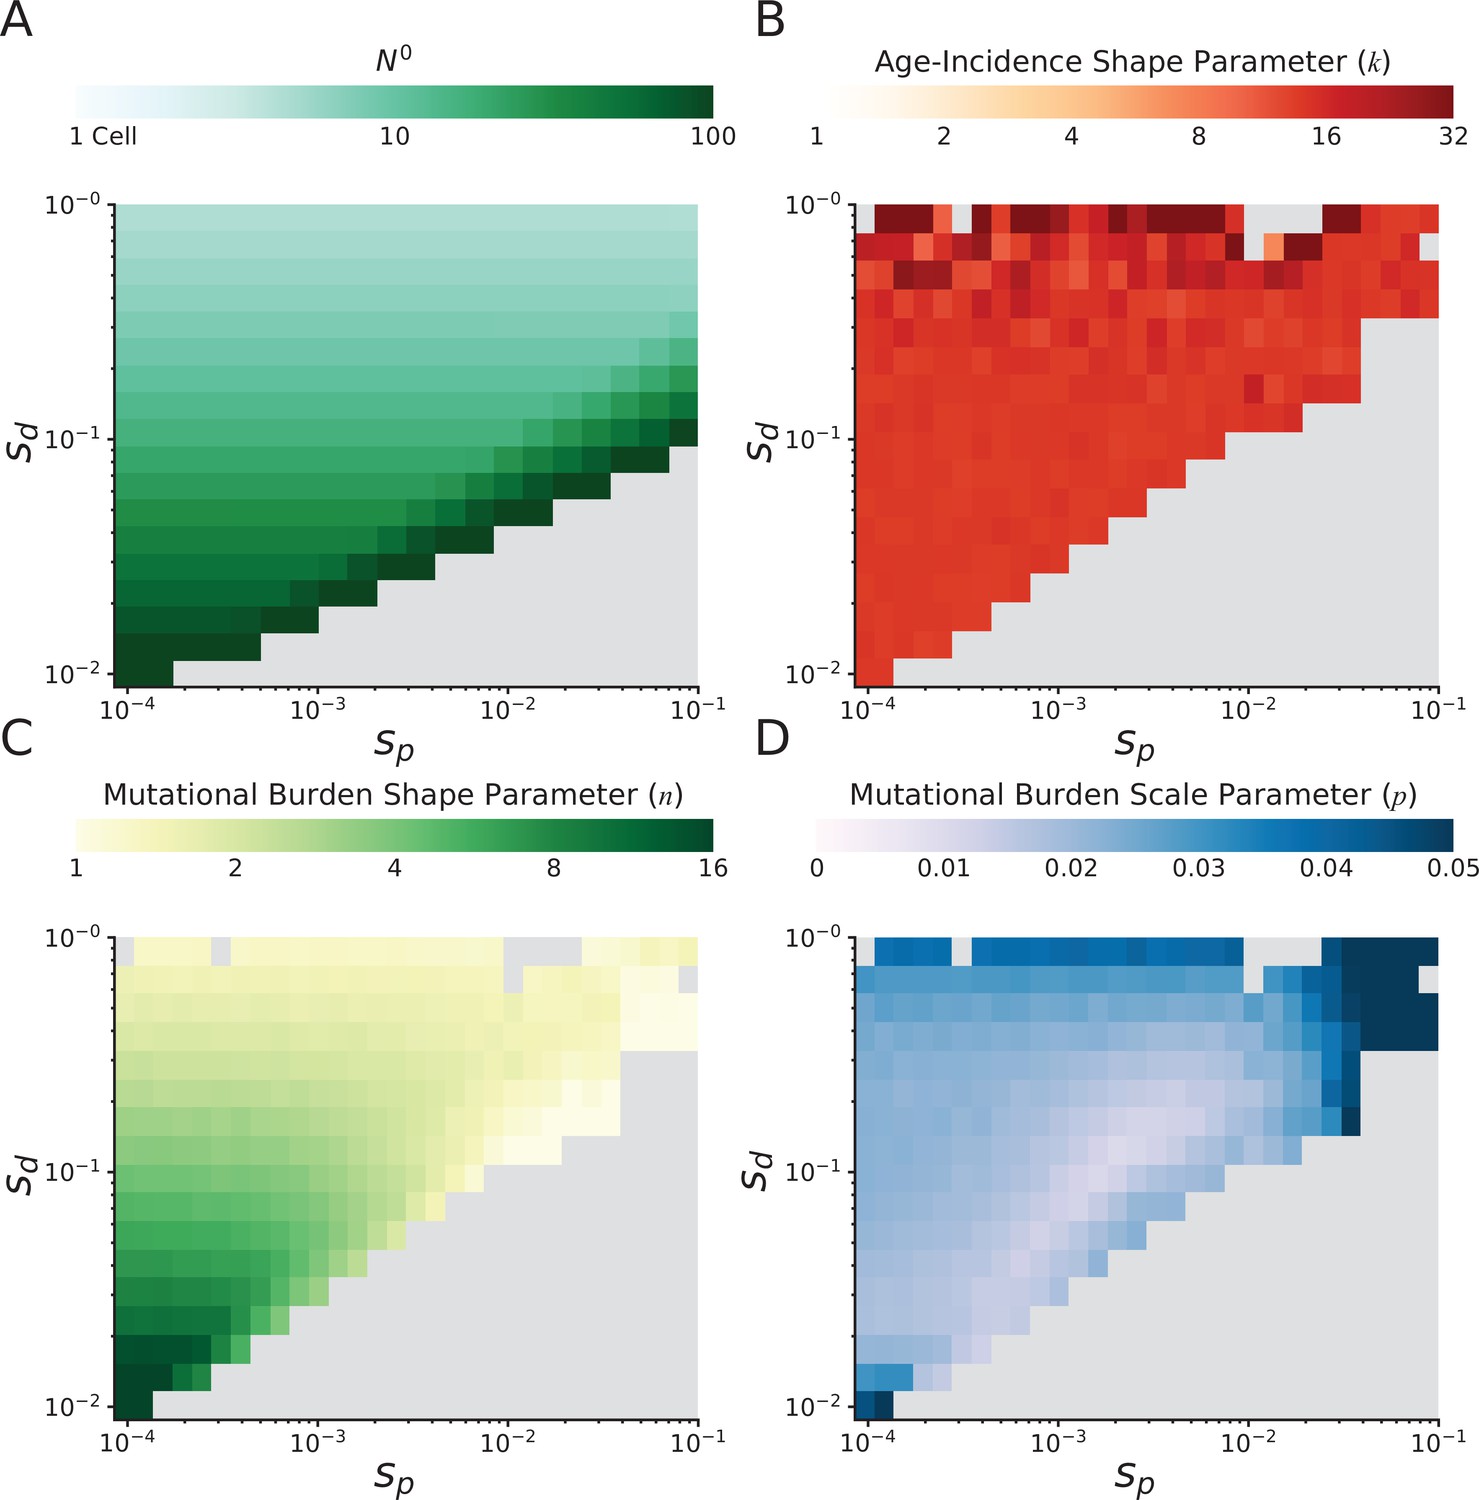
Probability of cancer by age and mutational burdens in simulated cancers at various fitness coefficients.
Clinical summary statistics of simulated tumors at various combinations of mean driver fitness benefits (sdrivers) and mean passenger fitness costs (sp, Materials and methods). (A) Initial population size N0 of simulated tumors. Initial population size approximates the equilibrium population size of a tumor following an initiating driver. Large population sizes are necessary for tumor progression when passenger deleteriousness is large compared to driver advantageousness – otherwise natural selection cannot drive carcinogenesis. Eventually, tumor progression is not possible for any reasonable initial population size (gray area). (B) Maximum likelihood estimate (MLE) of gamma distribution shape parameters describing the cancer age incidence rates of simulated tumors. A gamma distribution of age incidence is expected from the Armitage-Doll multistage model of tumorigenesis and describes human age incidence rates well (Materials and methods) (Frank, 2007). Larger values correspond to a steeper increase in rate with age; human patient rates are ~5 pan-cancer. Scale parameter of the parametric fit is not informative because of a Gauge freedom in the model. (C) MLE of shape and (D) scale parameters of negative binomial distributions describing the mutational burdens of simulated tumors. Smaller values of shape parameter correspond to broader distributions of mutational burden; human tumors exhibit a value of ~2 pan-cancer. Smaller values of scale parameter correspond to a larger mean mutational burden; human tumors exhibit a value of ~1/50 (i.e. 50 passengers per rate-limiting driver).
Figure 3—figure supplement 3

Implementation and use of approximate Bayesian computation (ABC) for model selection and parameter estimation.
(A) Leave-one-out cross validation (CV) on the simulated data was used to select an optimal rejection tolerance and optimal rejection method. Observed data can be compared to simulated data using model rejection alone (left), or by comparing observed data to a (middle) local linear regression or (right) feed-forward neural network single-layer model trained on the simulated data. In general, unsupervised training of a neural network on simulated data will often improve prediction accuracy by denoising stochasticity in the simulations (via kernel prediction.) A neural network with a rejection tolerance of 0.5 minimized prediction error of both driver and passenger fitness effects (illustrated by dotted lines) and was used to infer selection coefficients. This CV optimization procedure for ABC is advised (Csilléry et al., 2012). (B) Posterior probability of models of tumor evolution incorporating synonymous drivers. The prior distribution of synonymous driver fractions (uniform from 0% to 20%) is nearly identical to this posterior distribution. This suggests that nearly all models incorporating synonymous drivers can explain observed dN/dS patterns with the right combination of fitness parameters. (C) Posterior distribution of fitness effect of driver fitness benefits (sdrivers) and passenger fitness costs (spassengers) after synonymous drivers are incorporated. MLE (circles) and 95% confidence intervals (lines) are reported. Similar to (B), incorporation of synonymous drivers undermines the ability of ABC to accurately infer fitness coefficients.
Figure 3—figure supplement 4
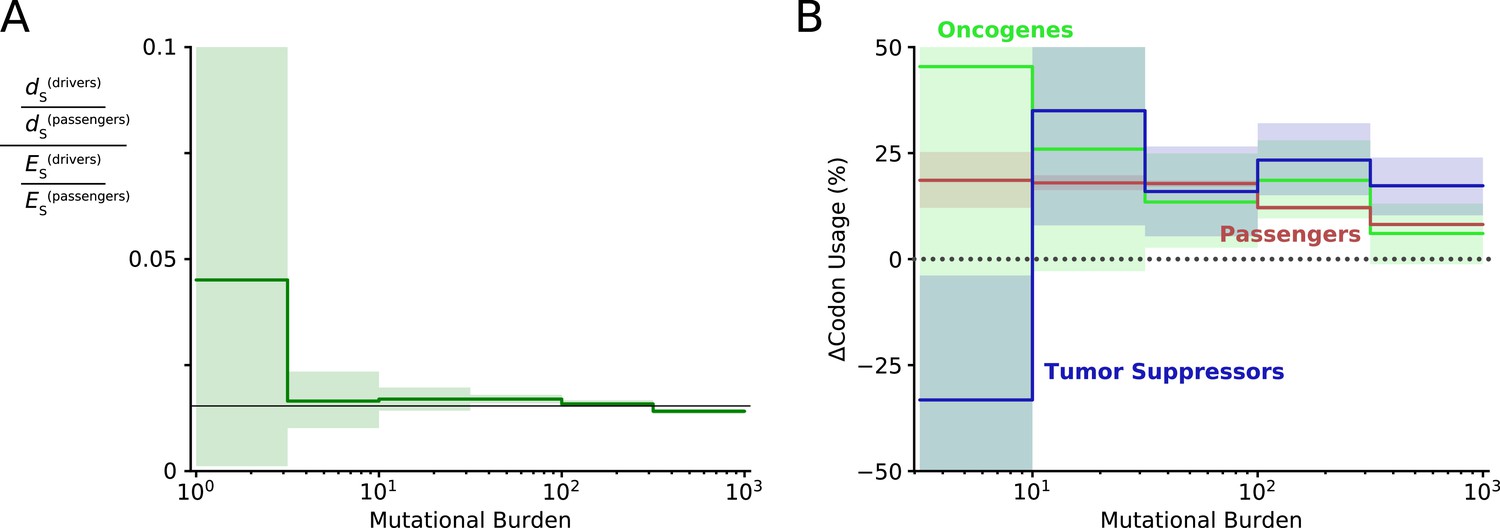
Evidence of positive selection on synonymous mutations within driver genes at low mutational burdens.
(A) The quantity of synonymous mutations within driver genes was compared to the quantity of synonymous mutations within passenger genes and both were normalized by their expected frequencies using dNdScv. Black line denotes the genome-wide ratio of synonymous drivers to synonymous passengers (~2%, i.e. driver genes are ~2% of the human coding genome). At low mutational burdens, a non-significant increase in the quantity of synonymous drivers is observed, suggestive of positive selection for these mutations. (B) The change in codon usage imparted by all synonymous mutations was calculated for oncogenes, tumor suppressors, and passenger genes. Bias in codon usage suggests a functional effect of synonymous mutations. Increase in codon usage is expected to increase translational efficiency and increase protein abundance. Oncogenes are expected to exhibit positive selection for increased codon usage and exhibit a non-significant increase as mutational burden declines – consistent with positive selection for synonymous mutations within oncogenic drivers that is attenuated by Hill-Robertson interference. Similarly, tumor suppressors are expected to exhibit a decrease in codon usage at low mutational burdens, which is indeed significant (p=0.03) presumably because there are more annotated tumor suppressor genes.
Figure 3—figure supplement 5
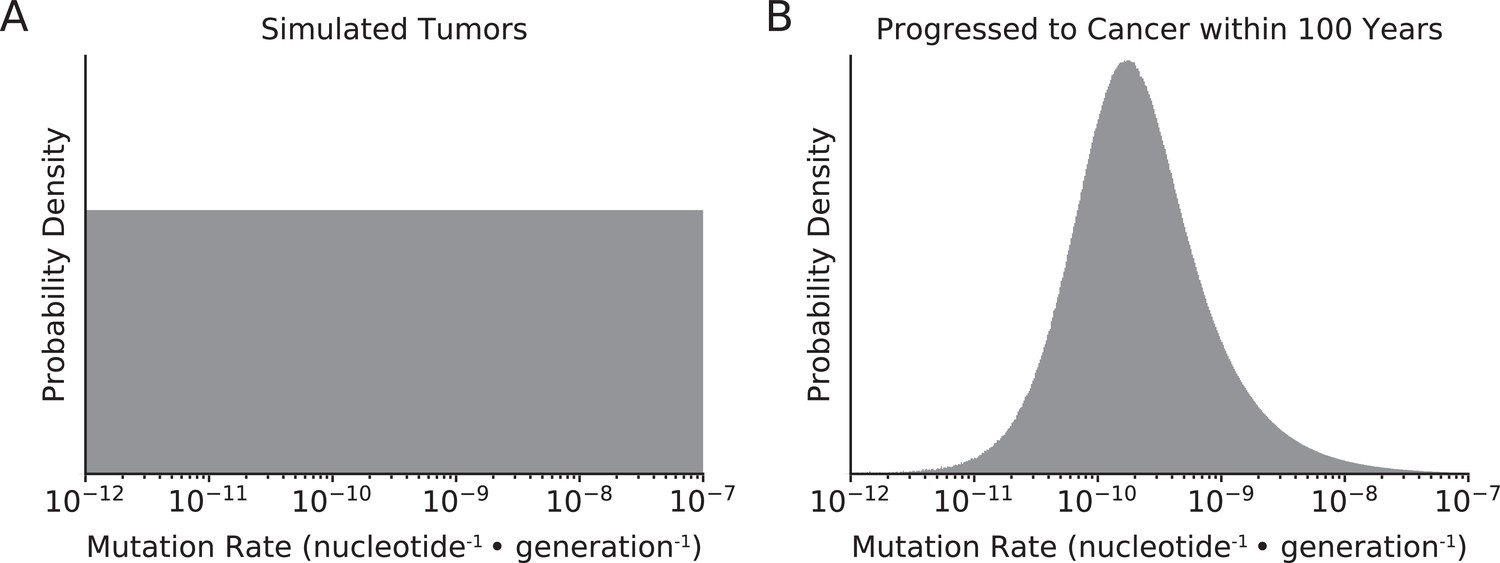
Distribution of mutation rates of simulated tumors.
(A) Mutation rates of all simulated tumors were randomly sampled from a uniform distribution (in log-space) from 10–12 to 10–7 nucleotide–1 · generation–1. (B) In simulations that best agreed with observed data (maximum likelihood estimate [MLE] of sdrivers = 53%, spassengers = 1.03%), only tumors with intermediate mutation rates progressed to cancer within 100 years. Tumors with lower mutation rates do not progress to cancer within the 100-year time constraint of simulations, while tumors with exceptionally high mutation rates collapse via mutational meltdown.
Figure 3—figure supplement 6

Relative contribution of genetic hitchhiking and Muller’s ratchet to fix deleterious passengers.
Using analytical theory developed in Neher and Shraiman, 2012; McFarland et al., 2014; Bachtrog and Gordo, 2004, we can estimate the relative rates of genetic hitchhiking and Muller’s ratchet in our pan-cancer model of tumor evolution. As the relative strength of driver alterations increase (sdrivers) relative to the selective cost of passengers (spassengers), more passengers hitchhike with each driver sweep (left). This increases the relative contribution of observed passengers that accumulate via hitchhiking (right). Using the maximum likelihood estimates (MLE) of selection for drivers and against passengers, we estimate that an average of 1.2 deleterious passengers hitchhike with each driver, which account for 2.0% of accumulated passengers (the majority, and remainder, accumulate via Muller’s ratchet).
Author response image 1
Additional files
-
MDAR checklist
- https://cdn.elifesciences.org/articles/67790/elife-67790-mdarchecklist1-v2.docx
-
Supplementary file 1
Model assumptions of tumor evolution and its anticipated effects.
- https://cdn.elifesciences.org/articles/67790/elife-67790-supp1-v2.docx
-
Supplementary file 2
Broad (meta-categories) of cancer groupings used in Figure 2 and Figure 2—figure supplement 12-13.
- https://cdn.elifesciences.org/articles/67790/elife-67790-supp2-v2.docx
Download links
A two-part list of links to download the article, or parts of the article, in various formats.
Downloads (link to download the article as PDF)
Open citations (links to open the citations from this article in various online reference manager services)
Cite this article (links to download the citations from this article in formats compatible with various reference manager tools)
Most cancers carry a substantial deleterious load due to Hill-Robertson interference
eLife 11:e67790.
https://doi.org/10.7554/eLife.67790


