Role of BRCA2 DNA-binding and C-terminal domain in its mobility and conformation in DNA repair
- Department of Molecular Genetics, Oncode Institute, Erasmus MC Cancer Institute, Erasmus University Medical Center, Netherlands
- Department of Radiation Oncology, Erasmus University Medical Center, Netherlands
Figures
Figure 1 with 3 supplements
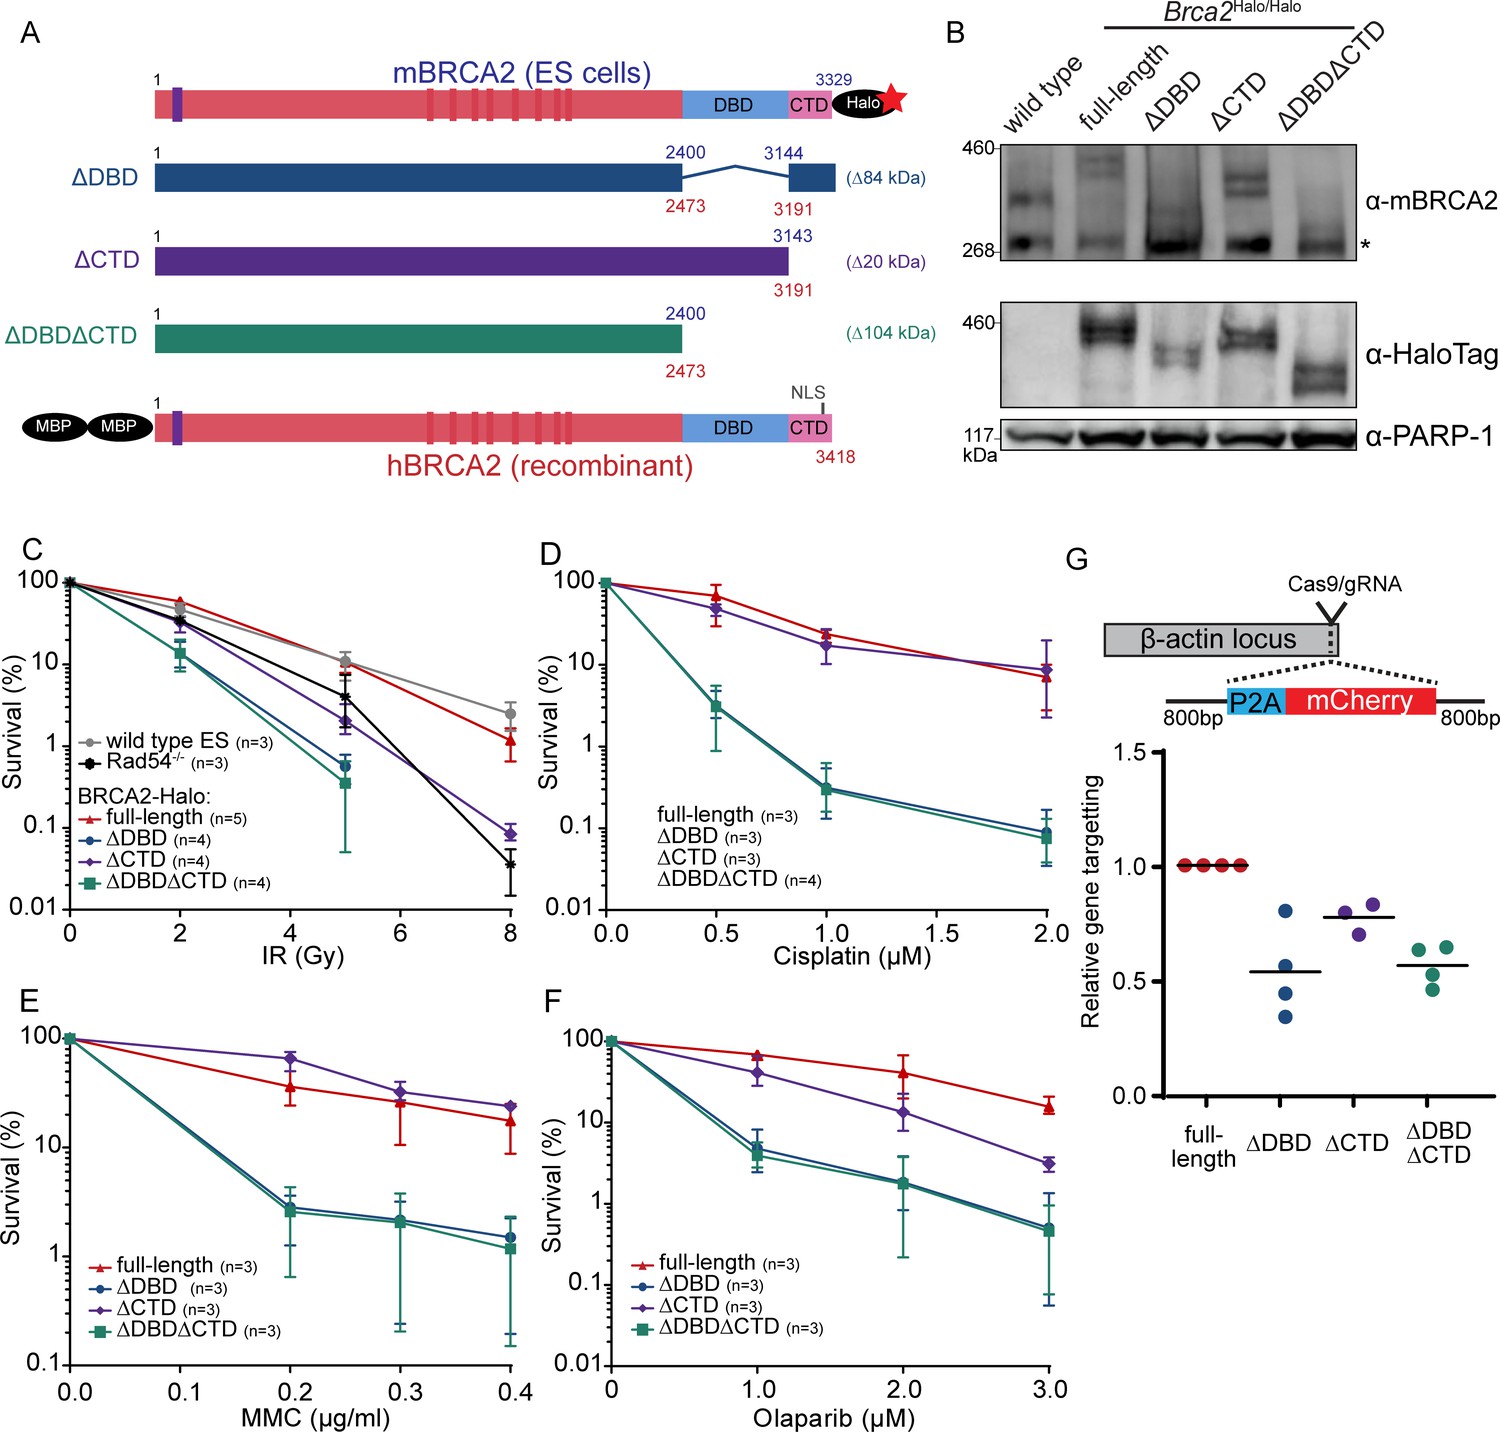
Functional analysis of BRCA2 deletion variants in mouse embryonic stem cells, tagged at the endogenous locus with a HaloTag.
(A) Schematic overview of full-length mouse (top) and human (bottom) BRCA2 proteins, with key domains (DBD, CTD, NLS, BRC1-8: red bars; PALB2-binding: blue bar) and tags indicated. Deletion variants are shown in the middle. Amino acid numbers are shown in blue (mouse) and red (human). Expected molecular weight decrease for the deletion variants is shown on the right. Sequence conservation and alignment between mouse and human BRCA2 DNA-binding domain (DBD) and C-terminal domain (CTD) can be found in Figure 1—figure supplement 3. (B) Immunoblot of total protein extract from mouse embryonic stem (mES) cells probed with indicated antibodies. Asterisk shows a specific band. Validation of the cell lines by genotyping is described in Figure 1—figure supplement 1. Images of the full blots are shown in Figure 1—source data 1. (C–F) Clonogenetic survivals after ionizing radiation (IR), olaparib, mitomycin C (MMC), and cisplatin treatment with the indicated doses. At 8 Gy of IR, the percentage of surviving colonies of the ΔDBD- and ΔDBDΔCTD-Halo was too low to accurately determine the survival. Error bars indicate the range of data points. n numbers in the figure indicate the number of technical replicates executed on different days. Source data and statistics are available in Figure 1—source data 1. (G) CRISPR/Cas9-based homologous recombination assay to assess the homologous recombination proficiency of the different BRCA2 mutants. mES cells were transfected with a plasmid encoding Cas9 and the specific guide RNA (gRNA) and a repair template with the self-cleaving peptide P2A and the mCherry sequence in between two homology arms. Upon proper integration of the donor sequence at the ß-actin locus, the cells expressed mCherry. 96 hr after transfection, cells were sorted and the frequency of mCherry-positive cells was measured (Figure 1—figure supplement 2, Figure 1—source data 1). To correct for the difference in transfection efficiency, a plasmid expressing blue fluorescent protein (BFP2) was co-transfected. The frequency of positive cells in every experimental replicate is normalized against wild-type BRCA2-Halo cells. Every data point indicates a technical replicate (averaged from two transfections). p-values (paired two-sided t-test) compared to full-length for the deletion variants are p = 0.0186 (ΔDBD), p = 0.0291 (ΔCTD), and p = 0.0021 (ΔDBDΔCTD), respectively.
-
Figure 1—source data 1
Excel file with the source data of the cell survival data in Figure 1C–F and HR assay in Figure 1G.
- https://cdn.elifesciences.org/articles/67926/elife-67926-fig1-data1-v2.zip
-
Figure 1—source data 2
Full western blot images from Figure 1B.
- https://cdn.elifesciences.org/articles/67926/elife-67926-fig1-data2-v2.pdf
Figure 1—figure supplement 1

Generation of different variants of BRCA2-HaloTag knock-ins.
(A) Cartoon depicting the CRISPR/Cas9 targetting strategy, indicating the approximate position of the gRNA sequences (Supplementary file 1) and the targetting construct with the homology arm and targetted cassette. (B) Scheme displaying the expected BRCA2 locus after targeting the different BRCA2 deletion variants, showing which exons and introns are deleted. (C) Genotyping polymerase chain reactions (PCRs) to validate the different cell lines. The multiplex PCR also included primers annealing outside the targetted genomic region to serve as a positive control for genomic DNA amplification efficiency. Primer sequences are reported in Supplementary file 2.
Figure 1—figure supplement 2
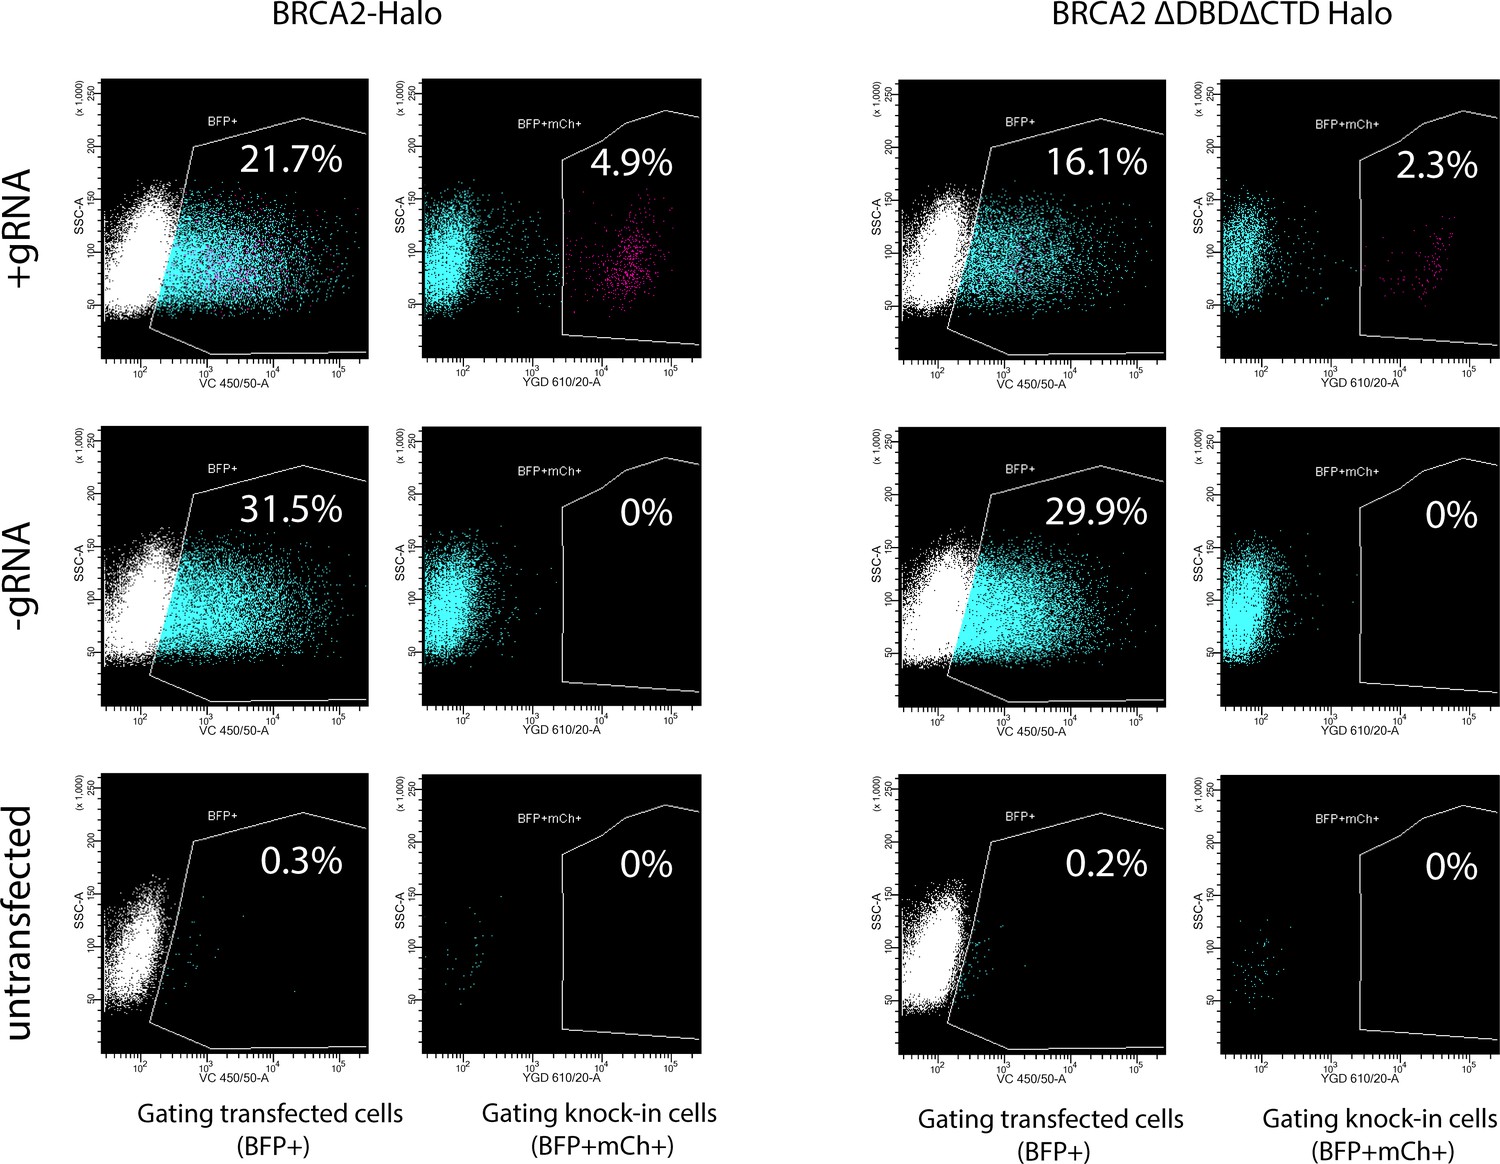
Flow cytometry analysis of the CRISPR/Cas9 β-actin-P2A-mCherry targeting assay as shown in Figure 1G.
A plasmid expressing BFP2 was co-introduced for the selection of successfully transfected cells. The percentage of transfected cells (BFP+) that express mCherry targetted to the β-actin cells was quantified. Typical results are shown for full-length BRCA2-Halo and for BRCA2-Halo ΔDBDΔCTD.
Figure 1—figure supplement 3

Sequence alignment between human and mouse BRCA2 DBD and CTD.
Top panel indicates the conservation between human and mouse BRCA2 at the amino acid level. At the bottom, the aligned sequences between human and mouse DBD and CTD are plotted.
Figure 2 with 1 supplement
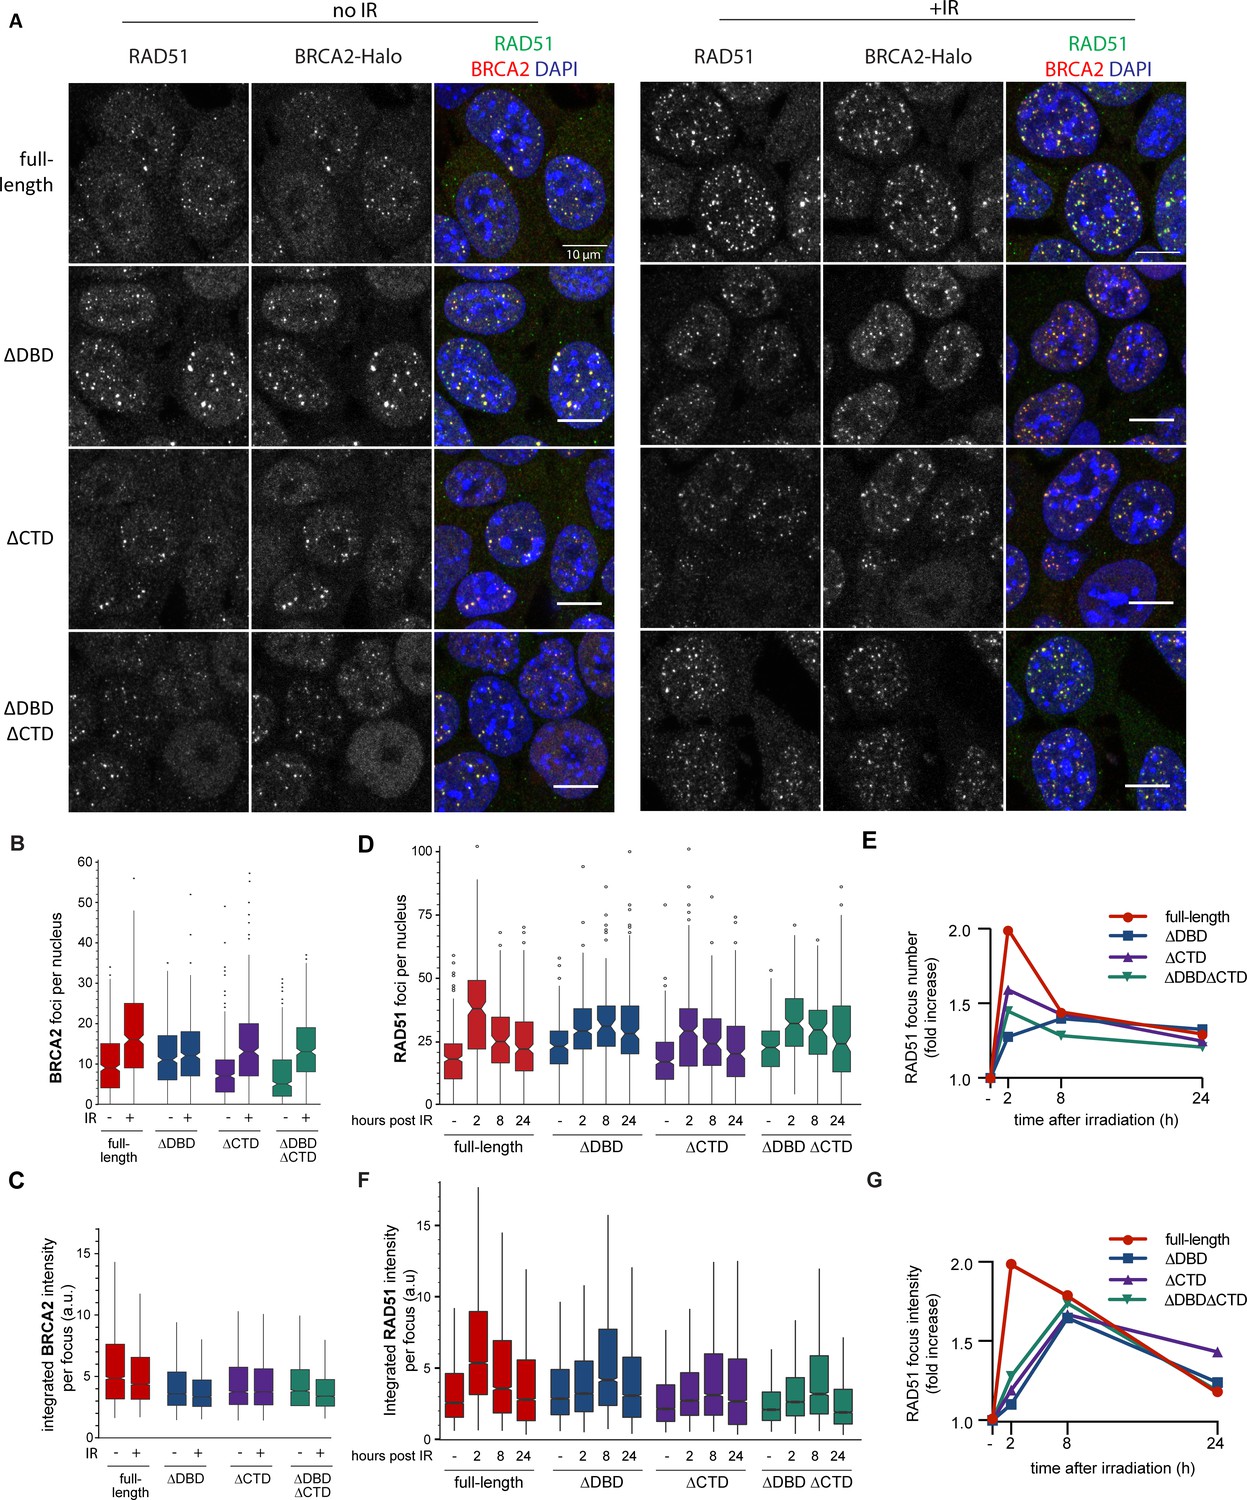
BRCA2 and RAD51 foci quantification.
(A) Representative confocal images (maximum intensity projections) of BRCA2 (red) and RAD51 (green) foci in mouse embryonic stem (mES) cells fixed 2 hr after mock or 2 Gy irradiation, without pre-extraction. Scale bar, 10 µm (full images can be found at Figure 2—source data 2). (B) Quantification of the number of BRCA2-Halo (JF646) foci per nucleus of EdU+ cells irradiated with 2Gy ionizing radiation (IR) in cells without pre-extraction; three technical replicates, at least 250 cells per condition (Figure 2—source data 1). (C) Distribution of integrated BRCA2 intensity per focus. (D) Quantification of the number of RAD51 foci in EdU+ cells irradiated with 2 Gy IR and fixed after indicated number of hours with pre-extraction for RAD51 immunostaining. Example images and percentage of EdU+ cells per condition are shown in Figure 2—figure supplement 1; three technical replicates, at least 100 cells per condition (statistical data available in Figure 2—source data 1). (E) Fold change of foci number with respect to untreated cells. (F) Integrated RAD51 intensity per focus. (G) Fold change in integrated intensity of RAD51 foci relative to untreated cells. Representative images are shown in Figure 1—figure supplement 1. Data plotted per time point can be found in Figure 2—figure supplement 1C,E. In boxplots in (C) and (F), distribution outliers are not shown; source data is available in Figure 2—source data 1.
-
Figure 2—source data 1
Excel file with exact n numbers and statistical tests of Figure 2B–G and the source data of the foci quantification.
- https://cdn.elifesciences.org/articles/67926/elife-67926-fig2-data1-v2.xlsx
-
Figure 2—source data 2
Original uncropped images from Figure 2A.
Confocal z-projection images.
- https://cdn.elifesciences.org/articles/67926/elife-67926-fig2-data2-v2.zip
Figure 2—figure supplement 1
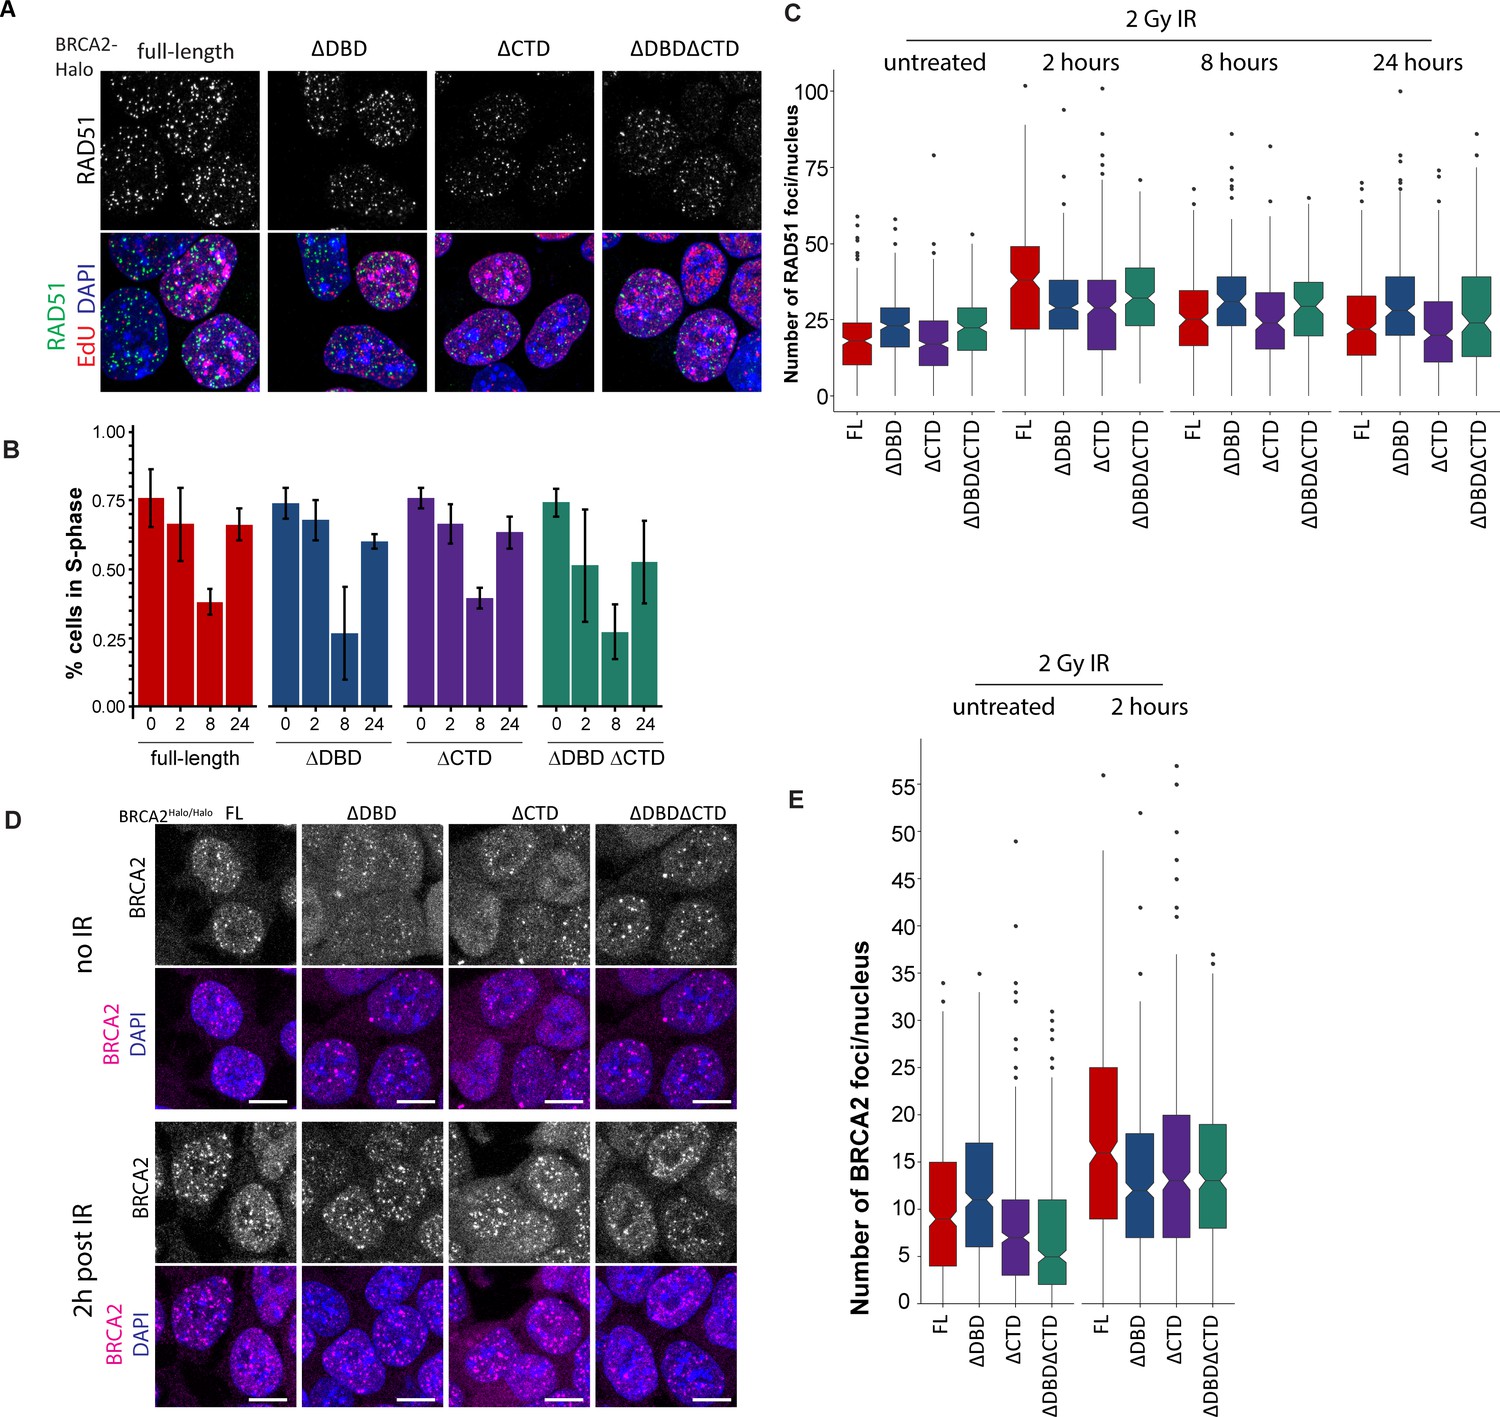
Additional images and plots for BRCA2 and RAD51 foci quantification.
(A) Confocal images (maximum intensity projection) of mouse embryonic stem (mES) cells producing the indicated variants of BRCA2 immunostained for RAD51 after pre-extraction and pulse-labeling with EdU click chemistry to reveal S-phase cells. (B) Fraction of EdU-positive (S-phase) mES cells revealed as shown in panel (A) at different time points after irradiation with 2 Gy. Average from three experiments, bars indicate SEM. Source data is available in Figure 2—source data 1. (C) Data from Figure 2D replotted for all variants per time point. (D) Confocal images of BRCA2-Halo::JF646. (E) Data from Figure 2B replotted for all variants per time point.
Figure 3 with 5 supplements
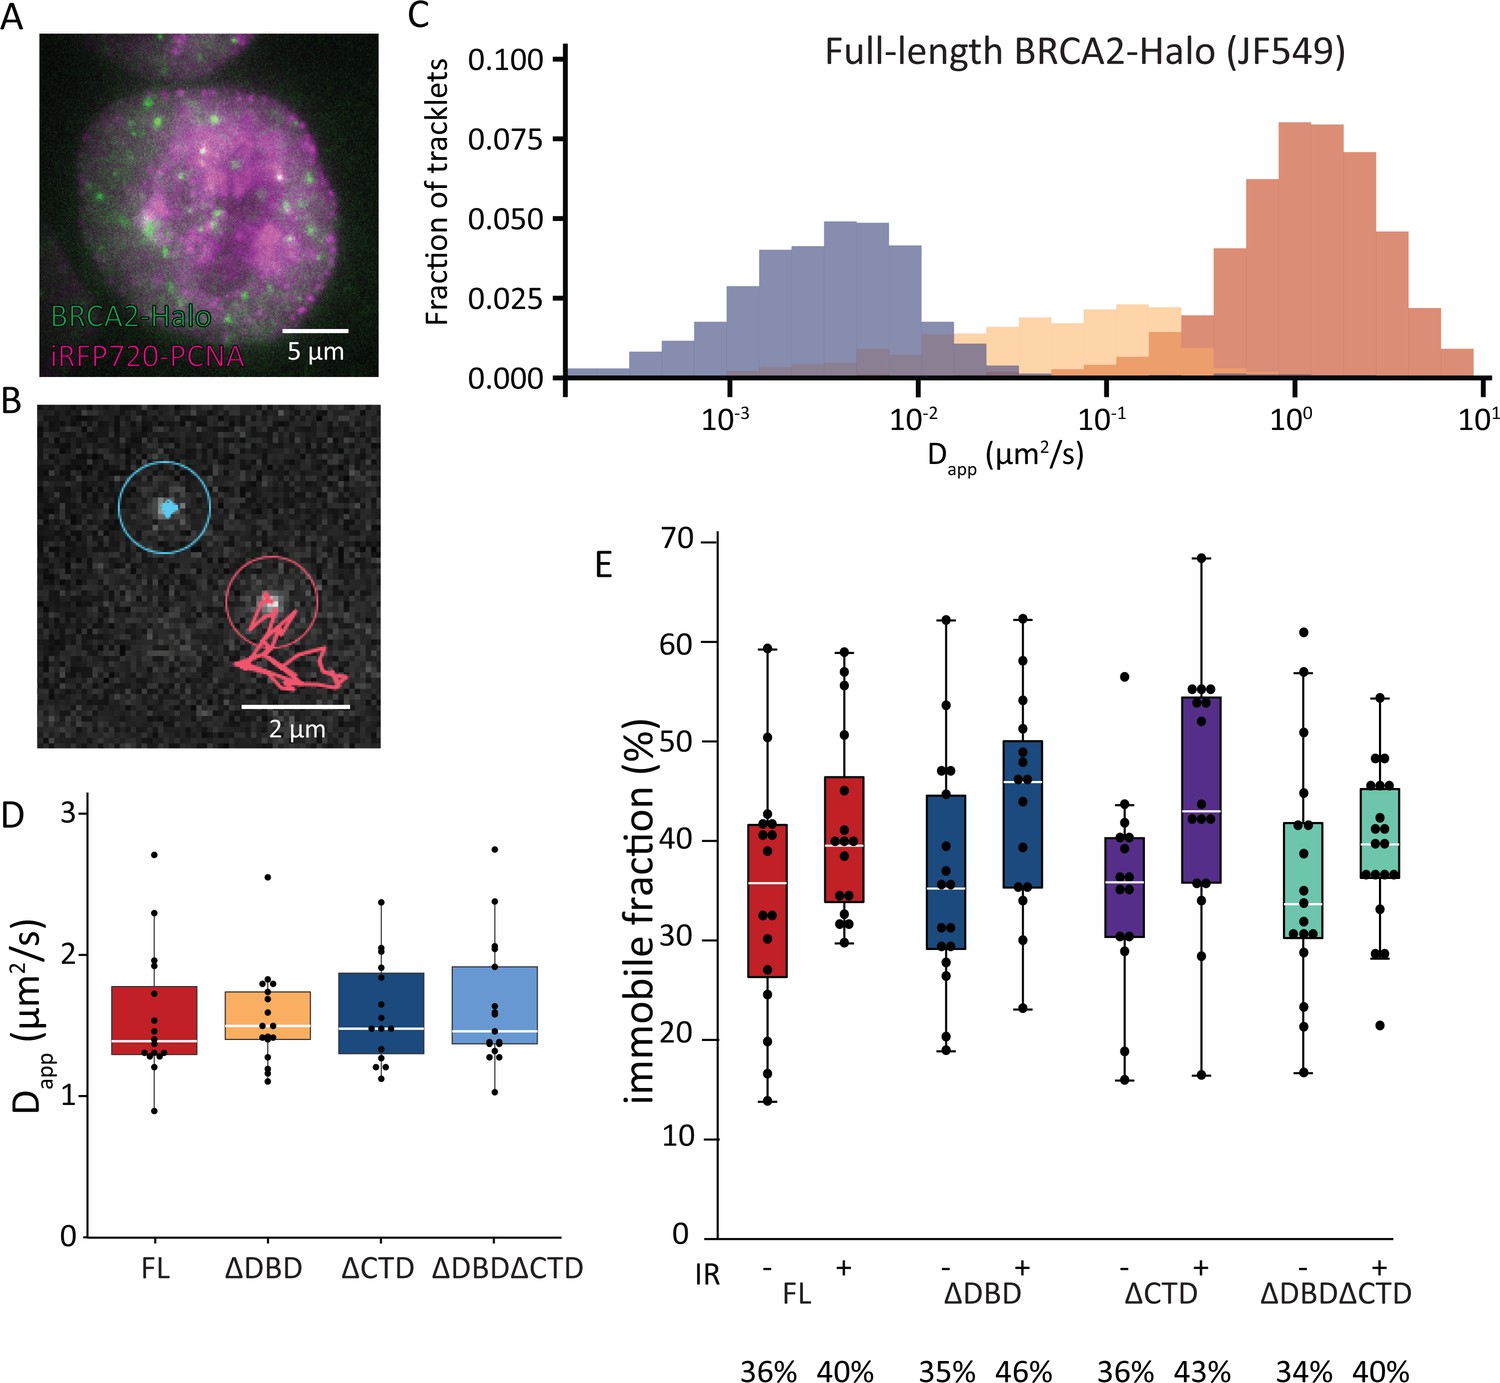
Single-particle tracking of BRCA2-HaloTag reveals immobilization of BRCA2 lacking either DBD or CTD upon DNA damage.
(A) Wide-field image of an S-phase cell visualized with iRFP720-PCNA and BRCA2-HaloTag::JF549. (B) Example of two tracks of BRCA2-Halo showing different diffusive behavior; see also Figure 3—videos 1–4. (C) Distribution of apparent diffusion coefficients of segmented tracks (tracklets) for immobile (blue), slow (yellow), and fast (red) molecules for full-length BRCA2 in untreated cells; plots for ionizing radiation (IR)-treated cells and other BRCA2 variants are shown in Figure 3—figure supplement 1. (D) Apparent diffusion rate of fast diffusing BRCA2 tracklets for full-length BRCA2 and indicated deletion variants. p-values (two-sided t-test) comparing full-length with deletion variants (ΔDBD, ΔCTD, ΔDBDΔCTD) are, respectively, p = 0.953, p = 0.797, p = 0.593. (E) Immobile fraction estimated by segmentation of tracks by their immobile, slow, or fast mobility (tracklets). Fraction is defined as the percentage of tracklets per cell that are immobile. Cells were imaged between 2 and 4 hr after IR treatment. p-values (two-sided t-test) comparing -/+ IR for different variants (full-length, ΔDBD, ΔCTD, ΔDBDΔCTD) are, respectively, p = 0.08, p = 0.057, p = 0.02, p = 0.4. Merged data from two independent experiments of at least 15 cells and about 10,000 tracks per condition are shown (Figure 3—source data 1). Percentages below the plot indicate the median immobile fraction of tracklets per condition.
-
Figure 3—source data 1
Excel file with exact n numbers and statistical tests of Figure 3 and the source data of the single-molecule-tracking experiments.
- https://cdn.elifesciences.org/articles/67926/elife-67926-fig3-data1-v2.xlsx
Figure 3—figure supplement 1
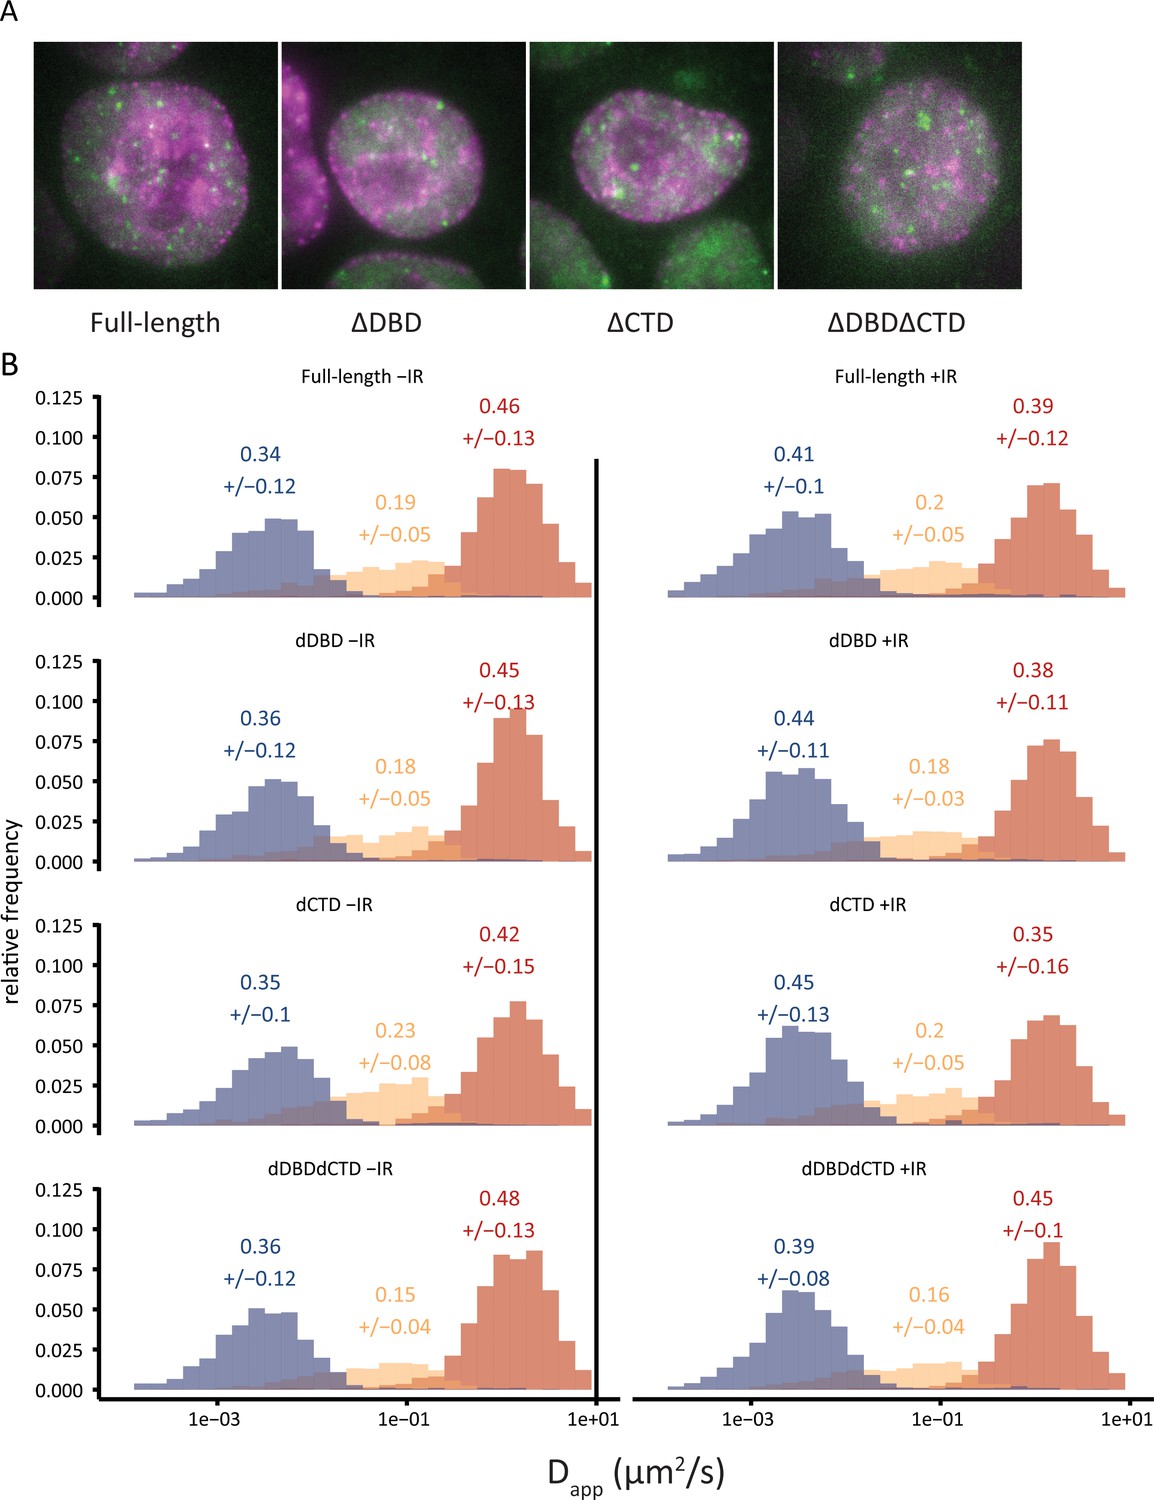
Diffusion histograms of single-particle tracking experiments.
(A) Wide-field images of cells from the different BRCA2 variants (like in Figure 3A), showing iRFP720-PCNA in magenta and BRCA2-Halo::JF549 in green. (B) Histograms of the apparent diffusion constant estimated for every tracklet. Tracks are segmented in fast (red), slow (yellow), and immobile (blue) tracklets using the DL-MSS software. The numbers above the plots indicate the average fractions +/- standard deviation estimated from fractions per cell.
Figure 3—video 1
Single-molecule recording of full-length BRCA2-Halo (JF549) in untreated mouse ES cells imaged at 30 ms interval.
Figure 3—video 2
Single-molecule recording of full-length BRCA2-Halo (JF549) in mouse ES cells treated with 2Gy of ionizing radiation imaged at 30 ms interval.
Figure 3—video 3
Single-molecule recording of BRCA2 ΔDBDΔCTD-Halo (JF549) in untreated mouse ES cells imaged at 30 ms interval.
Figure 3—video 4
Single-molecule recording of BRCA2 ΔDBDΔCTD-Halo (JF549) in mouse ES cells treated with 2Gy of ionizing radiation imaged at 30 ms interval.
Figure 4 with 4 supplements
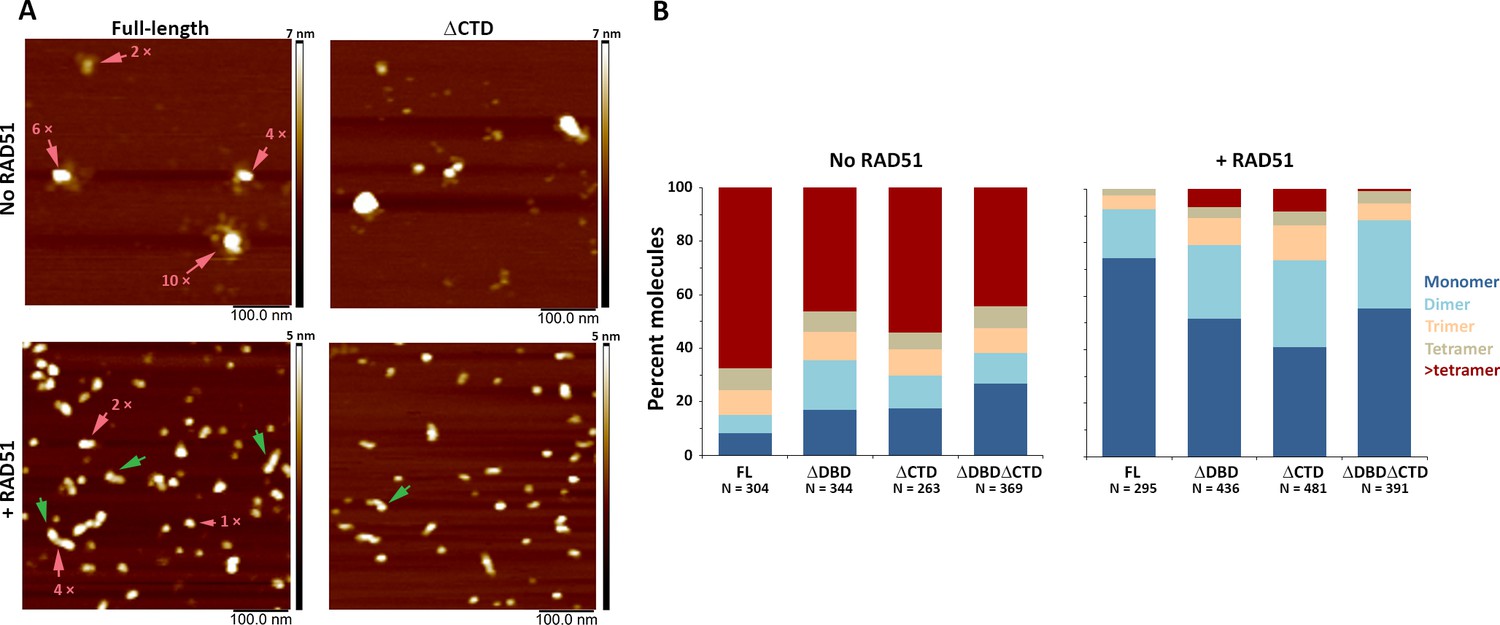
C-terminal region of human BRCA2 contributes to the formation of BRCA2-BRCA2 oligomers.
(A) Representative scanning force microscopy (SFM) height images of full-length and ∆CTD BRCA2 in the presence and absence of RAD51. BRCA2 ΔCTD forms rod-shaped assemblies, like full-length BRCA2, on interaction with RAD51. Rod-like assemblies are indicated by green arrows; pink arrows indicate multimeric assemblies, based on volume analyses. (B) Histograms showing oligomeric distribution of full-length BRCA2 and the C-terminal variants in the presence and absence of RAD51. The deletion of C-terminal region leads to lesser oligomeric forms than full-length BRCA2. All the experiments were performed twice with independent protein preparations, imaging, and analyses. The figure is plotted from one of the duplicate data sets. Both data sets can be found in Figure 4—source data 1.
-
Figure 4—source data 1
Excel files with the source data of the data in Figure 4B and the replicate experiment.
- https://cdn.elifesciences.org/articles/67926/elife-67926-fig4-data1-v2.zip
Figure 4—figure supplement 1

Representative SFM height images of BRCA2 ΔDBD and BRCA2 ΔDBDΔCTD in the presence and absence of RAD51.
Both the constructs show reorganization of the protein into smaller globular assemblies on interaction with RAD51.
Figure 4—figure supplement 2

Plots showing distribution of full-length BRCA2 and c-terminal deletion constructs in the presence and absence of RAD51.
All the BRCA2 samples, full-length and the deletion constructs, show a similar rearrangement into globular and monomeric assemblies.
Figure 4—figure supplement 3
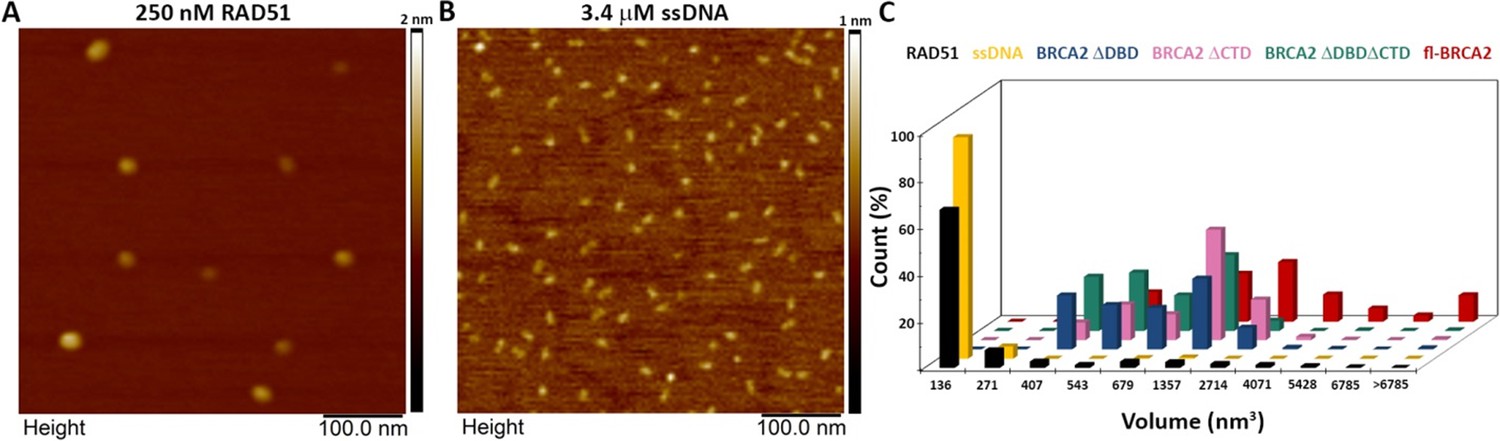
Control scanning force microscopy experiments of RAD51 and ssDNA alone.
(A) Representative scanning force microscopy (SFM) height images of RAD51 alone. (B) Representative SFM height image of single-stranded DNA (ssDNA) alone. (C) Distribution of volume of all the proteins and ssDNA used in the study.
Figure 4—figure supplement 4
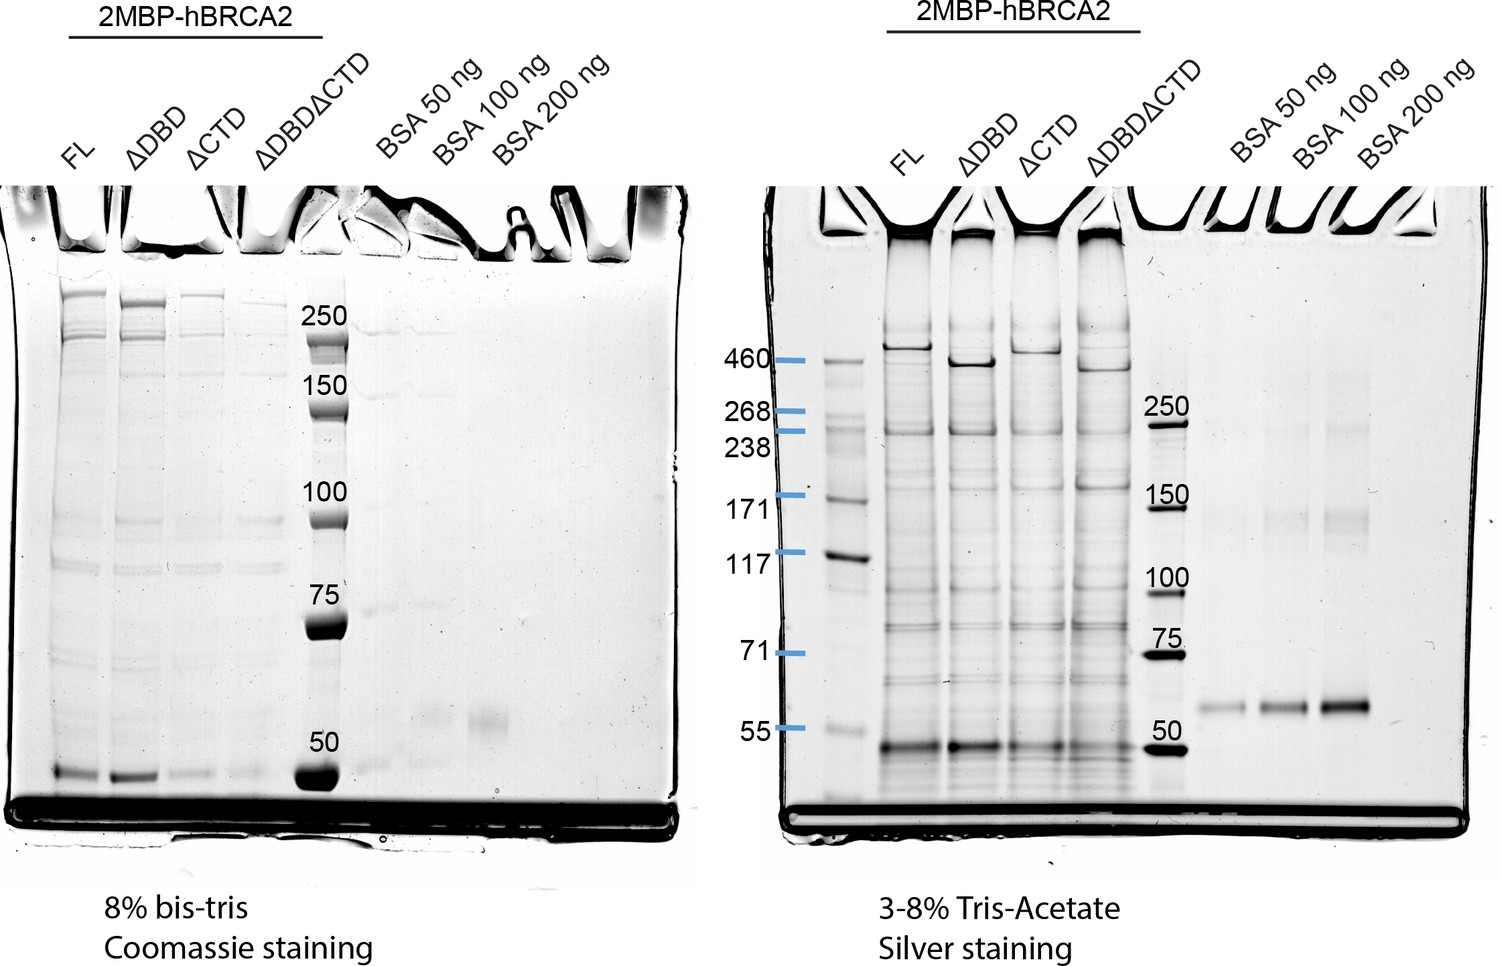
SDS-PAGE gels visualizing the purified protein preparations as used in this study (Figure 4 and Figure 5).
Coomassie staining and silver staining of protein preparations. Asterisks (*) indicate the expected molecular weight bands for the different proteins. Protein amounts differ in the lanes, as the final concentration of the preparations was different and the maximum amount of protein was loaded on the gels.
Figure 5 with 3 supplements
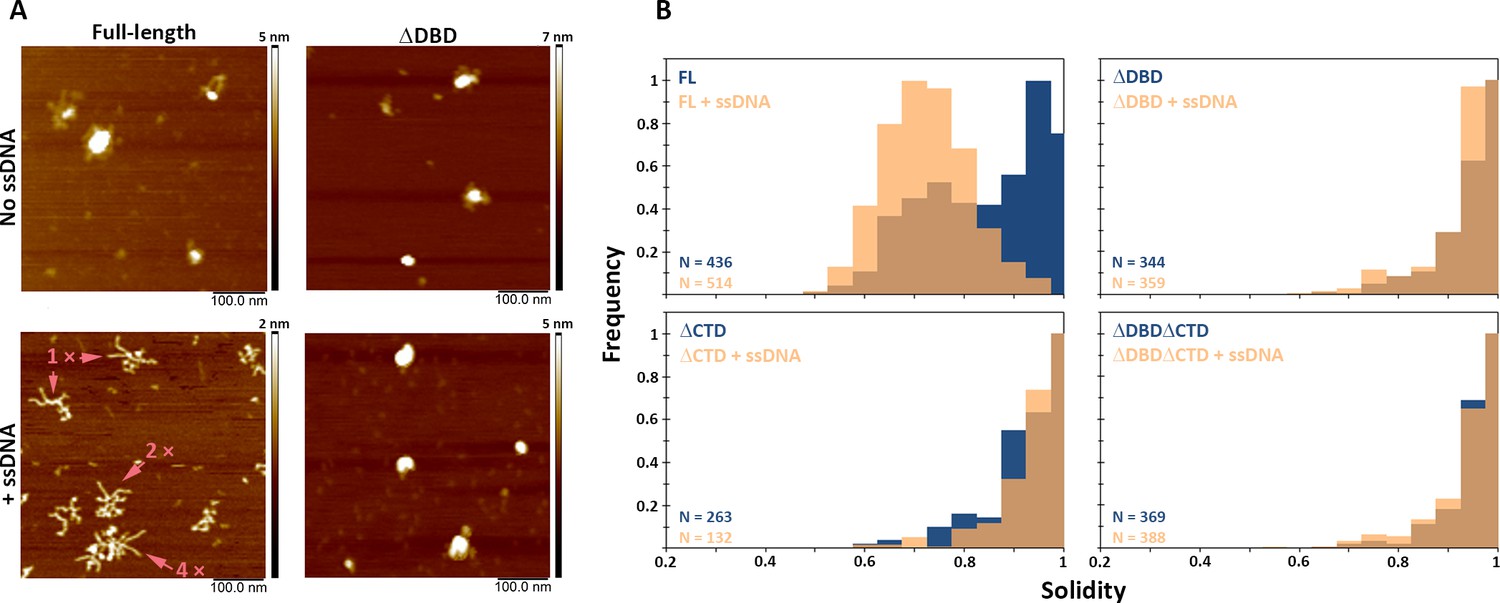
C-terminal region of BRCA2 is essential for conformational rearrangement on interaction with ssDNA.
(A) Representative scanning force microscopy (SFM) height images of full-length BRCA2 and BRCA2 ΔDBD in the presence and absence of single-stranded DNA (ssDNA). Full-length BRCA2 rearranges into extended molecular assemblies on interaction with ssDNA; however, BRCA2 ΔDBD and other C-terminal constructs do not show any conformational change. Pink arrows indicate the oligomeric volume of the particle with respect to the BRCA2 monomer. (B) Distribution of full-length BRCA2 and the C-terminal deletion constructs with respect to their oligomerization and solidity. Full-length BRCA2 rearranges to form extended dimers and tetramers on interaction with ssDNA, whereas the deletion constructs do not show any change in their distribution. All the experiments were performed twice with independent protein preparations, imaging, and analyses. The figure is plotted from one of the duplicate data sets. Both data sets can be found in Figure 5—source data 1.
-
Figure 5—source data 1
Excel files with the source data of the data in Figure 4B and the replicate experiment.
- https://cdn.elifesciences.org/articles/67926/elife-67926-fig5-data1-v2.zip
Figure 5—figure supplement 1

Representative SFM height images of BRCA2 ΔCTD and BRCA2 ΔDBDΔCTD in the presence and absence of ssDNA.
Neither of the constructs exhibited a change in conformation on incubation with single-stranded DNA (ssDNA). A noticeable amount of free ssDNA is visible in the background, showing lack of interaction.
Figure 5—figure supplement 2

Distribution of full-length BRCA2 and the C-terminal deletion constructs with respect to their oligomerization and solidity.
Distribution of oligomerization and solidity of full-length BRCA2 and DNA-binding domain (DBD) and/or C-terminal domain (CTD) deletion variants. Full-length BRCA2 rearranges to form extended monomer-dimers and tetramers on interaction with single-stranded DNA (ssDNA), whereas the deletion constructs do not show any change in their distribution.
Figure 5—figure supplement 3

Control experiment showing representative scanning force microscopy (SFM) height images of full-length BRCA2 ± ssDNA in the absence of spermidine, showing that the conformational change observed on interaction with single-stranded DNA (ssDNA) is not an artifact due to presence of spermidine, which is used to facilitate adsorption of DNA on the mica surface for SFM imaging.
Tables
Table 1
Summary of results of the in vivo assays in this study.
| Ionizing radiation | DNA crosslinks | PARPi | HR | BRCA2 diffusion | Immobilization | RAD51 focus formation | ||
|---|---|---|---|---|---|---|---|---|
| Full-length | + | + | + | + | + | + | ++ | |
| ΔDBD | - | - | -- | - | + | + | + | |
| ΔCTD | +/- | + | - | +/- | + | + | + | |
| ΔDBDΔCTD | - | - | -- | - | + | +/- | + | |
Table 2
Summary of results of the in vitro assays in this study.
| Multimerization | Conformational change | ||
|---|---|---|---|
| + RAD51 | + ssDNA | ||
| Full-length | + | +++ | +++ |
| ΔDBD | +/- | ++ | — |
| ΔCTD | +/- | +++ | — |
| ΔDBDΔCTD | +/- | ++ | - |
Key resources table
| Reagent type (species) or resource | Designation | Source or reference | Identifiers | Additional information |
|---|---|---|---|---|
| Gene (mouse) | Brca2 | Genbank | MGI:109337 | |
| Gene (human) | BRCA2 | Genbank | HGNC:1101 | |
| Cell line (mouse) | IB10, subclone of E14 129/Ola | Hooper et al., 1987 | IB10, mES | |
| Cell line (mouse) | Mouse ES cellsRad54 -/- | Tan et al., 1999 | ||
| Cell line (human) | HEK293T | Adapted to suspension culture | ||
| Antibody | Rabbit polyclonal anti-RAD51 | van Veelen et al., 2005 | 2307 | IF: 1:10 000 |
| Antibody | Rabbit polyclonal Anti-BRCA2 | Abcam | ab27976 | WB: mouse BRCA2 (1:1000) |
| Antibody | Mouse monoclonal Anti-HaloTag | Promega | G9211 | WB: 1:1000 |
| Antibody | Mouse monoclonal anti-PARP-1 | Enzo | BML-SA250-0050 | WB: 1:1000 |
| Antibody | Anti-rabbit IgG conjugated with CF568 | Biotium/Sigma | Cat# SAB4600310 | IF 1:1000 |
| Antibody | Donkey αRabbit IgG HR Peroxydase | Jackson Imm Res | Cat# 711-035-152 | WB: 1:2000 |
| Antibody | Sheep αMouse IgG HR Peroxydase | Jackson Imm Res | Cat# 515-035-003 | WB: 1:2000 |
| Antibody | Mouse monoclonal anti BRCA2 | Calbiochem | OP95 | WB: full-length, ΔDBD, ΔCTD, ΔDBDΔCTD proteins (1:500) |
| Recombinant DNA reagent | AAV_Actb HR donor plasmid | Yao et al., 2017; Addgene | Plasmid #97317 | |
| Recombinant DNA reagent | px459 | Ran et al., 2013 | ||
| Recombinant DNA reagent | px459 expressing two gRNAs | Zelensky et al., 2017 | Modified from Ran et al., 2013 | |
| Recombinant DNA reagent | BRCA2-HaloTag donor plasmid | This paper | Knock-in construct HaloTag -F2A-neomycin at mouse BRCA2 C-terminus; available on request from corresponding author | |
| Recombinant DNA reagent | BRCA2 ΔDBD-HaloTag | This paper | Knock-in construct HaloTag -F2A-neomycin at mouse BRCA2 C-terminus resulting in deletion of DBD; available on request from corresponding author | |
| Recombinant DNA reagent | BRCA2 ΔCTD-HaloTag | This paper | Knock-in construct HaloTag -F2A-neomycin at mouse BRCA2 C-terminus resulting in deletion of CTD; available on request from corresponding author | |
| Recombinant DNA reagent | BRCA2 ΔDBDΔCTD-HaloTag | This paper | Knock-in construct HaloTag -F2A-neomycin at mouse BRCA2 C-terminus resulting in deletion of DBD and CTD; available on request from corresponding author | |
| Recombinant DNA reagent | iRFP720-PCNA | This study | pMP37 pGb-iRFP720-I-PCNA | Expression construct flanked by piggyBac inverted terminal repeats; available on request from corresponding author |
| Recombinant DNA reagent | hyPBase | Yusa et al., 2011 | Expressing piggyBac transposase | |
| Recombinant DNA reagent | phCMV1-2MBP-TEV-fl BRCA2 | S Kowalczykoski lab | Expression clone for 293T HEK cells | |
| Recombinant DNA reagent | phCMV1-2MBP-TEV-BRCA2 ΔDBD | This study | Expression clone for 293T HEK cells; available on request from corresponding author | |
| Recombinant DNA reagent | phCMV1-2MBP-TEV-BRCA2 ΔCTD | This study | Expression clone for 293T HEK cells; available on request from corresponding author | |
| Recombinant DNA reagent | phCMV1-2MBP-TEV-BRCA2 ΔDBDΔCTD | This study | Expression clone for293T HEK cells; available on request from corresponding author | |
| DNA oligo | 90 nt ssDNA oligo | IDT | See sequence in 'Materials and methods' | |
| Commercial kit | Q5 site directed mutagenesis | NEB | Cat# E0554S | |
| Commercial assay or kit | MyTaq Red Mix | Bioline | BIO-25043 | |
| Chemical compound, drug | JF549 HaloTag-ligand | Grimm et al., 2015 | Gift from L Lavis | |
| Chemical compound, drug | JF646 HaloTag-ligand | Grimm et al., 2015 | Gift from L Lavis | |
| Chemical compound, drug | EdU (5-ethynyl-2’-deoxyuridine) | Cat# A10044 | ||
| Chemical compound, drug | Atto488-azide | ATTO-TEC GmbH | Cat# AD 488–101 | |
| Chemical compound, drug | Atto568 azide | ATTO-TEC GmbH | Cat# AD 594–101 | |
| Chemical compound, drug | MMC (mitomycin C) | Sigma-Aldrich | Cat# M503 | |
| Chemical compound, drug | Cisplatin | Sigma-Aldrich | Cat# P4394 | |
| Chemical compound, drug | Olaparib | Selleckchem | Cat# S1060 | |
| Reagent | FreeStyle 293 expression medium | Gibco | Cat# 10319322 | For growth of 293T HEK cells |
| Reagent | Serum-free hybridoma media | Gibco | Cat# 12045084 | For transfection of 293T HEK cells |
| Software, algorithm | DBD tracking | This paper | Software for analysis of single-moleucle tracking data Available at: https://github.com/maartenpaul/DBD_tracking (copy archived at swh:1:rev:19f3a47289830cf5dc139061a89627b6165da804, Paul, 2021) | |
| Software, algorithm | DBD foci | This paper | Scripts for analysis of foci data using CellProfiler Available at: https://github.com/maartenpaul/DBD_foci/ (copy archived at swh:1:rev:157c7953dbed176a65f2c55db7ad48ebfa7f3f5d, Pau, 2021) | |
| Software, algorithm | SOS Plugin | Reuter et al., 2014 | http://smal.ws/wp/software/sosplugin/ | |
| Software, algorithm | DL-MSS | Arts et al., 2019a Arts et al., 2019b | https://github.com/ismal/DL-MSS | |
| Software, algorithm | CellProfiler | Carpenter et al., 2006 | ||
| Software, algorithm | Fiji | Schindelin et al., 2012 | ||
| Software, algorithm | SFMetrics | Sánchez and Wyman, 2015 | http://cluster15.erasmusmc.nl/TIRF-SFM-scripts/ |
Additional files
-
Supplementary file 1
Tables with gRNA sequences used for generating the BRCA2-Halo knock-in cell lines and primers used for genotyping the cell lines.
- https://cdn.elifesciences.org/articles/67926/elife-67926-supp1-v2.xlsx
-
Supplementary file 2
Summary of average solidity of BRCA2 variants in the absence and presence of ssDNA (90-mer) oligomer.
- https://cdn.elifesciences.org/articles/67926/elife-67926-supp2-v2.xlsx
-
Supplementary file 3
Percent rod-like assemblies in BRCA2-RAD51 interaction in various constructs.
- https://cdn.elifesciences.org/articles/67926/elife-67926-supp3-v2.xlsx
-
Transparent reporting form
- https://cdn.elifesciences.org/articles/67926/elife-67926-transrepform-v2.docx
Download links
A two-part list of links to download the article, or parts of the article, in various formats.
Downloads (link to download the article as PDF)
Open citations (links to open the citations from this article in various online reference manager services)
Cite this article (links to download the citations from this article in formats compatible with various reference manager tools)
Role of BRCA2 DNA-binding and C-terminal domain in its mobility and conformation in DNA repair
eLife 10:e67926.
https://doi.org/10.7554/eLife.67926


