Simple biochemical features underlie transcriptional activation domain diversity and dynamic, fuzzy binding to Mediator
- Department of Structural Biology, Stanford University School of Medicine, United States
- Department of Computer Science, Stanford University, United States
- The Center for Genome Architecture, Baylor College of Medicine, United States
- Center for Theoretical Biological Physics, Rice University, United States
Figures
Figure 1 with 1 supplement
A quantitative screen identifies 150 activation domains from all yeast transcription factors.
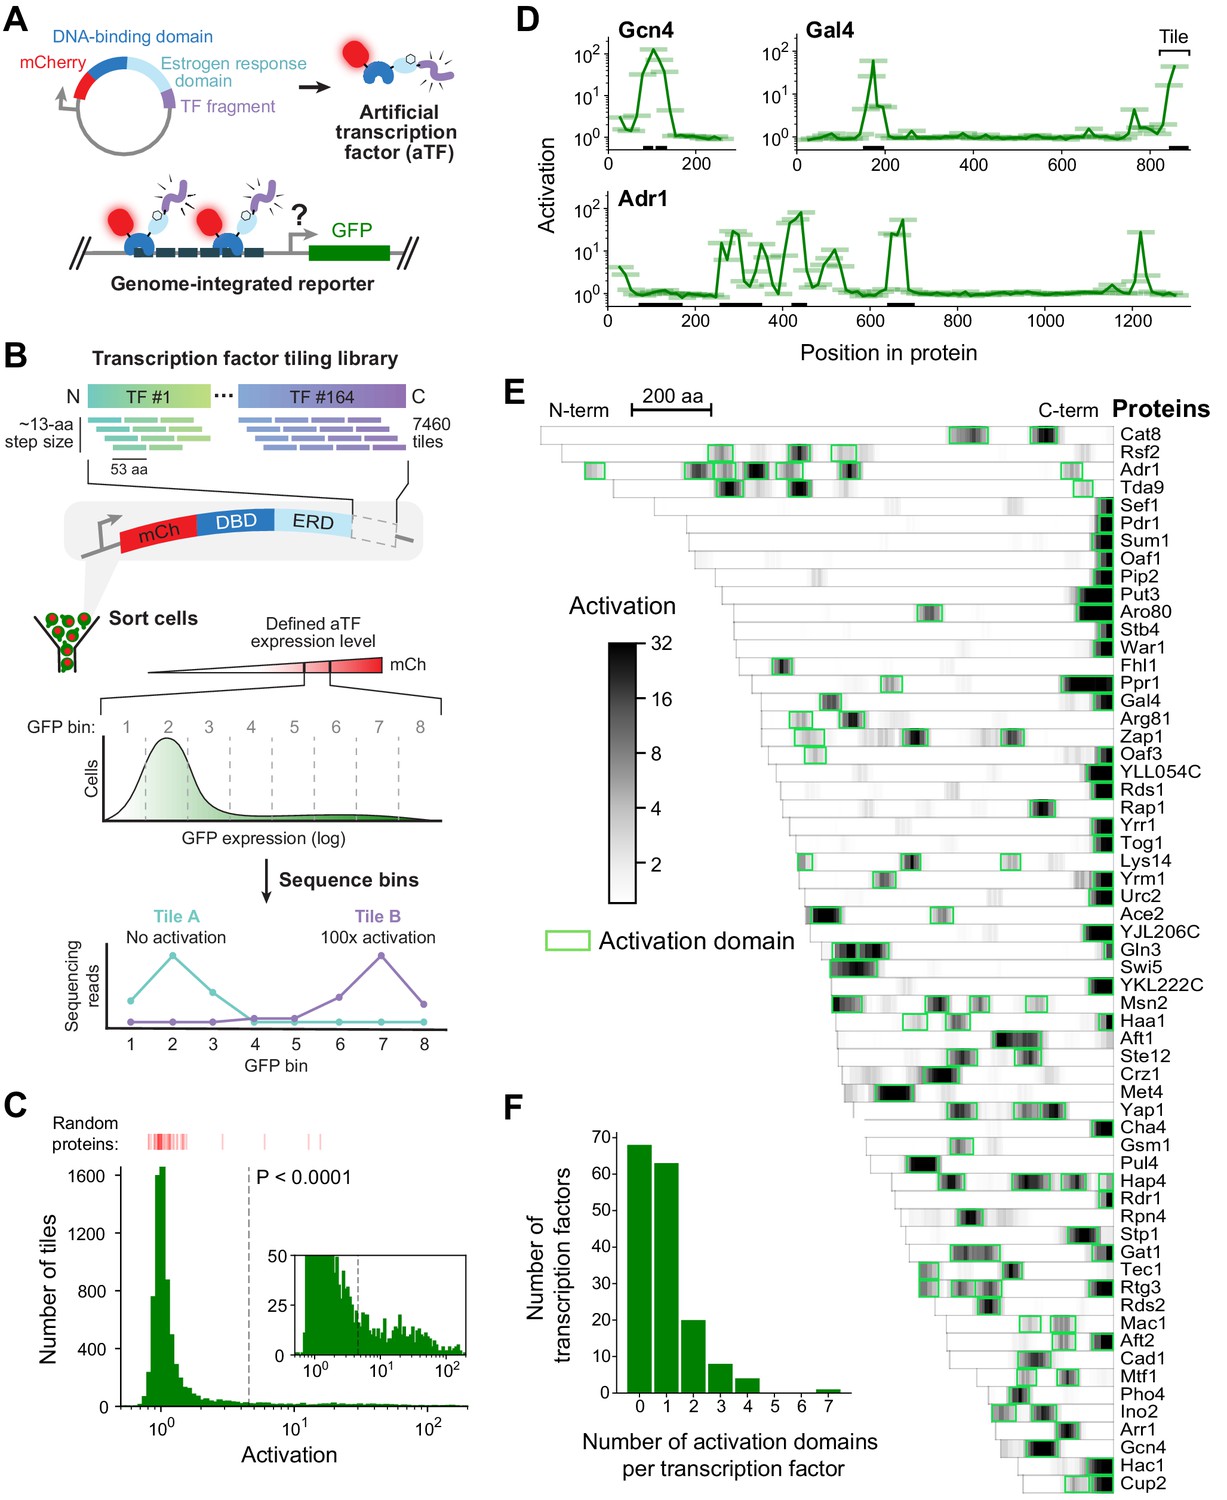
(A) Schematic of the activation assay. To measure in vivo activation, we expressed fragments of TF proteins fused to a DNA-binding domain that binds uniquely in the promoter of a genome-integrated GFP reporter gene. This artificial TF (aTF) is tracked by its mCherry tag and localizes to the nucleus only after induction with estrogen. (B) Pooled screen for activation domains (ADs). All 164 yeast TFs were tiled by a DNA oligonucleotide library expressing 7460 protein segments, each 53 amino acids (aa) in length, with a step size of 12–13 aa (3.8-fold coverage). The library was cloned into the aTF expression plasmid and transformed into yeast cells. Using fluorescence-activated cell sorting, cells with a defined level of aTF expression were selected by mCherry signal and sorted into eight bins based on GFP expression. By next-generation sequencing, the distribution of each protein tile across the bins was determined and the mean value was used to calculate activation—namely, the fold increase in GFP relative to background. See also Figure 1—figure supplement 1A–D and Figure 1—source data 1. (C) Histogram of activation measured for 7460 tiles spanning all yeast TFs. Dashed line shows cutoff for p-values less than 0.0001 (Z-test). Red bars above the histogram mark activation of 50 random protein sequences. Inset: same histogram, zoomed in. See also Figure 1—figure supplement 1G. (D) Activation data for tiles spanning three example proteins. Activating tiles cluster into well-defined ADs when plotted by their protein position. Tiles, 53 aa long, are shown as horizontal bars with a line traced through their centers for clarity. Previously known ADs are marked as black bars along the x-axis. See also Figure 1—figure supplement 1H. (E) Heatmap showing the mean activation at each position of the 60 TFs with the strongest ADs. Proteins run left to right from N-terminus to C-terminus and are sorted by length. A scale bar shows 200 aa. ADs annotated in our screen are boxed in green and listed in Figure 1—source data 2. The method for annotating ADs is depicted in Figure 1—figure supplement 1H. (F) Histogram of the number of ADs in each TF. Of 164 TFs, 68 had no ADs, 63 had a single AD, and 33 had multiple distinct ADs, including up to seven distinct ADs in Adr1 (panel D). See also Figure 1—figure supplement 1I.
-
Figure 1—source data 1
Data from activation assays.
- https://cdn.elifesciences.org/articles/68068/elife-68068-fig1-data1-v3.xlsx
-
Figure 1—source data 2
ADs identified in the activation screen and their overlap with previously-known ADs.
Protein positions are 0-indexed and inclusive of start but exclusive of stop positions.
- https://cdn.elifesciences.org/articles/68068/elife-68068-fig1-data2-v3.xlsx
Figure 1—figure supplement 1
Methodology, validation, and summary statistics for pooled activation screens.
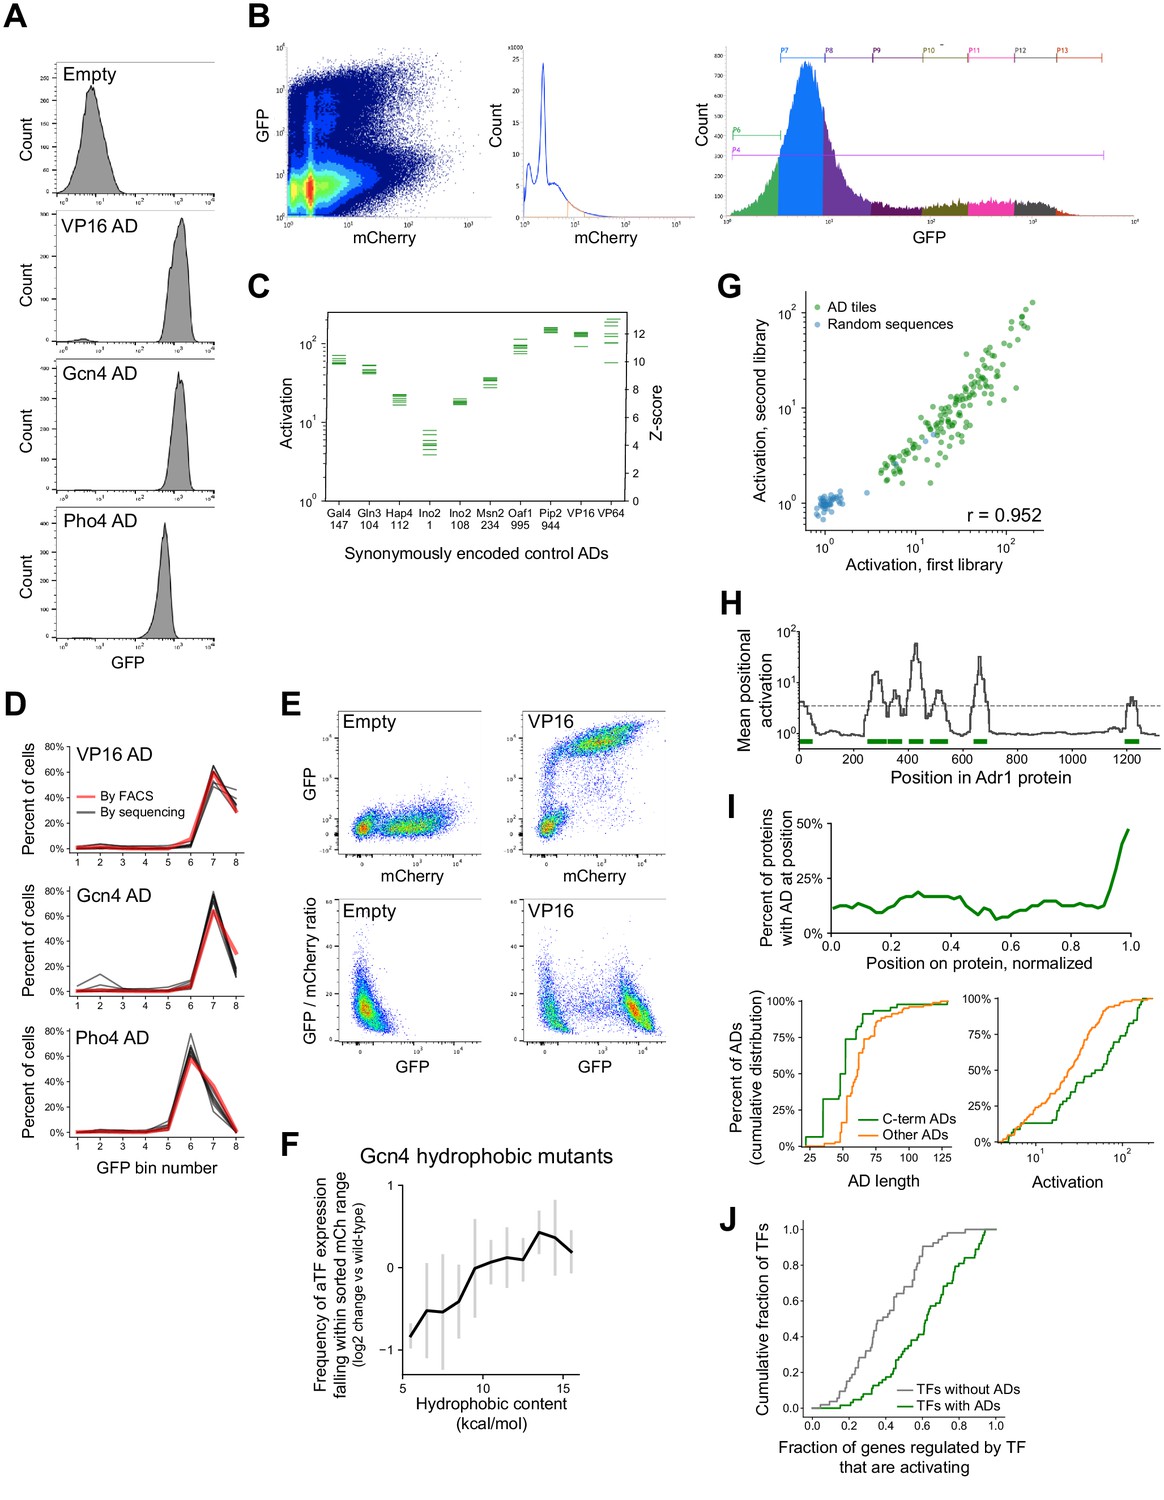
(A) Distributions of signal from the GFP reporter (in arbitrary units), measured from FACS, in cells expressing artificial TF (aTF) fused to ADs from VP16, Gcn4, or Pho4, or without an AD. Cells were filtered by a narrow range of mCherry, which tracks the aTF expression level. (B) FACS plots of 1,000,000 events observed in the activation assay with the TF tiling and AD mutant sub-libraries (sub-libraries A and B), showing (left) the mCherry and GFP signal for each cell, (middle) the mCherry range used for sorting, and (right) the distribution across the eight GFP bins. (C) In vivo fold-activation and corresponding Z-scores measured for 10 positive control ADs that were each encoded by eight different synonymous DNA sequences. Horizontal axis labels show the protein and start position of each 53-aa AD. (D) Distributions across the eight GFP bins of cells expressing aTF fused to ADs from VP16, Gcn4, or Pho4, either measured individually by FACS (red line) or in the pooled screen encoded by eight different synonymous DNA sequences (black lines). (E) mCherry versus GFP and GFP versus GFP/mCherry ratio for cells expressing aTF with no AD or with the VP16 AD. The GFP/mCherry ratio alone poorly distinguishes GFP-positive cells. (F) aTF expression is affected by tile sequence. To estimate how tile protein sequences affected aTF expression levels, we sequenced theFACS input cells and examined, for each sequence, the frequency at which input cells fell within the filtered mCherry range (i.e. were seen across all eight GFP bins combined). Plotted here is the mean (black) and standard deviation (gray bars) of this measure for the hydrophobic mutants of the Gcn4 AD (Figure 2D), relative to wild-type, when binned by their hydrophobic content. (G) Scatter plot of activation of tiles from 150 ADs (green) and 50 random sequence controls (blue) shared between two separately cloned and assayed libraries (sub-libraries A and D, Pearson's r = 0.952). (H) ADs were annotated using the (log-scale) mean activation at each protein position, shown here for Adr1. Width of ADs were determined by the full width half maximum of each peak that crossed the threshold (dashed line). Annotated ADs are marked in green bars. Related to Figure 1D–E. (I) (Top) C-terminal ADs are in nearly half of all AD-containing TFs. The horizontal axis shows protein position normalized so that the N- and C-termini are at 0 and 1, respectively. (Bottom) Cumulative distribution plots of the length and maximal activation (among overlapping tiles) for ADs at the C-terminus of a protein (green) versus other ADs, showing that C-terminal ADs are shorter and stronger on average. (J) TFs that contained ADs upregulated a higher proportion of downstream genes than TFs without ADs, p=1.5E-7 by KS test. Genes up- or down-regulated by each TF were annotated by Hackett et al., 2020.
Figure 2 with 1 supplement
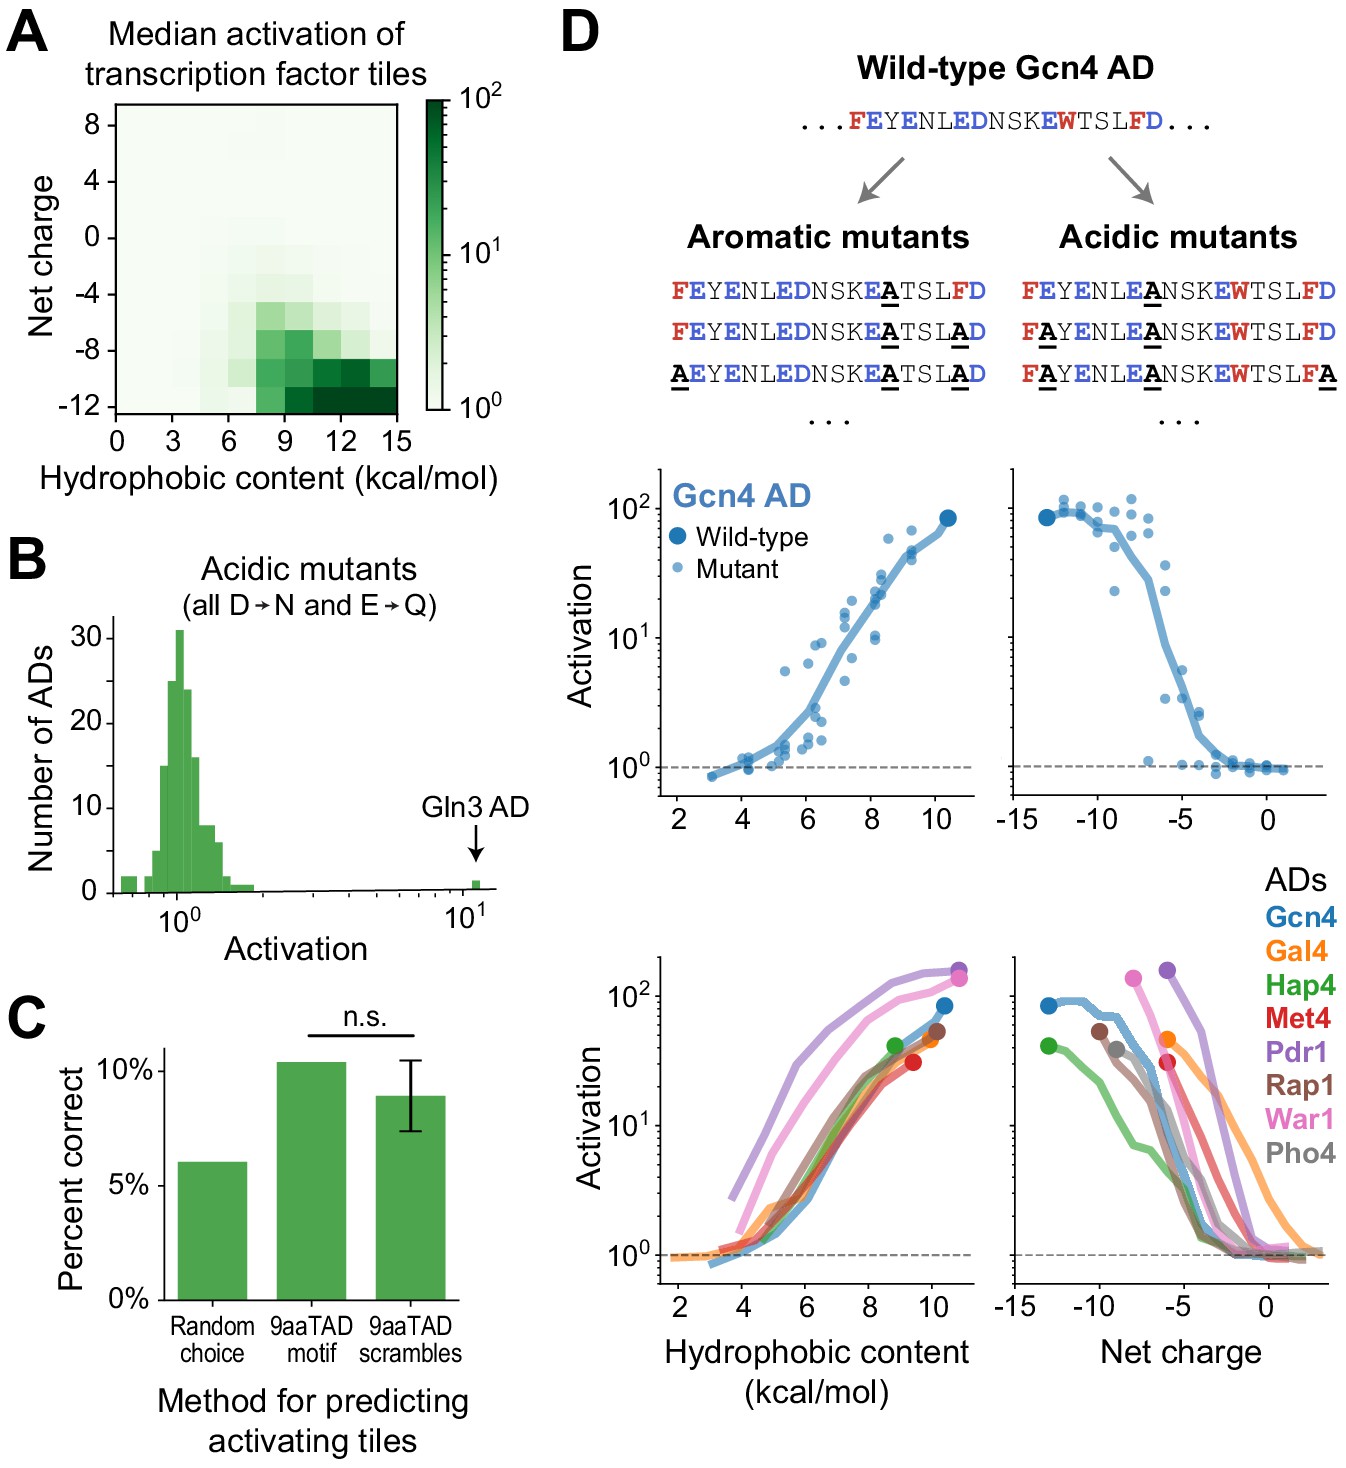
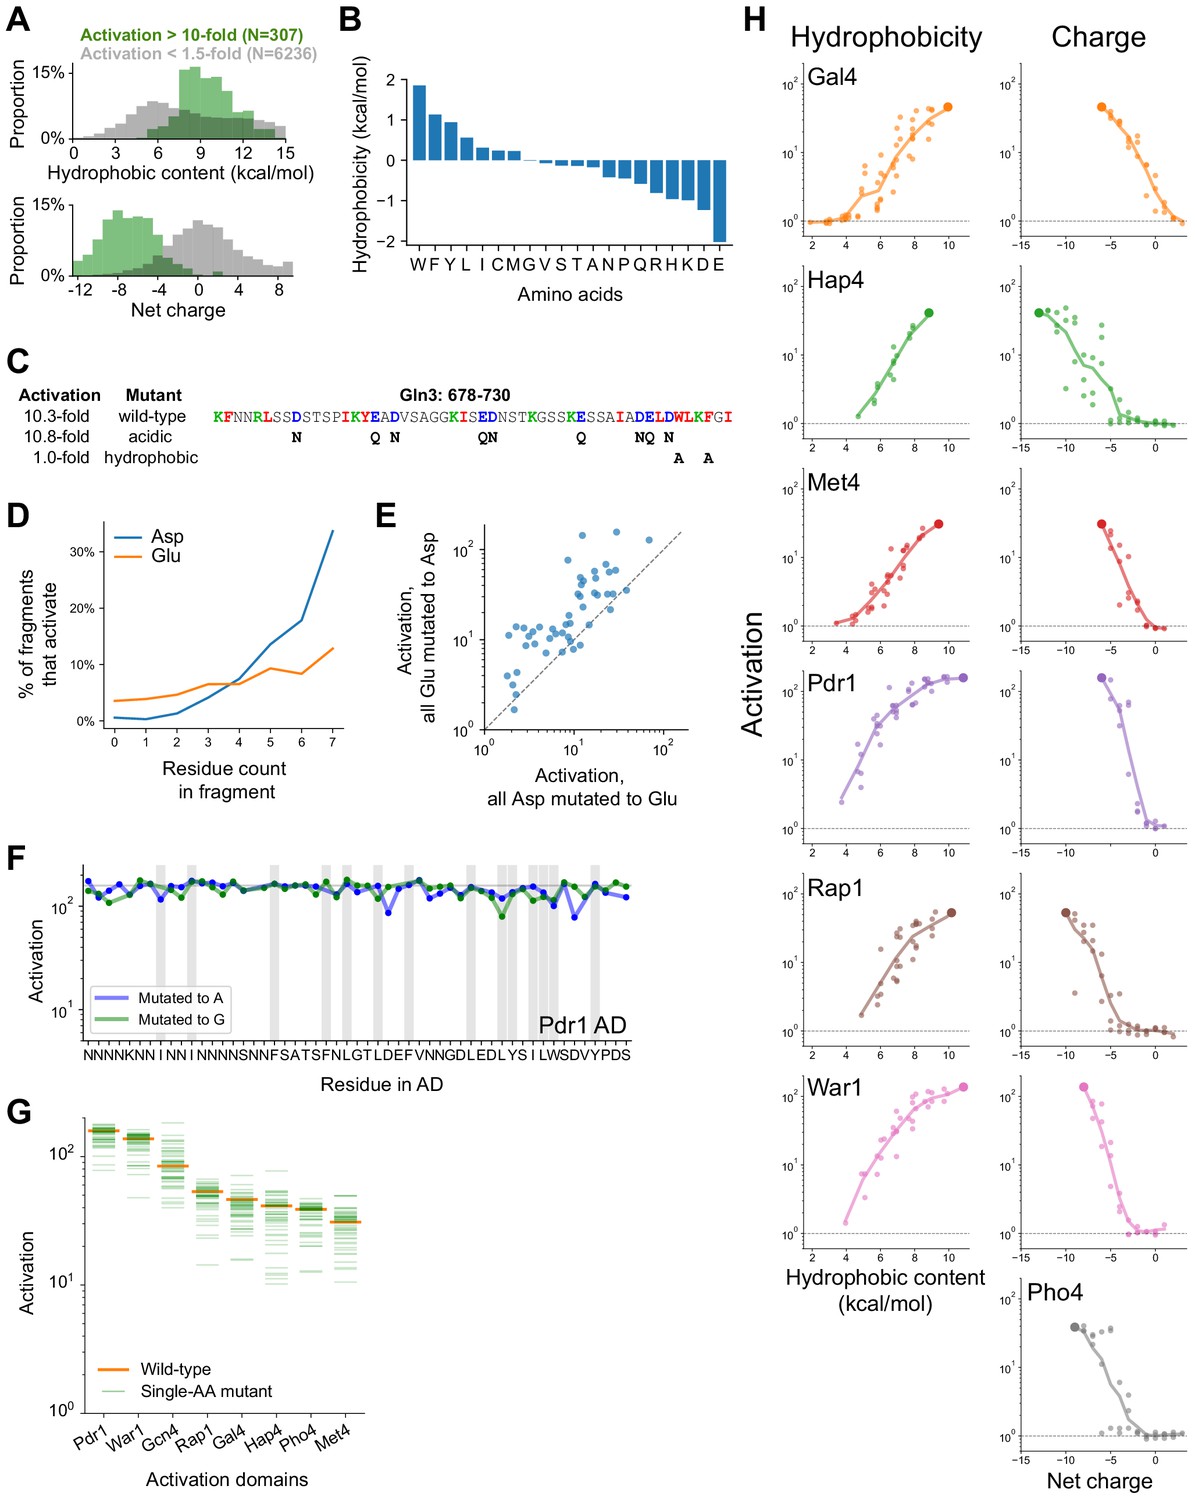
Activation strength is primarily determined not by motifs but by acidic and hydrophobic content.
(A) Tiles were binned by their hydrophobic content and net charge and the median activation of each bin is displayed in color. Activation was strongest for tiles high in both acidic and hydrophobic content. Hydrophobicity was computed using the Wimley-White scale (Figure 2—figure supplement 1B) and charge was computed by counting Asp, Glu, Arg, and Lys residues. (B) From each AD, activation of the strongest-activating fragment with all acidic residues mutated (Asp to Asn and Glu to Gln). Except for the Gln3 C-terminal AD, which activated just as strongly at +7 net charge without its acidic residues, activation was abolished in all ADs. See also Figure 2—figure supplement 1C–E. (C) Just 10% of tiles containing the 9aaTAD motif activated, which was only 1.7-fold better than guessing activating tiles at random and not significantly more predictive than scrambled versions of the motif. (n.s., not significant.) (D) We varied the acidic and hydrophobic content of eight ADs by mutating successively larger subsets of aromatic (left) or acidic (right) residues. (Top) Example mutant sequences for a segment of the Gcn4 AD, with activation of the wild-type (large dot) and mutants (small dots) plotted below as a function of hydrophobic content or net charge. Lines trace a moving average of activation. (Bottom) Average activation as a function of hydrophobic content or net charge, for all eight ADs tested. Activation of all individual mutants is shown in Figure 2—figure supplement 1H. The Pho4 AD contains only two aromatic residues so its aromatic mutants are not shown.
Figure 2—figure supplement 1
Mutagenesis of hydrophobic and acidic residues in known and newly-discovered ADs.
(A) Distribution of hydrophobic content (top) and net charge (bottom) for non-activating tiles (gray) and highly activating tiles (green). Hydrophobicity is computed using the Wimley-White scale and charge is computed by counting Asp, Glu, Arg, and Lys residues. (B) The Wimley-White interfacial scale used for calculating hydrophobic content of sequences. Related to Figure 2A. (C) The C-terminal AD of Gln3 activated just as strongly at +7 net charge, without acidic residues. However, mutating a pair of aromatic residues prevented activation, identifying the protein C-terminus as a key region. Hydrophobic, acidic, and basic residues are shown in red, blue, and green, respectively; mutated residues are shown below the wild-type sequence. Related to Figure 2B. (D) Within fragments that contain exactly 0–7 Asp or Glu residues, the percent that activate (p<0.0001) is plotted. Asp is more strongly associated with activation than Glu. (E) When all Glu residues were mutated to Asp, each of 150 ADs activated comparably to or stronger than when all Asp residues were mutated to Glu. (F) Impact of mutating every individual residue to Ala (blue) or Gly (green) in the Pdr1 AD. Residues in the Pdr1 AD are all redundant. Wild-type activation is marked by the horizontal line, positions with bulky hydrophobic residues (WFYILM) are marked in gray. (G) Activation of all single aa mutants (to Ala) across eight ADs. All mutants still activated more than 10-fold, and 94% of mutations affected activation by less than twofold. (H) All mutants in which aromatic residues (left) or acidic residues (right) were successively removed, as plotted in Figure 2D. Because the Pho4 AD contained only two aromatic residues, its mutants are not shown.
Figure 3 with 1 supplement
A deep learning model, termed PADDLE, predicts the location and strength of acidic activation domains in yeast and human.
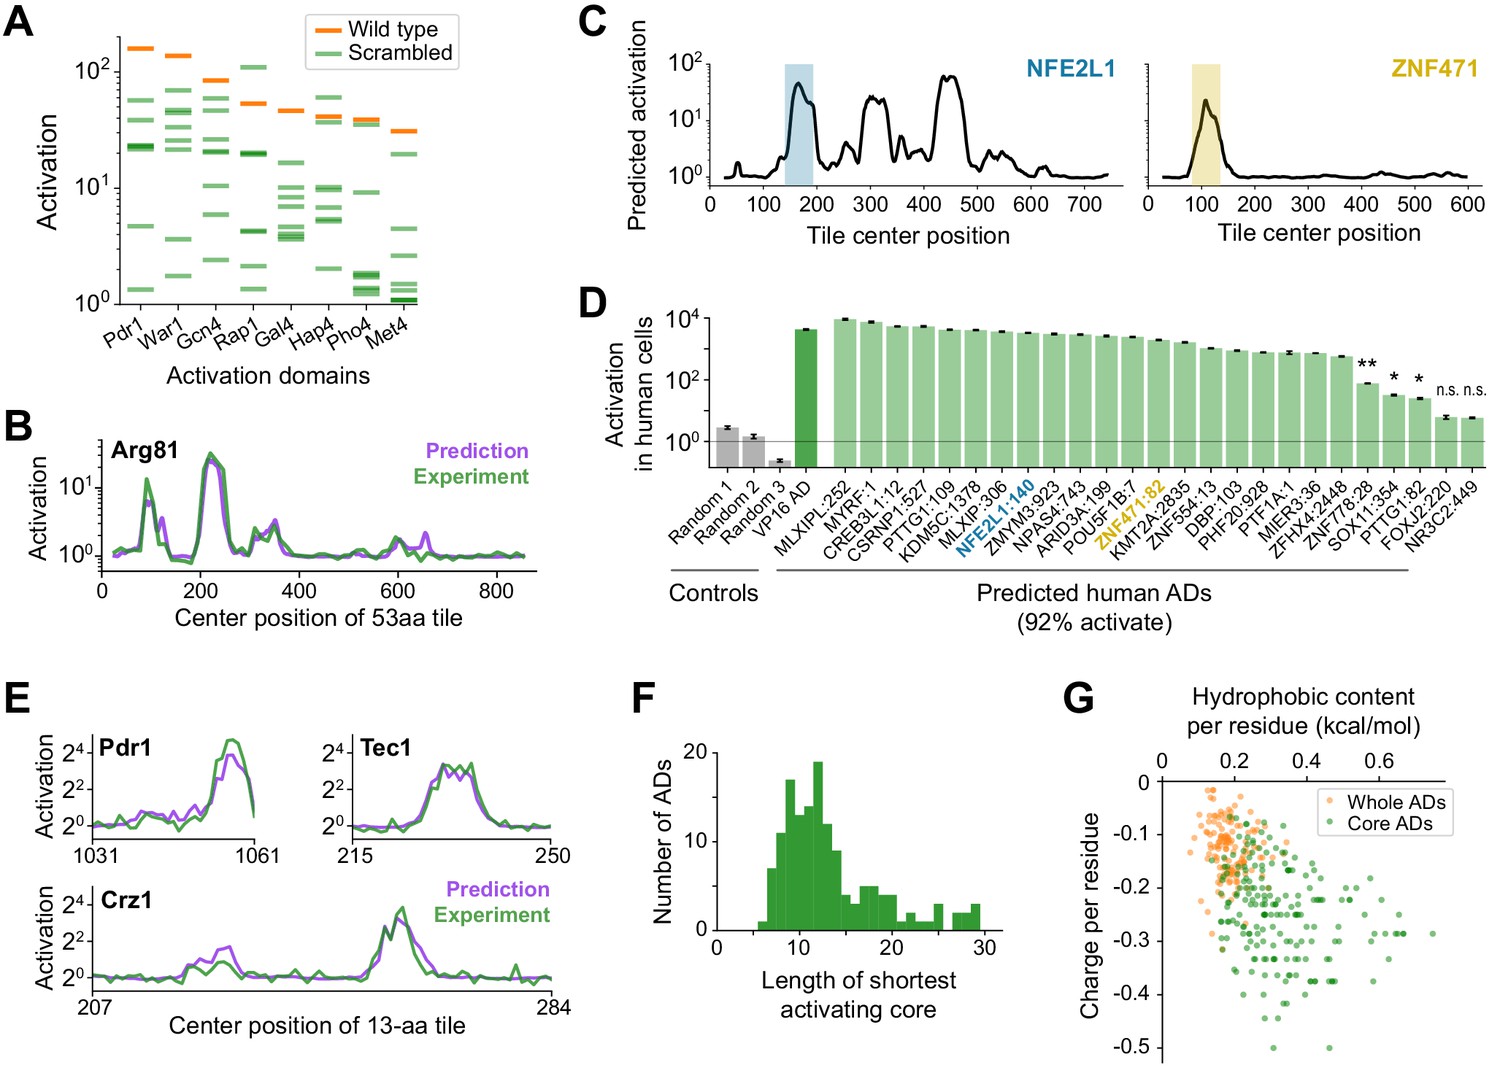
(A) Activation of wild-type (orange) and eight scrambled sequences (green) for each of eight ADs. (B) De novo PADDLE predictions (purple) and experimentally measured activation (green) for Arg81 are plotted by protein position. Predictions were run on 53-aa tiles in 1-aa steps and smoothed with a 9-aa moving average. See also Figure 3—figure supplement 1A–C and Figure 3—source data 1. (C) Example PADDLE predictions on 53-aa tiles spanning two human TFs. One predicted AD from each TF, marked by the colored shading, was tested experimentally. See also Figure 3—figure supplement 1D and Figure 3—source data 1. (D) PADDLE accurately predicts human ADs. We randomly selected 25 high-strength predicted ADs from human TFs and measured their activation individually using a luciferase reporter in HEK293T cells. Relative to three random sequence controls, 23 domains (92%) activated luciferase expression. The VP16 AD was used as a positive control. Error bars show standard deviation of technical triplicates. (*p<0.01; **p<0.0005; n.s., not significant.). (E) PADDLE predictions (purple) and experimentally measured activation (green) of 13-aa tiles in 1-aa steps spanning three ADs. Both predictions and experiments identified at least one significantly activating 13-aa tile within each of 10 ADs (Figure 3—figure supplement 1E–F). (F) PADDLE was used to identify, within each AD, the shortest core region predicted to activate on its own. A histogram of their lengths is plotted. The minimal region for activation can be localized to within 20-aa core in 85% of ADs. (G) The hydrophobic content and charge per residue of whole ADs (orange) and predicted core ADs (green).
-
Figure 3—source data 1
ADs predicted in human and virus proteins and core ADs predicted in yeast.
Protein positions are 0-indexed and inclusive of start but exclusive of stop positions.
- https://cdn.elifesciences.org/articles/68068/elife-68068-fig3-data1-v3.xlsx
Figure 3—figure supplement 1
Validation of neural network models and PADDLE predictions on human TFs and yeast core ADs.
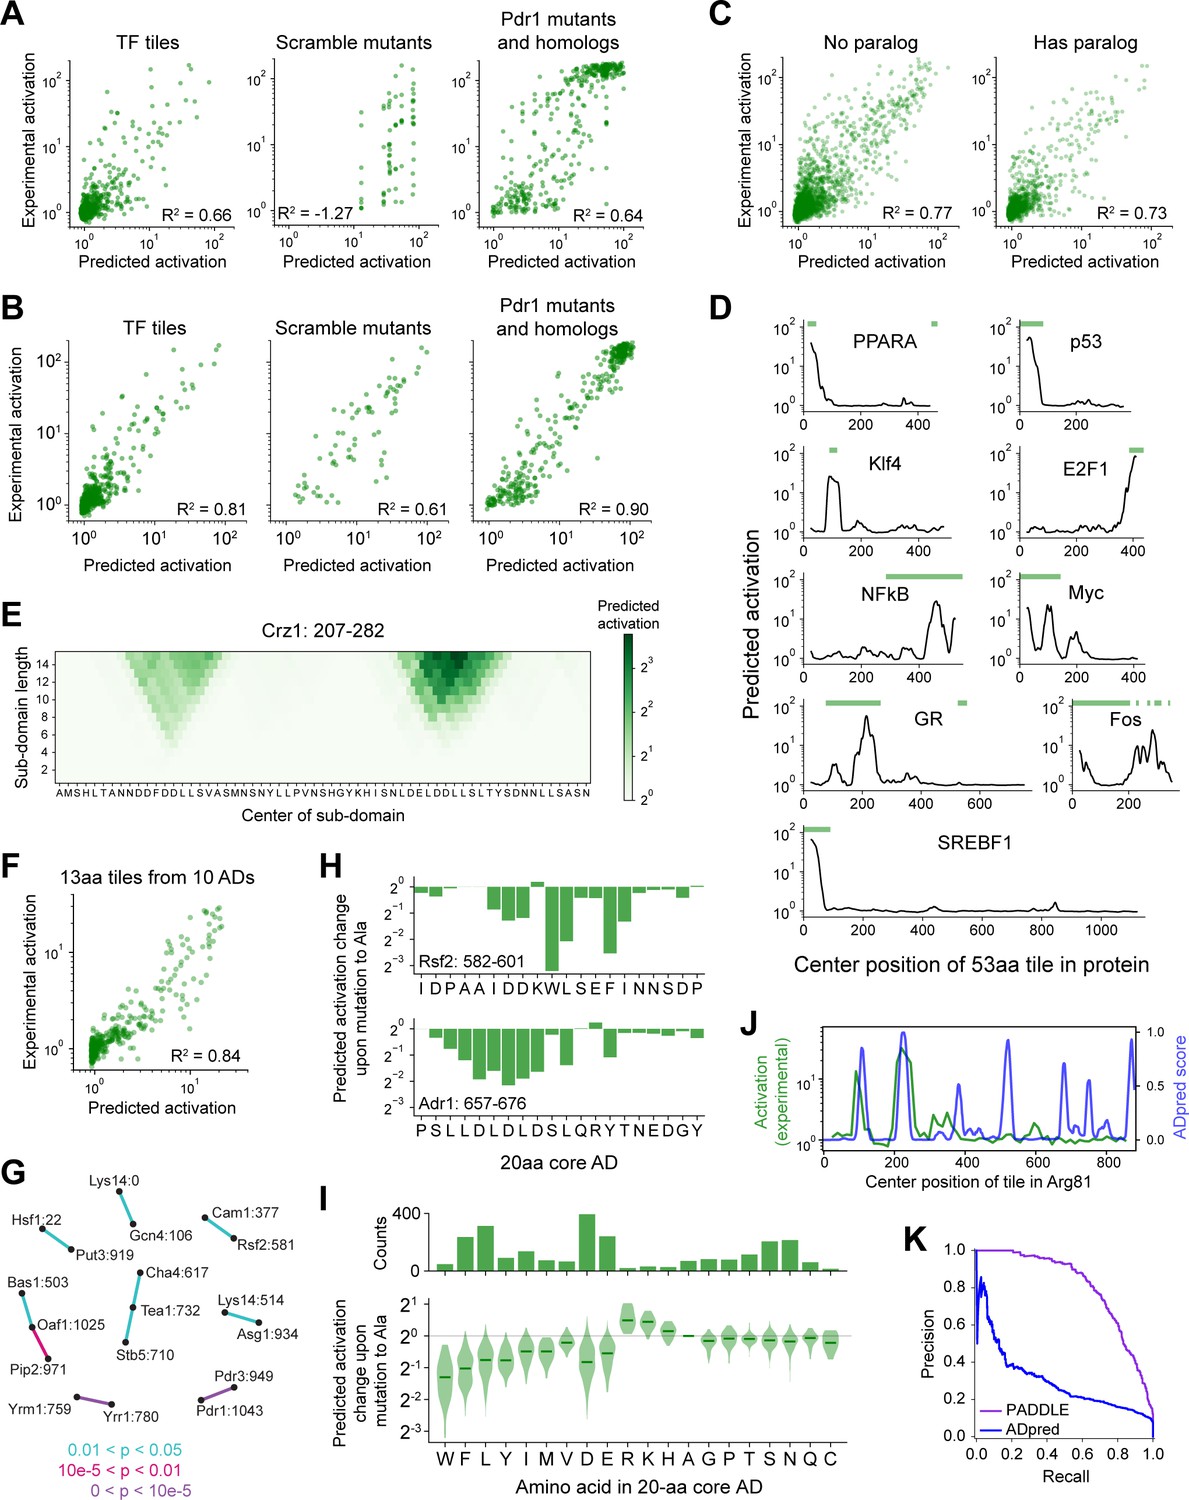
(A) Neural network predictions from amino acid composition alone on test data withheld from training. R2 is the coefficient of determination. Compare to PADDLE predictions in Panel B. (B) PADDLE predictions versus experimentally measured activation is plotted for three categories of sequences that were omitted from PADDLE’s training dataset: wild-type tiles of TF proteins (left), the scrambled sequences of eight ADs from Figure 3A (middle), and 232 mutants and 178 orthologs of the Pdr1 AD (right). R2 is the coefficient of determination. (C) PADDLE predictions on TF tiles in the training validation set, split by whether the TF has a paralog. R2 is the coefficient of determination. PADDLE is not more accurate on TFs that have a paralog in the training set. (D) Examples of PADDLE predictions in human TFs compared with previously known ADs (green bars). GR is the glucocorticoid receptor. Related to Figure 3C–D. AD annotations are from Barrett et al., 2005; Dowell et al., 1997; Funk et al., 1997; Ghaleb and Yang, 2017; Hi et al., 1999; Kato et al., 1990; Lavery and McEwan, 2005; Raj and Attardi, 2017; Sato et al., 1994; Seipel et al., 1992; Sutherland et al., 1992; and Yet et al., 1998. (E) PADDLE-noSS predictions on all sub-domains up to 15 residues in length within positions 207–282 in Crz1. Each sub-domain corresponds to a square and its predicted activation is shown in color. Related to Figure 3E. (F) Scatter plot of predictions and experimentally measured activation for 13-aa tiles spanning 10 ADs. R2 is the coefficient of determination. Related to Figure 3E. (G) The 20-aa core regions from all ADs have no common shared motifs. Pairwise BLAST Expect values (E-values) were calculated between all pairs of core ADs using all-against-all protein BLAST with an Expect threshold of 200,000, an alignment seed ('word') size of 3, BLOSUM62 as the scoring matrix, a gap existence cost of 10, and a gap extension cost of 1. p-Values were calculated as 1 - exp(-E). All core AD pairs with p<0.05 are shown here connected by lines colored according to p-value. Core ADs (nodes) are labeled by their protein and start position. (H) For two 20-aa core ADs, the predicted activation change upon mutating each individual residue to Ala is shown. (I) Amino acid contributions to the strongest-activating 20-aa core within every AD. (Top) The number of times each amino acid is present. (Bottom) For each 20-aa core AD, the fold-change in activation upon mutating each individual residue to Ala was predicted using PADDLE. Those effects, grouped by the amino acid mutated, are shown in this violin plot. Median values are depicted by green lines. (J) Comparison of ADpred (Erijman et al., 2020b) predictions on 30-aa tiles in Arg81 (blue), smoothed with a 15-aa moving average, with experimental measurements of activation on 53-aa tiles (green). ADpred correctly predicts two ADs but incorrectly predicts additional ADs. Compare to Figure 3B. (K) Precision-recall curves for predictions by PADDLE (purple) or ADpred (blue). The predictions are evaluated on all wild-type TFs tiles withheld from PADDLE’s training dataset. ADpred score for each 53-aa tile is taken as the 80th percentile of ADpred scores for all containing 30-aa tiles. Area under the precision-recall curve (AUPRC) for PADDLE and ADpred are 0.805 and 0.294, respectively.
Figure 4 with 1 supplement
Sequence and structural determinants of activation domains.
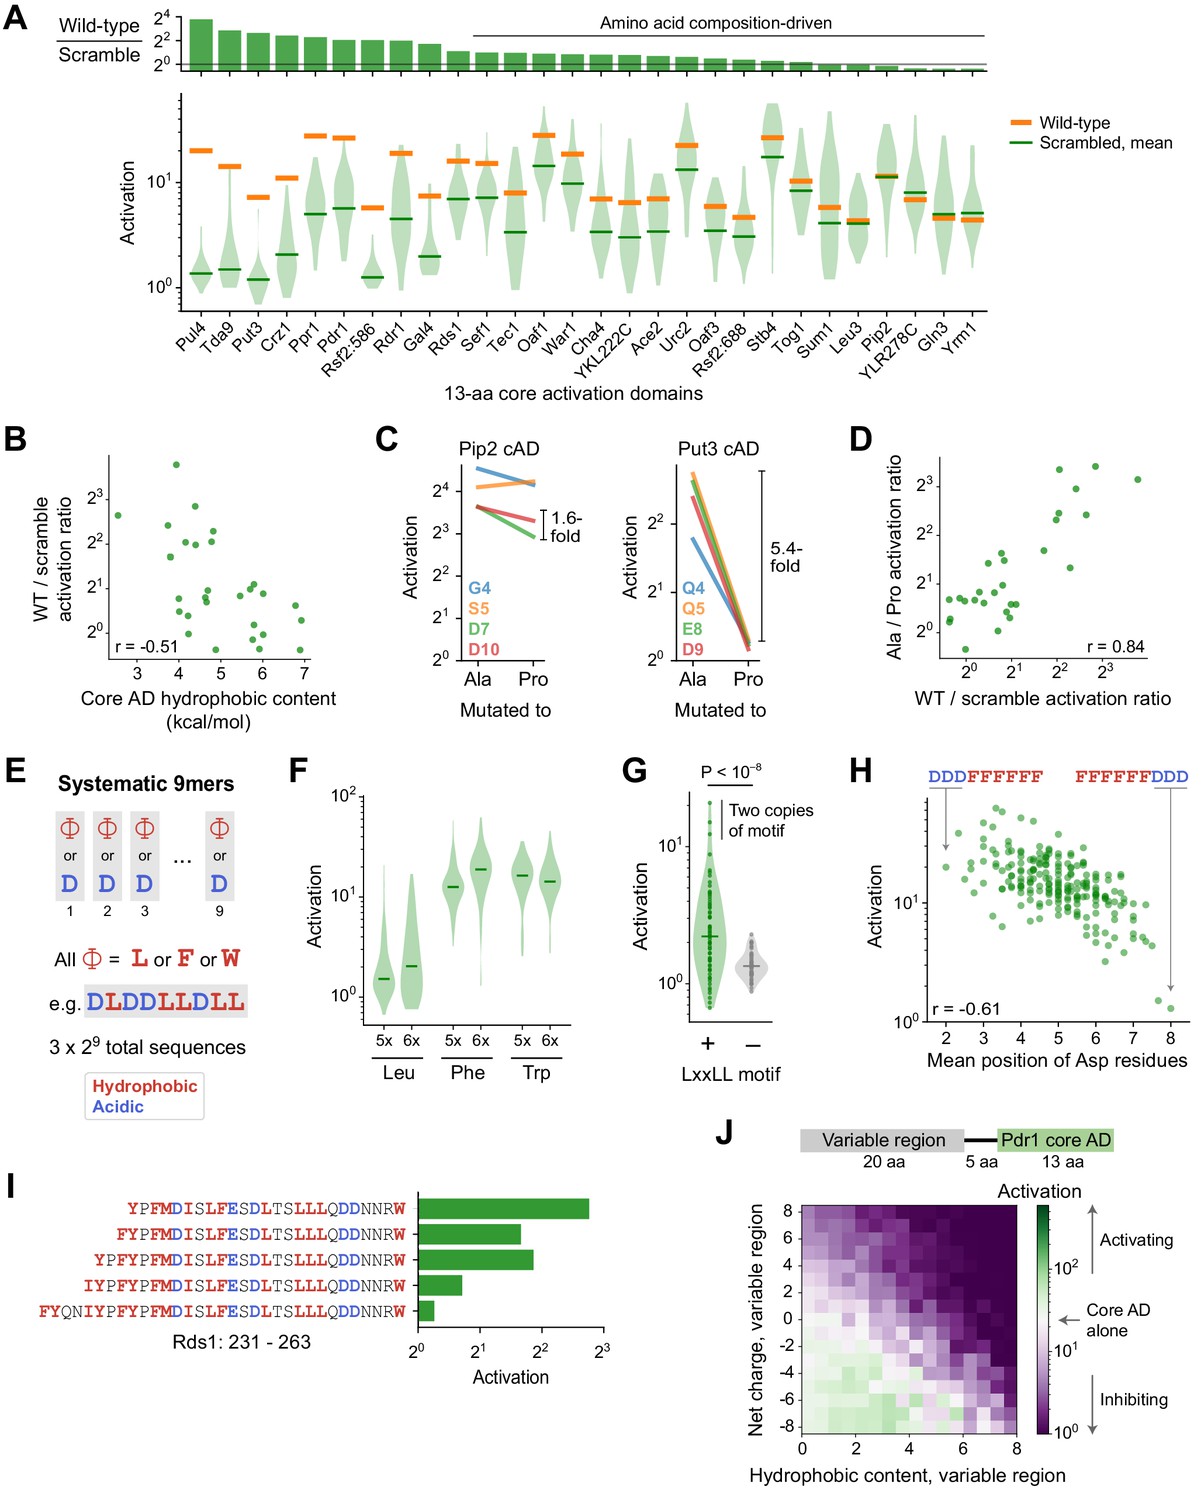
(A) To quantify the importance of aa composition, we measured activation of 33 scrambled sequences for each of the 28 strongest 13-aa core ADs (cADs). (Top) Activation of each wild-type cAD divided by the mean activation of its scrambled mutants. Eighteen cADs (64%) showed activation by the wild-type sequence within twofold of the scrambled sequence average, indicating that their activation is primarily determined by aa composition and not by a unique positioning of residues. (Bottom) Activation of each wild-type cAD (orange bars) and the distribution of activation by scrambled mutants (violin plot), with the mean activation of mutants shown by the green bars. See also Figure 4—figure supplement 1A. (B) cADs with the greatest hydrophobic content had the lowest wild-type-to-scramble ratios (Pearson’s r = −0.51, p=0.006). (C) To directly determine whether the 28 strongest 13-aa cADs require helical folding, we individually mutated each non-hydrophobic residue to Ala or Pro and asked whether Pro inhibited activation relative to Ala. Activation of the Pip2 cAD (left) was not disrupted by Pro mutation and showed at most a 1.6-fold drop compared to Ala mutations. In contrast, activation of the Put3 cAD (right) was abolished by all Pro mutations, up to a 5.4-fold drop compared to Ala mutations. Effects of mutations for all 28 cADs are shown in Figure 4—figure supplement 1B. (D) Across cADs, the wild-type-to-scramble ratio (horizontal axis) was correlated with the maximal fold-drop in activation resulting from Pro mutation (vertical axis). Pearson’s r = 0.84. (E) A simplified system of artificial cADs that uses only the four most activation-promoting residues. Namely, 9-aa sequences (‘9mers’) consisting entirely of only two types of amino acids each: Asp and either Leu, Phe, or Trp. This way, all possible sequences (3 × 29 = 1536) could be systematically assayed. (F) Distributions of activation by 9mers consisting of five or six Leu, Phe, or Trp residues, grouped by aa composition, are shown as violin plots. Activation by all 9mers, grouped by aa composition, is shown in Figure 4—figure supplement 1C. (G) The LxxLL motif is significantly predictive of activation in 9mers with five Leu residues (p<10−8 by Kolmogorov-Smirnov test). The three strongest-activating sequences each contain two copies of the motif. This was the only motif strongly associated with activation of these Leu 9mers; effects for all motifs tested are shown in Figure 4—figure supplement 1D. Similar motifs were also significantly but more weakly associated with Phe 9mers and Trp 9mers (Figure 4—figure supplement 1E). (H) Activation by 9mers with five or six Phe residues was correlated with the average position of their acidic residues (Pearson’s r = −0.61). Most dramatically, DDDFFFFFF activated 20-fold while its reverse sequence FFFFFFDDD activated just 1.3-fold. (I) Residues 239–263 alone in Rds1 activated 6.8-fold, but extending the sequence by eight aa, five of them hydrophobic (red), abolished activation. (J) (Top) To systematically quantify inhibition, we measured the effect on activation when the Pdr1 cAD was placed next to a library of 2177 random 20-aa sequences chosen to span a wide range of net charge and hydrophobic content. (Bottom) Sequences were binned by the net charge and hydrophobic content of the variable region and mean activation is plotted in color. Activation comparable to the Pdr1 cAD alone is shown in white, with stronger and weaker activation shown in green and purple, respectively.
Figure 4—figure supplement 1
Additional activation data for and analysis of core AD mutants and systematic 9mers.
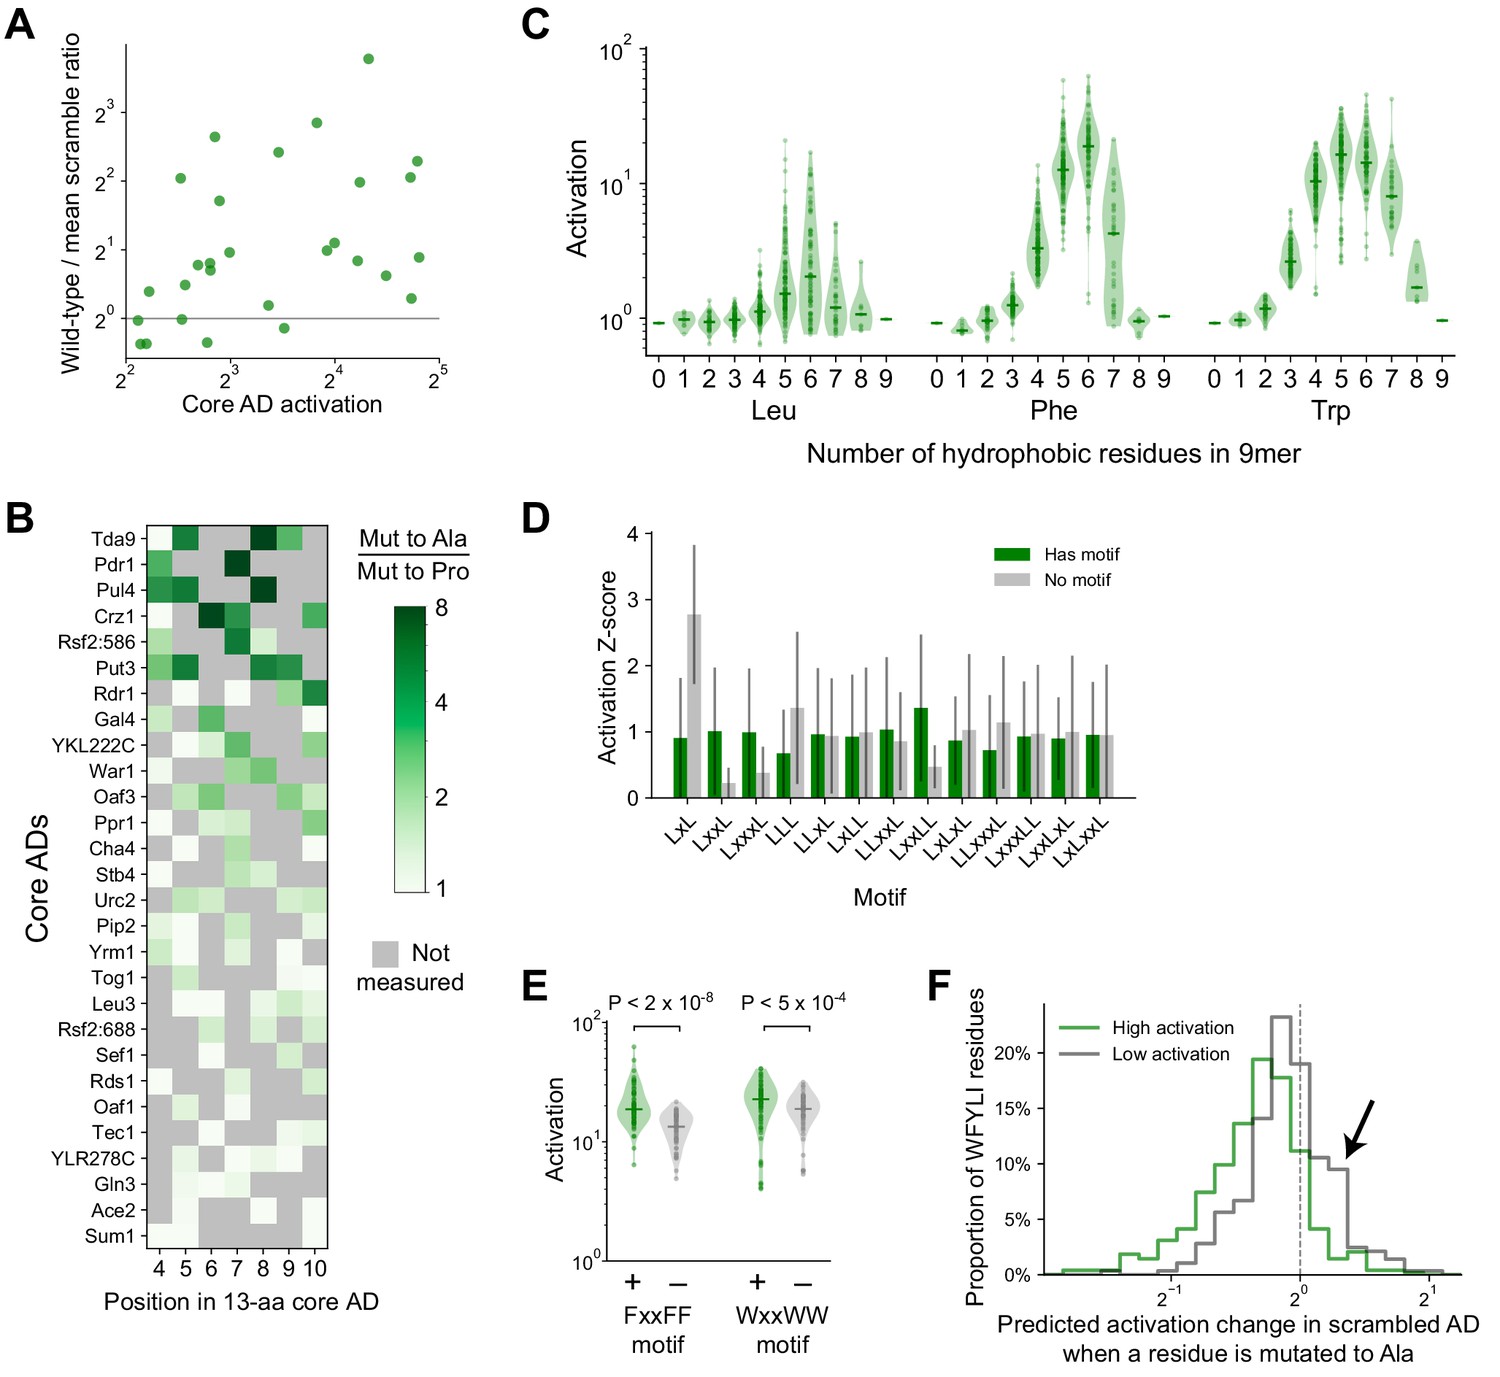
(A) The wild-type-to-scramble ratio of core ADs was not correlated with their wild-type activation strength (Pearson’s r = 0.32, p=0.09). Related to Figure 4A–B. (B) For each position assayed across all 28 core ADs, the amount that proline disrupts activation—namely the ratio in activation upon mutation to Ala versus to Pro—is plotted in color. Positions with hydrophobic residues were not measured and are marked in gray. The largest ratio observed across different positions is the value plotted for each core AD in Figure 4D. (C) Distribution of activation by all possible 9mers consisting entirely of only two amino acids each—Asp and either Leu, Phe, or Trp—grouped by the number and identity of the hydrophobic residue (i.e. the amino acid composition). Related to Figure 4E–F. (D) Within 9mers containing five Leu residues, the mean and standard deviation activation Z-scores of 9mers with (green) and without (gray) each short motif is plotted. For each motif, p-values were calculated with Kolmogorov-Smirnov test. The LxxLL motif was significant at p=3.2E-9; the next most significant was LxxL at p=0.0015. Related to Figure 4G. (E) Within 9mers containing five Phe or five Trp residues, FxxFF and WxxWW motifs were also significant at p=1.9E-8 and p=4.8E-4, respectively. Related to Figure 4G. (F) For scramble mutants of the 53-aa ADs (Figure 3A) that activated strongly (p<0.0001, green) or weakly (gray), we used PADDLE to predict the change in activation upon mutating each individual bulky hydrophobic residue (WFYLI) to Ala. A histogram of these changes is plotted. Weakly-activating scramble mutants have more bulky hydrophobic residues that increase activation when mutated (arrow). Related to Figure 4I–J.
Figure 5 with 1 supplement
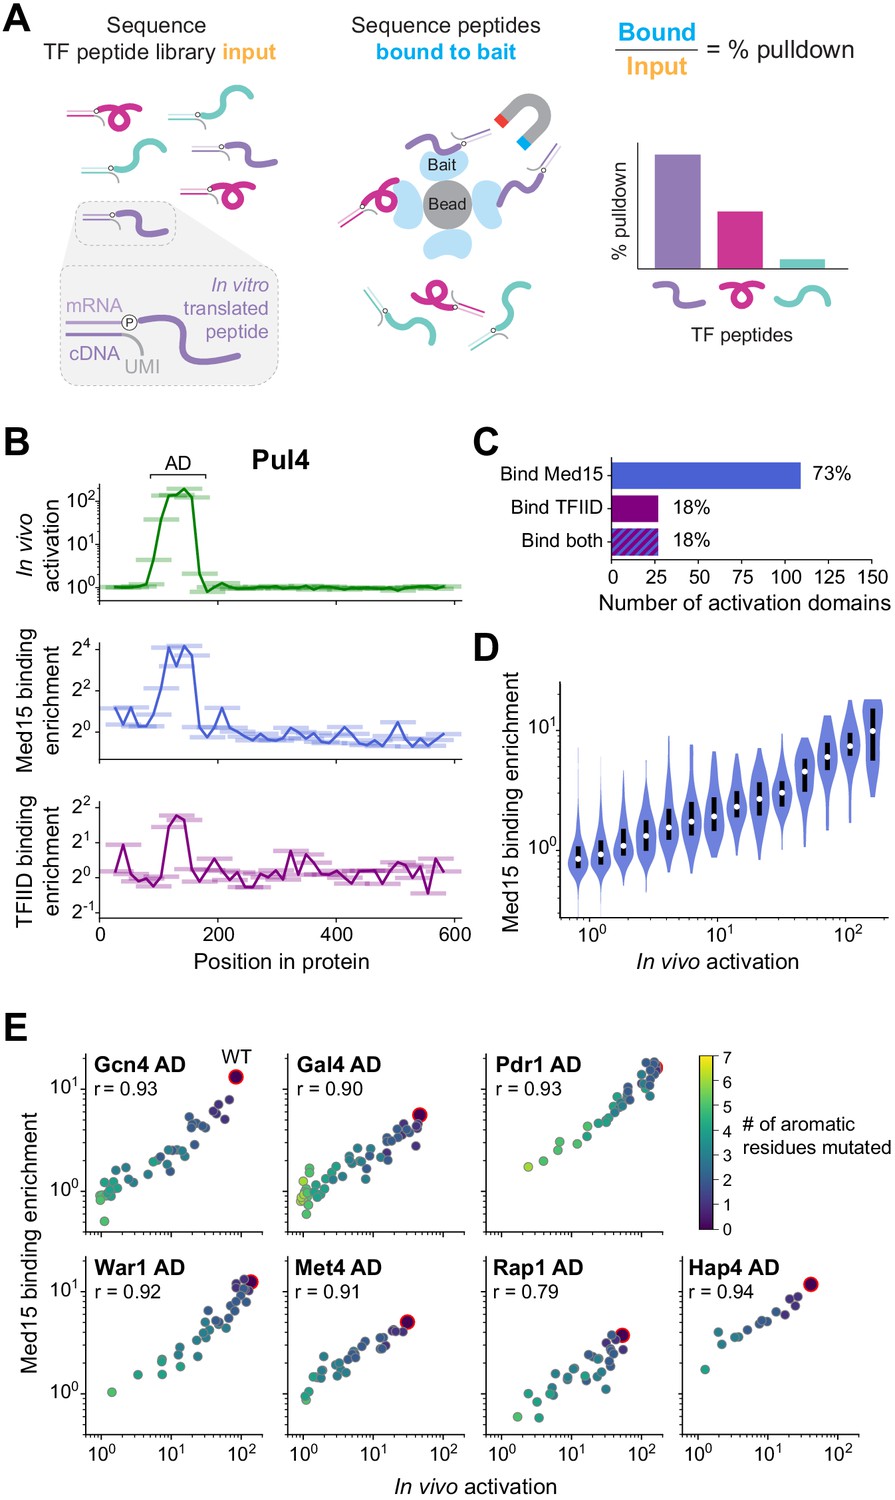
The large majority of activation domains bind Mediator, and its recruitment is a key driver for activation.
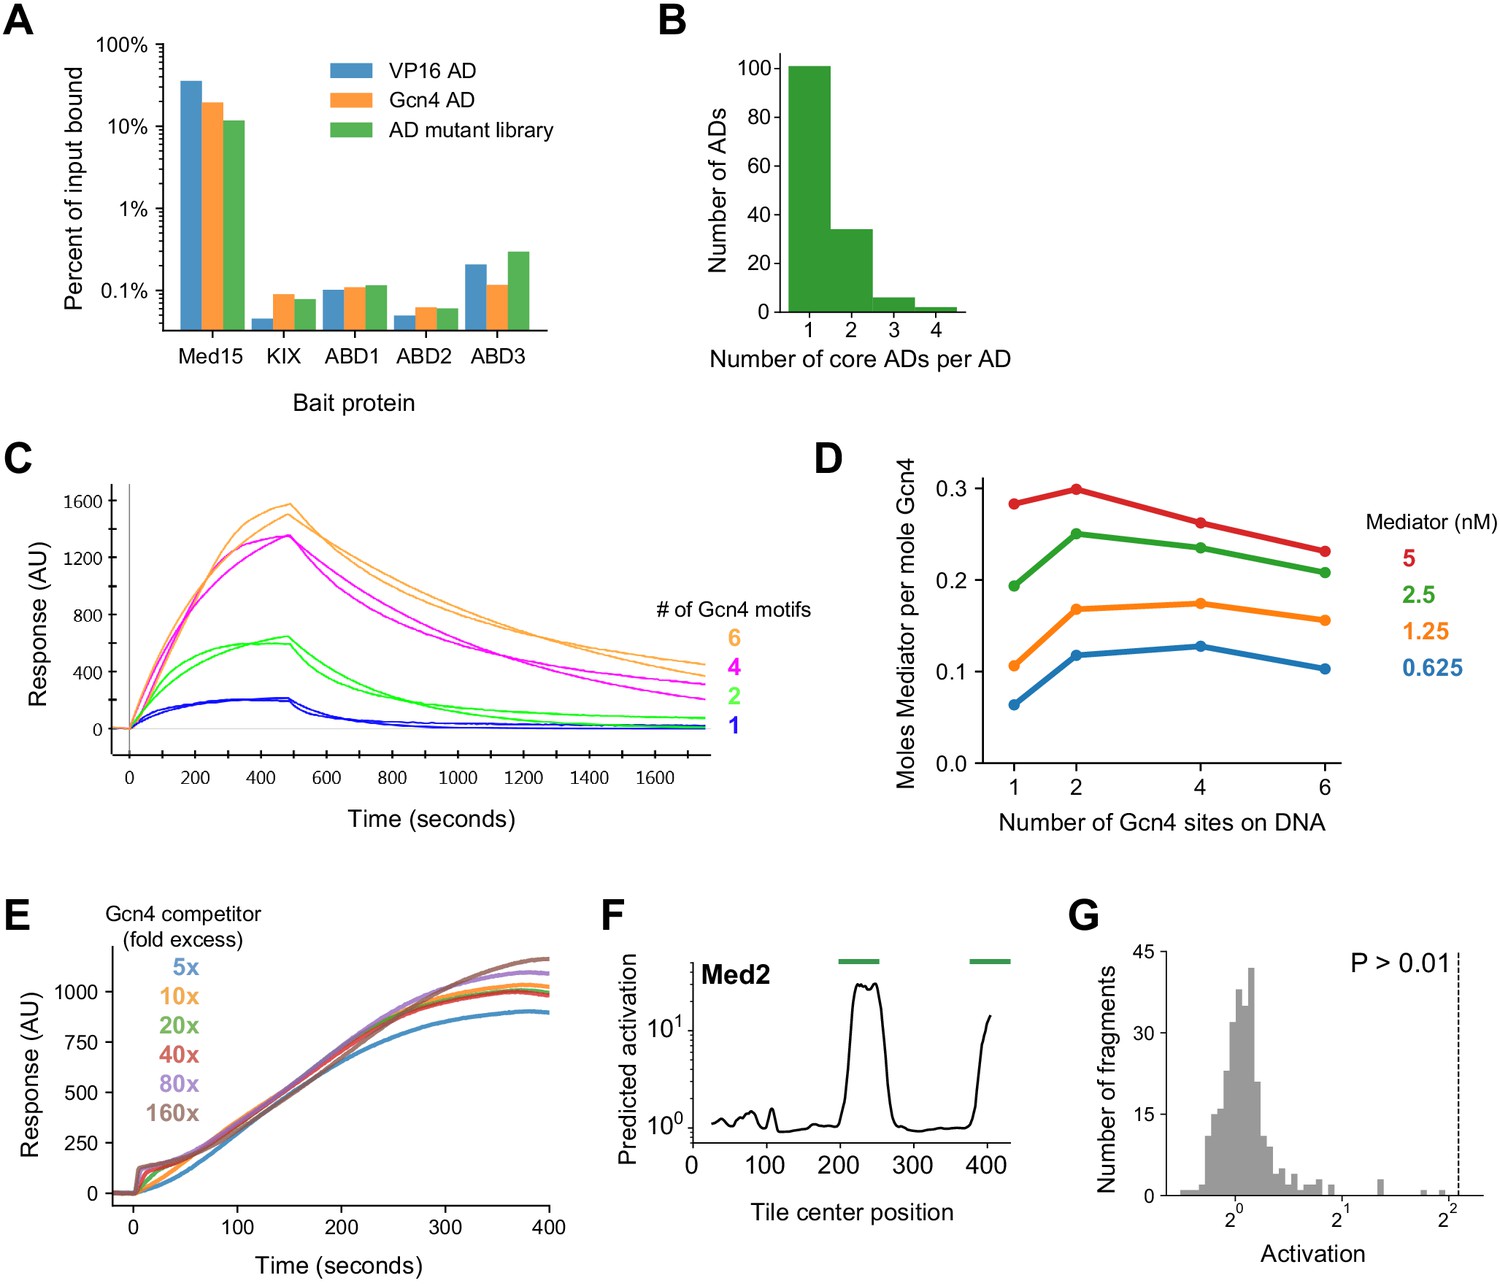
(A) To measure binding in high-throughput, we used mRNA display, expressing our library of TF tiles as a pool of protein fragments covalently tagged with their mRNA sequences (left), and using this pool in pull-down experiments (middle). Direct counts of bound and input protein molecules were obtained by amplifying and sequencing their mRNA tags and using unique molecular identifiers (UMIs) to remove PCR duplicates. Finally, the fractional pull-down of each protein fragment was computed by its relative abundance in the bound sample versus input, normalized to total library concentrations measured by qPCR (right). (B) For all tiles spanning Pul4, in vivo activation (green), in vitro Med15 binding enrichment (blue), and in vitro TFIID subcomplex binding enrichment (purple) are plotted. Tiles, 53 aa long, are shown as horizontal bars with a line traced through their centers for clarity. The Pul4 AD binds both Med15 and TFIID. Binding enrichments of all tiles are in Figure 5—source data 1. (C) Number and percentage of ADs that bound Med15, TFIID subcomplex, or both in pull-down experiments. ADs and Med15-binding domains overlapped substantially. All ADs that bound TFIID also bound Med15. See also Figure 5—figure supplement 1K and Figure 5—source data 1. (D) Violin plot of tiles' Med15 binding enrichment, grouped by their in vivo activation. A white dot labels the median of each bin and a black bar marks the 25th to 75th percentile interval. See also Figure 5—figure supplement 1F. (E) We measured Med15 binding of the set of AD mutants in which aromatic residues were systematically removed (Figure 2D). Med15 binding and activation are plotted with wild-type sequences outlined in red, the number of mutated residues shown in color, and Pearson’s r values displayed.
-
Figure 5—source data 1
Data from pull-down assays and list of Med15-binding domains.
- https://cdn.elifesciences.org/articles/68068/elife-68068-fig5-data1-v3.xlsx
Figure 5—figure supplement 1
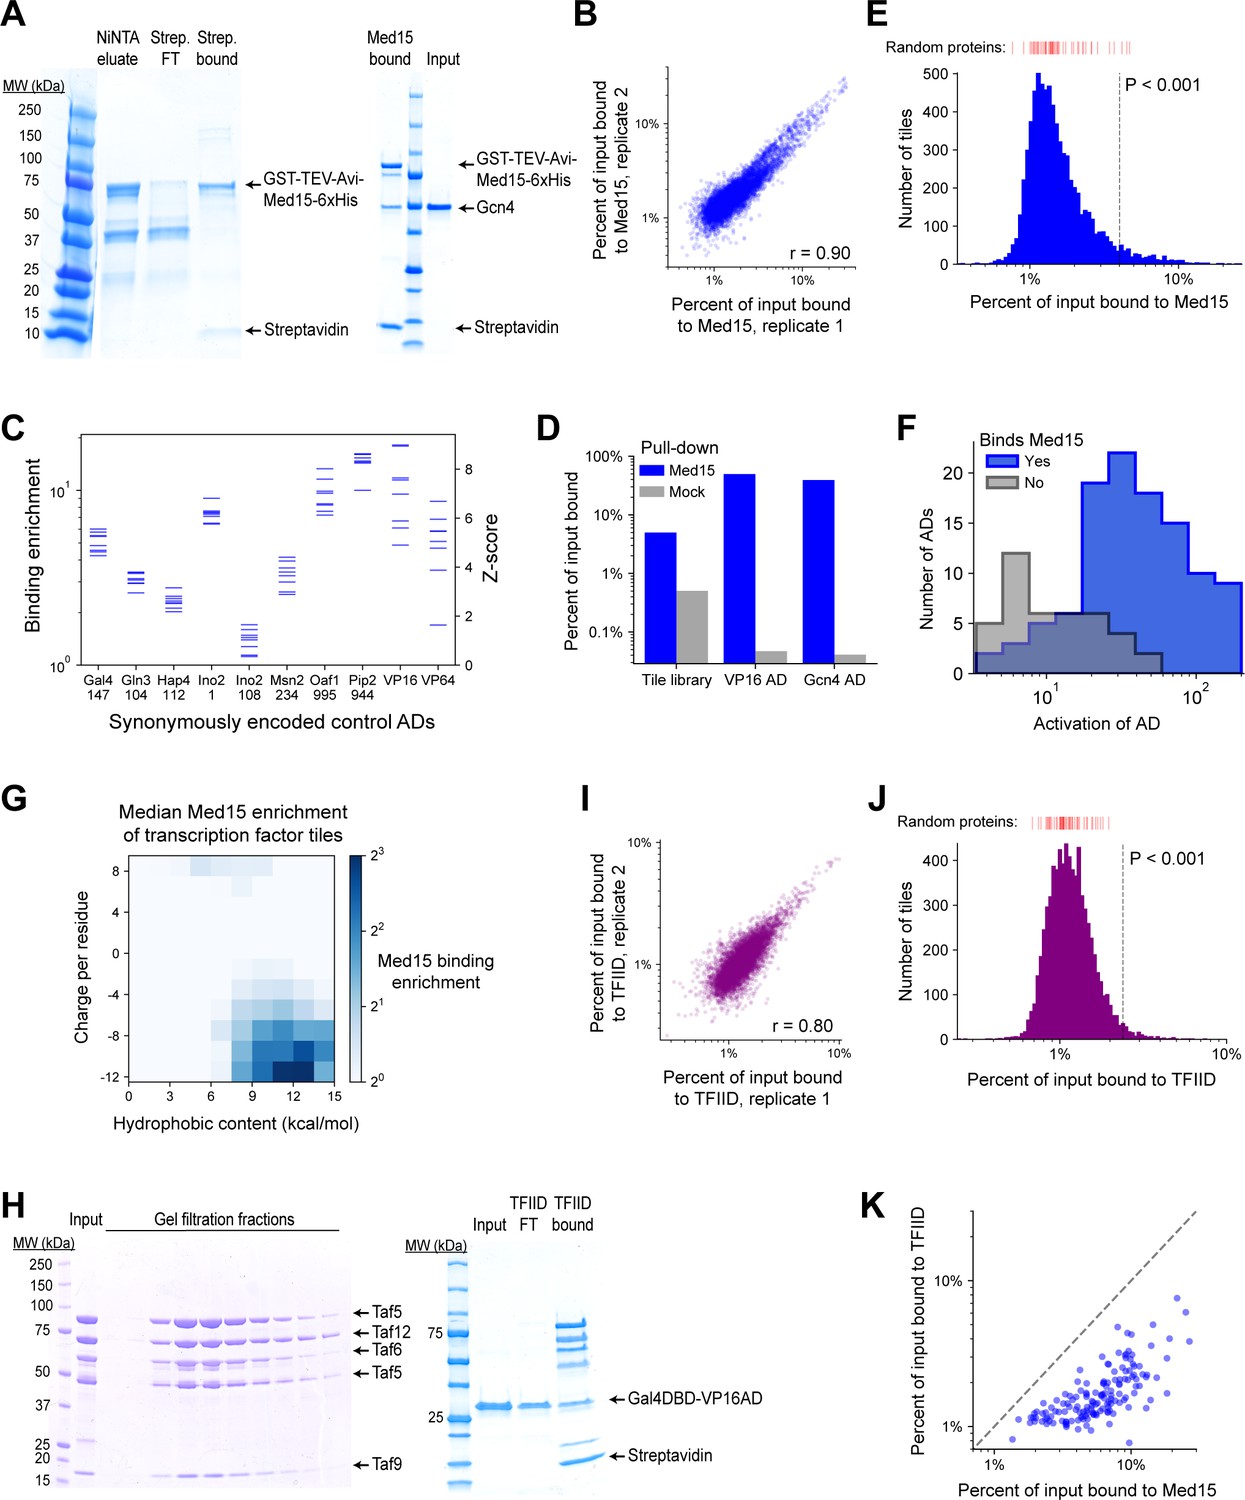
Methodology, validation, and summary statistics for Med15 and TFIID subcomplex pull-down screens.
(A) (Left) A 4–20% polyacrylamide gel showing in vivo biotinylated GST-TEV-Avi-Med15K123-6xHis protein (denoted Med15) eluted from NiNTA resin (lane 2), and the flow-through (lane 3) and bound beads (lane 4) after incubation with Dynabeads MyOne Streptavidin T1 magnetic beads. Med15-bound beads prepared in this way were used for pull-down experiments. (Right) Gcn4 binds Med15 in vitro. Med15-bound beads were incubated with 2 ug Gcn4 input (lane 3) for 15 min in 20 mM Tris pH 8.0, 100 mM KCl, 1 mM MgCl2, 0.01% Tween-20, 1 mM DTT and washed twice for 5 min each. Bead-bound protein, eluted with SDS and loaded onto this 4–20% polyacrylamide gel, is shown in lane 1. (B) Med15 binding by all TF tiles in two replicate pull-down experiments (Pearson’s r = 0.90). (C) Med15 binding and corresponding Z-scores measured for 10 positive control ADs that were each encoded by eight different synonymous DNA sequences. Horizontal axis labels show the protein and start position of each 53-aa AD. (D) Percent of input bound to Med15-bound beads (blue) or beads alone ('mock', gray) for mRNA-tagged and pooled protein fragments of VP16 AD, Gcn4 AD, and the TF tiling library. Binding is tracked by qPCR of cDNA tags with primers specific to VP16 and Gcn4 AD sequences or amplifying all TF tiles. (E) Histogram of Med15 binding for all TF tiles. Binding of 50 random protein sequence controls are marked above in red bars. Vertical dashed line shows the cutoff for p<0.001. Related to Figure 5B. (F) Histograms of AD activation strength for ADs that bind (blue) or do not bind (gray) Med15. ADs that do not bind Med15 tend to activate more weakly. Related to Figure 5C–D. (G) TF tiles are binned by their charge and hydrophobic content per residue and the median Med15 binding enrichment of each bin is displayed in color. Analogous to Figure 2A, which shows in vivo activation. (H) (Left) IgG-purified TFIID subcomplex (Taf4/12/5/6/9; 'input') and fractions resulting from gel filtration with a Superose 6 Increase column. (Right) VP16AD binds TFIID subcomplex in vitro. TFIID subcomplex-bound streptavidin beads were incubated with 2 µg Gal4DBD-VP16AD input (lane 2) for 15 min in 20 mM Tris pH 8.0, 100 mM KCl, 10 mM MgCl2, 0.01% Tween-20, 1 mM DTT, and the flow-through was collected (lane 3). After a brief wash, bead-bound protein was eluted with SDS (lane 4). (I) TFIID subcomplex binding by all TF tiles in two replicate pull-down experiments (Pearson’s r = 0.80). (J) Histogram of TFIID subcomplex binding for all TF tiles. Binding of 50 random protein sequence controls are marked above in red bars. Vertical dashed line shows the cutoff for p<0.001. Related to Figure 5B. (K) For each AD, the maximal Med15-binding of all overlapping tiles is plotted against the maximal TFIID subcomplex-binding of all overlapping tiles. (At least 26 aa of overlap is required.) Binding values are percent of input. The dashed line shows equality.
Figure 6 with 1 supplement
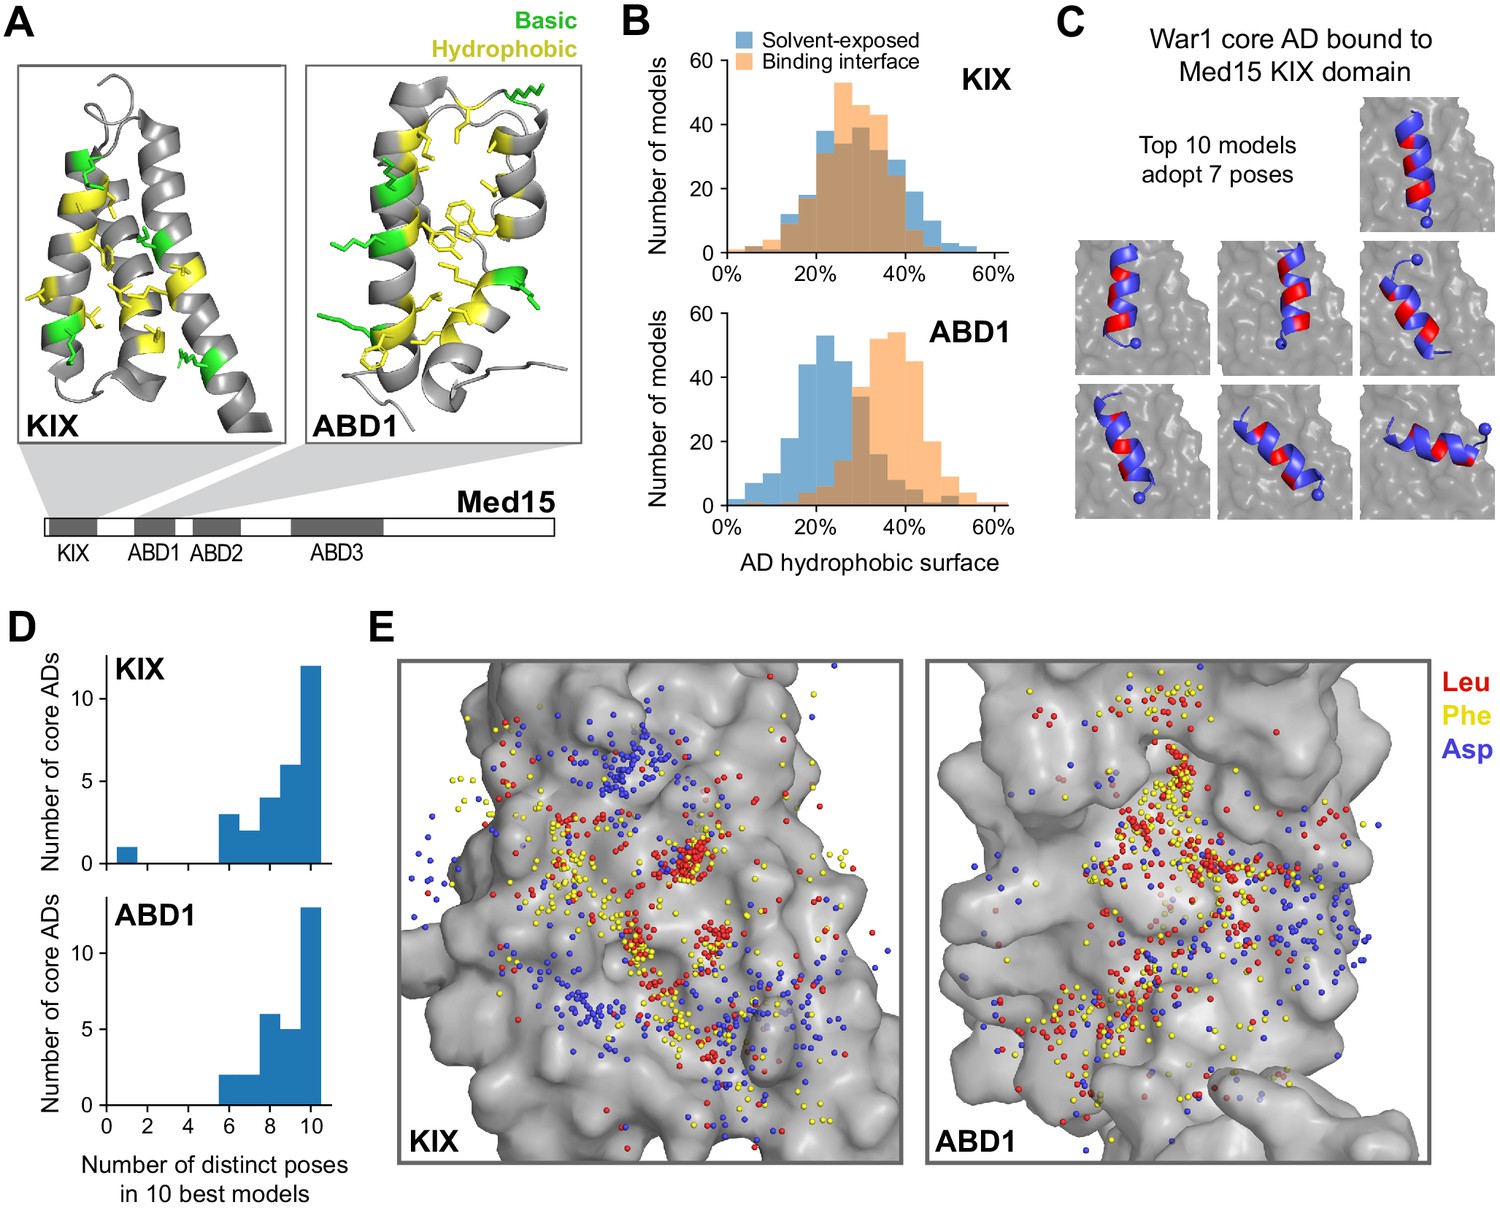
Med15 uses a shape-agnostic, fuzzy interface to bind diverse activation domain sequences.
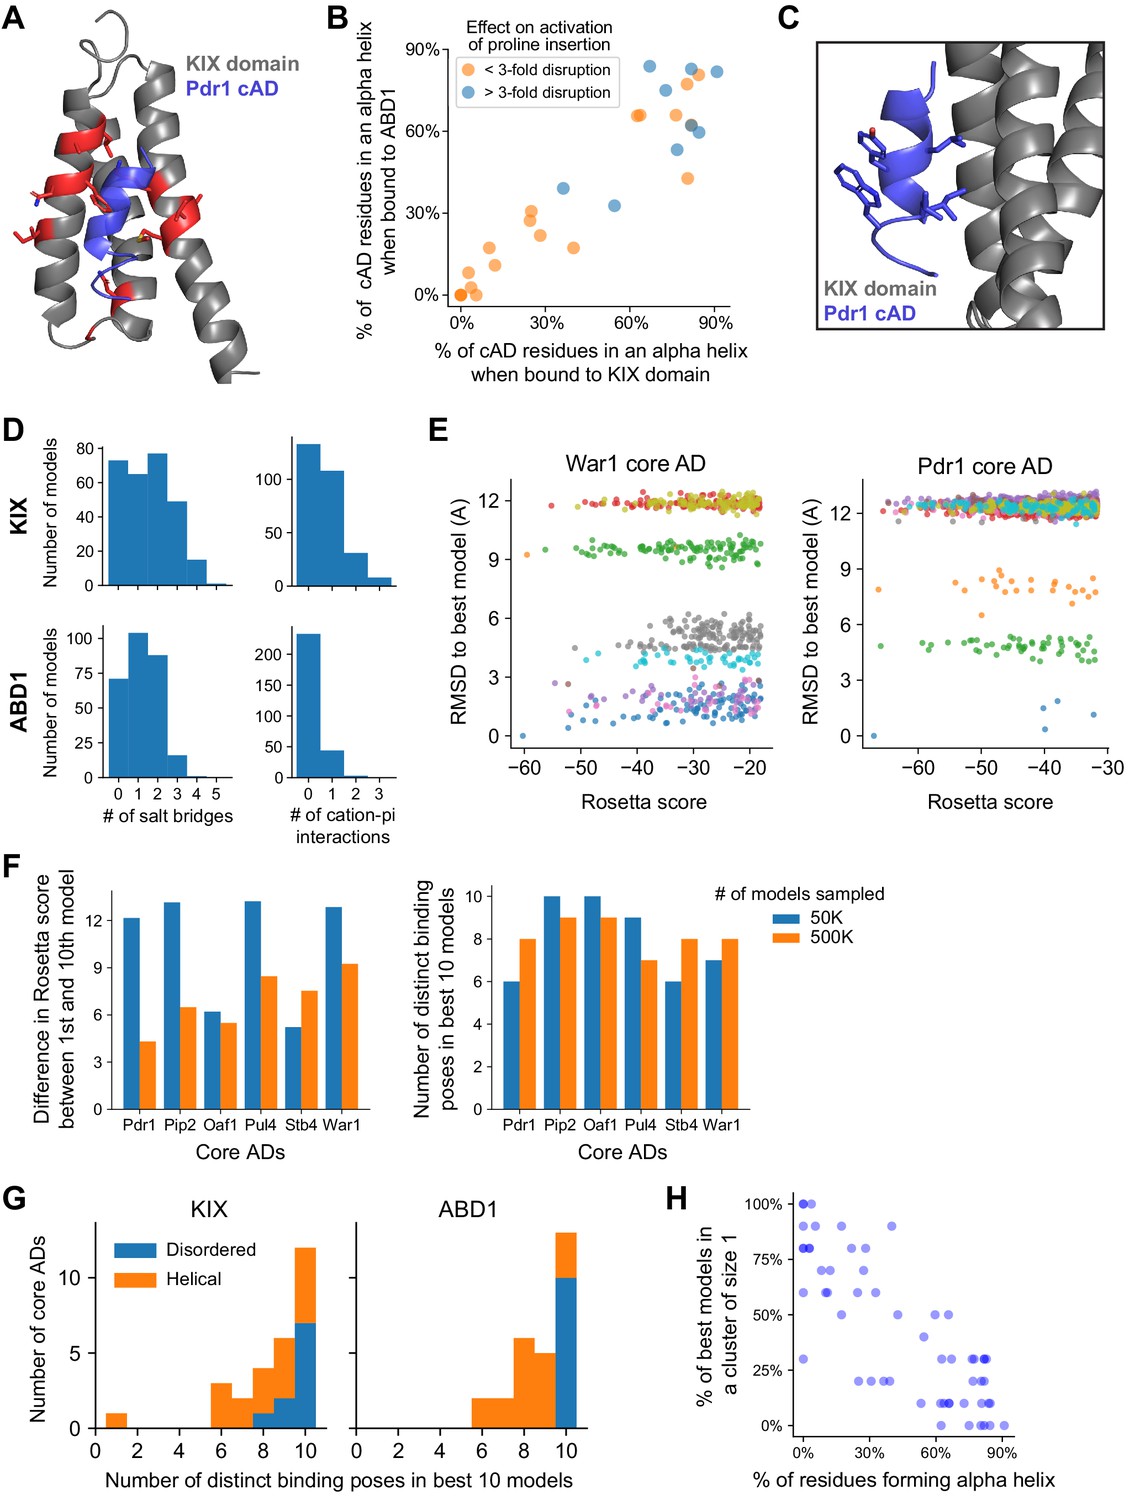
(A) We used a Rosetta peptide docking algorithm (Raveh et al., 2011) to build structural models of the 28 13-aa core ADs (cADs) described above (Figure 4A–D) interacting with two activator-binding domains (ABDs) of Med15, the KIX domain and ABD1. Structures of these domains are shown, with the hydrophobic (yellow) and basic (green) residues that form the AD-binding surfaces displayed (Thakur et al., 2008; Herbig et al., 2010). For each interaction, 50,000 candidate structural models were sampled and ranked by the Rosetta energy score, and the 10 best-scoring models from each interaction were used in subsequent analyses (Figure 6—source data 1 and Figure 6—source data 2). See also Figure 6—figure supplement 1A. (B) Histograms summarizing the structural features of the 10 best-scoring models of all cADs bound to the KIX domain and ABD1. The horizontal axis denotes the percentages of the total hydrophobic surface of cAD residues that is solvent-exposed (blue) or at the binding interface (orange). See also Figure 6—figure supplement 1D. (C) The 10 best-scoring models of the War1 cAD (blue) bound the KIX domain (gray surface) with its helix axis at different orientations and with different helical faces presented toward the interaction surface, in seven distinct poses in total. For orientation, the cAD N-terminus is shown as a sphere and one helical face is colored red. See also Figure 6—figure supplement 1E. (D) Distinct binding poses were defined by clustering similar structures based on cAD backbone root mean square distance, and the number of poses seen in the 10 best-scoring models was counted for cAD interactions with the KIX domain and ABD1. See also Figure 6—figure supplement 1E–G. (E) Sidechain locations of all Leu (red), Phe (yellow), and Asp (blue) residues of all cADs interacting with the KIX and ABD1 surfaces (gray) are marked by dots. Leu and Phe distributions were similar to each other: there was no binding pocket that selectively preferred one residue over the other, despite large differences in their size and shape.
-
Figure 6—source data 1
List of all Med15 ABD and core AD interactions modeled using FlexPepDock.
- https://cdn.elifesciences.org/articles/68068/elife-68068-fig6-data1-v3.xlsx
-
Figure 6—source data 2
Structural models of Med15 ABD and core AD interactions generated by FlexPepDock.
The 10 best-scoring models from different binding poses are provided as pdb files. Top500.txt contains the score, cluster number, and RMSD to best model for the 500 best-scoring models.
- https://cdn.elifesciences.org/articles/68068/elife-68068-fig6-data2-v3.zip
Figure 6—figure supplement 1
Validation and additional analysis for structural modeling of core AD interaction with Med15 ABDs.
(A) The best-scoring model of the Pdr1 cAD (blue) bound to the KIX domain (gray). KIX residues important for binding the Pdr1 AD are shown in red (Thakur et al., 2008). The cAD contacts the hydrophobic surface formed by KIX residues F52, V76, and M77 and forms a salt bridge with K73. (B) The percentage of cAD residues that form an alpha helix in the 10 best-scoring models when bound to the KIX domain or ABD1. cADs that were more than threefold disrupted by mutations to proline (Figure 4C) are colored blue. (C) The interaction from Panel A shown from the side. cAD residues L5, I8, and L9 contact the KIX hydrophobic surface but Y6 and W10 are left exposed to solvent. Related to Figure 6B. (D) Histograms summarizing the number of salt bridges (left) or cation-pi interactions (right) formed between the 10 best-scoring models of all cADs bound to the KIX domain (top) or ABD1 (bottom). Related to Figure 6B. (E) From the best 5,000 out of 500,000 models sampled for the War1 and Pdr1 cADs interacting with the KIX domain, models from 10 clusters are shown, with each cluster in a unique color. Smaller (more negative) Rosetta scores are better, and the best model is the lower left point. The vertical spread shows the root mean squared distance (RMSD) between the best model and models from other clusters, in Angstroms. Related to Figure 6C. (F) For each of six cADs binding the KIX domain, a comparison of the 10 best models found when 50,000 (blue) or 500,000 (orange) models were sampled. (Left) Sampling ten-fold more models usually reduced the difference in Rosetta score between the 1st and 10th best models. (Right) Six or more distinct binding poses (clusters) were observed in the 10 best models even when 500,000 models were sampled. Related to Figure 6D. (G) cADs that bound KIX and ABD1 in disordered conformations (fewer than three helical residues on average, blue) showed especially high diversity of binding poses. Same as in Figure 6D, but colored by cAD secondary structure and shown as a stacked histogram. (H) In cADs that had few helical residues when binding KIX or ABD1, most of the 10 best models were the only one their own cluster; that is, those binding poses were sampled only once.
Figure 7 with 1 supplement
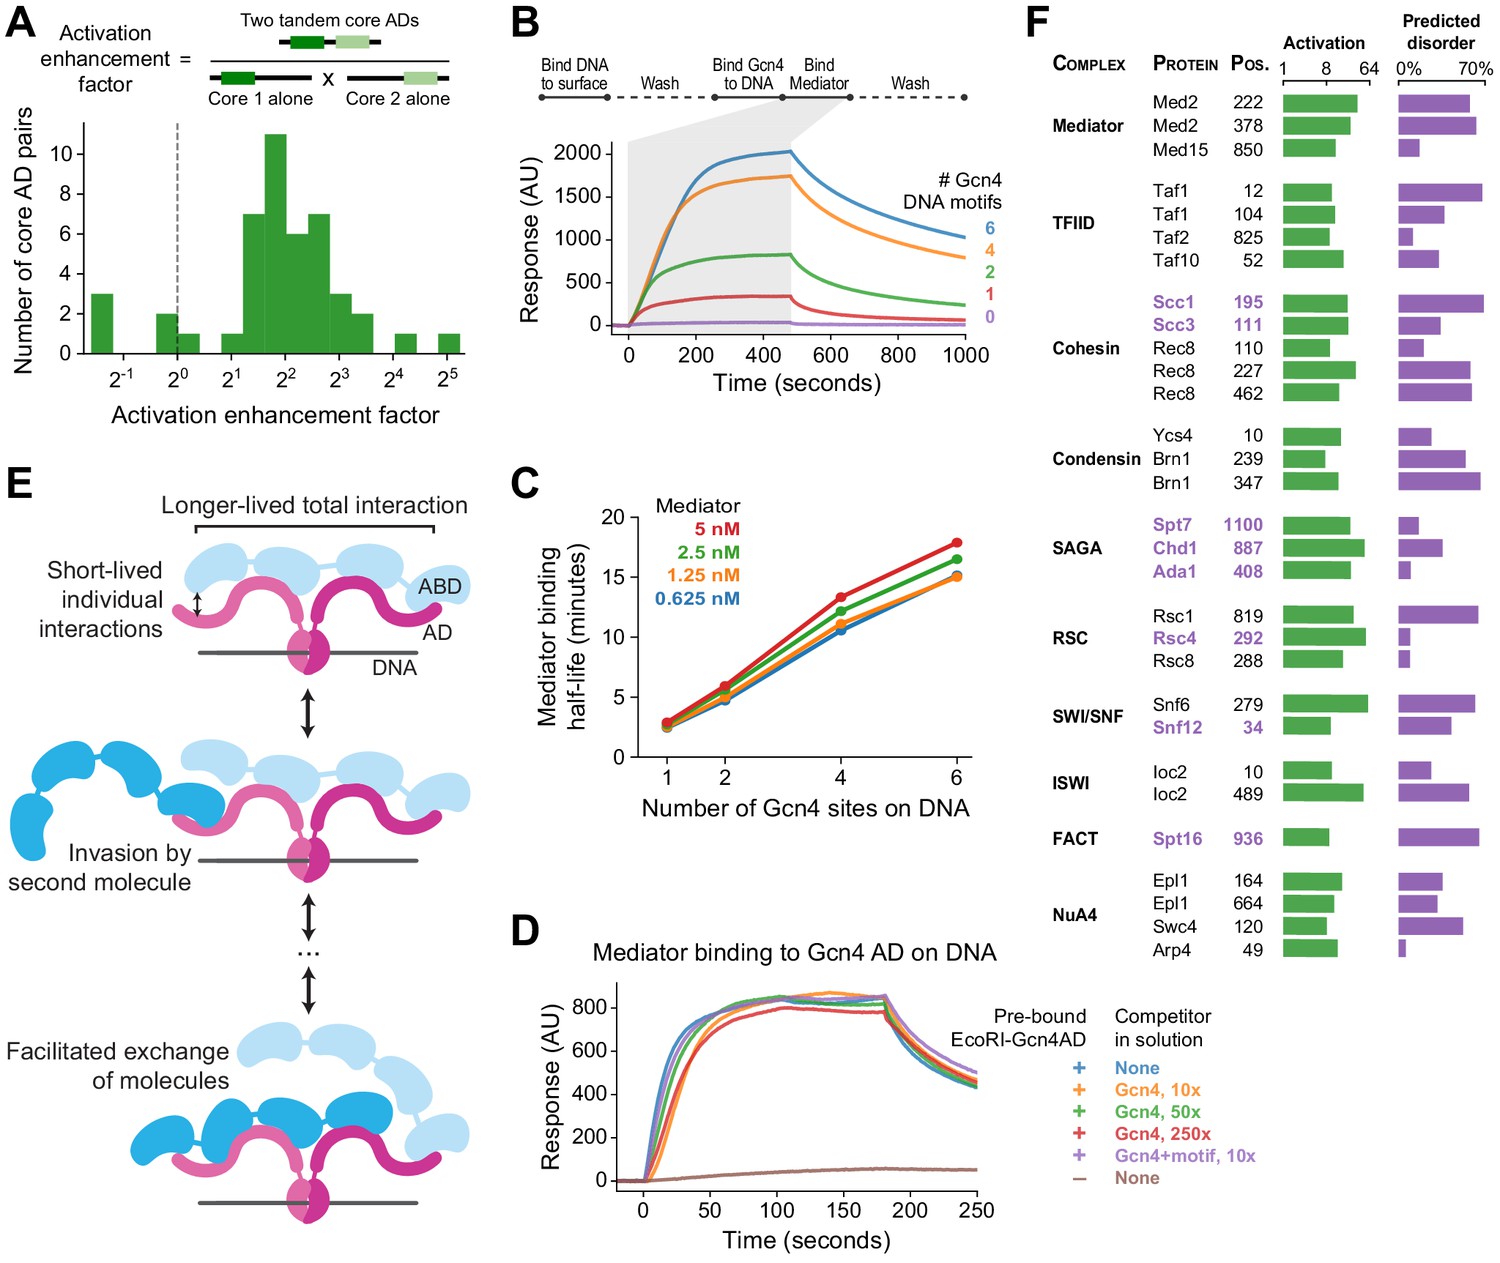
Functional consequences of high valence coactivator interactions.
(A) We took 47 pairs of adjacent cADs and measured their activation enhancement factors—the activation of both cADs in tandem divided by the product of activation by each cAD individually. For 40 pairs, activation was enhanced when cADs were in tandem, with a median enhancement factor of 4.0-fold. (B) Kinetics of Mediator complex recruitment to DNA by Gcn4. (Top) We coupled DNA containing a Gcn4 motif to a NeutrAvidin-coated surface, added Gcn4, and measured real-time binding of Mediator by surface plasmon resonance. The Mediator-binding step also included 7.5 nM Gcn4 to maintain DNA-bound Gcn4. (Bottom) Real-time binding of 2.5 nM Mediator to Gcn4-DNA complexes (0 to 480 seconds) and subsequent dissociation (480 seconds onwards). DNA templates contained 0, 1, 2, 4, or 6 copies of the Gcn4 motif. AU, arbitrary units. (C) The interaction half-life of Mediator with Gcn4-DNA complexes was proportional to the number of Gcn4 motifs and independent of the concentration of Mediator used in the binding step. See also Figure 7—figure supplement 1C–D. (D) Gcn4 competition assay. We purified a fusion of the Gcn4 AD to nuclease deficient EcoRI(E111Q), which resides on DNA for several hours, bound it to DNA containing a single EcoRI site, and measured Mediator recruitment in the presence or absence of excess Gcn4 competitor. Mediator was at 5 nM in all six conditions. AU, arbitrary units. See also Figure 7—figure supplement 1E. (E) Model of Mediator-TF interaction that explains high-affinity but dynamic binding. Multiple weak, short-lived interactions between individual Mediator ABDs (blue) and TF ADs (maroon) together drive longer-lived high-affinity binding. However, rapid association-dissociation equilibrium of an AD allows a second Mediator molecule to interact with Mediator-bound TF, facilitating the dynamic exchange of one Mediator molecule by another. The same mechanism would allow exchange of one TF by another. (F) An activation screen of nuclear proteins identified ADs in all major coactivator and chromatin modifying complexes. Protein complex, protein name, and start position of the 53-aa AD is labeled, and experimentally measured activation (green) and fraction of residues predicted to be disordered (purple; in D2P2) is shown. ADs that are predominantly disordered or unresolved in PDB structures are displayed in purple text. Taf10 is also a subunit of SAGA and Arp4 is also part of the INO80 chromatin remodeling complex. See also Figure 7—figure supplement 1F–G and Figure 1—source data 1.
Figure 7—figure supplement 1
Additional data and analysis.
(A) Percent of input bound to Med15 or individual ABDs for mRNA-tagged and pooled protein fragments of VP16 AD, Gcn4 AD, and the AD mutant library (sub-library B). Binding was tracked by qPCR of cDNA tags with primers specific to VP16 and Gcn4 AD sequences or amplifying all AD mutants. Binding to each ABD alone was two orders of magnitude lower than to the four ABDs in tandem. (B) PADDLE identified 42 ADs (28%) that contained two or more non-overlapping predicted cADs. Related to Figure 7A. (C) Mediator at 1.25 nM binding to and dissociating from Gcn4-DNA complexes in surface plasmon resonance (SPR) experiments, fit to a Langmuir kinetic model. DNA templates had 1, 2, 4, or 6 Gcn4 motifs. Related to Figure 7B–C. (D) Mediator is recruited more efficiently by Gcn4 on DNA templates with 2 or 4 Gcn4 motifs. The molar ratio of Mediator and Gcn4 bound at equilibrium was determined from their SPR response (in arbitrary units) normalized by their relative mass. Related to Figure 7B–C. (E) Gcn4 competition assay. Binding of 1 nM Mediator to Gcn4-DNA complexes on the surface was minimally affected by up to 160-fold molar excess of Gcn4 (160 nM). Gcn4 was pre-bound to DNA, which had two Gcn4 motifs, before the Mediator binding shown here. The small bump at the onset of binding corresponds to rapid, increased Gcn4 binding at high concentrations. Related to Figure 7D. (F) PADDLE predictions on 53-aa tiles spanning yeast Med2 identified two ADs, marked with green bars, which were tested experimentally. Related to Figure 7F. (G) Histogram of in vivo activation for 291 control tiles in yeast nuclear proteins that had extremely high acidic and hydrophobic content but were predicted by PADDLE to not activate. Specifically, these tiles cover all regions in nuclear proteins that have net charge of at most −8 and hydrophobic content of at least 10 kcal/mol (compare to Figure 2A–B) but predicted activation Z-score less than 0.5. Zero tiles activated significantly. Related to Figure 7F.
Tables
Key resources table
| Reagent type (species) or resource | Designation | Source or reference | Identifiers | Additional information |
|---|---|---|---|---|
| Cell line (S. cerevisiae) | BY4711 | ATCC | 200873 | MATalpha trp1delta63 |
| Cell line (human) | HEK293T | ATCC | CRL-3216 | |
| Sequence-based reagent | Oligo pool libraries | Twist Bioscience | Custom synthesis | Sequences provided in source data files |
| Recombinant DNA reagent | pMVS142-pACT1-mCherry-Zif268-EBD-MCS-KAN | Addgene | 99049 | Barak Cohen |
| Recombinant DNA reagent | pMVS102-P3-GFP-NATMX6 | Addgene | 99048 | Barak Cohen |
| Chemical compound, drug | Fetal bovine serum | Millipore | TMS-031-B | |
| Strain, strain background (Escherichia coli) | XL10 Gold Ultracompetent Cells | Agilent | 200315 | For cloning |
| Peptide, recombinant protein | Phusion polymerase | New England Biolabs | M0531L | |
| Commercial assay or kit | AMPure XP beads | Beckman Coulter | A63880 | |
| Recombinant DNA reagent | pFN26A BIND plasmid | Promega | E1380 | |
| Recombinant DNA reagent | pGL4.35 plasmid | Promega | E1370 | |
| Commercial assay or kit | Dual-Glo Luciferase assay | Promega | E2920 | |
| Recombinant DNA reagent | pBirAcm | Avidity | AVB99 | |
| Strain, strain background (Escherichia coli) | BL21 Star (DE3) competent cells | ThermoFisher | C601003 | For protein expression |
| Commercial assay or kit | Ni-NTA Suerflow resin | Qiagen | 30410 | |
| Recombinant DNA reagent | pFASTBac1 plasmid | ThermoFisher | 10360014 | |
| Commercial assay or kit | MEGAscript T7 transcription kit | ThermoFisher | AM1333 | |
| Peptide, recombinant protein | T4 DNA ligase | New England Biolabs | M0202S | |
| Other | Amicon Ultracel 0.5 mL 30K MWCO column | Millipore Sigma | UFC503024 | |
| Commercial assay or kit | Model 422 Electro-Eluter | Bio Rad | 1652976 | |
| Commercial assay or kit | Retic Lysate IVT Kit | ThermoFisher | AM1200 | |
| Sequence-based reagent | PF30P oligo | IDT | Custom synthesis | /5Phos/AA AAA AAA AAA AAA AAA AAA A/iSp9//iSp9//iSp9/AC C/3Puro/ |
| Peptide, recombinant protein | SuperScript II Reverse Transcriptase | ThermoFisher | 18064014 | |
| Commercial assay or kit | Dynabeads MyOne Streptavidin T1 | ThermoFisher | 65602 | |
| Sequence-based reagent | Salmon Sperm DNA | ThermoFisher | 15632011 | |
| Peptide, recombinant protein | BSA | New England Biolabs | B9000S | |
| Software, algorithm | PADDLE | This paper | github.com/asanborn/PADDLE |
Additional files
Download links
A two-part list of links to download the article, or parts of the article, in various formats.
Downloads (link to download the article as PDF)
Open citations (links to open the citations from this article in various online reference manager services)
Cite this article (links to download the citations from this article in formats compatible with various reference manager tools)
Simple biochemical features underlie transcriptional activation domain diversity and dynamic, fuzzy binding to Mediator
eLife 10:e68068.
https://doi.org/10.7554/eLife.68068


