Single-cell transcriptome analysis identifies a unique tumor cell type producing multiple hormones in ectopic ACTH and CRH secreting pheochromocytoma
- Department of Urology, Peking Union Medical College Hospital, Chinese Academy of Medical Sciences & Peking Union Medical College, China
- Institute of Basic Medical Sciences Chinese Academy of Medical Sciences, School of Basic Medicine Peking Union Medical College, China
- Department of Pathology, Peking Union Medical College Hospital, Chinese Academy of Medical Sciences & Peking Union Medical College, China
- Suzhou Institute of Systems Medicine, China
- Beijing Key Laboratory for Genetics of Birth Defects, Beijing Pediatric Research Institute, Beijing Children's Hospital, Capital Medical University, National Center for Children's Health, China
Figures
Figure 1
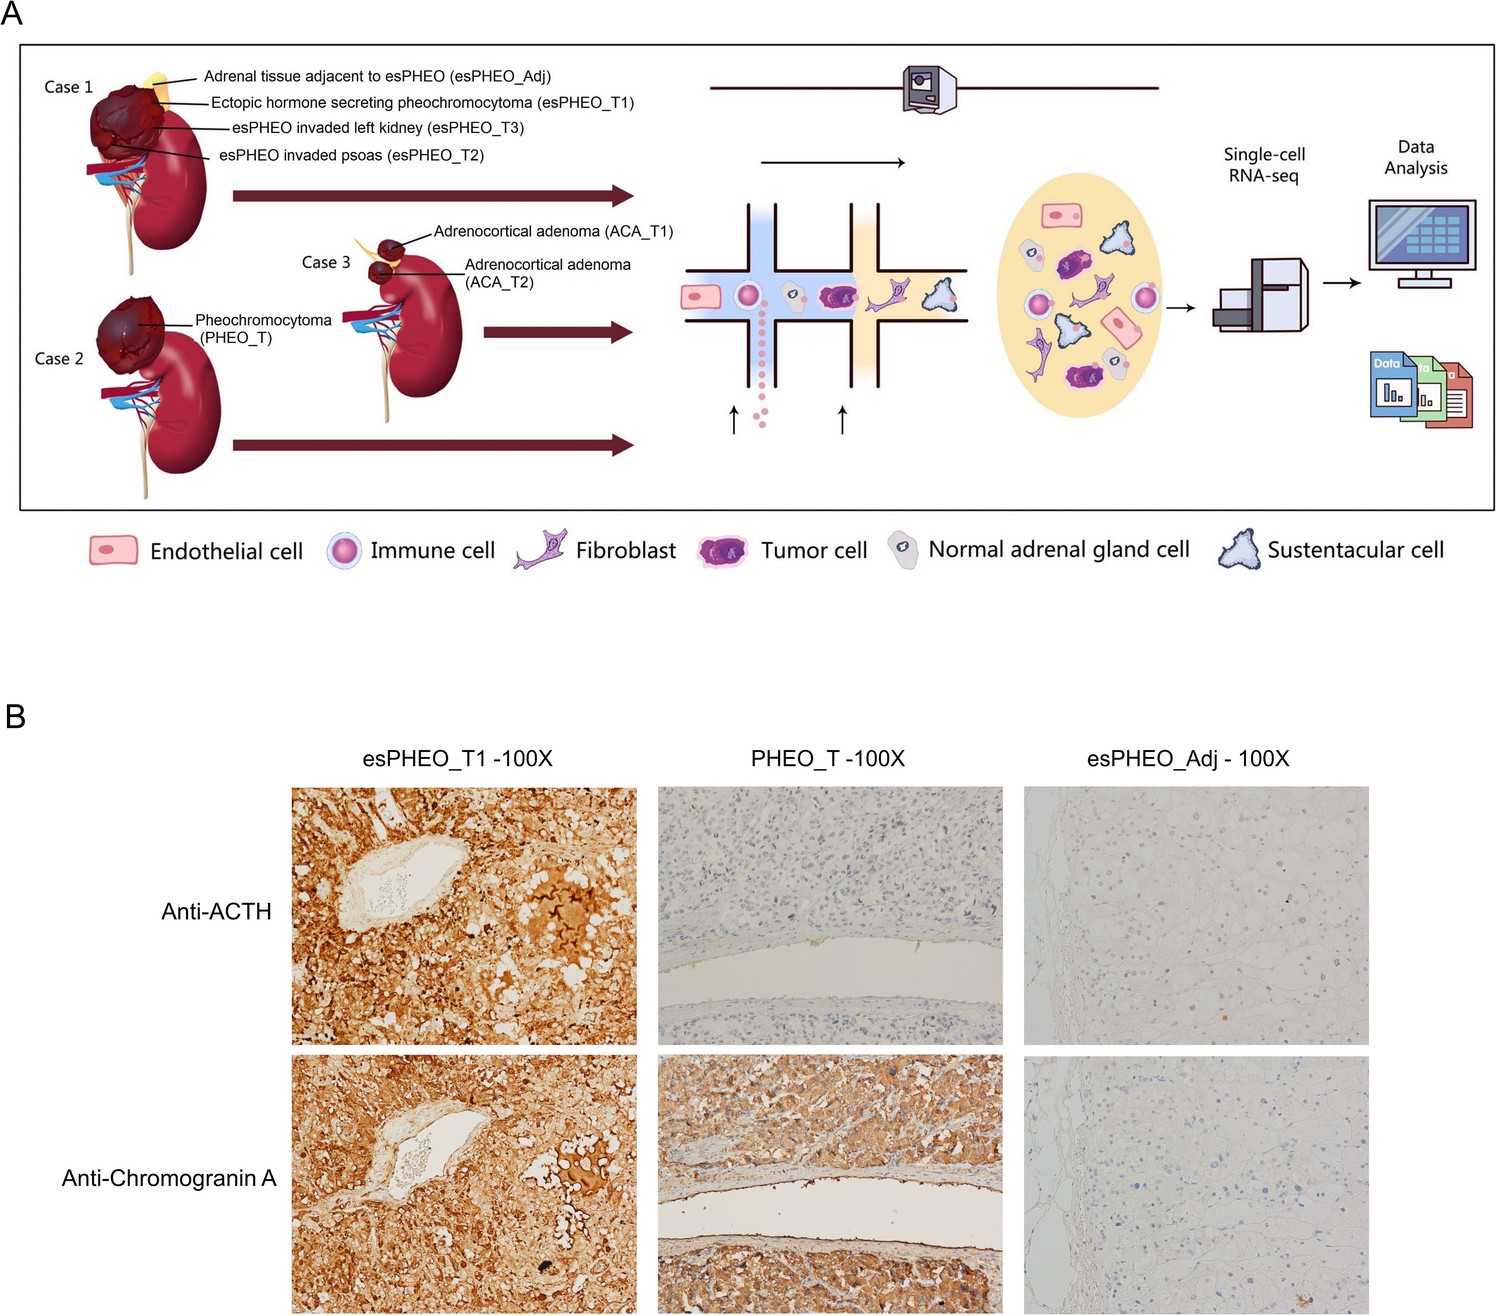
Clinical sample collection of adrenal tumor and adjacent specimen for scRNA-seq analysis.
(A) scRNA-seq workflow for three tumor specimens (esPHEO_T1, esPHEO_T2, and esPHEO_T3) and one adjacent specimen (esPHEO_Adj) from the rare pheochromocytoma with ectopic ACTH and CRH secretion (Case 1), 1 tumor specimen (PHEO_T) from common pheochromocytoma (Case 2), and two tumor specimens (ACA_T1, ACA_T2) from adrenocortical adenoma (Case 3). (B) Immunohistochemistry staining results of pheochromocytoma (esPHEO_T1 and PHEO_T) and adjacent specimen (esPHEO_Adj) with chromogranin A (CgA) and ACTH markers.
Figure 2
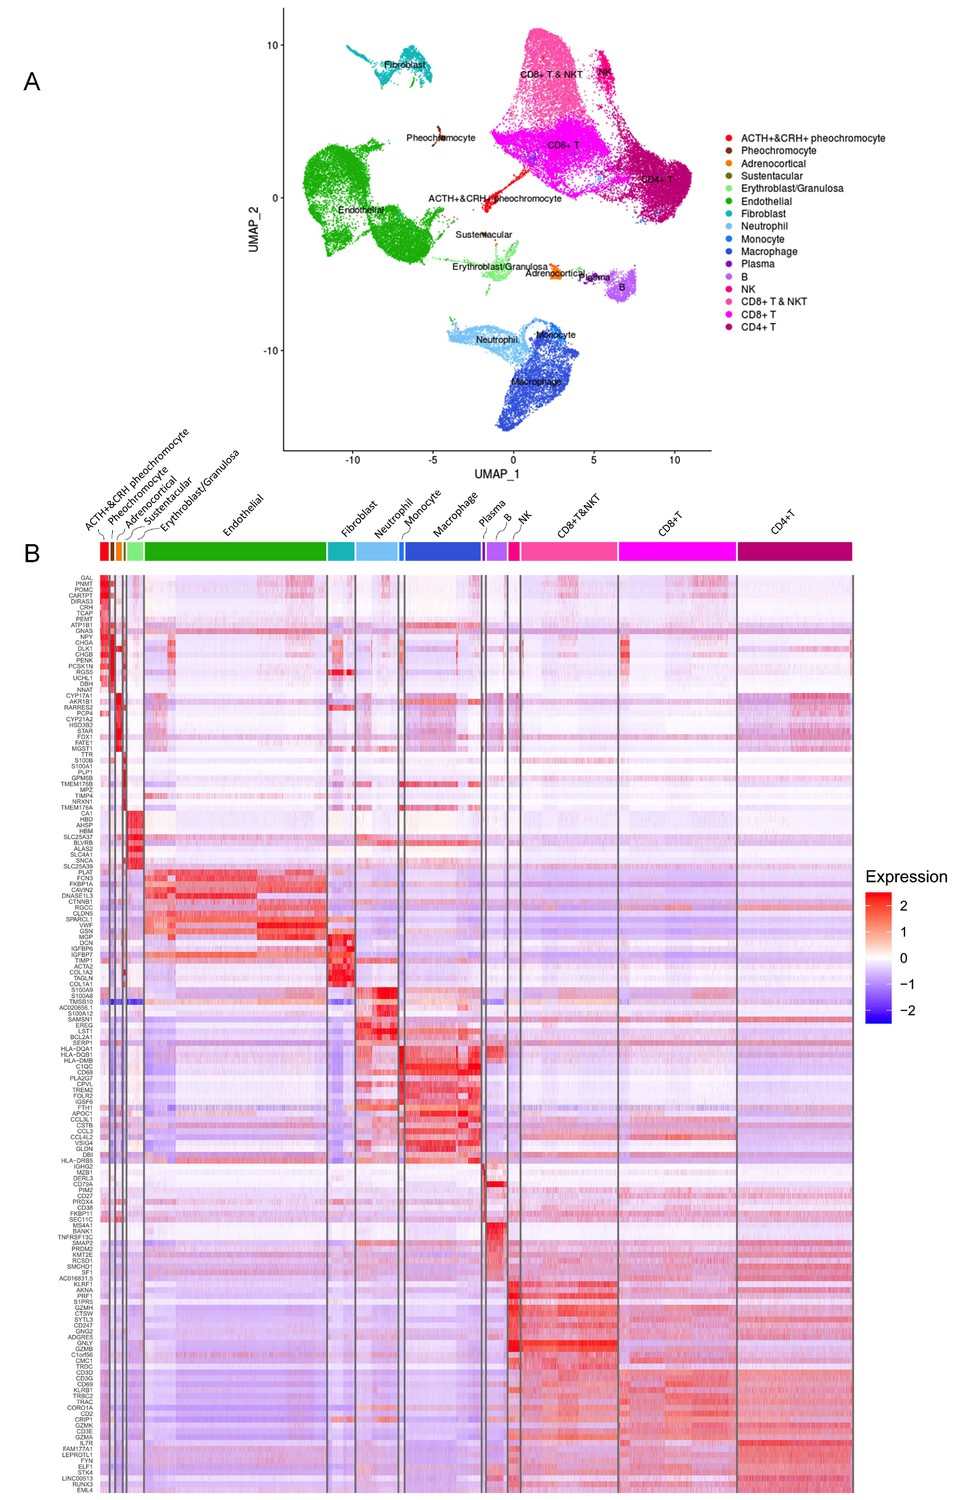
Different cell types and their highly expressed genes through single-cell transcriptomic analysis.
(A) The t-distributed stochastic neighbor embedding (t-SNE) plot shows 16 main cell types from all specimens. (B) Heatmap shows the scaled expression patterns of the top 10 marker genes in each cell type. The color keys from white to red indicate relative expression levels from low to high.
Figure 3
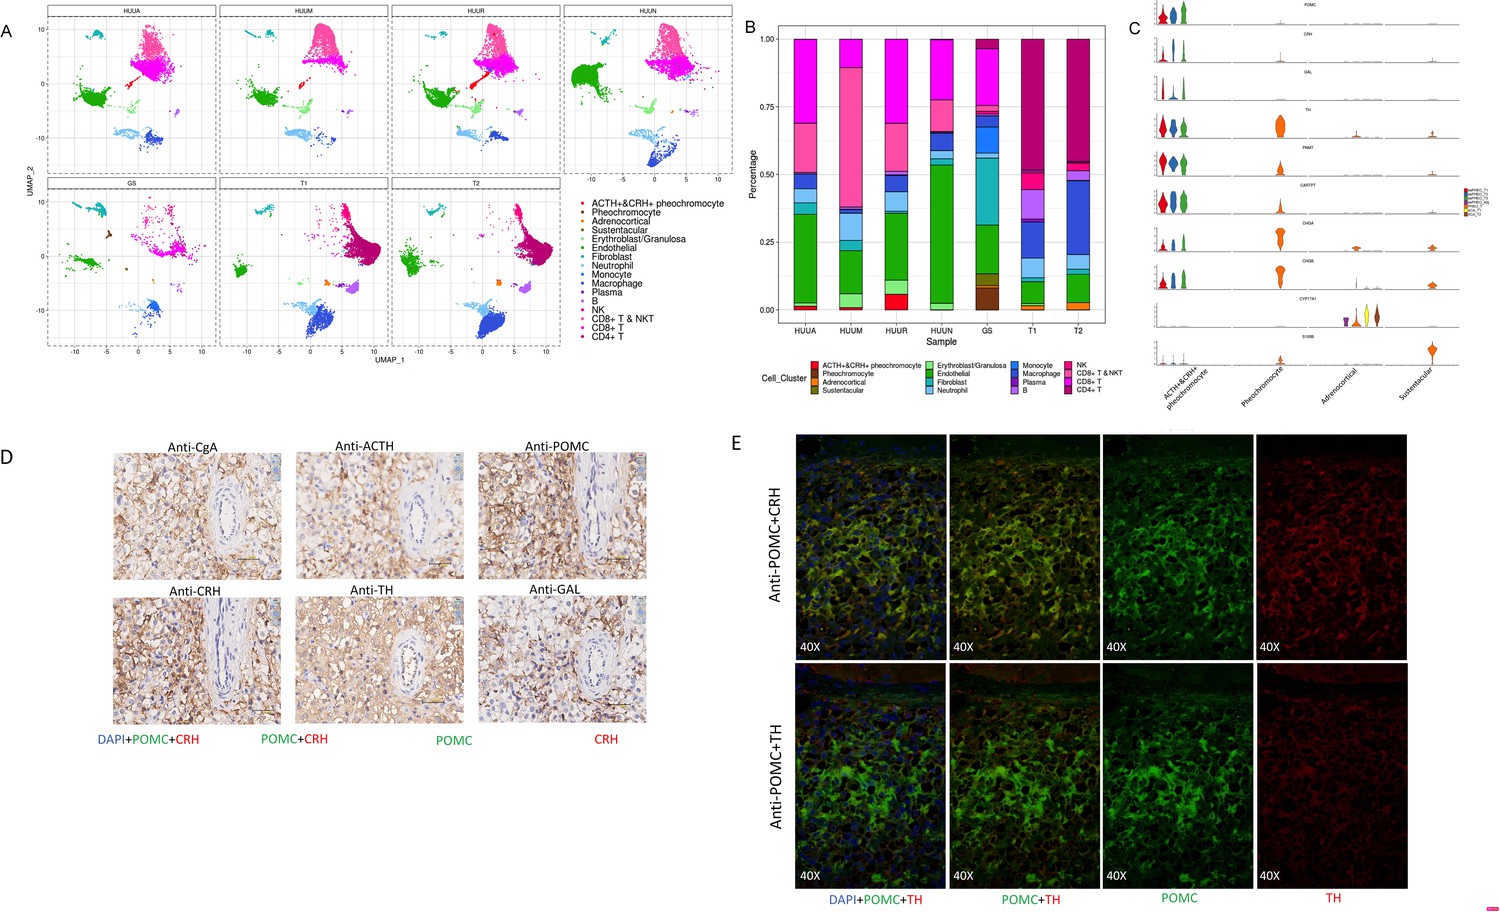
A unique tumor cell type was revealed by the composition analysis of cell types in each sample.
The results validated an ectopic ACTH and CRH secreting pheochromocytoma. (A) Cell clusters shown in UMAP map can be subdivided by different specimens. (B) Frequency distribution of cell types among different samples. (C) Violin plots showing the expression of representative well-known and potential new marker genes of the four subtypes of adrenal cell types. (D) Immunohistochemistry of CgA, ACTH, POMC, CRH, TH, or GAL on serial biopsies from tumor specimen esPHEO_T3. (E) Immunofluorescence co-staining for POMC&CRH and POMC&TH on two serial biopsies from tumor specimen esPHEO_T3. UMAP, Uniform Manifold Approximation and Projection.
Figure 4
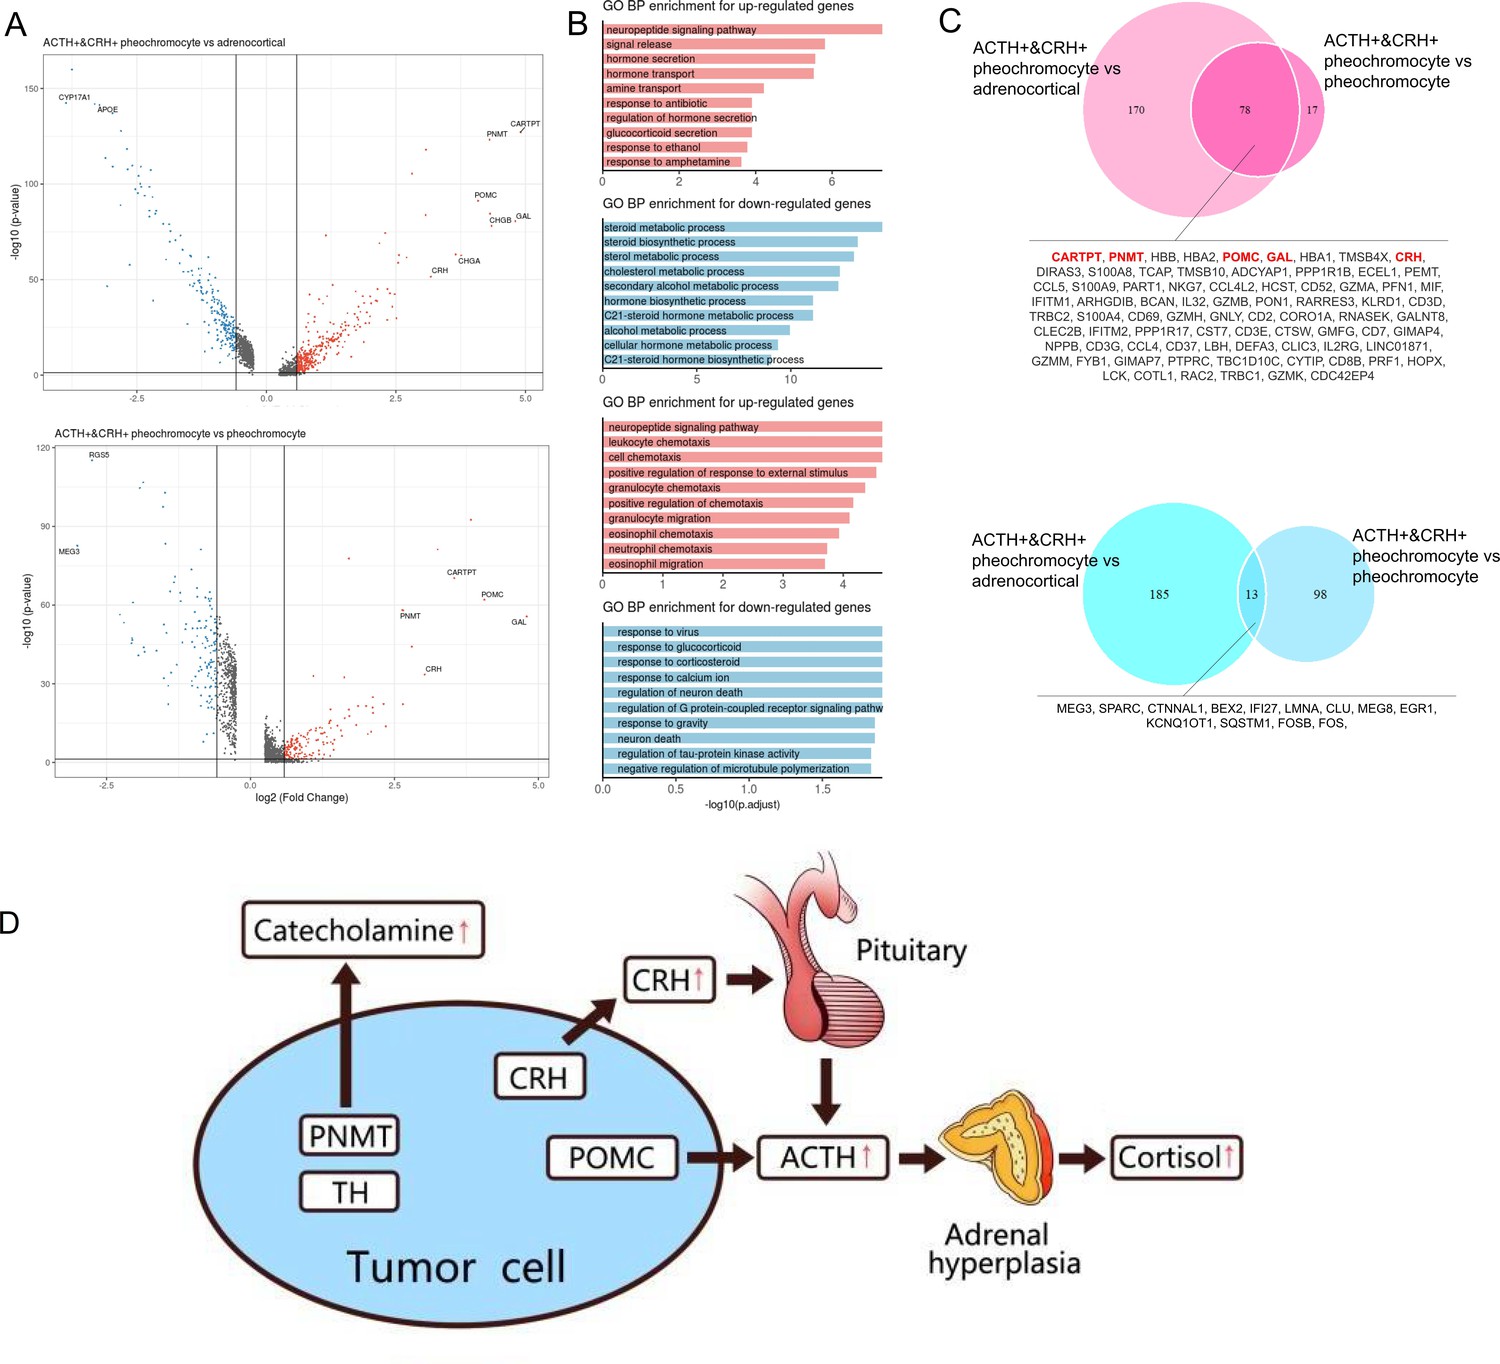
Altered functions in POMC+&CRH + pheochromocyte revealed by differential gene expression analysis.
(A) Volcano plot of changes in gene expression between POMC+&CRH + pheochromocytes and other adrenal cell types (pheochromocytes and adrenocortical cells). The x-axis specifies the natural logarithm of the fold-changes (FC) and the y-axis specifies the negative logarithm of the adjusted p-values at the base of 10. Gray vertical and horizontal lines reflect the filtering criteria. Red and blue dots represent the genes with significantly higher expression and lower expression, respectively. (B) Functional enrichment analysis of the upregulated or downregulated gene revealed the top altered terms in the biological process of gene ontology. The x-axis specifies the negative logarithm of the adjusted p-values at the base of 10. (C) Overlap of upregulated or downregulated genes in the two pairwise comparisons between adrenal cell types. The red font highlights the well-known and potential markers that have been identified. (D) The molecular mechanism of CS in the rare case of ectopic ACTH and CRH syndrome is associated with pheochromocytoma. The pheochromocytoma tumor of Case 1 is composed of a unique chromaffin-like cell type that directly expresses both ACTH and CRH; the expression of POMC directly causes the secretion of ACTH, and the expression of CRH indirectly promotes the secretion of ACTH hormone, which ultimately leads to CS.
Figure 5
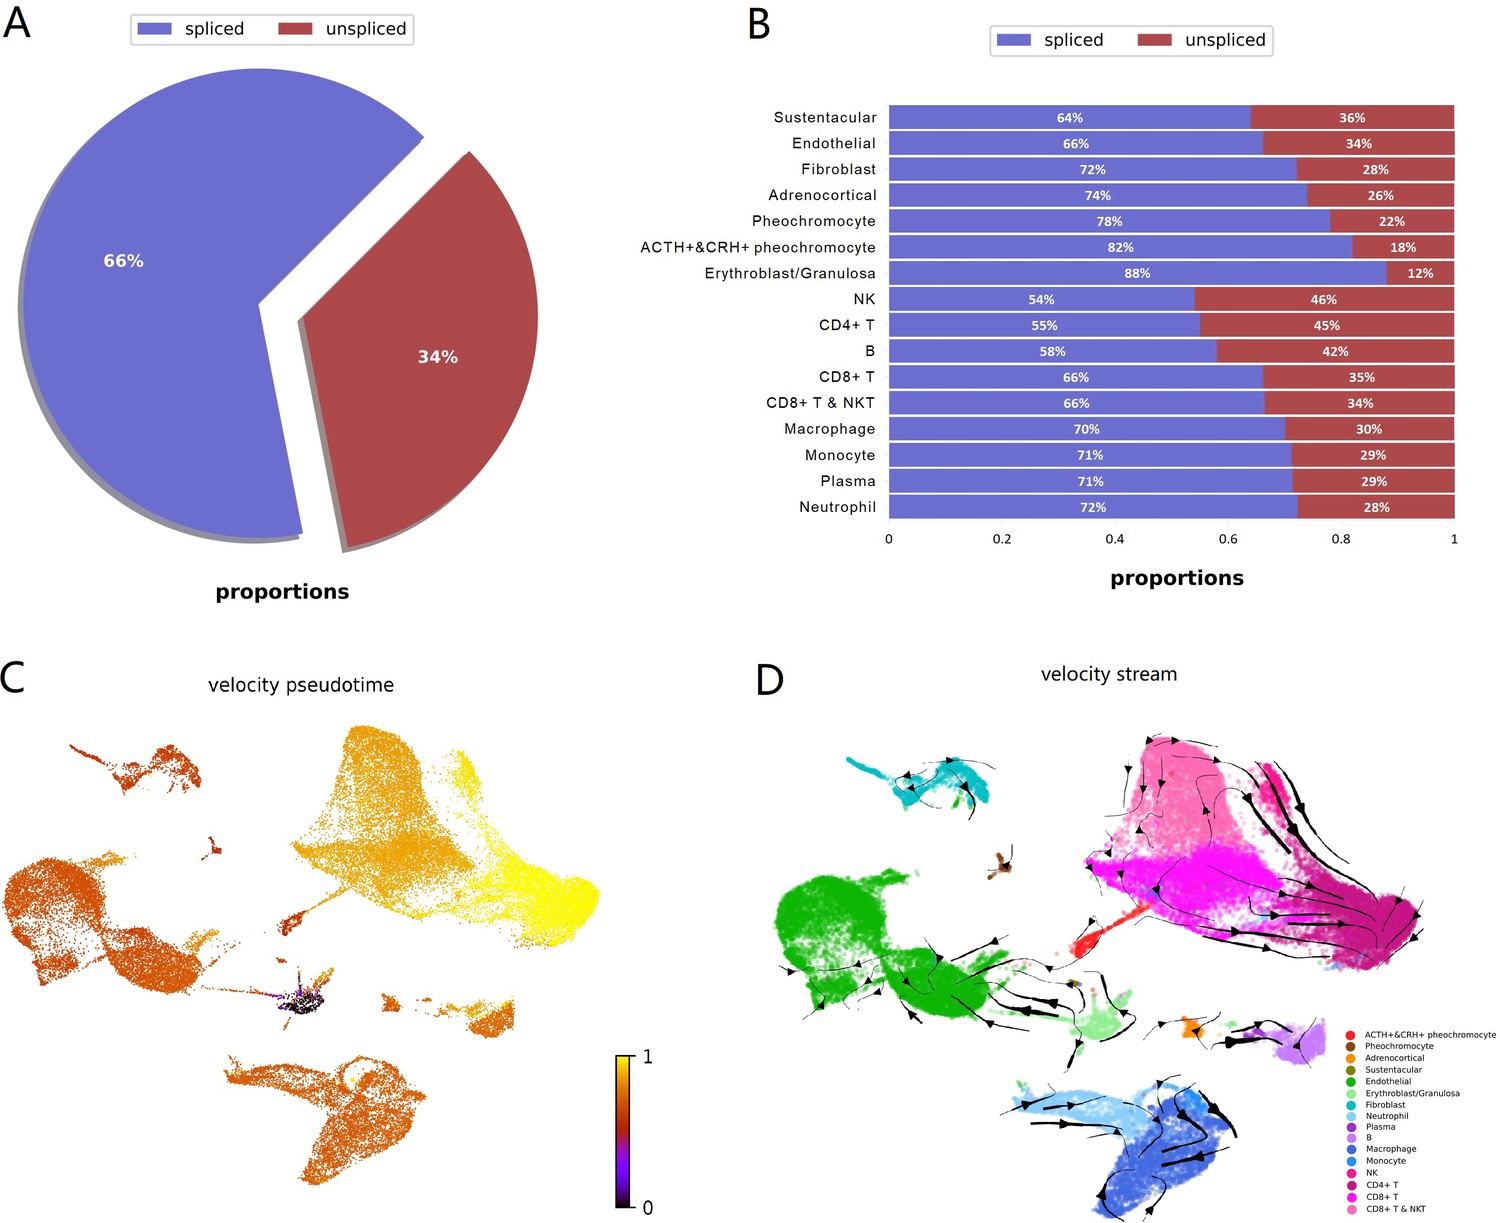
RNA velocity analysis supported sustentacular cells as root and indicated four adrenal cell subtypes were independent respectively and not directed toward other cell types.
RNA velocity is the time derivative of the measured mRNA abundance (spliced/unspliced transcripts) and allows to estimate the future developmental directionality of each cell. (A) The total ratios of spliced and unspliced transcripts. (B) The ratios of spliced and unspliced transcripts for each cell cluster. Sustentacular cells exhibit high proportions of unspliced/spliced transcripts, which support the stem-like characteristics. (C) The pseudotime, derived from the estimation of RNA velocity, is visualized in UMAP plot. It indicated that medullary cells were earlier than cortical cells. (D) The direction of cell differentiation inferred from estimated RNA velocities is plotted as streamlines on the UMAP. No consistent velocity direction was observed for the four adrenal cell subtypes, that is, POMC+&CRH + pheochromocytes, pheochromocytes adrenocortical cells, and sustentacular cells. UMAP, Uniform Manifold Approximation and Projection.
Figure 6
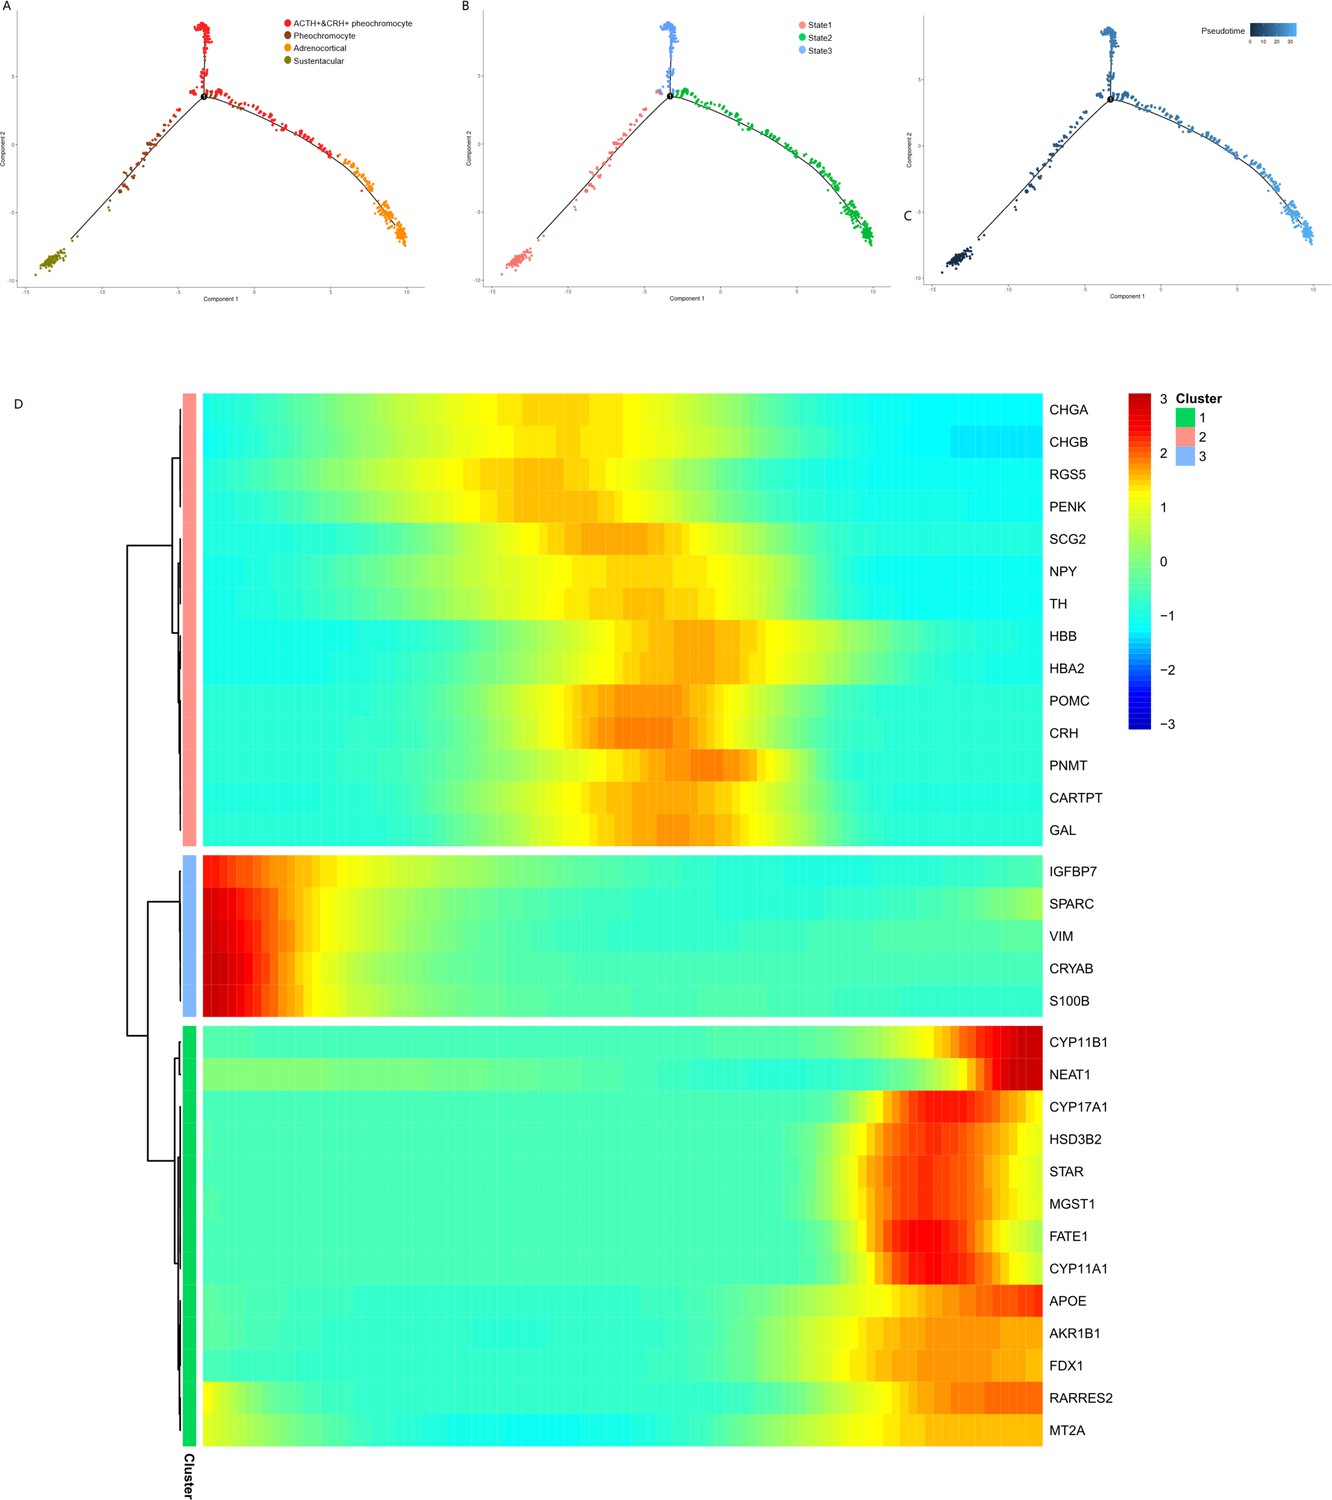
Pseudotime analysis of adrenal cells inferred by Monocle.
We ran reduce dimension with t-SNE for four types of adrenal cells and sorted cells along pseudotime using Monocle. The single-cell pseudotime trajectories by ordering cells were constructed based on genes that differ between clusters. Each point corresponds to a cell. (A) Cells are colored in each adrenal cell type. (B) Cells colors indicated the cell’s stage in simulated transition. (C) Cells colored by pseudotime. (D) Heatmap of gene markers that are significantly changed in cell-type transition in pseudotime. Each row represents a gene, where the left end corresponds to the transition starting point. (sustentacular cells) and the right end corresponds to transition ending point (adrenocortical cells). Color scheme represents the z-score distribution from 3.0 (blue) to 3.0 (red). Genes that covary across transition are clustered into three blocks.
Figure 7

Diverse immune microenvironments in different adrenal tumor subtypes and tumor-adjacent tissue.
(A) The UMAP diagram shows the expression levels of well-known marker genes of immune cell types. (B) Frequency distribution of immune cell sub-clusters in different adrenal tumors and tumor-adjacent tissue. UMAP, Uniform Manifold Approximation and Projection.
Figure 8
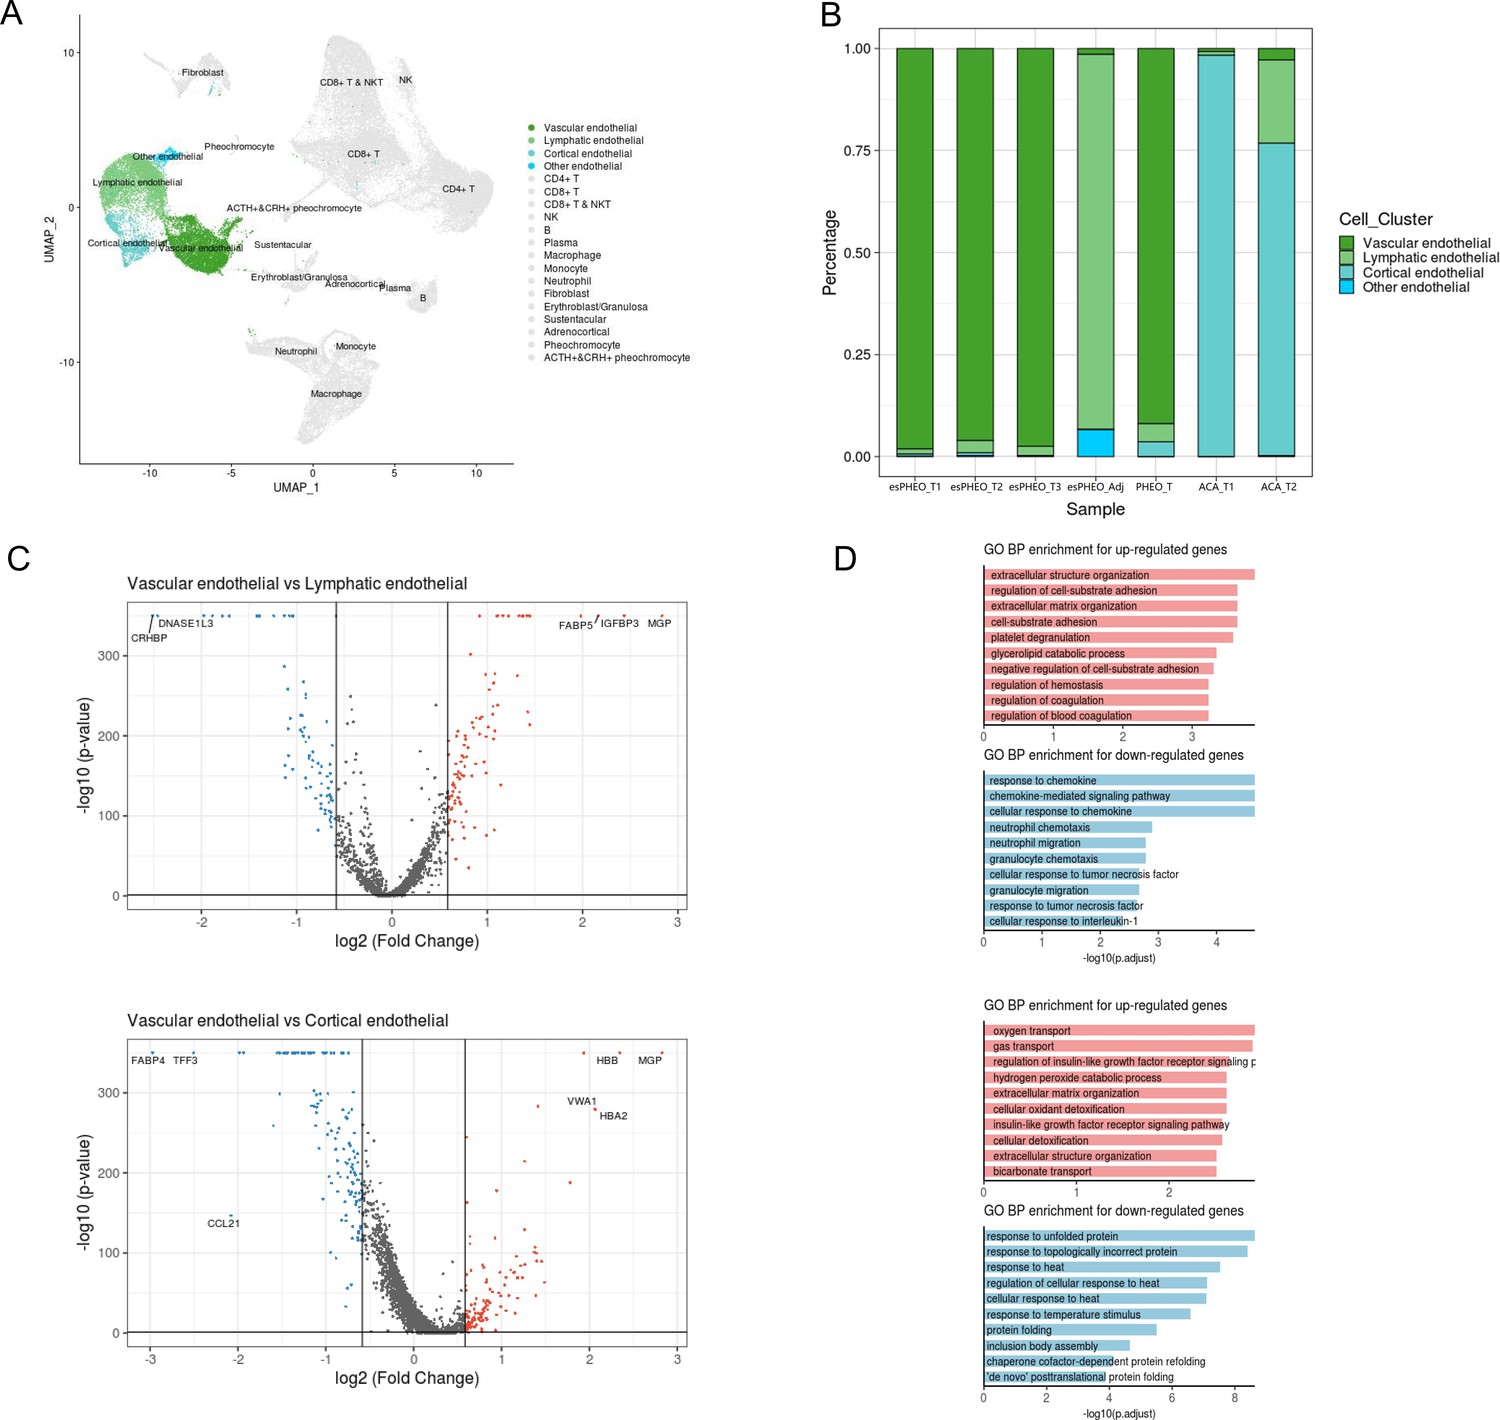
Differential gene expression analysis shows changes in endothelial cell functions.
(A) The UMAP diagram shows four different endothelial cell sub-clusters. (B) Frequency distribution of endothelial cell sub-clusters among different adrenal tumors and tumor-adjacent specimen. (C) Volcano plot of changes in gene expression for the endothelial cluster by comparing vascular endothelial cells with lymphatic cells and cortical endothelial cells, respectively. The x-axis specifies the natural logarithm of fold-changes (FC) and the y-axis specifies the negative logarithm of the adjusted p-values at the base of 10. Gray vertical and horizontal lines reflect the filtering criteria. Red and blue dots represent the genes with significantly higher expression and lower expression, respectively. (D) Functional enrichment analysis of the upregulated or downregulated gene revealed top altered functional terms. The x-axis specifies the negative logarithm of the adjusted p-values at the base of 10. UMAP, Uniform Manifold Approximation and Projection.
Appendix 1—figure 1
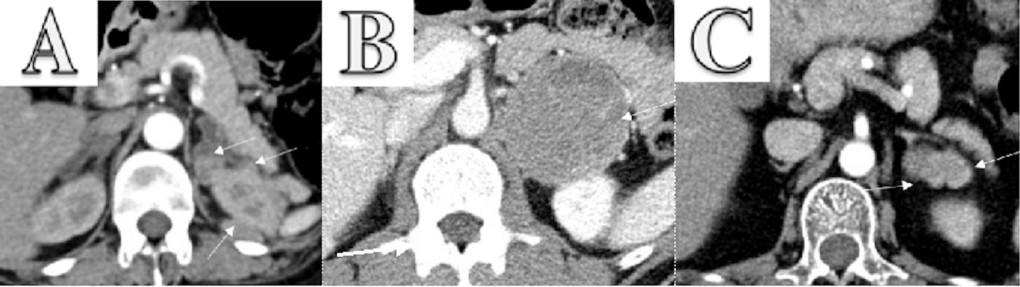
Enhanced CT scanning image for three cases.
(A) Enhanced CT scanning for Case 1 with pheochromocytoma secreting both ACTH and CRH. The abdomen revealed bilateral adrenocortical hyperplasia and multiple masses in the left adrenal and around the left kidney. The largest mass lesion was 2.3×1.6 cm2, which invaded upper pole of left kidney. (B) Enhanced CT scanning for Case 2 with pheochromocytoma. It showed a 67×70 mm2 left adrenal tumor. (C) Enhanced CT scanning for Case 3 with two adrenocortical adenomas. It revealed a 19×36 mm2 irregular mass in left adrenal gland.
Appendix 1—figure 2
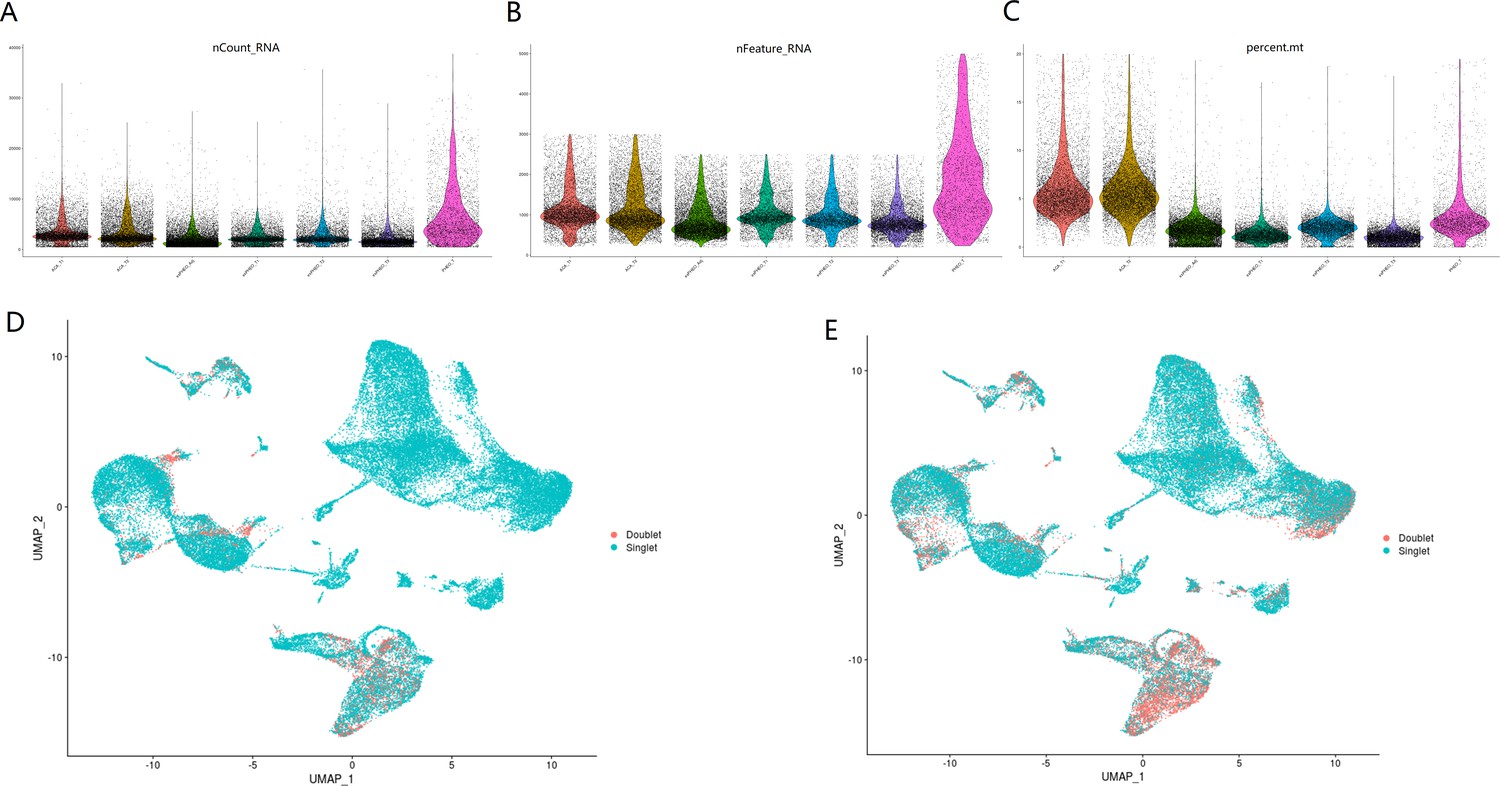
Quality control plots and doublet detection for this scRNA-seq study.
Violin plots showing number of total RNAs (A), number of genes (B), and percentage of mitochondrial (mito) genes (C) for cells in seven samples. Doublets were predicted by DoubletFinder (D) and DoubletDecon (E).
Appendix 1—figure 3
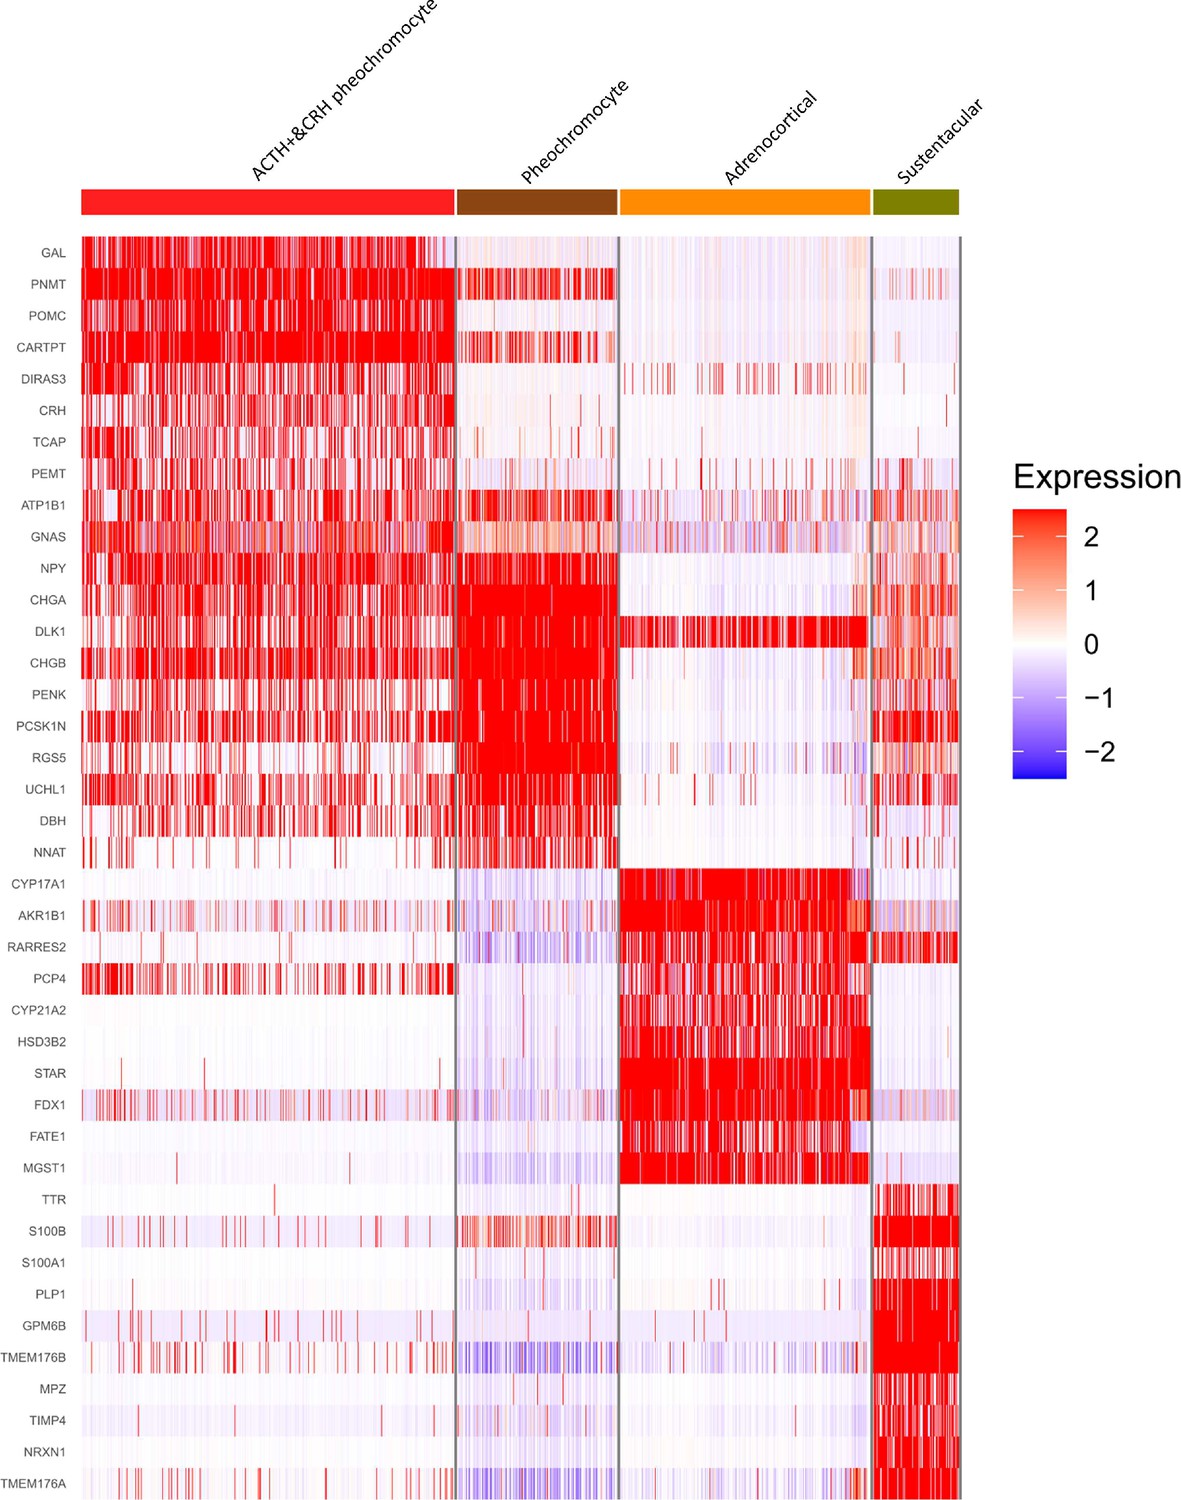
Four adrenal cell types and their highly expressed genes through single-cell transcriptomic analysis.
Heatmap shows the scaled expression patterns of top 10 marker genes in each cell type. The color keys from white to red indicate relative expression levels from low to high.
Appendix 1—figure 4
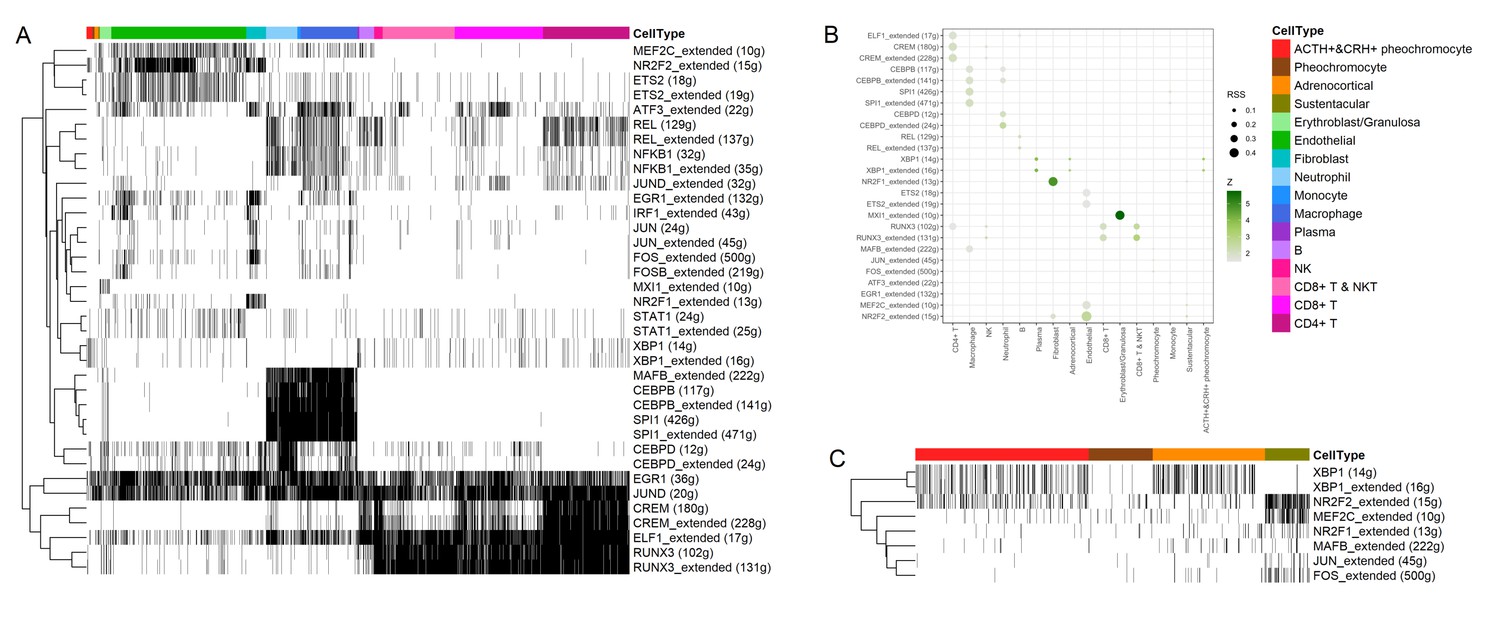
Transcription factors detection using SCENIC pipeline.
(A) Binarized heatmap showing the AUC score (area under the recovery curve, scoring the activity of regulons) of the identified regulons plotted for each cell. (B) For each cellular cluster, dot plot showed regulons were selected based on regulon specificity score (RSS). (C) Binarized heatmap showed specific regulons for four types of adrenal cells and found XBP1 as the top regulons for ACTH+&CRH + pheochromocyte.
Appendix 1—figure 5

The spliced versus unspliced phase for marker genes in four types of adrenal cells.
Transcripts were marked as either spliced or unspliced based on the presence or absence of intronic regions in the transcript. For each gene, the scatter plot shows spliced and unspliced ratios in a single cell. Each point corresponds to a cell, colored by different adrenal cellular types. A simple model of RNA dynamics is fit to the data. The estimation of RNA velocities and expression for each cell, visualized in UMAP plot. UMAP, Uniform Manifold Approximation and Projection.
Appendix 1—figure 6
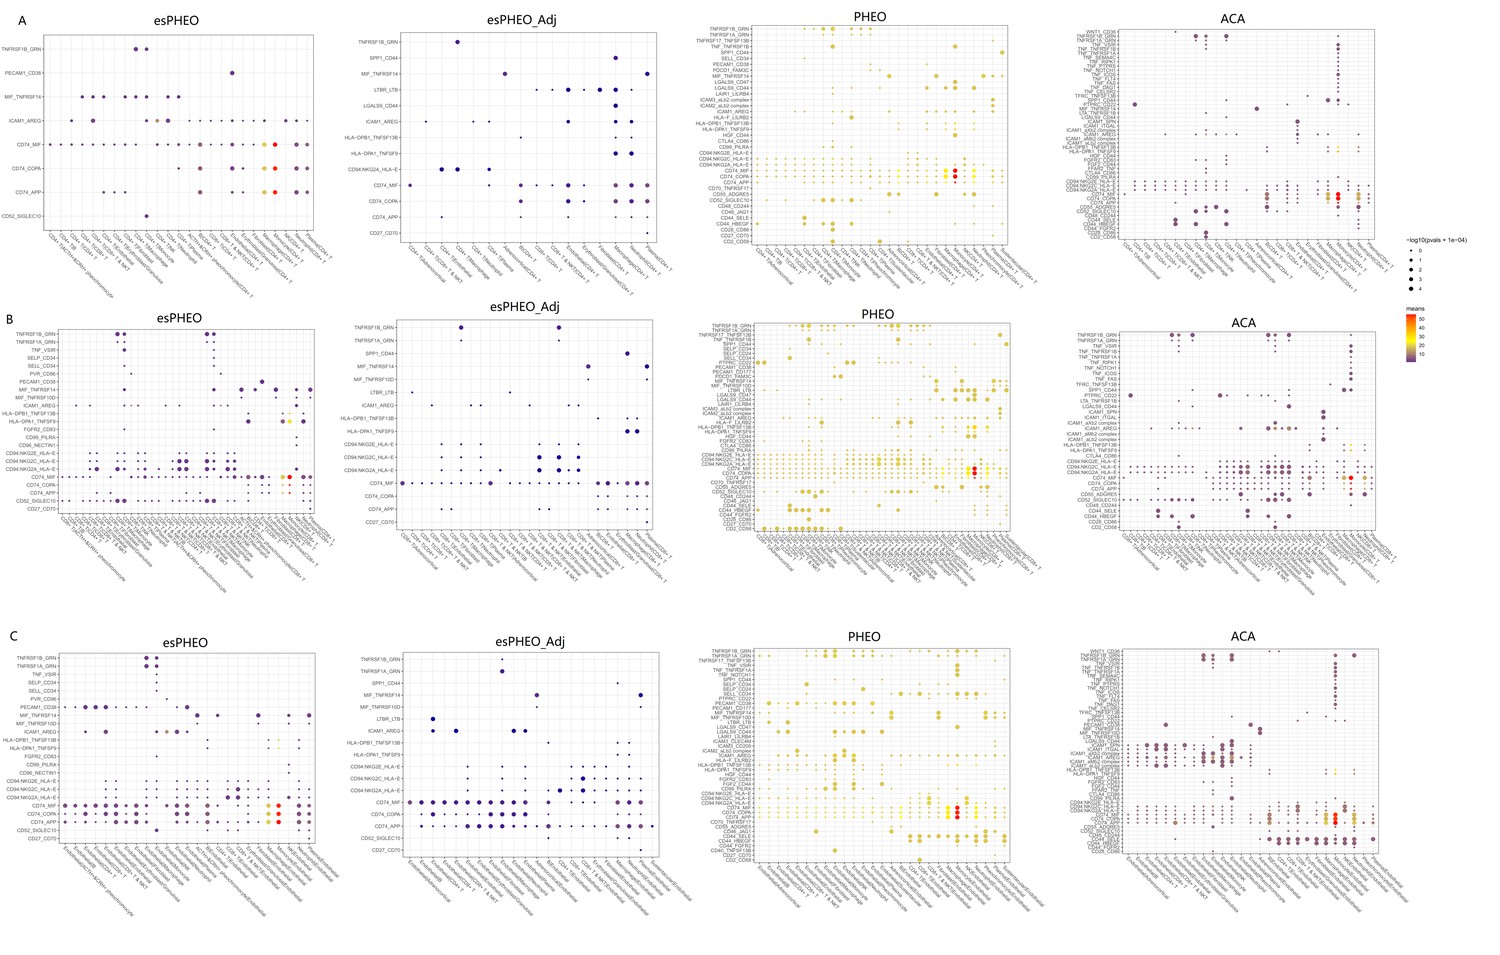
Ligand-receptor interaction analysis for CD4+ T cells, CD8+ T cells, and endothelial cells in different tumor microenvironments.
Overview of ligand-receptor interactions between the CD4+ T cells (A), CD8+ T cells (B), endothelial (C), and the other cell types in the different tumor microenvironments. p-values are represented by the size of each circle. The color gradient indicates the level of interaction.
Appendix 1—figure 7
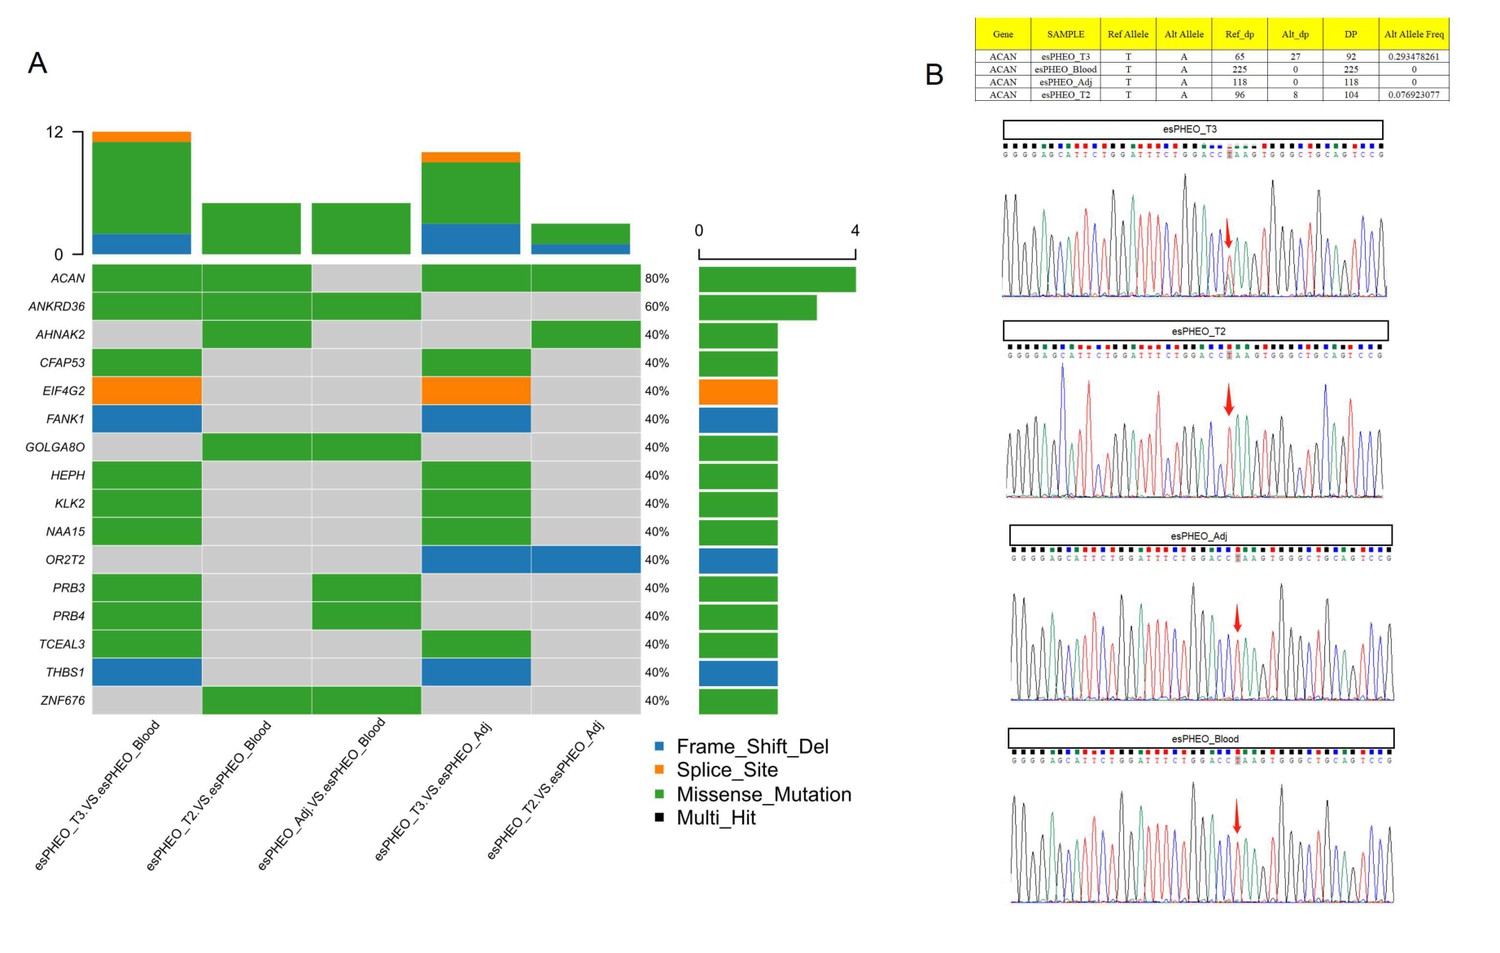
Whole-exome sequencing identified one shared somatic variant of ACAN comparing variants in tumor samples to controls and Sanger sequencing only confirmed the presence in esPHEO_T3 but not observed in esPHEO_T2.
(A) Distribution of somatic mutations for the rare case with ectopic ACTH&CRH-secreting pheochromocytoma. OncoPrint plots were generated using the R package Maftools for somatic mutations from five tissue comparisons: esPHEO_T3 versus esPHEO_Blood, esPHEO_T2 versus esPHEO_Blood, esPHEO_Adj versus esPHEO_Blood, esPHEO_T2 versus esPHEO_Adj, and esPHEO_T3 versus esPHEO_Adj. (B) Sanger sequencing to validate the somatic mutation of ACAN_c.5951T > A:p.L1984Q located on chr15:88858536. It confirmed the presence in esPHEO_T3 but not validated in esPHEO_T2. The variant was not observed in controls (esPHEO_Adj and esPHEO_Blood).
Appendix 1—figure 8
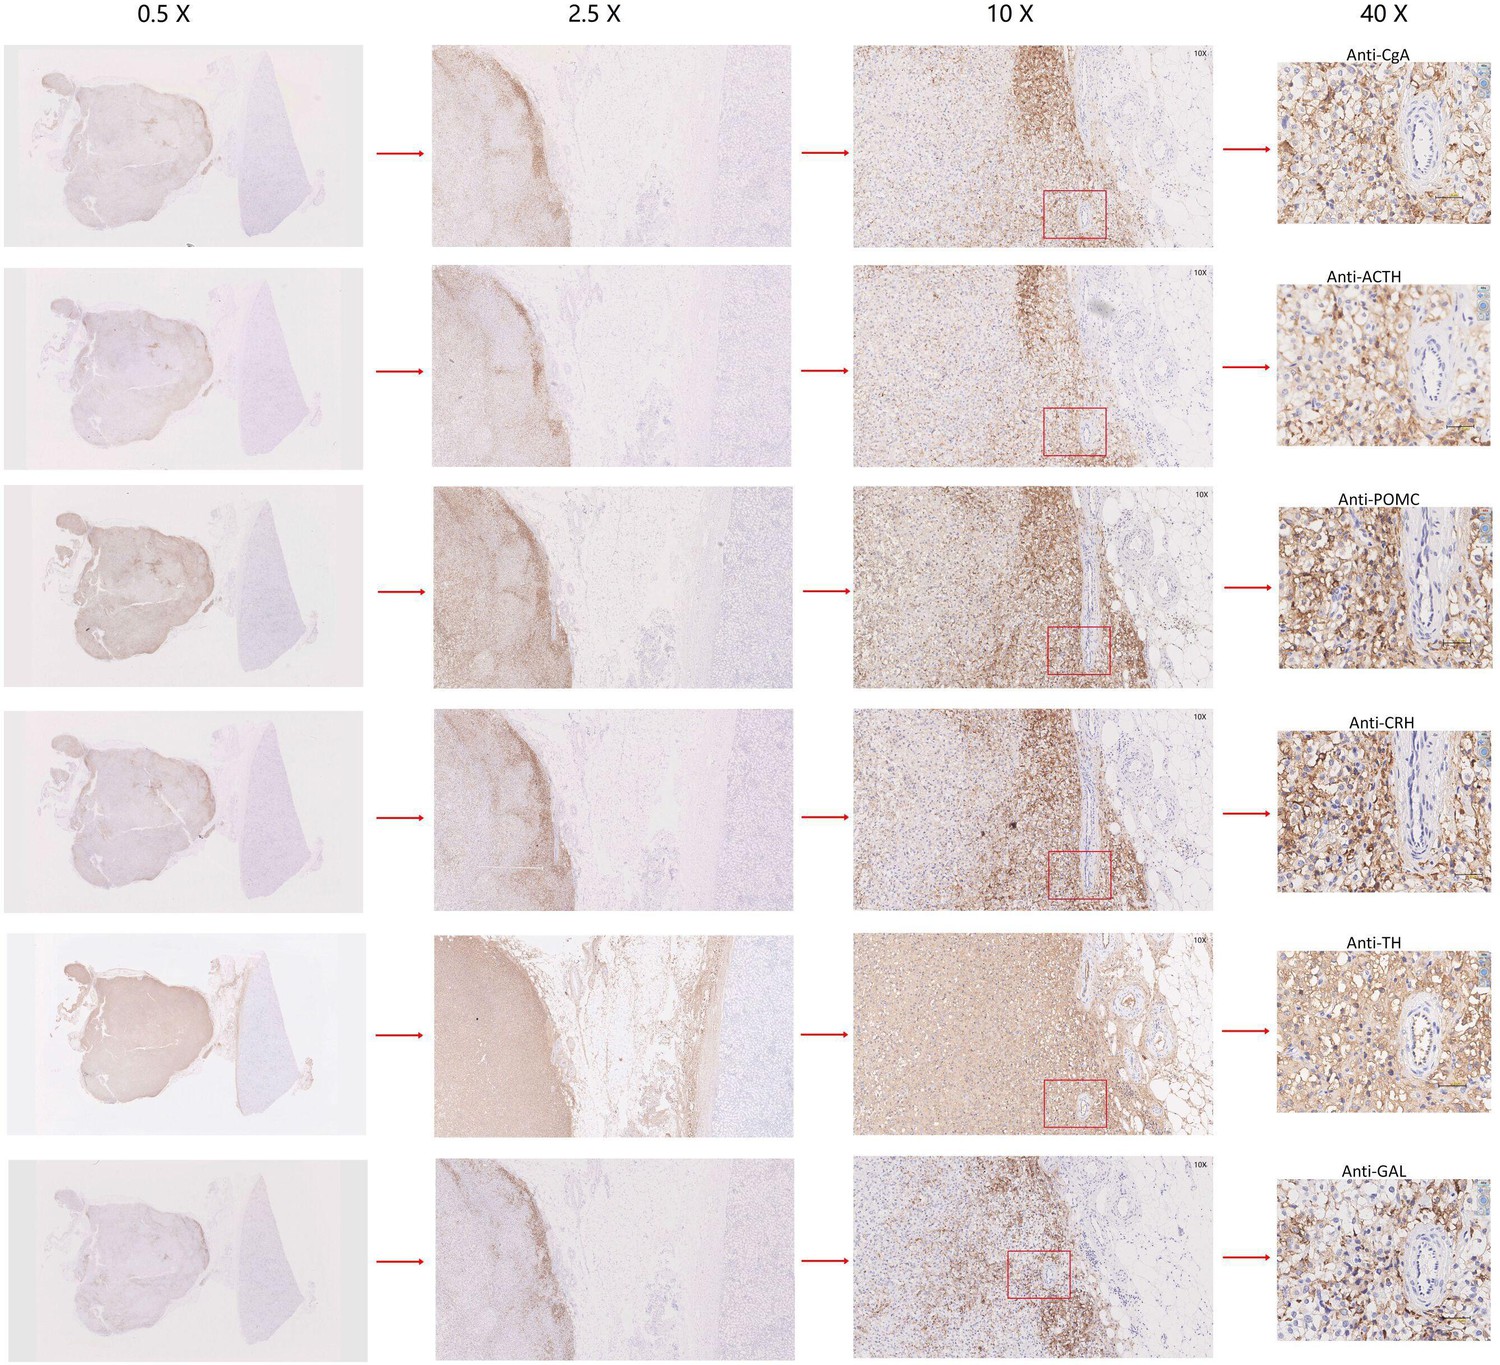
Immunohistochemistry of CgA, ACTH, POMC, CRH, TH, or GAL on serial biopsies from tumor specimen infiltrating tissues located in the kidney (esPHEO_T3).
We observed positive staining signal at tumor left in each slice, while the adjacent kidney was un-stained could be negative controls. The magnification is 0.5×, 2.5×, 10×, and 40× from left to right. Red rectangular indicates the magnified area of the location, as shown in Figure 3D.
Appendix 1—figure 9
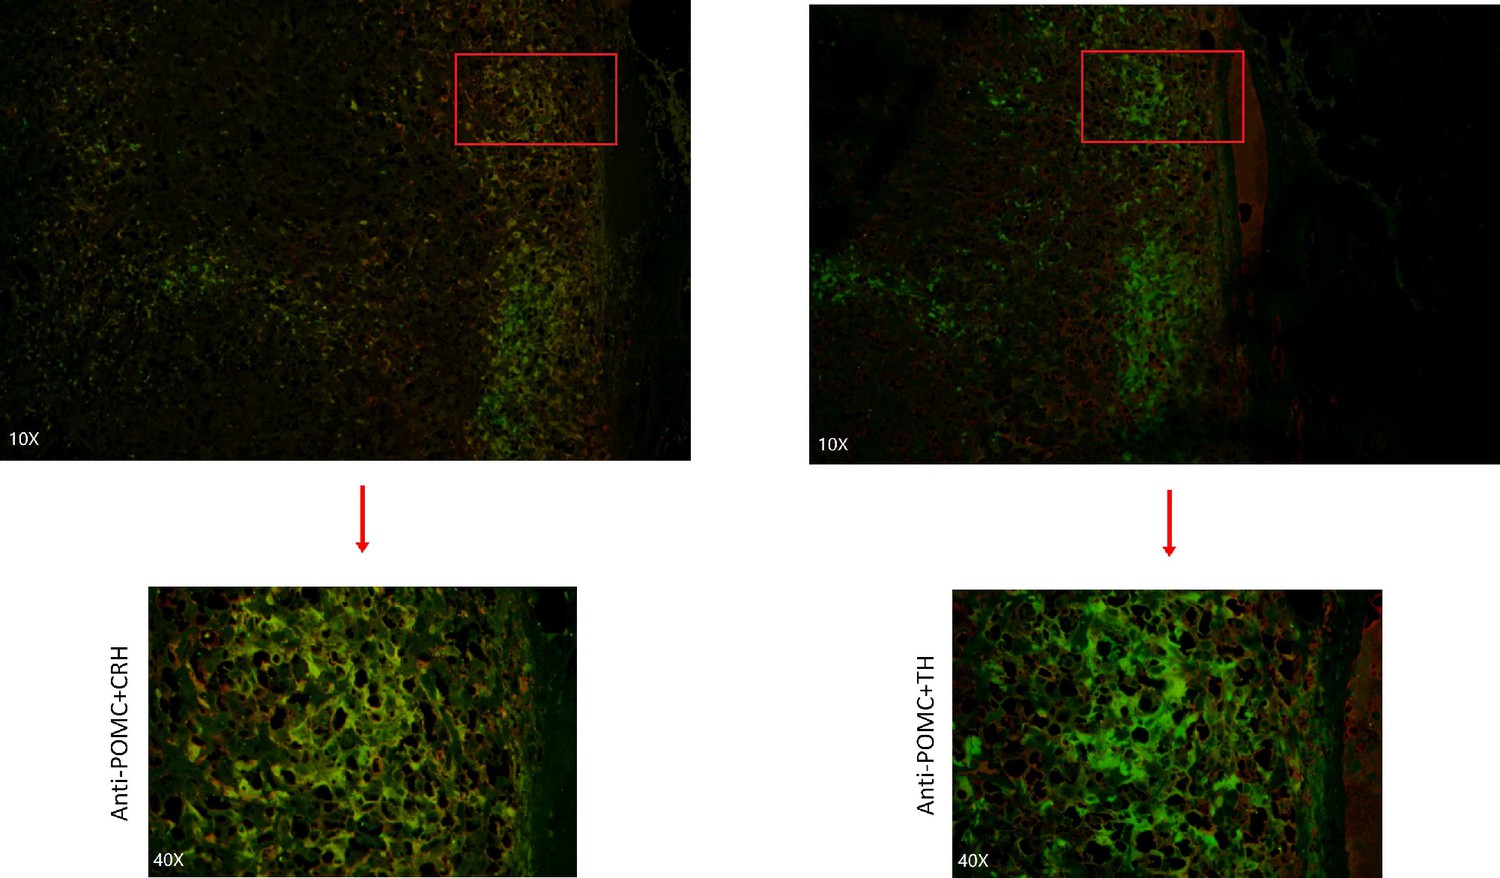
Immunofluorescence co-staining for POMC&CRH and POMC&TH on two serial biopsies from tumor specimen esPHEO_T3.
The magnification is 10× (top) and 40× (bottom). Red rectangular indicates the magnified area of the location, as shown in Figure 3E.
Author response image 1

Author response image 2
Author response image 3
Tables
Appendix 1—table 1
Summary of laboratory test for three cases.
| Laboratory test | Case 1 | Case 2 | Case 3 | Reference range | |
|---|---|---|---|---|---|
| ACTH | 519.0 | 24.0 | <5 | 0–46.0 pg/ml | |
| 24 hr urine-free cortisol | 2024.4 | 332.4 | 12.3–103.5 μg/24 hr | ||
| Catecholamines | |||||
| Plasma metanephrines | |||||
| Normetanephrine | 3.28 | 10.81 | 0.4 | <0.9 nmol/L | |
| Metanephrine | 3.44 | 11.55 | 0.2 | <0.5 nmol/L | |
| 24 hr urine | |||||
| Epinephrine | 397.63 | 56.23 | 1.92 | 1.74–6.42 μg/24 hr | |
| Norepinephrine | 475.43 | 82.29 | 26.17 | 16.69–40.65 μg/24 hr | |
| Dopamine | 432.21 | 301.71 | 240.5 | 120.93–330.5 μg/24 hr | |
Additional files
-
Supplementary file 1
Raw data QC for single-cell RNA sequencing and whole-exome sequencing.xlsx.
- https://cdn.elifesciences.org/articles/68436/elife-68436-supp1-v3.xlsx
-
Supplementary file 2
Number (n) of cells in each cellular cluster in different samples and top 10 gene markers.xlsx.
- https://cdn.elifesciences.org/articles/68436/elife-68436-supp2-v3.xlsx
-
Supplementary file 3
Number (n) of cells in each endothelial cell cluster in different samples and top 10 gene markers.xlsx.
- https://cdn.elifesciences.org/articles/68436/elife-68436-supp3-v3.xlsx
-
Supplementary file 4
Germline and somatic mutations of tumor and normal samples from the rare case with ectopic ACTH&CRH-secreting pheochromocytoma by whole-exome sequencing.xlsx.
- https://cdn.elifesciences.org/articles/68436/elife-68436-supp4-v3.xlsx
-
Transparent reporting form
- https://cdn.elifesciences.org/articles/68436/elife-68436-transrepform1-v3.pdf
Download links
A two-part list of links to download the article, or parts of the article, in various formats.
Downloads (link to download the article as PDF)
Open citations (links to open the citations from this article in various online reference manager services)
Cite this article (links to download the citations from this article in formats compatible with various reference manager tools)
Single-cell transcriptome analysis identifies a unique tumor cell type producing multiple hormones in ectopic ACTH and CRH secreting pheochromocytoma
eLife 10:e68436.
https://doi.org/10.7554/eLife.68436


