Fibrinogen αC-subregions critically contribute blood clot fibre growth, mechanical stability, and resistance to fibrinolysis
- Discovery and Translational Science Department, Leeds Institute of Cardiovascular and Metabolic Medicine, University of Leeds, United Kingdom
- Department of Physics, Wake Forest University, United States
- Division of Hematology, Brigham and Women’s Hospital, Harvard Medical School, United States
- Instituto de Medicina Molecular - João Lobo Antunes, Faculdade de Medicina, Universidade de Lisboa, Portugal
- Department of Infection, Immunity and Cardiovascular Disease, University of Sheffield, United Kingdom
- Molecular and Nanoscale Physics Group, University of Leeds, United Kingdom
Figures
Figure 1 with 1 supplement
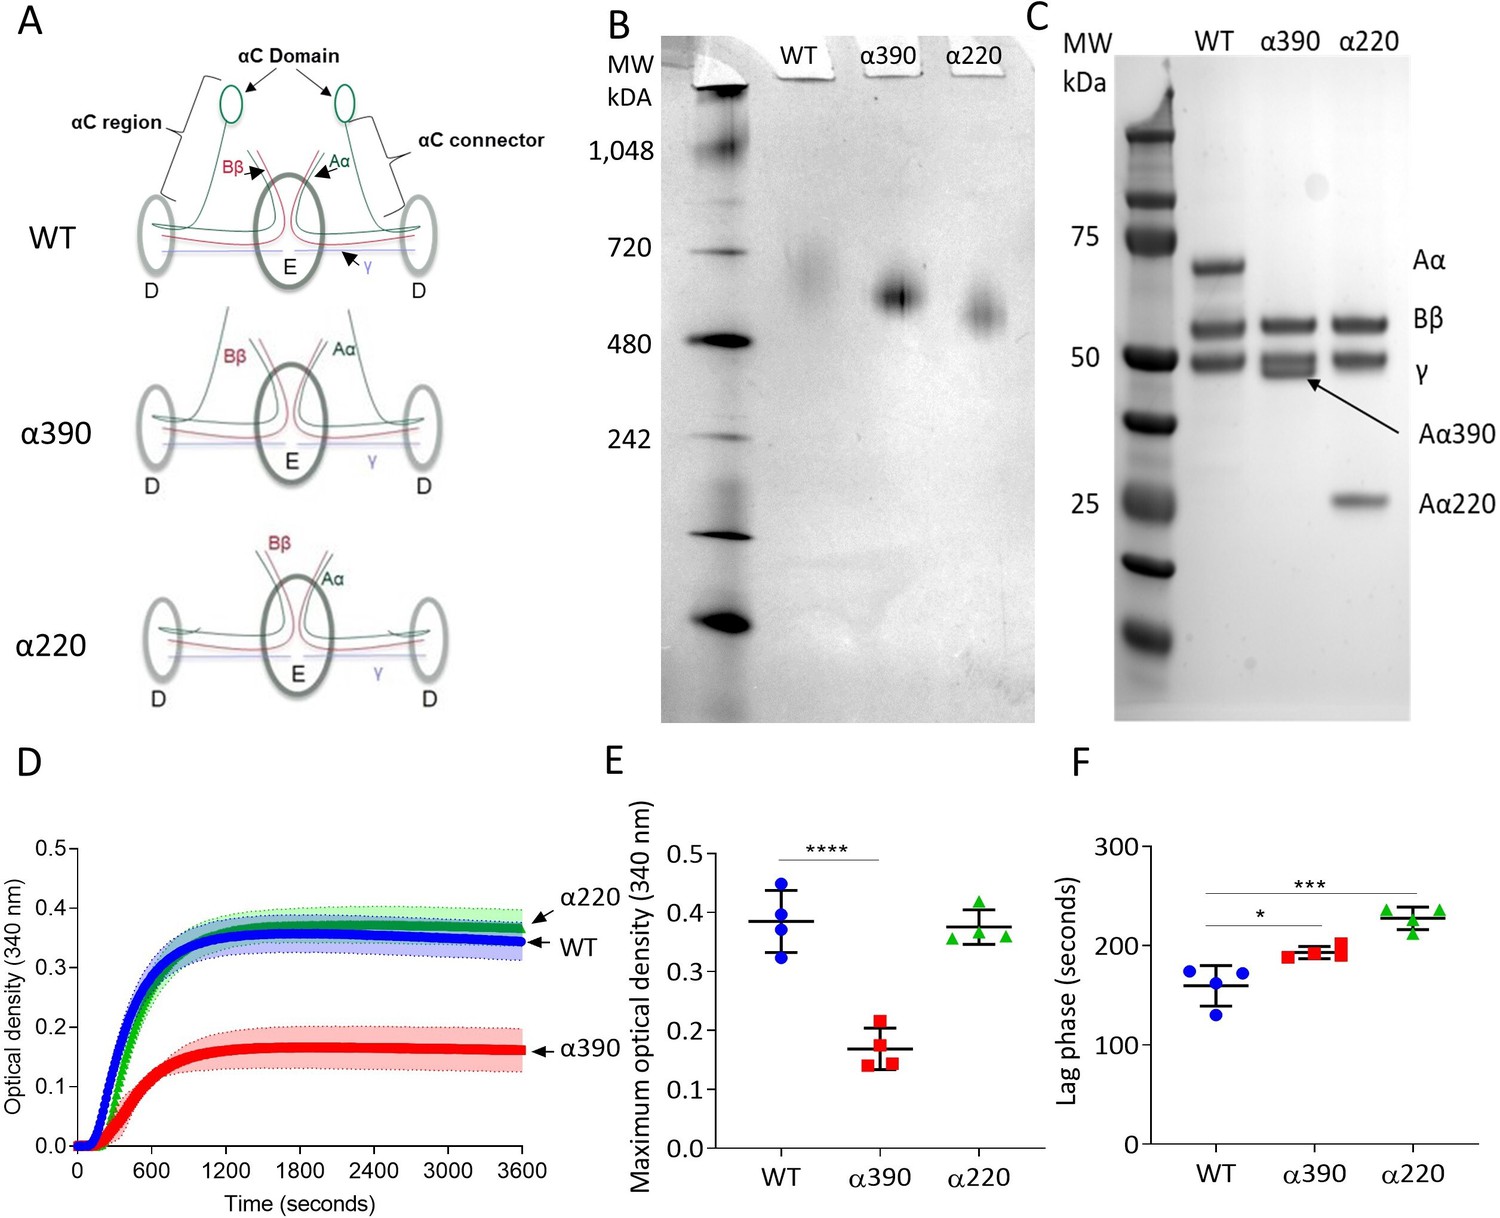
Initial characterisation of the recombinant truncated fibrinogen.
(A) Schematic of WT, α390, and α220 highlighting the differences in structure of αC-region. (B) Native PAGE gel of the recombinant fibrinogens showed increased migration with decreasing protein size, and a single band for each fibrinogen α-chain variant and WT. (C) Reducing SDS-PAGE gel of the truncated fibrinogens, showing intact β- and γ-chains, and the correct size for the α-chains. All preparations showed no degradation and high purity. The arrow indicates the α-chain for α390 just underneath the γ-chain. (D) Turbidity curve of the truncated and WT fibrinogens showing an increase in optical density over time. (E) The maximum optical density was significantly reduced for α390, but not α220, compared to WT. (F) The lag phase was significantly increased for α390, then α220, compared to WT. Results shown as mean ± SD, n = 4, *p<0.05, ***p<0.001, ****p<0.0001 by one-way ANOVA with Dunnett’s multiple comparison test relative to WT.
-
Figure 1—source data 1
Raw and uncropped gels for (Figure 1A) and (Figure 1B) and turbidimetric assay data (Figure 1D,F).
- https://cdn.elifesciences.org/articles/68761/elife-68761-fig1-data1-v4.xlsx
Figure 1—figure supplement 1
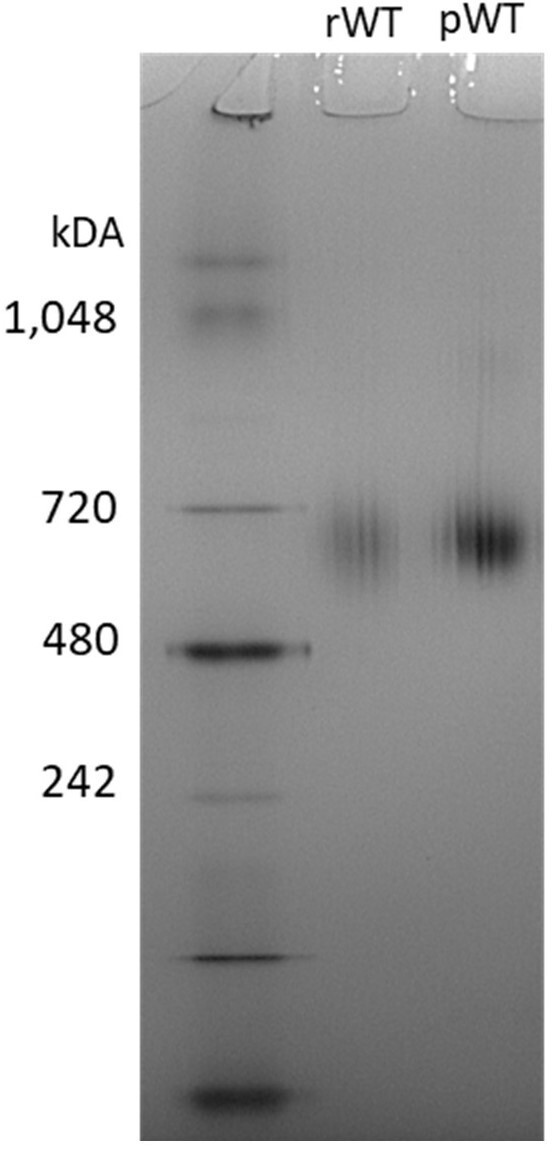
NativePAGE gel-recombinant WT (rWT) and plasma-purified WT (pWT).
No difference was observed in migration between the rWT and the pWT. Molecular weight markers (MWs) are in lane 1. pWT fibrinogen was purified by IF-1 affinity chromatography and dialysed as the recombinant WT.
Figure 2
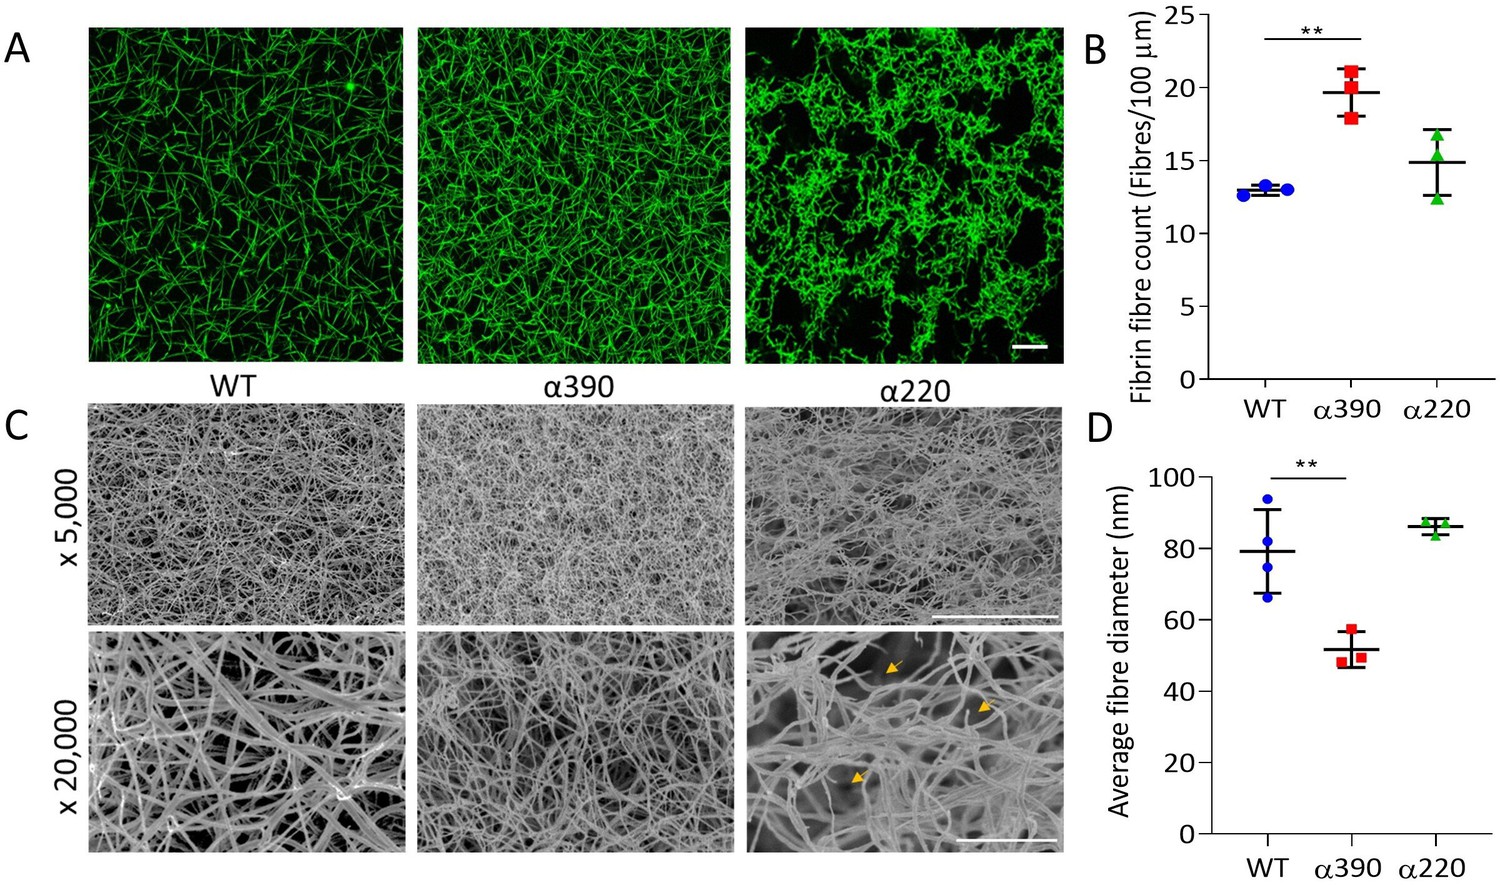
Fibrin structural changes observed with truncation to the fibrinogen α-chain.
(A) Representative laser confocal microscopy images of clots composed of truncated and WT fibrinogens, scale bar is 20 µm. (B) Clot fibrin fibre density was significantly increased for α390, but not α220, compared to WT. (C) Representative scanning electron microscopy images of clots composed of either truncated fibrinogen or WT, scale bar is 10 µm for ×5000 and 2 µm for the ×20,000 magnifications. Yellow arrows on the ×20,000 magnification images for α220 highlight the numerous fibre ends visible throughout the clot. (D) Average fibre diameter calculated from the ×20,000 magnification images showed a significantly decreased diameter for α390, but not α220, compared to WT. Laser scanning confocal images were taken on an LSM880 inverted laser scanning confocal microscope (Zeiss; Cambridge, UK) using a ×40 magnification oil objective. Scanning electron microscope images were taken on an SU8230 Ultra-High-Resolution Scanning Electron Microscope (Hitachi, Tokyo, Japan). Results shown as mean ± SD, n = 3 confocal and scanning electron microscopy n = 3 (α390 and α220) and n = 4 WT, **p<0.01 by one-way ANOVA with Dunnett’s multiple comparison test relative to WT.
-
Figure 2—source data 1
- https://cdn.elifesciences.org/articles/68761/elife-68761-fig2-data1-v4.xlsx
Figure 3

Early fibrin polymers length comparison.
(A) Representative images of fibrin polymers lengths for truncated and WT fibrinogens at 10, 20, and 30 min, scale bar is 1 µm. (B) Average polymer length was significantly decreased for α220, but not α390, at all time points compared to WT. Each point in (B) represents a single measured polymer; at least 165 polymers were measured for each time point/fibrinogen variant, and at least three replicates were made of each sample. Results shown as median ± IQR, ****p<0.0001 by Kruskal–Wallis test with Dunn’s multiple comparison test relative to WT.
-
Figure 3—source data 1
Oligomer lengths (Figure 3B).
- https://cdn.elifesciences.org/articles/68761/elife-68761-fig3-data1-v4.xlsx
Figure 4 with 1 supplement
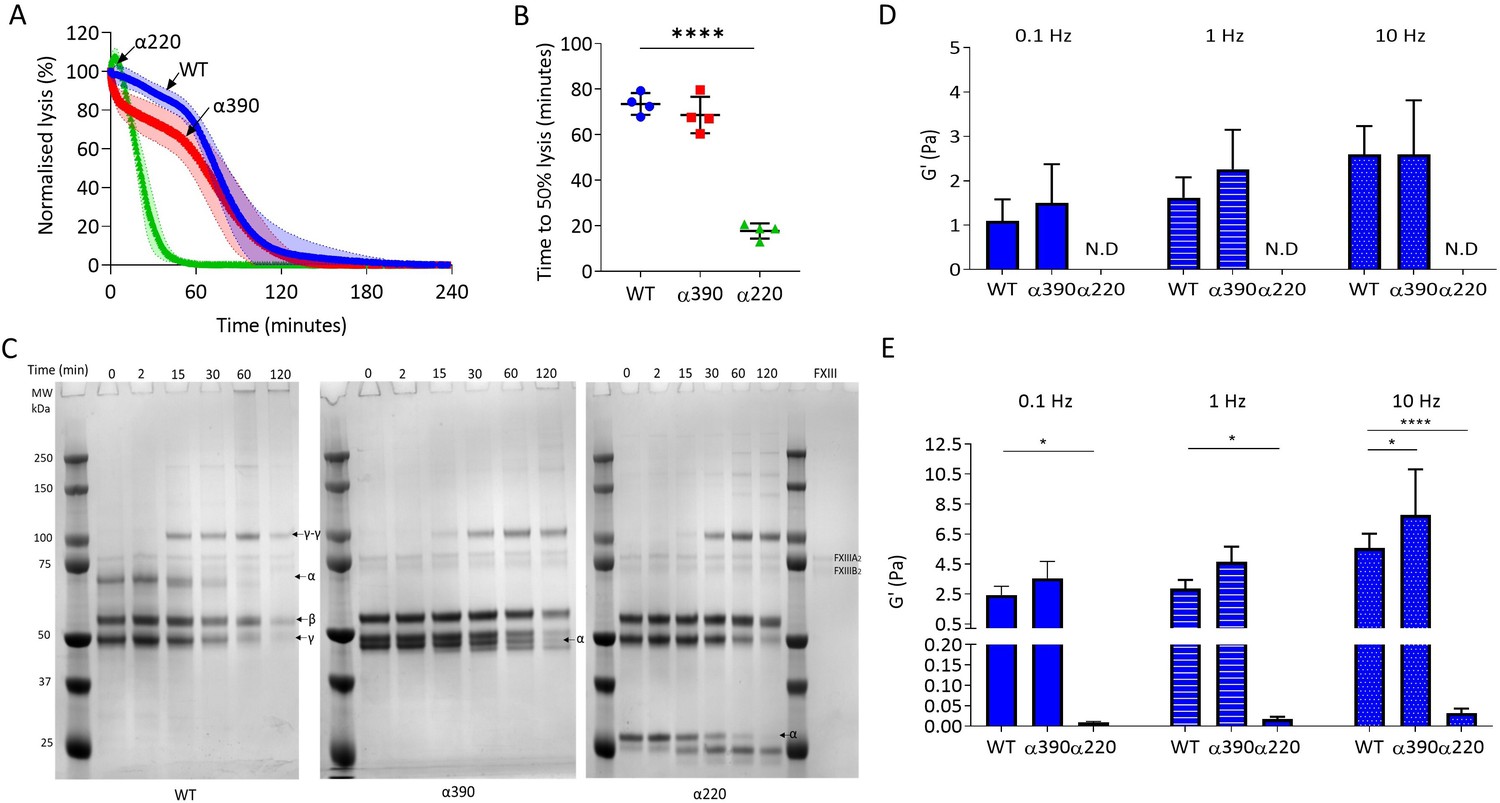
αC-connector provides clot stability.
(A) Normalised fibrinolysis curve over time of truncated and WT fibrinogens. (B) Time to 50% lysis was significantly decreased for α220, but not α390, compared to WT. (C) Representative SDS-PAGE gels of truncated and WT fibrinogens undergoing cross-linking by FXIII, showing α- and γ-chain cross-linking in the variants. (D) Elastic modulus (G′) at 0.1 Hz, 1 Hz, and 10 Hz, in the absence of FXIII, showed that clot stiffness was not different between α390 and WT, but could not be determined (N.D) for α220. (E) Elastic modulus (G′) at 0.1 Hz, 1 Hz, and 10 Hz, in the presence of FXIII, showed that α390 markedly increased, whilst α220 significantly decreased, clot stiffness compared to WT. n = 4. Results shown as mean ± SD, n = 4 for (A), (B), (D), and (E) n = 4 for WT and α390 and n = 3 in (E) for α220, *p<0.05, **p<0.01, ***p<0.001, ****p<0.0001 by one-way ANOVA with Dunnett’s multiple comparison test (B) and two-way ANOVA with Dunnett’s multiple comparison test graphs (D) relative to WT.
-
Figure 4—source code 1
Code used in MATLAB for fibrin microrheology analysis.
- https://cdn.elifesciences.org/articles/68761/elife-68761-fig4-code1-v4.zip
-
Figure 4—source data 1
Fibrinolysis data (Figure 4A and B), raw and uncropped gels for (Figure 4C), and fibrin microrheology data for Figure 4D and E.
- https://cdn.elifesciences.org/articles/68761/elife-68761-fig4-data1-v4.xlsx
Figure 4—figure supplement 1
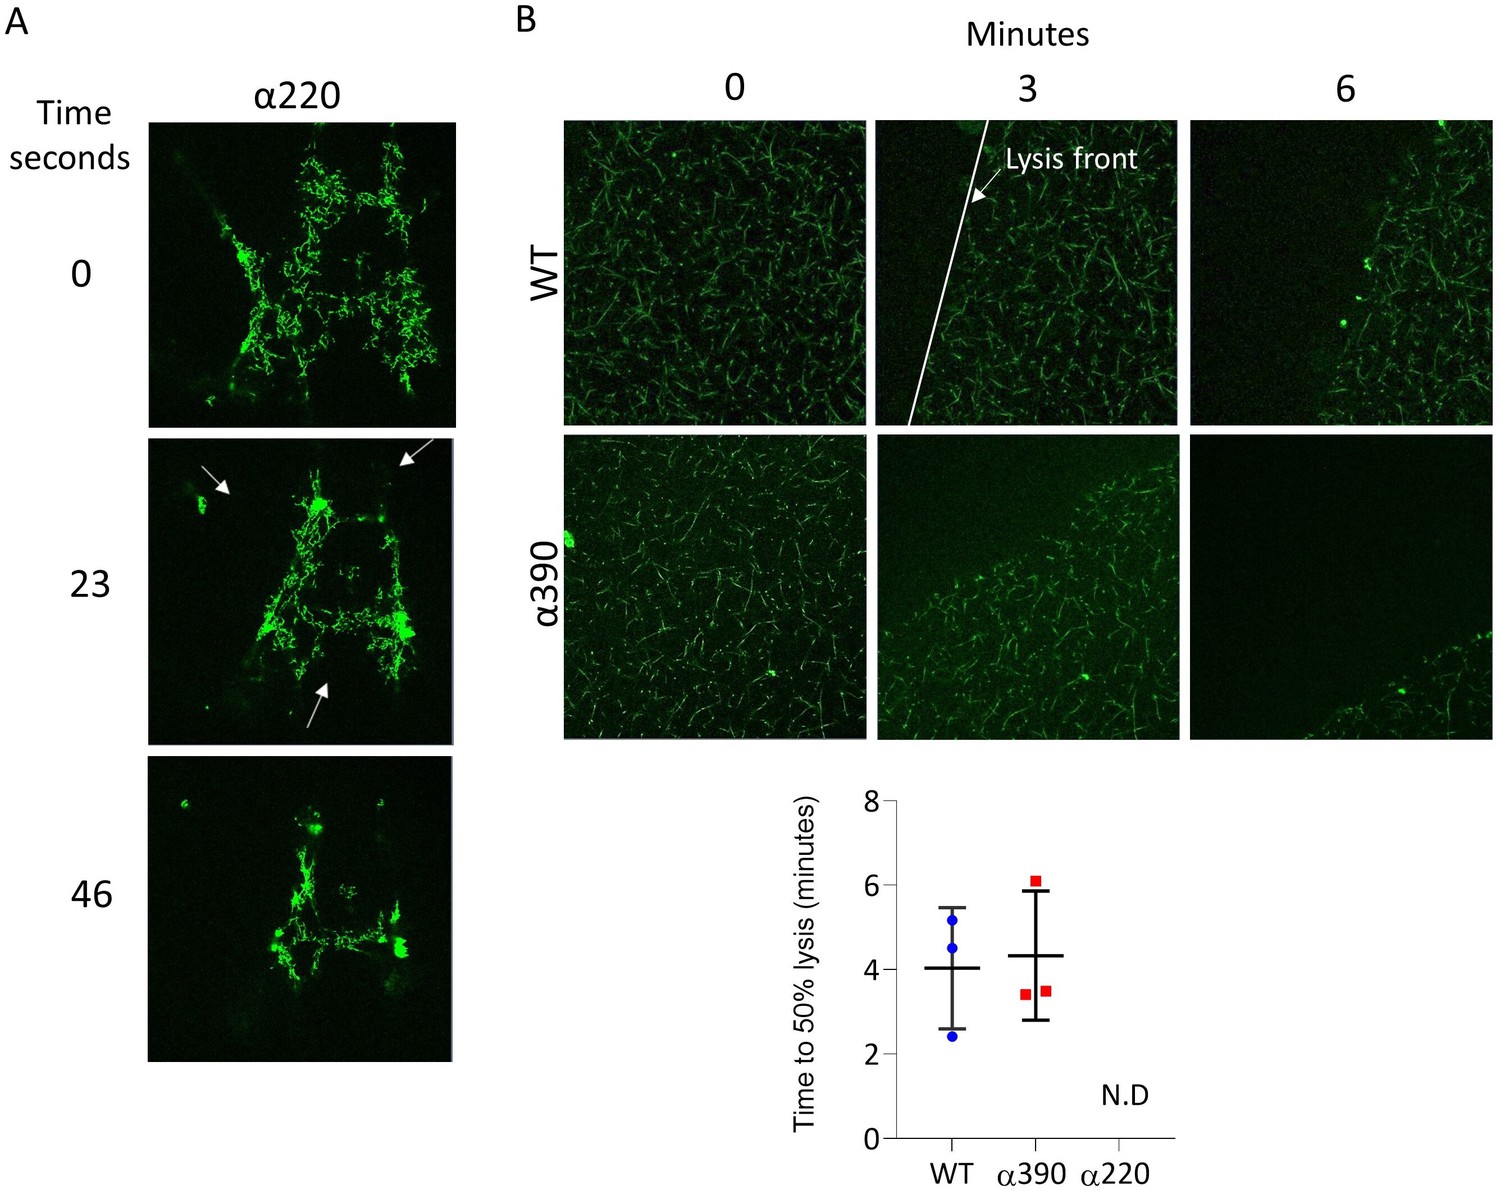
Fibrinolysis by laser scanning confocal microscopy.
(A) Representative images highlighting multiple lysis front observed in α220. Fibrinolysis for α220 was occurring at multiple sides of fibrin network, therefore fibrinolysis could not be determined. (B) Time to 50% lysis for α390 and WT. Representative images of fibrinolysis of WT and α390 over time points (top). The lysis front is highlighted by the white line. Lysis z-stacks is composed of eight sections over 20.99 µm. Time to 50% lysis was similar for α390 and WT but not determined (N.D) for α220. Results shown as mean ± SD, n = 3.
-
Figure 4—figure supplement 1—source data 1
Fibrinolysis times (Figure 4—figure supplement 1).
- https://cdn.elifesciences.org/articles/68761/elife-68761-fig4-figsupp1-data1-v4.xlsx
Figure 5 with 2 supplements

Whole blood clot contraction.
Whole blood clots were prepared from whole blood from Fga-/- non-activated mice supplemented with either truncated fibrinogen or WT, no fibrinogen (controls). (A) Representative images of whole blood clot formation and contraction over time, showing the formation of a defined clot for WT and α390, but no visible clotting for α220 and controls. (B) Whole blood clot contraction kinetics was similar between α390 and WT, but not quantifiable for α220. (C) Final clot weight was not different between α390 and WT, but not quantifiable for α220. (D) The percentage of red blood cells incorporated in the contracted clot was similar between α390 and WT, whilst that of α220 was similar to the control containing tissue factor but no fibrinogen. Results shown as mean ± SD, n = 3, *p<0.05 by one-way ANOVA with Dunnett’s multiple comparison test relative to the tissue factor-activated control.
-
Figure 5—source data 1
Retraction data (Figure 5B), weights (Figure 5C), and absorbances for red blood cell incorporation (Figure 5D).
- https://cdn.elifesciences.org/articles/68761/elife-68761-fig5-data1-v4.xlsx
Figure 5—figure supplement 1
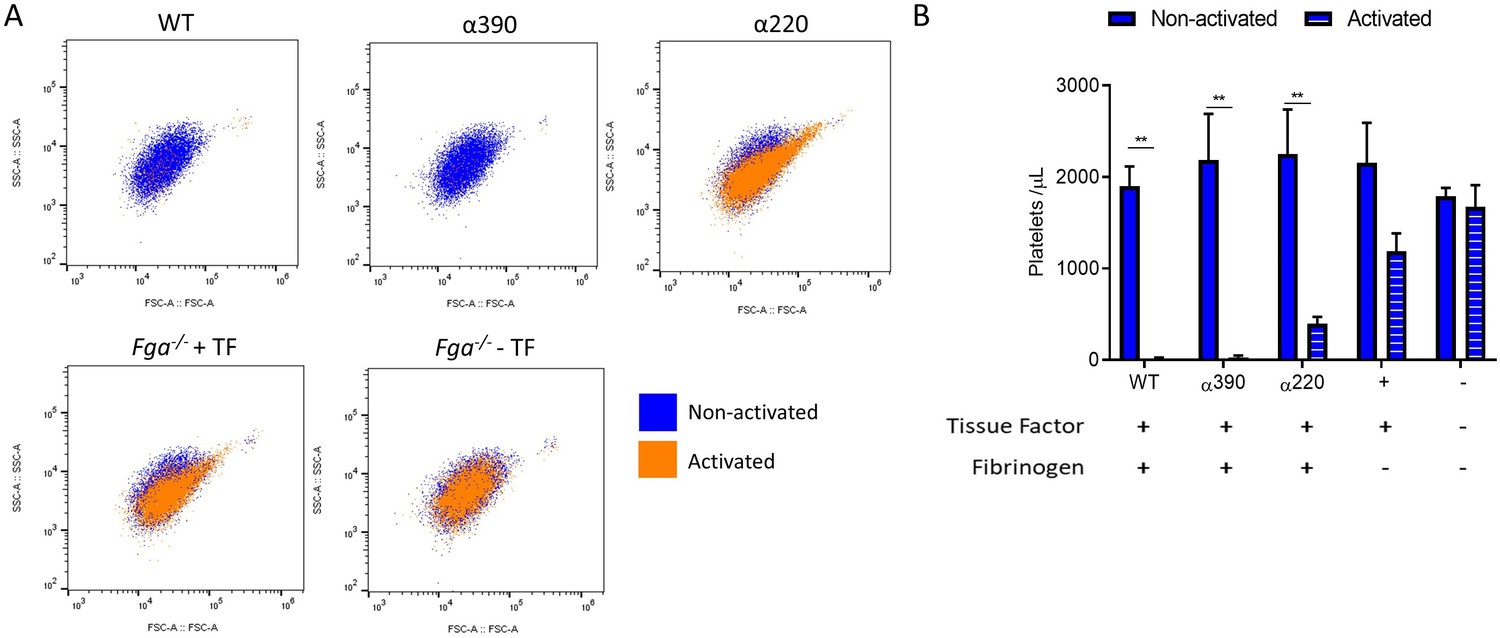
Clot incorporation of platelets.
(A) Representative flow cytometry scatter plots showing matching samples taken before activation (non-activated blue) and post-activated (activated unclotted sample, orange) from the clot contraction experiment (Figure 5). (B) Number of platelets included in the retracted clot was significantly reduced in α220, but not α390, compared to WT. Platelet incorporation was reduced and unchanged for without fibrinogen, and without fibrinogen and tissue factor, controls, respectively. Results shown as mean ± SD, n = 3, **p<0.01 by two-way ANOVA with Sidak’s multiple comparison test non-activated samples and activated samples.
Figure 5—figure supplement 2
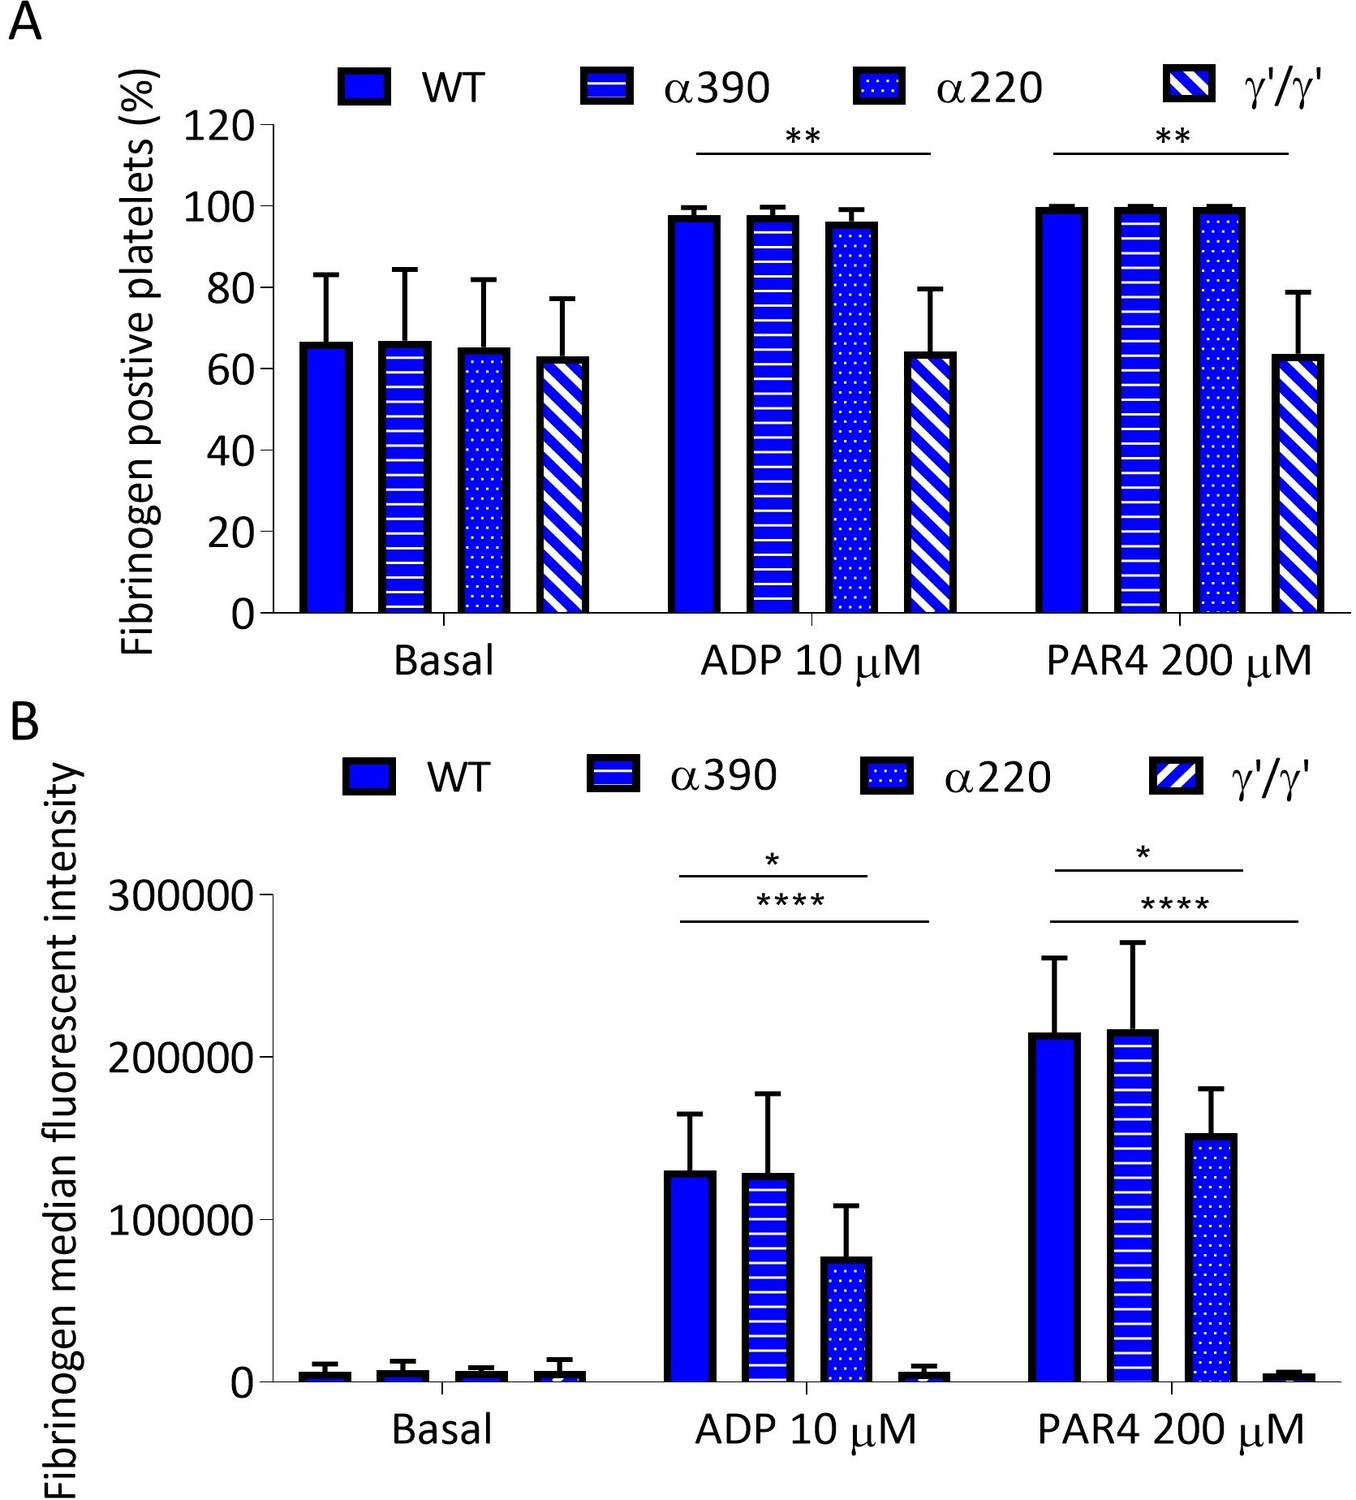
Recombinant fibrinogen is able to bind to platelets.
(A) Percentage of fibrinogen-positive platelets measured by flow cytometry in whole blood from Fga-/- mice supplemented with truncated, WT, or γ′γ′ fibrinogens. Positivity was unchanged for α390 and α220, but significantly reduced in γ′γ′, compared to WT in activated platelets. Basal platelet positivity was unchanged across all fibrinogen variants. (B) Fibrinogen median fluorescence intensity (MFI) per platelet was significantly decreased for α220 and γ′γ′, but not for α390, compared to WT, in activated platelets. Basal platelet MFI was unchanged across all fibrinogen variants. Results shown as mean ± SD, n = 3, *p<0.05, **p<0.01, ****p<0.0001 by two-way ANOVA with Dunnett’s multiple comparison test relative to WT for each agonist.
Figure 6 with 1 supplement
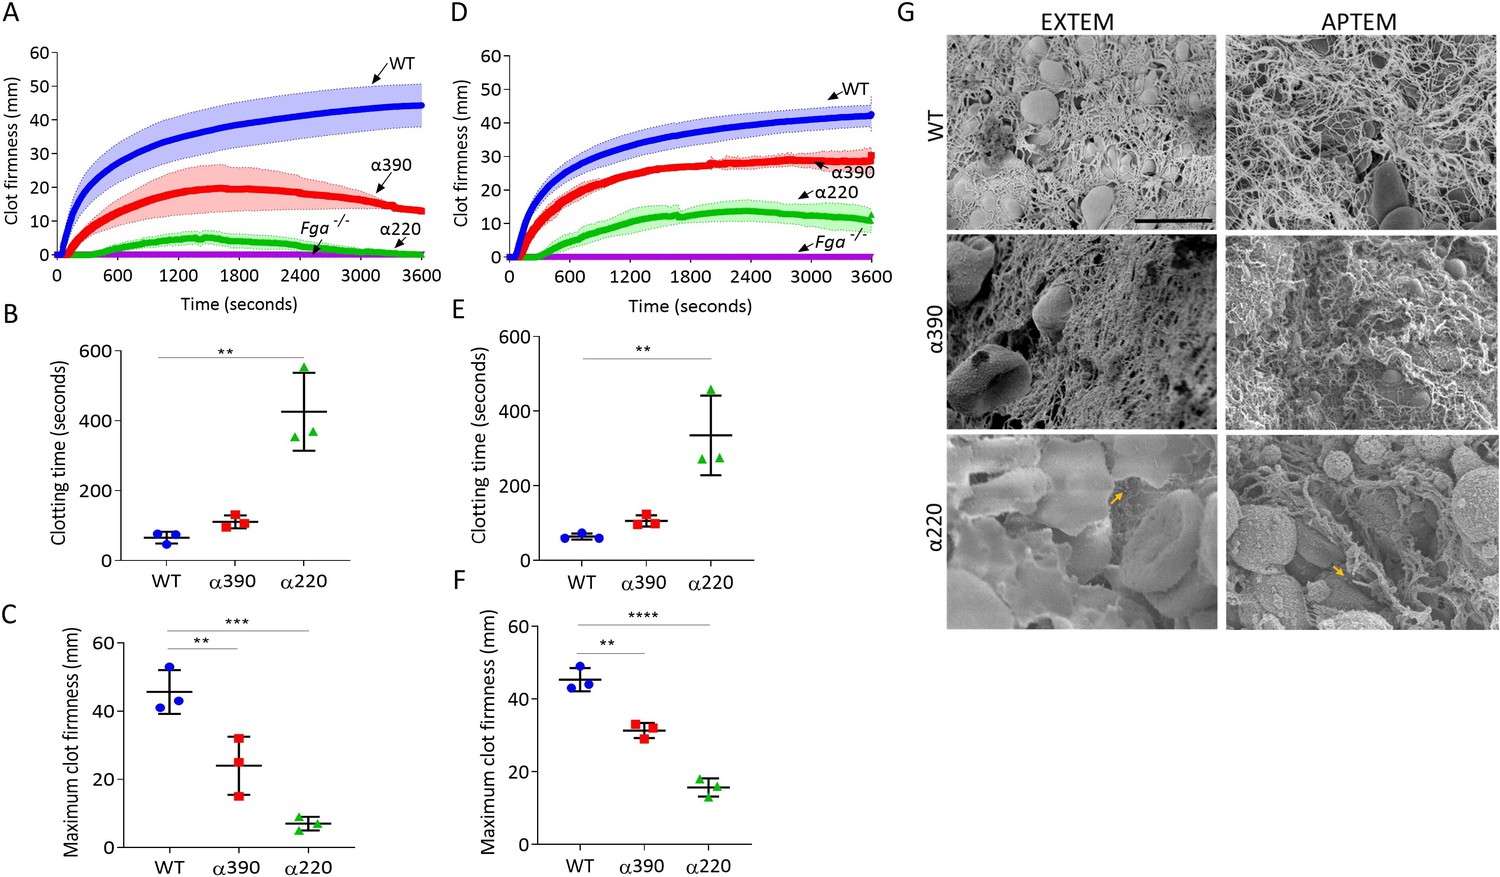
Fibrinolysis is the crucial factor for clot instability.
Whole blood clots were prepared with whole blood from Fga-/- mice supplemented with either truncated or WT fibrinogens. (A) Whole blood clot formation curves from ROTEM, with clotting activated by tissue factor (EXTEM), showing clot firmness over time. (B) Clotting time was significantly increased for α220, but not α390, compared to WT. (C) Maximum clot firmness was significantly decreased for α390, and even further for α220, compared to WT. (D) Whole blood clot formation curves from ROTEM, with clotting activated by tissue factor and aprotinin to inhibit fibrinolysis (APTEM), showing clot firmness over time. (E) Clotting time was significantly increased for α220, but not α390, compared to WT. (F) Maximum clot firmness was significantly decreased for α390, and even further for α220, compared to WT. (G) Representative scanning electron microscopy images of clots collected and fixed after ROTEM analysis. Images taken on a SU8230 Ultra-High-Resolution Scanning Electron Microscope (Hitachi, Tokyo, Japan). Yellow arrow indicates fibrin, scale bar 5 µm. Results shown as mean ± SD, n = 3, *p<0.05, **p<0.01, ***p<0.001, ****p<0.0001 by one-way ANOVA with Dunnett’s multiple comparison test (B, C, F) and Kruskal–Wallis test with Dunn’s multiple comparison test (E) relative to the WT.
-
Figure 6—source data 1
ROTEM firmness values (Figure 6A and D) and values generated by ROTEM for Figure 6B, C, E, and F.
- https://cdn.elifesciences.org/articles/68761/elife-68761-fig6-data1-v4.xlsx
Figure 6—figure supplement 1
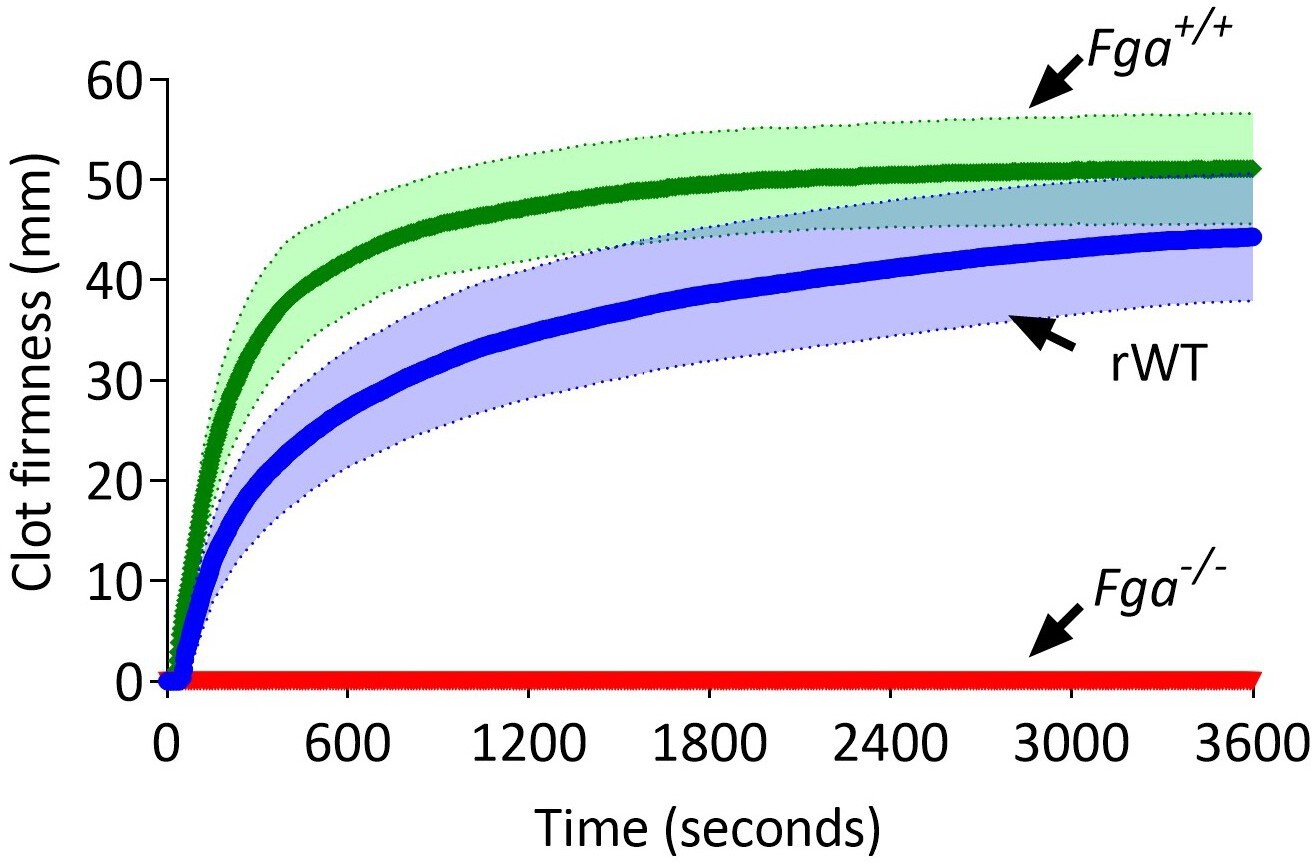
Comparison of ROTEM (EXTEM) profiles of C57BL/6 (Fga+/+), Fga-/-, and Fga-/- supplemented with 0.5 mg/mL recombinant WT (rWT).
No clot formation is observed in whole blood from the Fga-/- mice. Once supplemented with rWT, clot formation occurs and shows a similar profile to whole blood from a C57BL/6 (Fga+/+) mice.
Tables
Key resources table
| Reagent type (species) or resource | Designation | Source or reference | Identifiers | Additional information |
|---|---|---|---|---|
| Genetic reagent (Mus musculus) | Fga-/- | Kind gift from Dr Jay Degen, Cincinnati Children’s Hospital Medical Centre | PMID:7649481 | |
| Genetic reagent (M. musculus) | Fga+/- | Kind gift from Dr Jay Degen, Cincinnati Children’s Hospital Medical Centre | PMID:7649481 | |
| Cell line (Cricetulus griseus) | CHO-αβγ | Kind gift from Dr Susan Lord, University of North Carolina | Expressing WT human fibrinogen | PMID:8418831 |
| cell line (C. griseus) | CHO-βγ | Kind gift from Dr Susan Lord, University of North Carolina | Expressing β- and γ-chain of human fibrinogen | PMID:8418831 |
| Cell line (C. griseus) | CHO-αβ | Kind gift from Dr Susan Lord, University of North Carolina | Expressing α- and β-chain of human fibrinogen | PMID:8418831 |
| Transfected construct(human) | pMLPAα | Kind gift from Dr Susan Lord, University of North Carolina | PMID:8418831 | |
| Transfected construct(human) | pMLPAα390 | This paper | Ariëns Lab | |
| Transfected construct(human) | pMLPAα220 | This paper | Ariëns Lab | |
| Biological sample (human) | Human plasminogen-depleted plasma-purified fibrinogen | Merck | 341578 | |
| Biological sample (human) | Glu-plasminogen | Enzyme Research Laboratories | HPG 2001 | |
| Biological sample (human) | FXIII | Zedira | T007 | |
| Biological sample (human) | Tissue factor(PPP reagent) | Stago | 86193 | |
| Biological sample (human) | Thrombin | Merck | 605190 | |
| Antibody | CD41 Alexa Fluor 700 (anti-mouse monoclonal) (MWReg30) | BioLegend | 133925 | (5 µg/mL) |
| Antibody | CD62P PE (anti-mouse monoclonal) (RMO-1) | BioLegend | 148305 | (10 µg/mL) |
| Antibody | CD63 APC (anti-mouse monoclonal) (NVG-2) | BioLegend | 143905 | (5 µg/mL) |
| Antibody | IgG2a PE (monoclonal Mouse)(MOPC-173) | BioLegend | 400211 | (10 µg/mL) |
| Antibody | IgG2a APC (monoclonal Rat) (RTK 2758) | BioLegend | 400511 | (5 µg/mL) |
| Antibody | FITC fibrinogen (anti-human polyclonal) | Agilent Technologies | F0111 | (60 µg/mL) |
| Peptide, recombinant protein (human) | WT | This paper | Purified from CHO cells, WT fibrinogen, Ariëns Lab | |
| Peptide, recombinant protein (human) | α390 | This paper | Purified from CHO cells, fibrinogen with α-chain truncated at α390, Ariëns Lab | |
| Peptide, recombinant protein (human) | α220 | This paper | Purified from CHO cells, fibrinogen with α-chain truncated at α220, Ariëns Lab | |
| Peptide, recombinant protein (human) | γ′/γ′ | This paper | Purified from CHO cells, fibrinogen homozygous in γ′-chain, Ariëns Lab | |
| Peptide, recombinant protein (human) | t-PA | Pathway Diagnostics | TC41072 | |
| Chemical compound, drug | PAR4 | Cambridge BioScience | ANA60218-5 | |
| Commercial assay or kit | Alexa Fluor 488 using a protein labelling kit | Thermo Fisher Scientific | A10235 | |
| Commercial assay or kit | QuikChange II Site-Directed Mutagenesis Kit | Agilent Technologies | 200524 | |
| Software, algorithm | ImageJ software | ImageJ (http://imagej.nih.gov/ij/) | RRID:SCR_003070 | |
| Software, algorithm | GraphPad Prism | GraphPad Prism (https://graphpad.com) | RRID:SCR_015807 | Version 8 |
| Software, algorithm | MATLAB | MathWorks (http://mathorks.com) | RRID:SCR_001622 | |
| Software, algorithm | OriginLab | OriginLab (http://originlab.com) | RRID:SCR_014212 | |
| Other | Dynabeads M-450 Epoxy | Invitrogen | 14011 |
Additional files
Download links
A two-part list of links to download the article, or parts of the article, in various formats.
Downloads (link to download the article as PDF)
Open citations (links to open the citations from this article in various online reference manager services)
Cite this article (links to download the citations from this article in formats compatible with various reference manager tools)
Fibrinogen αC-subregions critically contribute blood clot fibre growth, mechanical stability, and resistance to fibrinolysis
eLife 10:e68761.
https://doi.org/10.7554/eLife.68761


